Article

Harvesting Regimes Affect Brown Midrib Sorghum-Sudangrass and Brown Midrib Pearl Millet Forage Production and Quality

by
Joshua A. Machicek
1,
Brock C. Blaser
1,*,
Murali Darapuneni
2 and
Marty B. Rhoades
1
1
Department of Agricultural Sciences, West Texas A&M University, 2501 4th Ave, Canyon, TX 79016, USA
2
Agricultural Science Center at Tucumcari, New Mexico State University, Tucumcari, NM 88401, USA
*
Author to whom correspondence should be addressed.
Submission received: 30 June 2019 / Revised: 26 July 2019 / Accepted: 27 July 2019 / Published: 30 July 2019
(This article belongs to the Special Issue Sustainable Cropping Systems)

Abstract

:
As water levels in the Ogallala Aquifer continue to decline in the Texas High Plains, alternative forage crops that utilize less water must be identified to meet the forage demand of the livestock industry in this region. A two-year (2016 and 2017) study was conducted at West Texas A&M University Nance Ranch near Canyon, TX to evaluate the forage production and quality of brown midrib (BMR) sorghum-sudangrass (SS) (Sorghum bicolor (L.) Moench ssp. Drummondii) and BMR pearl millet (PM) (Pennisetum glaucum (L.) Leeke)) harvested under three regimes (three 30-d, two 45-d, and one 90-d harvests). Sorghum-sudangrass consistently out yielded PM in total DM production in both tested years (yield range 3.96 to 6.28 Mg DM ha−1 vs. 5.38 to 11.19 Mg DM ha−1 in 2016 and 6.00 to 9.87 Mg DM ha−1 vs. 6.53 to 15.51 Mg DM ha−1 in 2017). Water use efficiency was higher in PM compared to SS. The 90-d harvesting regime maximized the water use efficiency and DM production compared to other regimes in both crops; however, some forage quality may be sacrificed. In general, the higher forage quality was achieved in shorter interval harvesting regimes (frequent cuttings). The selection of suitable forage crop and harvesting regime based on this research can be extremely beneficial to the producers of Texas High Plains to meet their individual forage needs and demand.

1. Introduction

Alternative forage crops that utilize less water must be identified to meet the demands of the livestock industry in the Texas High Plains as water levels in the Ogallala Aquifer continue to decline [1,2,3]. Forage sorghums, including BMR SS, are widely utilized in the High Plains region because of their relative drought and heat tolerance [4,5]. These forage types have potential to produce large amounts of nutritious forage during summer months while the versatility of the crop allows for incorporation into many different types of cropping or livestock operations [6]. However, less is known about PM production in the region and the potential of the crop to meet some of these forage needs.
Pearl millet is one of the low-input crops primarily grown in semi-arid regions of Africa and southeast Asia [7]. This crop is grown in the southeastern US primarily for grain purposes ([7], although there were some attempts to highlight the forage purpose of PM [8,9]. Similar to sorghum, PM is also a drought and heat tolerant crop that survives well under limited rainfed conditions [10]. Regrowth of PM is affected by stubble height, cutting frequency, and stage of harvest [11]. Unlike many sorghums, PM contains no prussic acid [11,12]. Both species have varieties that contain the BMR trait; therefore, they have reduced lignin to increase forage quality and give producers more flexibility in harvest scheduling [13].
Therefore, PM may have a potential to be as productive as forage sorghums and provide the same quality. Cutting height and yield attributes of PM and SS have been evaluated in Kansas and New Mexico, but not in the Texas High Plains [6,9,11]. However, additional information is necessary to identify the ideal cutting intervals to optimize yield and quality for SS and PM. Such knowledge will help increase the production of these crops and provide more management versatility to producers as they seek to meet the forage demands of the livestock industry in the region. The objectives of this study were to (i) evaluate SS and PM forage production and regrowth patterns under three different harvest intervals, and (ii) evaluate the effects of harvest interval on feed nutritive components and value.

2. Materials and Methods

2.1. Study Site, Experimental Design, and Crop Management

This study was conducted during the 2016 and 2017 growing seasons at the West Texas A&M University Nance Ranch near Canyon (34°58′6″ N, 101°47′16″ W; 1097 m above sea level). The experiments were conducted on Olton clay loam soil (fine, mixed, superactive, thermic, Aridic Paleustoll). The plots were prepared for planting with two passes of a tandem disk followed by one pass with a rotary tiller. ‘Bodacious’ BMR sorghum-sudangrass (7272 seeds kg−1, 85% germination, 98% purity) and ‘Graze King’ BMR pearl millet (176,211 seeds kg−1, 85% germination, 98% purity) were planted at 75 and 85 seeds m−2, respectively, on 17 June 2016 using a tractor mounted 150 cm wide Great Plains 3P500 grain drill (Great Plains Manufacturing, Salina, KS) with 19-cm row widths. In 2017, a PM seed lot (116,280 seeds kg−1, 85% germination, 98% purity) was acquired from Winfield United. On 31 May 2017, both species were planted at 85 seeds m−2. Main plot size was 24.4 by 18.2 m. The planted area for each subplot was 3 by 6.1 m in both years. The experimental design was a nested split plot with crop species being main plot and harvesting regime being sub-plot. The treatments were replicated four times.
The crops were irrigated with a flow metered, surface drip line system with two lines 150 cm apart and drip line emitters every 60 cm. The emitters applied 7.5 L h−1 and 25 mm of water was applied weekly for 10 weeks. Soil samples prior to planting were analyzed for a forage sorghum yield goal of 25 Mg ha−1. Phosphorus and potassium levels were found to be sufficient, but nitrogen (N) was required. Urea N fertilizer was broadcast applied based on soil sampling recommendations on 12 July 2016 and 7 July 2017 at 84 kg N ha−1 and 78 kg N ha−1, respectively.

2.2. Forage Management and Physiology Measurements

Forage DM was sampled in three harvest regimes: three 30-d, two 45-d and one 90-d harvest. Samples were cut at 15 cm cutting height within a one m quadrat. Two samples were taken per subplot and the dry weights were averaged. Ratoon harvests were taken from the same sampled area each time. Samples were oven dried at 60 °C for 120 h.
Leaf area index (LAI) was determined every 14 d and after each harvest beginning on 12 July 2016 and 21 June 2017, using Li-Cor 2200 plant canopy analyzer (Li-Cor Incorporated, Lincoln, NE, USA). Two LAI measurements were obtained in each plot. A LAI measurement was defined as one above canopy (incident) reading and four below canopy readings. The four below canopy readings were taken across three rows and averaged for one LAI value. Measurements were collected under low light at sunrise, sunset, or overcast conditions.
Photosynthetically active radiation (PAR) interception by the crop canopy was determined every 7 d beginning on 6 July 2016 and 21 June 2017 using AccuPAR Linear PAR Ceptometer, Model PAR-80 light measuring instrument (Decagon Devices, Pullman, WA, USA). Measurements were obtained by placing the ceptometer diagonally across three rows. Measurements were collected under full sunlight between 11:00 and 14:00 Percent light interception was calculated by dividing the average of two below canopy PAR readings by one above canopy reading and multiplying by 100.

2.3. Forage Analysis

Forage analysis samples were taken from aboveground biomass samples, ground with a wood chipper and sent to Servi-Tech Laboratories in Amarillo, TX. Samples were ground through a Wiley mill (Arthur H. Thomas Co., Philadelphia, PA, USA) to pass a 1-mm screen. Crude protein (CP), acid detergent fiber (ADF), neutral detergent fiber (NDF), total digestible nutrients (TDN), and relative feed value (RFV) were measured or calculated.
Crude protein was measured using the combustion method, an AOAC Official Method 990.03 [14]. The ADF analysis was measured using Ankom technology method 5 [15]. This method is a modification of AOAC Official Method 973.18. The NDF analysis was performed with Ankom technology method 6, a modification of AOAC Official Method 2002.04 [16]. Total digestible nutrients was calculated using the formula: TDN = (NFC × 0.98) + (CP × 0.87) + (FA × 0.97 × 2.25) + (NDFn × NDFD/100) − 10. Where NFC = non-fibrous carbohydrate, FA = fatty acid, NDFn = nitrogen free NDF and NDFD = in vitro NDF digestibility.
The RFV is a calculation of digestible dry matter (DDM) and dry matter intake (DMI) and a constant. The RFV was calculated using the formula: RFV = (DDM × DMI)/1.29. The DDM was calculated using the formula: DDM = 88.9 − (0.779 × %ADF). The DMI was calculated by using the formula: DMI = 120/%NDF.

2.4. Water Use Efficiency

Water use efficiency (WUE) measurements were taken in the 2017 growing season only. Plant available soil water (PAW) at planting was taken in adjacent plots less than 50 m away from four random sites to a depth of 75 cm using a tractor mounted Giddings hydraulic press (Giddings Machine Company Inc., Windsor, CO). One core sample per plot, divided into three depth sectors: 0–15, 15–45, and 45–75 cm, was taken at end-of-season harvest to determine PAW, weighed, then oven dried at 104 °C for 72 h. The PAW was found using the equation: PAW = [(volumetric water − permanent wilting point)/100) × depth in cm of the measured soil profile]. The WUE was calculated using the following formula: WUE = DM/[(PAW planting + total rainfall + total irrigation) − PAW harvest].

2.5. Weather Data

Weather conditions during the study in 2016 and climatic data were obtained from the National Weather Service station for Canyon, TX approximately 7 km from the research site. In 2017, daily maximum and minimum air temperature and rainfall were recorded from a weather station (Campbell Scientific, Logan, UT, USA) located 100 m from the experimental site (Table 1). Canyon, TX has a mean annual rainfall of 474 mm. Growing degree days (GDD) were calculated beginning June 2016 and May 2017 of each season using the formula: GDD = Σ {[(daily max. temp. + daily min. temp.)/2] − base temp.} with base temperature = 10 °C, and maximum temperature = 34 °C [17,18].

2.6. Statistical Design and Analysis

Statistical analysis was performed using the PROC MIXED model in Statistical Analysis System Version 9.4 (SAS Institute, Cary, NC, USA, 2017). The test years and replications were treated as random and appropriate error term was used as denominator to determine the F-test significance. Homogeneity of variance test was used to determine the appropriateness of combined test or ‘by year’ analysis. Based on this test, a separate analysis by year was carried out. The separate analysis was also justified by different weather and crop-growing conditions existed in the two tested years. When F-test for the treatment was significant, a LSD/PDIFF (α = 0.05) was used to test significant differences between treatment means unless otherwise noted.

3. Results and Discussion

3.1. Weather Conditions

The 2016 growing conditions were unfavorable due to warmer temperatures in June and July and cooler temperatures, 6.9 and 6.1 °C below the average in August and September (Table 1). For the month of June, in 2016, only 35% of the 30-year average rainfall accumulated. However, in 2017 growing conditions were similar to the 30-year average. June through September averaged 145% more precipitation than the 30-year average. In 2016, both crops accumulated 134 GDDs before the crops emerged, although in 2017, 161 GDDs were accumulated. The 2016 growing season accumulated 1461 GDDs while in the 2017 growing season, 1377 GDDs were accumulated.

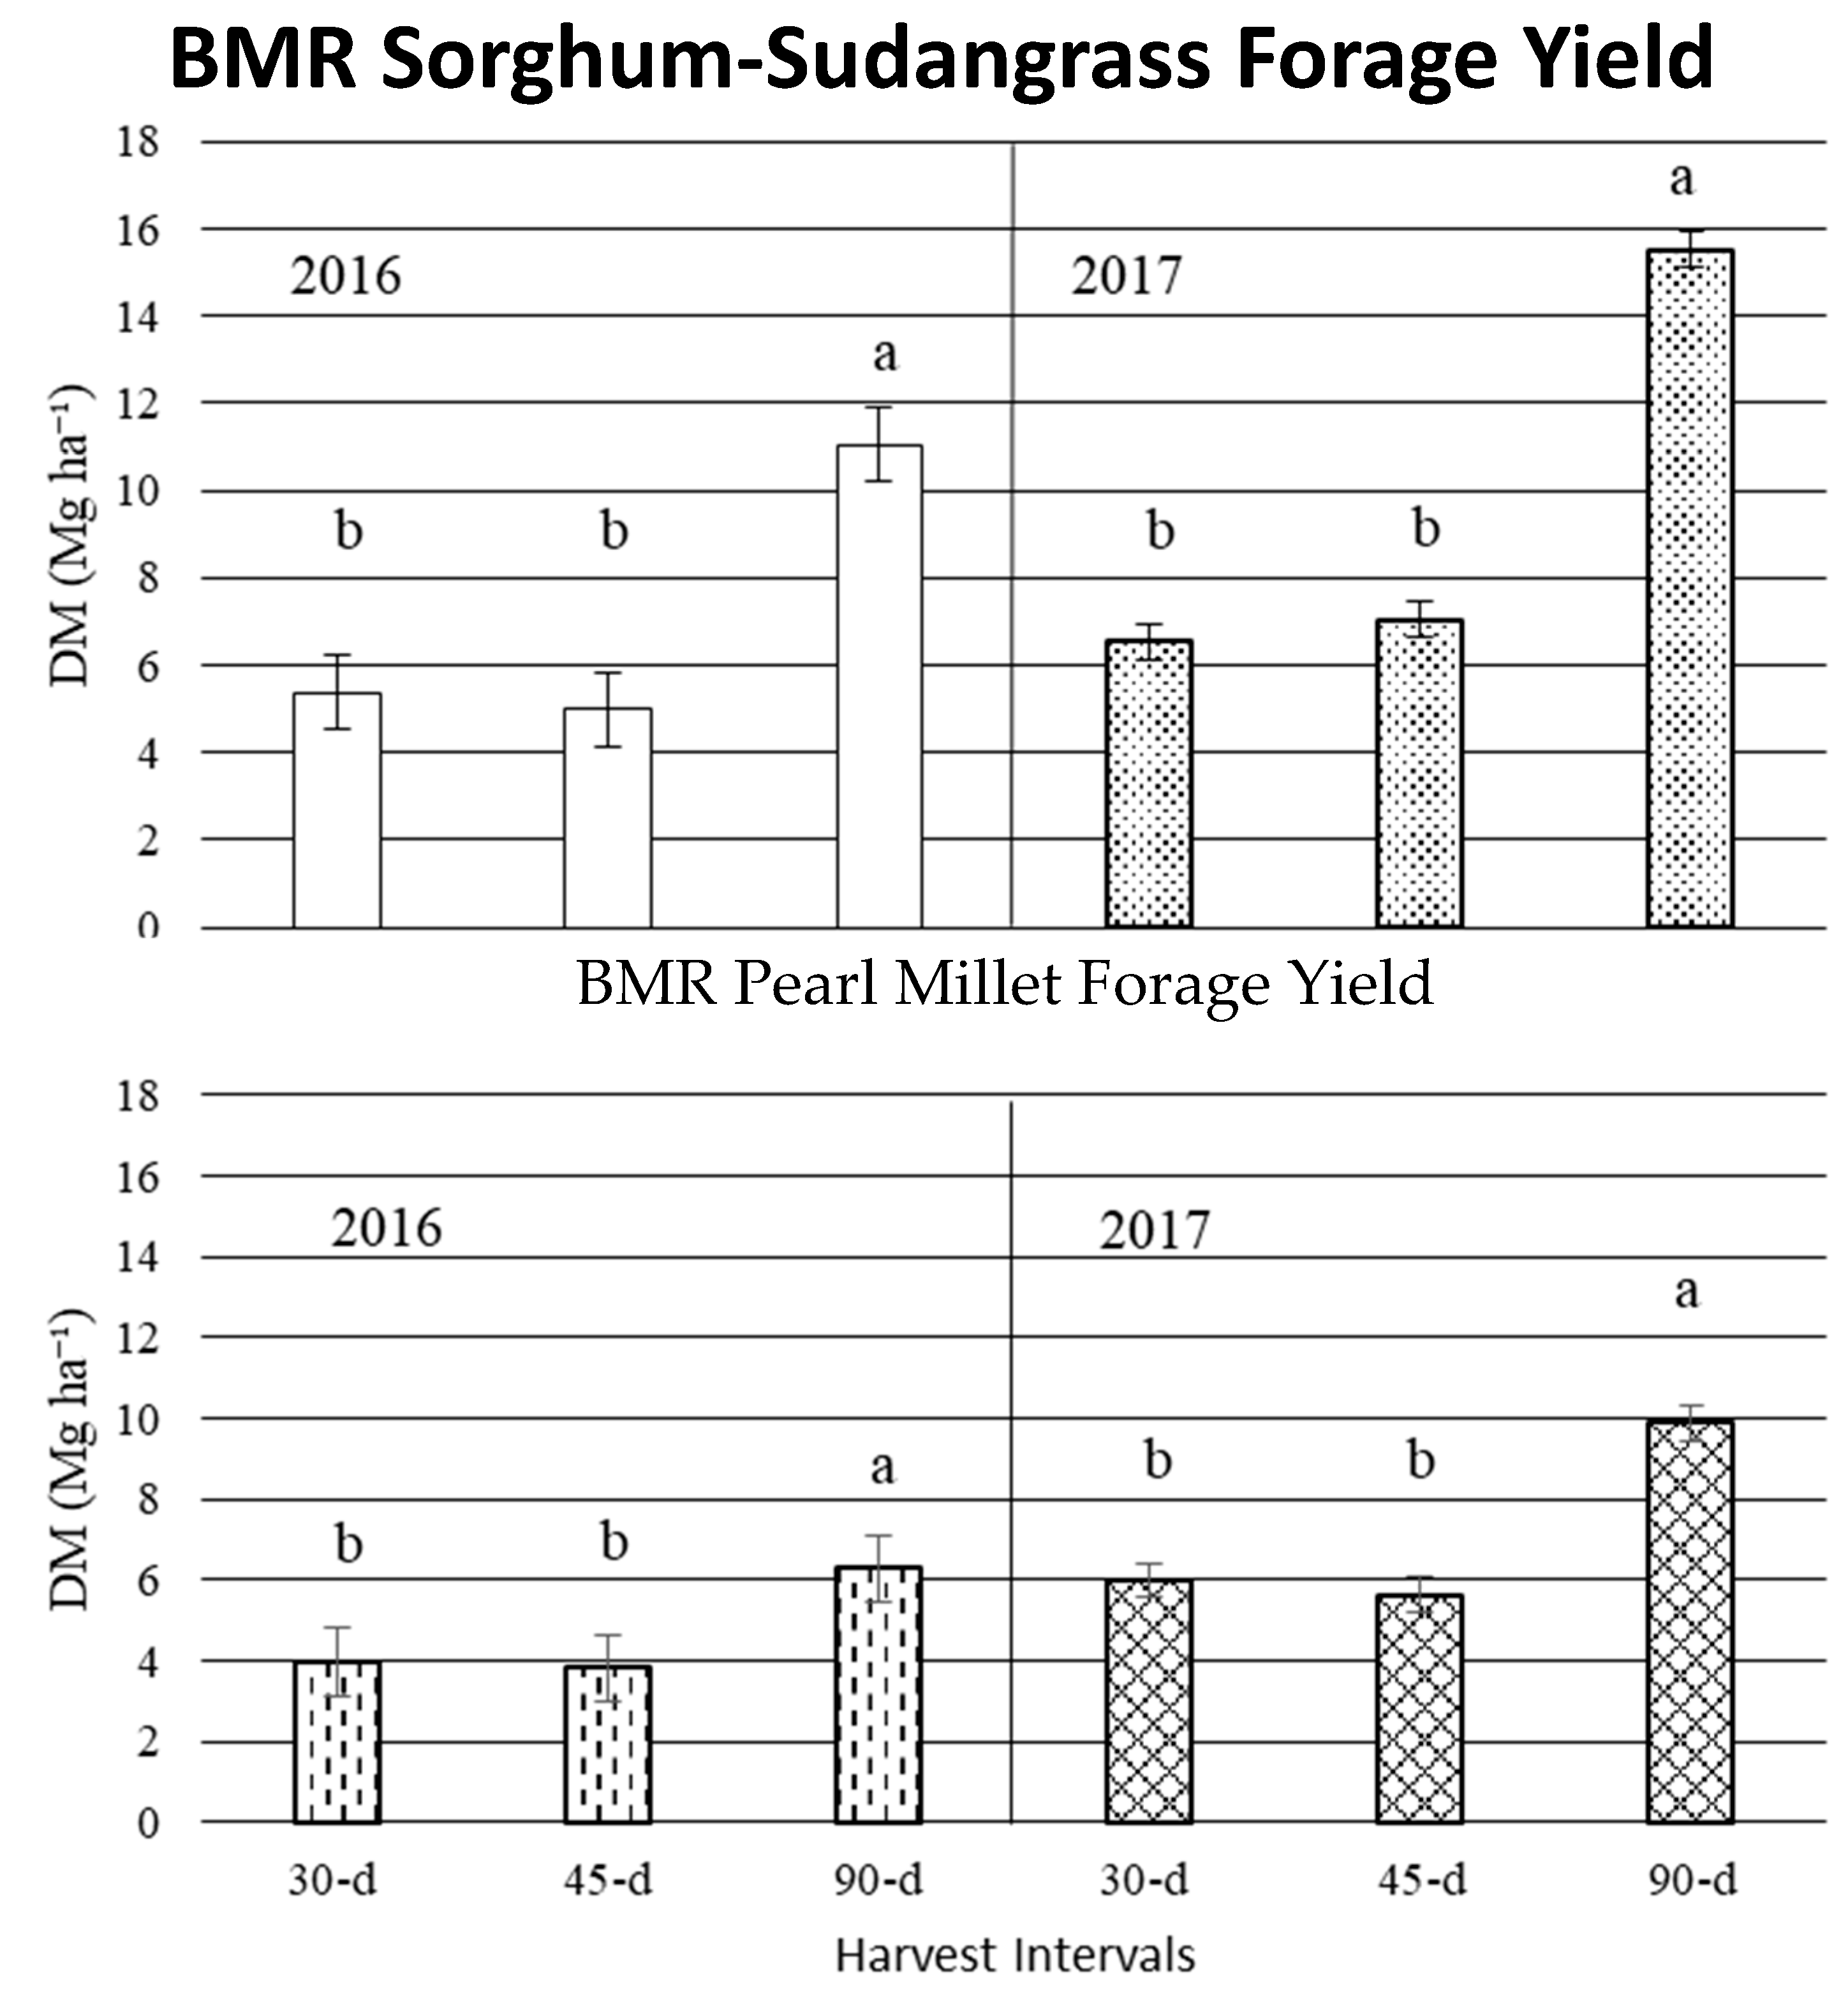
3.2. Forage Production

The maximum amount of forage was produced in the 90-d harvest interval with 11.05 and 15.51 Mg DM ha−1 in SS and 6.29 and 9.87 Mg DM ha−1 in PM in 2016 and 2017, respectively (Figure 1, Table 2). When total DM harvest intervals were averaged, PM only produced 70% of the total SS DM. These results were contrary to the results reported by Bishnoi [8], where they reported that PM produced 1.5 to 2 times the amount of forage compared to SS and forage sorghum. In 2016, the SS yields for the 30-d and 45-d harvests ranged from 48–45% of the 90-d harvest. While in 2017, 30-d and 45-d harvest yields ranged from 42–45% of the 90-d harvest.
In 2016, PM yields for the 30-d and 45-d harvests ranged from 63–60% of the 90-d harvests (Table 2). While in 2017, 30-d and 45-d harvests ranged from 60–57% of the 90-d PM yields. This is contrary to Stephenson [11] that found PM to produce 83% of total DM when comparing a three cut system to a two cut system when harvested at the boot stage.
In SS, 45-d harvest ratoon cut responded differently in both years (Table 2). There was no difference between the first harvest and the ratoon harvest in the first year, while in 2017, more forage was produced in the first harvest. This can be attributed to above average rainfall received in June and July of 2017. In 2016, the ratoon cut made up 47% while in 2017, the ratoon cut made up only 35% of the total DM yield. This is higher when compared to the results reported in Maughan [19], where they reported that the ratoon cut yielded 29% of the total DM produced. However, the current study results are similar to the results reported by Duncan [20], where they reported the ratoon efficiency ranged between 35 and 45%.
In both years, the PM 30-d harvest intervals responded similarly with 13–15% of the total DM yielding from the first cut and 64–67% produced from the second cut (Table 2). This differs from Stephenson [11] that found 33% of the total forage DM yielding from the first cut while the second cut yielded 44% of the total forage DM. However, the third cut responded similarly to Stephenson [11] with 23% of the total DM. Therefore, most of the growth in the current study was produced between 30 and 60 days.

3.3. Forage Quality

In the 30-d interval, when averaged across harvests, the SS CP content was 10.2 and 10% in 2016 and 2017 growing seasons, respectively (Table 2). This is similar to the results reported by Sanderson [21] with an average CP content of 10.9%. Crude protein did not differ significantly among three harvests in 2016. These results are slightly higher than the findings by El-Latif [22] that reported decreasing CP at each cut, 9.0, 7.8, and 7.5% CP for first, second, and third harvests, respectively. However, the 2017 CP results were consistent with the results of El-Latif [22], showing gradual decrease in CP content from first to third harvest. Sanderson [21] also reported an ADF content of 36.5% when harvests were averaged together. Their findings were similar to the current study, where SS ADF was 35.8 and 38%, when averaged across the three harvest intervals, in 2016 and 2017, respectively. In 2016, the ADF content in SS at third harvest was higher than first two harvests; whereas the NDF and TDN values were decreased gradually from first to third harvests. The 2017 results for ADF were slightly differed from 2016 results that showed higher ADF for second harvest.
In both years, the PM 30-d harvest interval %CP decreased with each harvest (Table 2). When averaged across the three harvests, the CP was 10.8% compared to 17.1% reported by Rostamza [23]. In 2016, both ADF and NDF increased with each harvest; however, only ADF increased in 2017 while NDF declined. This is contrary to Rostamza [23] that found as water is limited, ADF increases. Rostamza [23] reported TDN decreases as available water decreases; however, in this study, rainfall was less in 2016 but produced a TDN that was five percentage points higher than the TDN in 2017 when averaged across harvests. At the third harvest, in 2016, RFV declined but in 2017, RFV increased from the second harvest.
Sorghum-sudangrass, in the 45-d harvest, had higher CP and RFV in the ratoon cut but lower TDN (Table 2). However, in 2017, a higher CP was found in the first harvest. In the 90-d harvest, only the DM differed in both years between crops except for NDF in 2017. This study reported slightly better CP than Nasiyev [24] that reported 3.6, 2.4, and 3.0% CP in course millet, sorghum, and sudangrass, respectively.
In the 45-d harvest, PM had higher CP and TDN in the first harvest compared to the ratoon harvest (Table 2). However, only in 2016, the first harvest had a higher RFV. This study reported slightly lower NDF when compared to Cherney [25] that found BMR PM to contain 67.7 and 62.3% NDF in the first and second harvest, respectively. On the contrary, Cherney [25] reported lower ADF% in the first and second cut of 34.5 and 31.4%, respectively. Crude protein content conveyed by Cherney [25] is similar to 2016. The 2016 CP for each cut is 14.8 and 12.0% compared to 14.6 and 12.3% CP reported by Cherney [25] for the first and second harvest, respectively. The CP of the first and second harvest in 2017 were 2:1 and fifty percent lower than values reported by Cherney [25], respectively.
As both crops advanced in maturity, an overall decline in forage quality can be noted. This is attributed to a decline in the leaf:stem ratio in both crops (data not shown). When the leaf:stem ratio degenerates, more mass is allocated in the stem; thus, more lignin is produced and the forage quality is reduced.

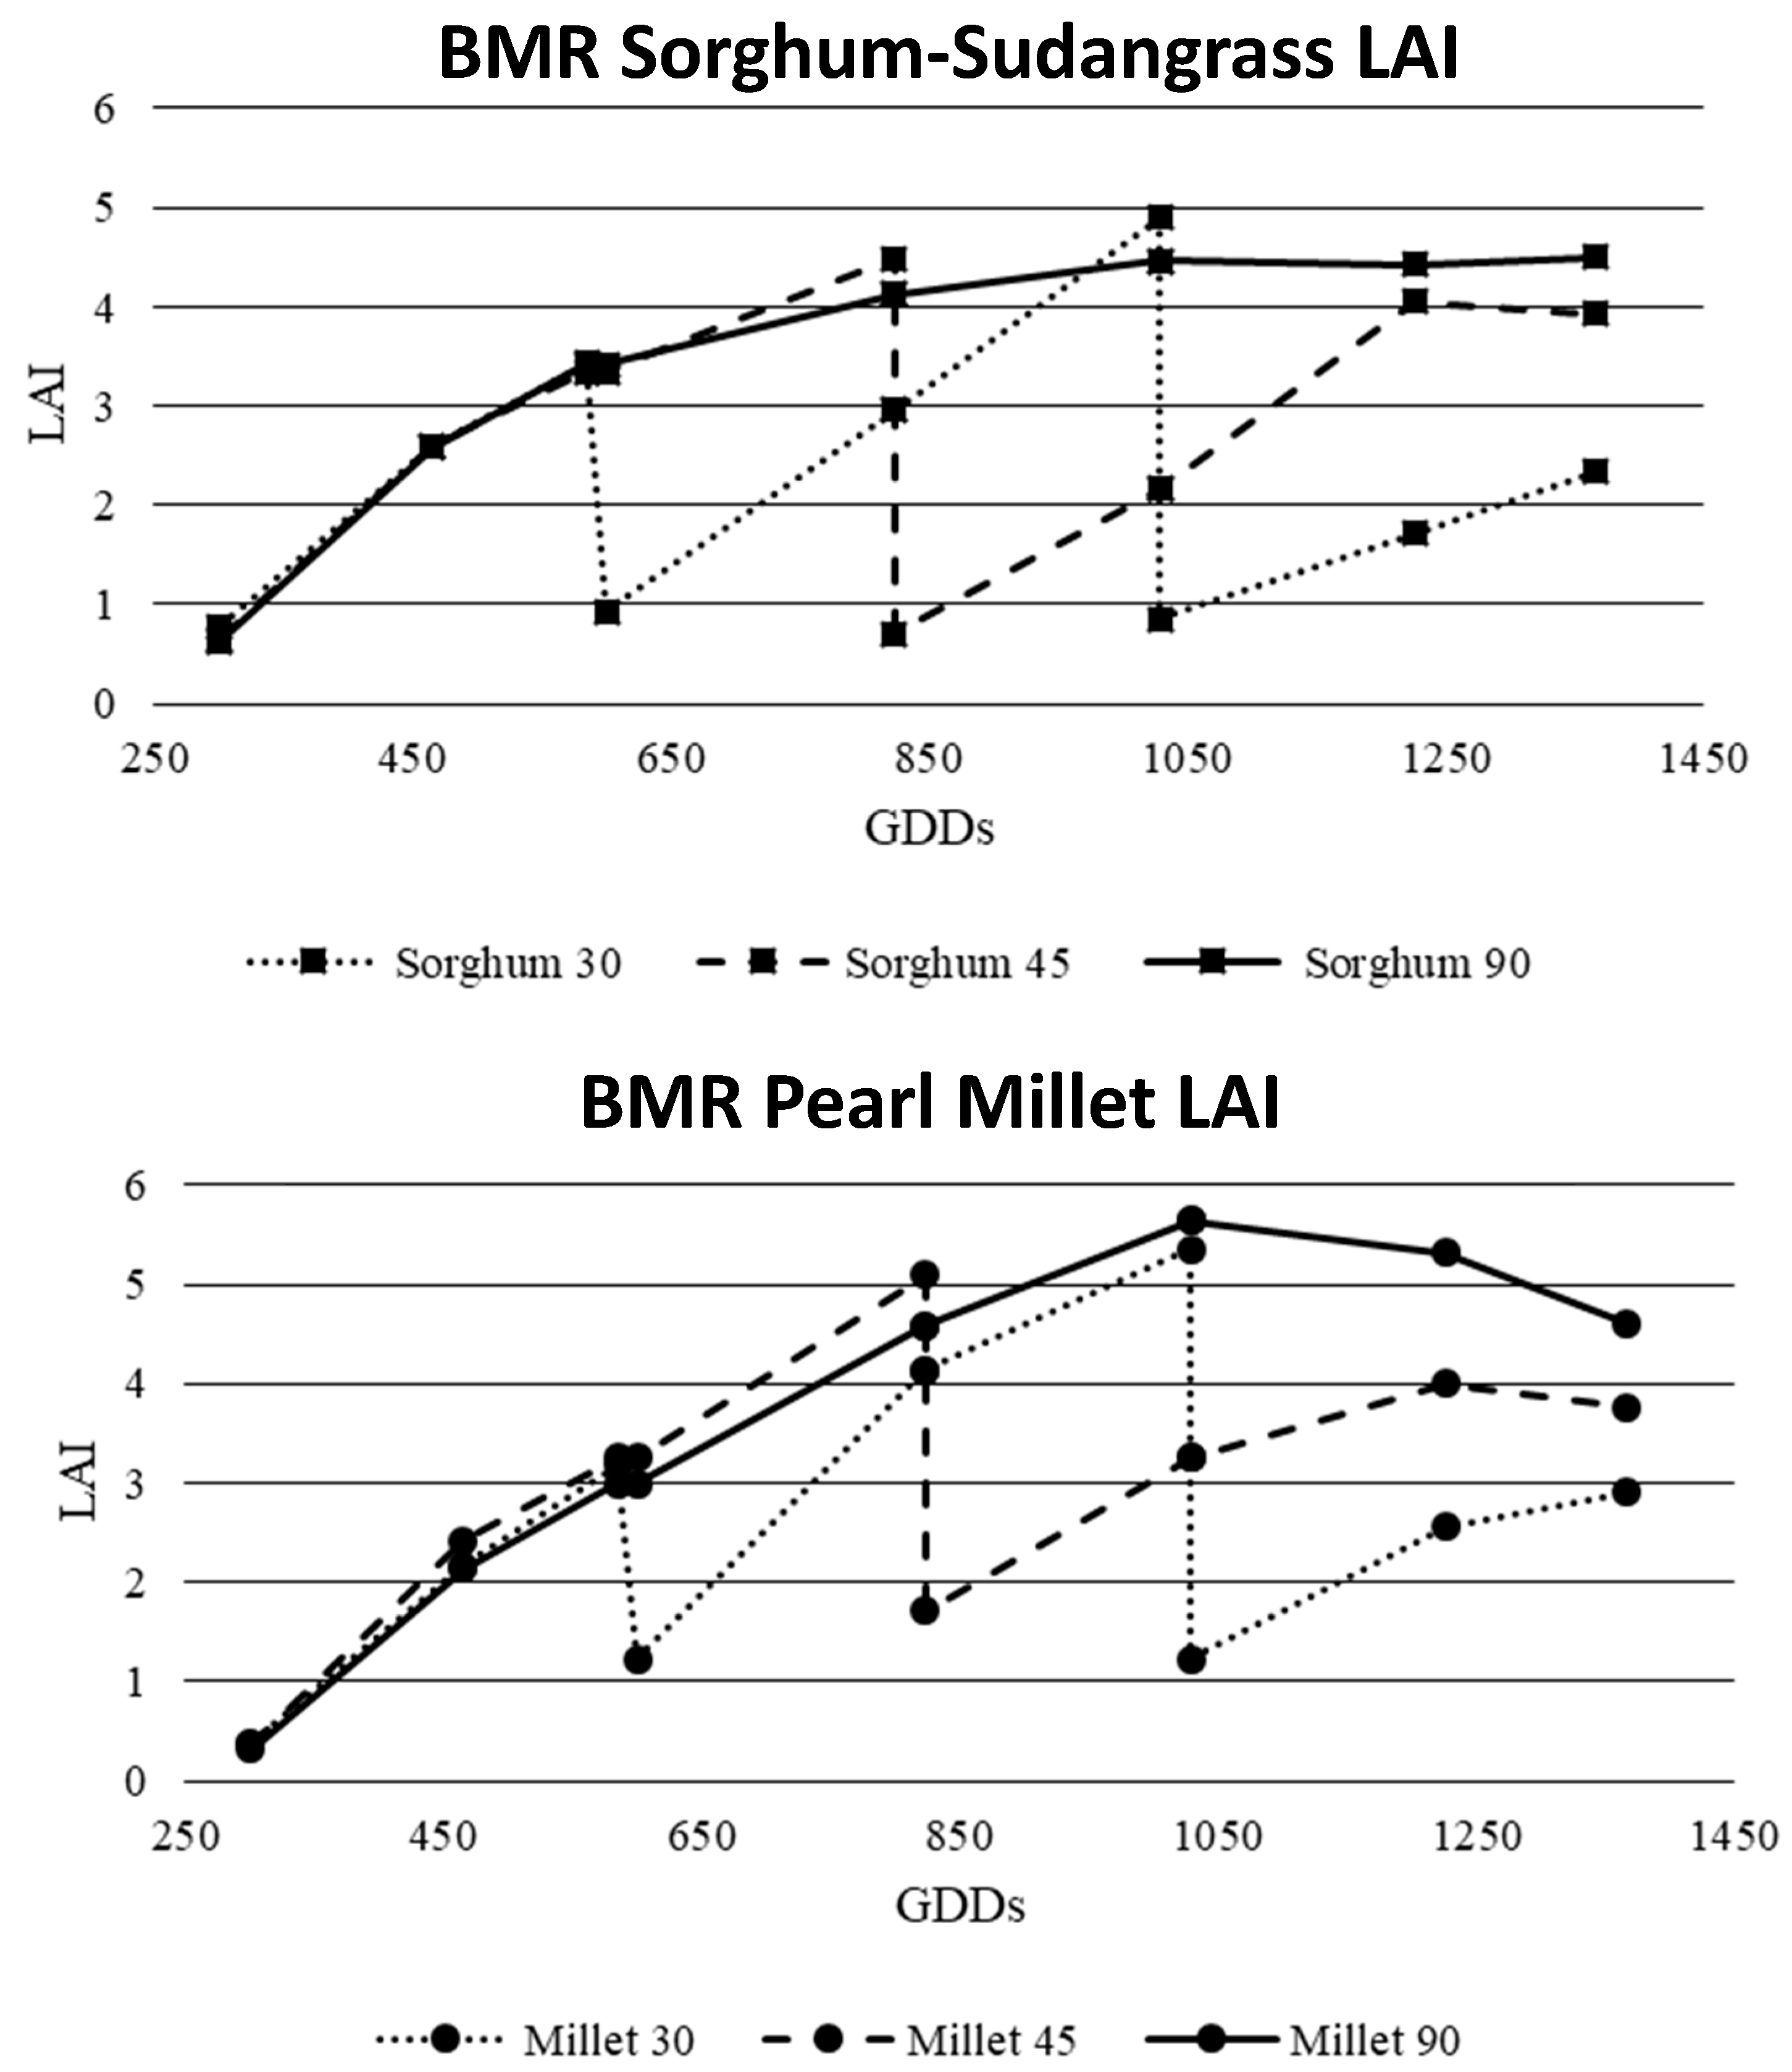
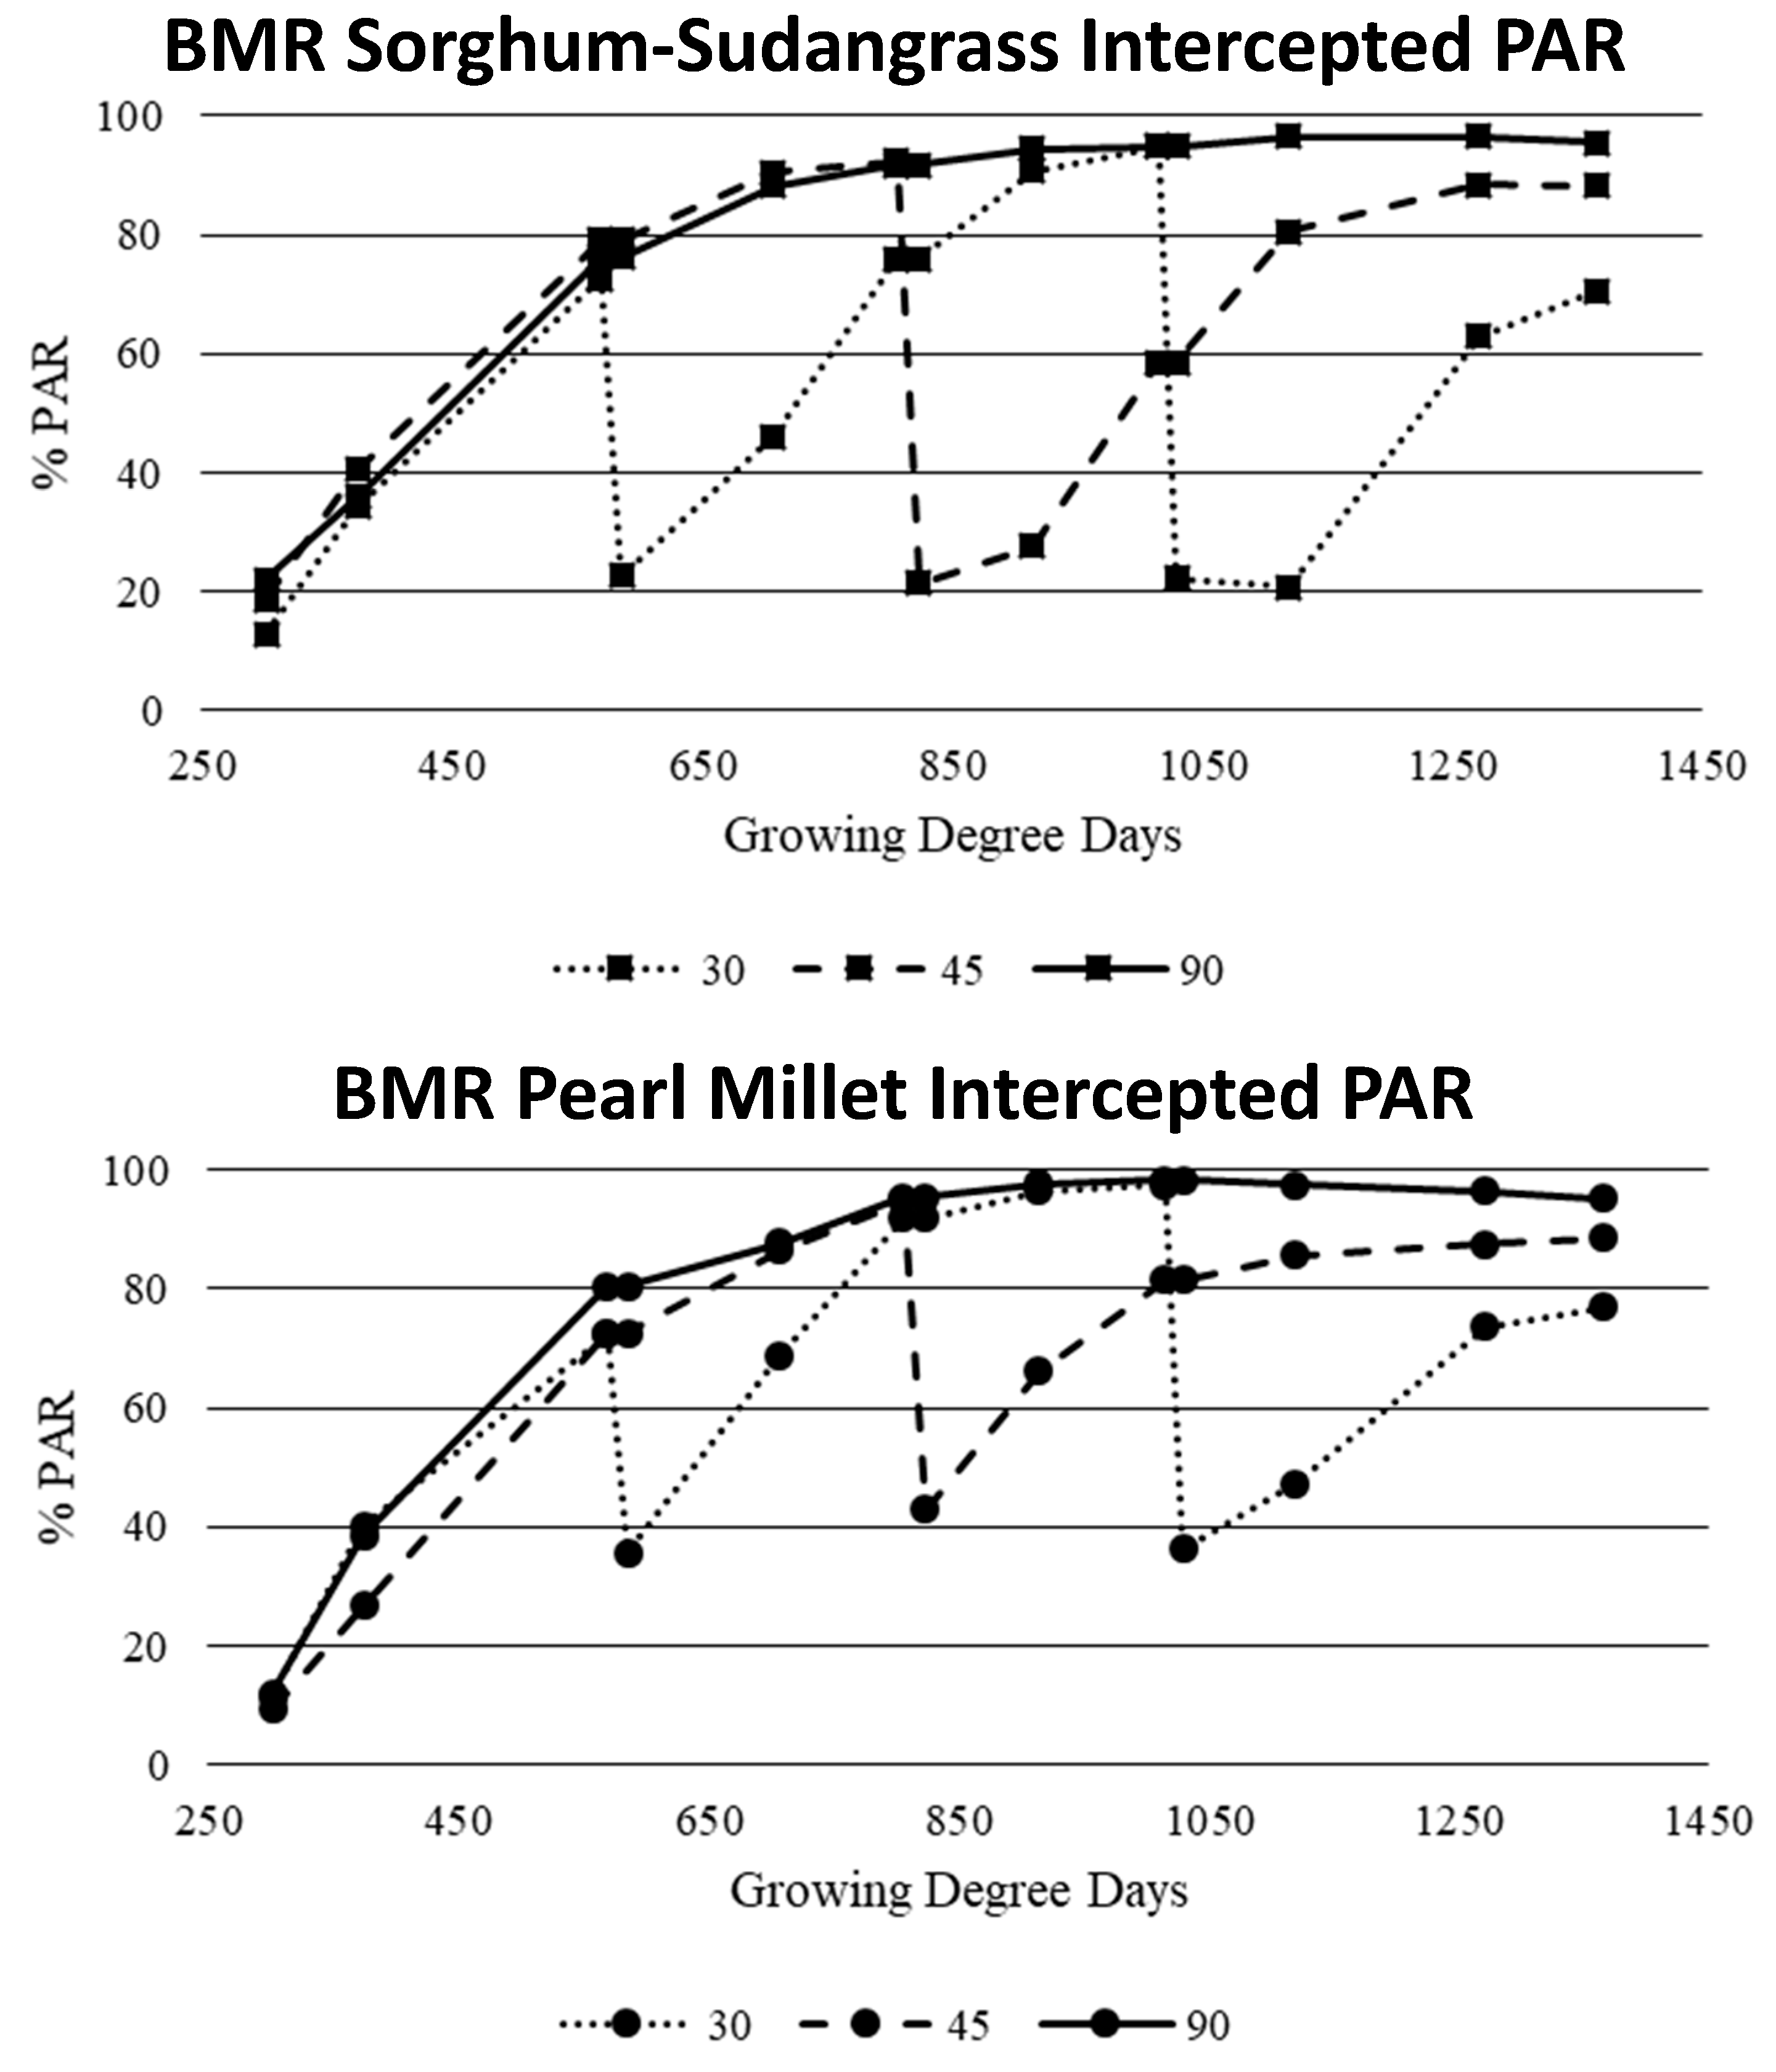
3.4. Crop Canopy and Morphology

The LAI in the 90-d SS harvest responded similarly in both years, plateauing between 1078 and 1029 GDDs (Figure 2 and Figure 3). However, 2016 had a 3% higher end of season LAI value, 4.65, when compared to 4.50 in 2017. This is similar to LAI values of 4.5 to 5.0 in the 2010 growing season reported by Maughan [19]. However, the 2016 and 2017 study are much lower than Singh [26] that reported a LAI value of 6.4.
In 2016, the 90-d PM harvest reached maximum LAI, 3.95, at 1078 GDDs and ended the season at a LAI of 3.83 (Figure 2). However, LAI in 2017 peaked at a value of 5.64 at 1029 GDDs and sloped off at the end of the season to a LAI of 4.61. This study is much lower than results found by Singh [26] that reported LAI values of 11.4 and 6.5 in unstressed and severely stressed PM, respectively. Singh [26] attributed this to the severely stressed plants having higher ground cover due to the death of the lower leaves and the incident interception of the upper profile of the crop canopy.
In both years and both crops, the 45-d harvest had a higher LAI value before harvest than at the end of the season (Figure 2 and Figure 3). A similar trend occurred in the 30-d harvest interval where maximum LAI was attained before the second harvest. The SS, 30-d harvests recovered from the maximum LAI to the end of season LAI, 52% and 47% in 2016 and 2017, respectively. While 30-d harvest, PM recovered to 57% and 54% in both years after the second harvest. In 2016, both SS and PM recovered to 93 and 98% of the maximum LAI; however, in 2017, only 88 and 73% of the LAI value was reached in SS and PM, respectively.
In 2016, in PM, end of season light interception ranged 20% between the three cutting intervals (Figure 4). The 30, 45, and 90-d harvest intervals had end of season PAR interception at 67, 77, and 87% PAR, respectively. In both years, PM reached maximum PAR, 90 and 98%, 350 GDDs before the final harvest (Figure 4 and Figure 5). However, SS in both years reached maximum PAR, 94 and 96%, 200 GDDs after PM reached maximum PAR interception. This is similar to Maughan [19] that found energy sorghum reached 95% PAR interception.
In 2016, both species in the 45-d harvest reached 82% PAR before harvest; while in 2017, both crops averaged 93% intercepted PAR before harvest (Figure 4 and Figure 5). In 2017, PM seemed to have higher light interception after harvest. Across both species and years in the 30-d harvest interval, maximum PAR was achieved right before the second harvest. The SS peaked at 90 and 94% and PM peaked at 81 and 98% PAR in both years, respectively.
In both years after a harvest, PM had higher LAI and PAR than SS. This can be attributed to at 300 GDDs, SS produced 69 and 80% of PM leaf:stem ratios in 2016 and 2017, respectively (data not shown); and SS produced 39% of PM tillers per plant at 550 GDDs (data not shown). Because PM had higher values in all four of these attributes, the crop was better able to reduce soil moisture evaporative losses resulting in a higher WUE.

3.5. Water Use Efficiency

Water use efficiency (WUE) was evaluated in 2017 only (Table 3). The 90-d harvest had higher WUE compared to other two harvest intervals in both SS and PM. When compared among the crop species, PM showed higher WUE than SS in 45 and 90-d harvest intervals. Overall, the PM WUEs in 30, 45, and 90-d were 10.9, 11.8, and 25.8 kg DM ha−1 mm−1 when compared to 10.2, 9.5, and 16.4 kg DM ha−1 mm−1 in SS, respectively. This concurs with Singh [26] that found PM to have a higher WUE than sorghum (17.9 vs. 14.4 kg DM ha−1 mm−1).

4. Conclusions

The maximum amount of forage was produced in the single 90-d harvest for both crops. It was also concluded that rapid growth occurred between 30 and 60 d after emergence. Sorghum-sudangrass out-yielded PM; however, PM still may be a viable forage option for producers in the region. As the crop matured, forage quality decreased and forage DM production increased; however, some forage quality attributes can be retained with more frequent harvests. Although the 90-d harvest regime maximized forage DM production, if higher forage quality is desired, shorter cutting intervals are recommended. Frequent harvests reduce DM production potential while retaining high quality potential. When water is a limiting factor, a PM, 90-d harvest interval, production system is desirable due to higher WUE. Further research needs to be conducted to understand PM crop establishment and production for the Texas High Plains.

Author Contributions

Conceptualization, J.A.M. and B.C.B.; methodology, J.A.M. and B.C.B.; software, J.A.M., M.D., and M.B.R.; formal analysis, J.A.M., M.D., and M.B.R.; investigation, J.A.M. and B.C.B.; resources, B.C.B.; writing—original draft preparation, J.A.M. and B.C.B.; writing—review and editing, J.A.M., B.C.B., M.D., and M.B.R.; visualization, J.A.M., B.C.B., and M.D.; supervision, B.C.B.; project administration, J.A.M. and B.C.B.; funding acquisition, J.A.M. and B.C.B.

Funding

This research received no external funding.

Acknowledgments

The authors acknowledge partial funding support from the Killgore Research Center, West Texas A&M University, and seed donations from Richardson Seeds, Inc. (Vega, TX, USA) and Winfield United (Shoreview, MN, USA). The authors also gratefully acknowledge the technical and data analysis support of Bradley S. Crookston.

Conflicts of Interest

The authors declare no conflict of interest.

References

  1. Terrell, B.L.; Johnson, P.N.; Segarra, E. Ogallala aquifer depletion: Economic impact on the Texas high plains. Water Policy 2002, 4, 33–46. [Google Scholar] [CrossRef]
  2. McGuire, V.L. Water-Level Changes in the High Plains Aquifer, Predevelopment to 2001, 1999 to 2000, and 2000 to 2001; USGS Fact Sheet: FS-078-03; U.S. Geological Survey: Denver, CO, USA, 2003.
  3. Colaizzi, P.D.; Gowda, P.H.; Marek, T.H.; Porter, D.O. Irrigation in the Texas High Plains: A brief history and potential reductions in demand. Irrig. Drain. 2009, 58, 257–274. [Google Scholar] [CrossRef]
  4. Ejeta, G.; Knoll, J.E. Marker-Assisted selection in sorghum. In Genomic-Assisted Crop Improvement: Vol 2: Genomics Applications in Crops; Varshney, R.K., Tuberosa, R., Eds.; Springer Publications: Dordrecht, The Netherlands, 2007; pp. 187–205. [Google Scholar]
  5. Lauriault, L.M.; Marsalis, M.A.; VanLeeuwen, D.M. Selecting sorghum forages for limited and full irrigation and rainfed conditions in semiarid, subtropical environments. Forage Grassl. 2011, 9. [Google Scholar] [CrossRef]
  6. Marsalis, M. Sorghum Forage Production in New Mexico. 2011. Available online: https://aces.nmsu.edu/pubs/_a/A332/welcome.html (accessed on 10 August 2018).
  7. Baltensperger, D.D. Progress with proso, pearl and other millets. In Trends in New Crops and New Uses; Janick, J., Whipkey, A., Eds.; ASHS Press: Alexandria, VA, USA, 2002; pp. 100–103. [Google Scholar]
  8. Bishnoi, U.R.; Oka, G.M.; Fearon, A.L. Quantity and quality of forage and silage of pearl millet in comparison to Sudax, grain, and forage sorghum harvested at different growth stages. J. Trop. Agric. 1993, 70, 98–102. [Google Scholar]
  9. Marsalis, M.A.; Lauriault, L.M.; Trostle, C. Millets for Forage and Grain in New Mexico and West Texas; NMSU Cooperative Extension Service Publication: Las Cruces, NM, USA, 2012; Available online: http://aces.nmsu.edu/pubs/_a/A417/welcome.html (accessed on 10 August 2018).
  10. Andrews, D.J.; Kumar, K.A. Pearl millet for food, feed and forage. Adv. Agron. 1992, 48, 89–139. [Google Scholar]
  11. Stephenson, R.J.; Posler, G.L. Forage yield and regrowth of pearl Millet. Trans. Kansas Acad. Sci. 1984, 87, 91–97. [Google Scholar] [CrossRef]
  12. Burger, A.W.; Hittle, C.N. Yield, protein, nitrate, and prussic acid content of sudangrass, sudangrass hybrids, and pearl millets harvested at two cutting frequencies and two stubble heights. Agron. J. 1967, 59, 259–262. [Google Scholar] [CrossRef]
  13. Staggenborg, S. Forage and renewable sorghum end uses. In Sorghum: State of the Art and Future Perspectives; Ciampitti, I., Prasad, V., Eds.; Agron Monogr: Madison, WI, USA, 2016. [Google Scholar]
  14. AOAC International. AOAC Method 990.03. Protein (Crude) in Animal Feed. Combustion Method. Official Methods of Analysis of AOAC International, 19th ed.; Latimer, G.W., Jr., Ed.; AOAC International: Gaithersburg, MD, USA, 2012. [Google Scholar]
  15. Ankom. Ankom Technology Method 5. Acid Detergent Fiber in Feeds. Filter Bag Technique. Ankom Technology. Macedon, New York. This Method Is a Modification of AOAC Official Method 973.18. Fiber (Acid Detergent) and Lignin (H2SO4) in Animal Feed. Official Methods of Analysis of AOAC International, 19th ed.; Latimer, G.W., Jr., Ed.; Ankom: Gaithersburg, MD, USA, 2006. [Google Scholar]
  16. Ankom. Ankom. Ankom Technology Method 6. Neutral Detergent Fiber in Feeds. Filter Bag Technique. Ankom Technology. Macedon, New York. This Method Is a Modification of AOAC Official Method 2002.04. Amylase-Treated Neutral Detergent Fiber in Feeds. Using Refluxing in Beakers or Crucibles. In Official Methods of Analysis of AOAC International, 19th ed.; Latimer, G.W., Jr., Ed.; Ankom: Gaithersburg, MD, USA, 2006. [Google Scholar]
  17. Venuto, B.; Kindiger, B. Forage and biomass feedstock production from hybrid forage sorghum and sorghum–sudangrass hybrids. Grassl. Sci. 2008, 54, 189–196. [Google Scholar] [CrossRef]
  18. Virmani, S.M.; Tandon, H.L.S.; Alagarswamy, G. Modeling the Growth and Development of Sorghum and Pearl Millet; International Crops Research Institute for the Semi-Arid Tropics: Patancheru, India, 1989. [Google Scholar]
  19. Maughan, M.; Voigt, T.; Parrish, A.; Bollero, G.; Rooney, W.; Lee, D.K. Forage and energy sorghum responses to nitrogen fertilization in central and southern Illinois. Agron. J. 2012, 104, 1032–1040. [Google Scholar] [CrossRef]
  20. Duncan, R.R.; Gardner, W.A. The influence of ratoon cropping on sweet sorghum yield, sugar production, and insect damage. Can. J. Plant Sci. 1984, 64, 261–274. [Google Scholar] [CrossRef]
  21. Sanderson, M.A.; Ali, G.; Hussey, M.A.; Miller, F.R. Forage Quality and Agronomic Traits of Sorghum-Sudangrass Hybrids; Texas Agricultural Experiment Station MP-1765: College Station, TX, USA, 1995; Available online: https://www.researchgate.net/publication/292175586_Forage_quality_and_agronomic_traits_of_sorghum-sudangrass_hybrids (accessed on 24 July 2019).
  22. El-Lattief, E.A. Growth and fodder yield of forage pearl millet in newly cultivated land as affected by date of planting and integrated use of mineral and organic fertilizers. Asian J. Crop Sci. 2011, 3, 35–42. [Google Scholar]
  23. Rostamza, M.; Chaichi, M.R.; Jahansouz, M.R.; Alimadadi, A. Forage quality, water use and nitrogen utilization efficiencies of pearl millet (Pennisetum americanum L.) grown under different soil moisture and nitrogen levels. Agric. Water Manag. 2011, 98, 1607–1614. [Google Scholar] [CrossRef]
  24. Nasiyev, B.N. Selection of high-yielding agrophytocenoses of annual crops for fodder lands of frontier zone. Life Sci. J. 2013, 10, 267–271. [Google Scholar]
  25. Cherney, D.J.; Patterson, J.A.; Johnson, K.D. Digestibility and feeding value of pearl millet as influenced by the brown-midrib, low-lignin trait. J. Anim. Sci. 1990, 68, 4345–4351. [Google Scholar] [CrossRef] [PubMed]
  26. Singh, B.R.; Singh, D.P. Agronomic and physiological responses of sorghum, maize and pearl millet to irrigation. Field Crops Res. 1995, 42, 57–67. [Google Scholar] [CrossRef]
Figure 1. Average total (summed across harvest intervals) brown midrib (BMR) sorghum-sudangrass and BMR pearl millet aboveground dry matter (DM) in Canyon, TX during 2016–2017. The same lowercase letter represents similar means within year, within crop (α < 0.05).
Agronomy 09 00416 g001
Figure 2. Brown midrib (BMR) sorghum-sudangrass and BMR pearl millet leaf area index (LAI) for three different harvest intervals (three 30-d, two 45-d, and one 90-d) in 2016 at Canyon, TX, USA.
Agronomy 09 00416 g002
Figure 3. Brown midrib (BMR) sorghum-sudangrass and BMR pearl millet leaf area index (LAI) for three different harvest intervals (three 30-d, two 45-d, and one 90-d) in 2017 at Canyon, TX, USA.
Agronomy 09 00416 g003
Figure 4. Brown midrib (BMR) sorghum-sudangrass and BMR pearl millet intercepted photosynthetically active radiation (PAR) for three different harvest intervals (three 30-d, two 45-d, and one 90-d) in 2016 at Canyon, TX, USA.
Agronomy 09 00416 g004
Figure 5. Brown midrib (BMR) sorghum-sudangrass and BMR pearl millet intercepted photosynthetically active radiation (PAR) for three different harvest intervals three 30-d, two 45-d, and one 90-d) in 2017 at Canyon, TX, USA.
Agronomy 09 00416 g005
Table 1. Average monthly air temperature and total rainfall near Canyon, TX for 2016–2017. Thirty year averages (30-year) were calculated from data collected from the National Weather Service Forecast Office from 1985–2015.
MonthAir TemperaturePrecipitation
2016 2017 30-year2016201730-year
°Cmm
May17.317.819.8344069
June25.224.224.72610473
July28.125.326.3588058
August18.622.225.58112879
September15.321.221.4408561
2016 weather data collected from the National Weather Service approx. 7 km from research site for Canyon, TX. 2017 weather data collected from onsite weather station (Campbell Scientific, Logan, UT) 100 m from the experimental site.
Table 2. Brown midrib (BMR) sorghum-sudangrass (SS) and BMR pearl millet (PM) aboveground dry matter (DM) and forage quality means for crude protein (CP), acid detergent fiber (ADF), neutral detergent fiber (NDF), total digestible nutrients (TDN), and relative feed value (RFV) near Canyon, TX, in 2016 and 2017. Harvest intervals included three 30-day, two 45-day, and one 90-day harvest for each crop.
IntervalCropHarvest20162017
DM CPADFNDFTDNRFVDMCPADFNDFTDNRFV
Mg ha−1%Mg ha−1%
30-dayPMH300.50b14.6a30.4b56.5b68.5a107.8a0.88b11.4a34.7b61.2ab63.5a94.3a
H602.53a11.0b31.7b58.6b67.4a102.0a4.02a10.5b38.6a63.0a59.7b87.0b
H900.93b9.1b37.7a60.6a60.4b91.5b1.09b8.0c39.0a59.4b59.0b91.8a
Total3.96 6.00
SSH301.06b11.0a34.7b62.1a63.5a92.8a1.83b10.6a35.8c58.3a62.6a97.3b
H603.53a9.2a34.5b60.6ab64.0a95.3a4.09a10.1ab40.2a59.8a57.5c89.5c
H900.80b10.5a38.4a57.8b59.5b95.3a0.61c9.4b37.9b53.9b60.2b102.8a
Total5.38 6.53
SE0.2390.830.891.161.012.940.2240.270.460.670.471.46
45-dayPMH451.57a14.8a32.5b60.4b66.0a98.0a2.7812.7a36.8b63.8a61.5a87.8a
H902.24a12.0b35.9a61.5a62.6b92.5b2.866.0b38.8a60.3b59.0b90.5a
Total3.81 5.64
SSH452.65a5.8b38.9b63.9a59.0a85.3b4.59a9.9a38.9a62.1a59.0a87.8b
H902.34a6.5a39.9a62.1a57.9b86.5a2.46b6.7b38.2a57.2b59.9a96.3a
Total4.99 7.05
SE0.2710.620.620.700.681.650.2250.380.460.590.551.30
90-dayPMH906.29B5.1A38.0A64.5A59.9A85.5A9.87B4.3A39.3A59.8A58.6A90.8A
SSH9011.05A4.4A38.6A62.0A59.5A88.5A15.51A4.2A39.9A58.3B57.9A92.5A
SE1.3060.430.971.031.122.640.4290.300.220.400.300.69
Columns with same lowercase letter are not different between harvests within harvest interval, within crop, within year. Columns with same uppercase letter are not different between harvests within harvest interval, between crops, within year (α < 0.05).
Table 3. Water use efficiency (WUE), dry matter (DM), and total water use means of brown midrib (BMR) sorghum-sudangrass and BMR pearl millet under three different harvest intervals (three 30-d, two 45-d, and one 90-d) near Canyon, TX in 2017.
CropIntervalDMTotal Water UsedWUE
kg ha−1 mmkg ha−1 mm−1
Sorghum-sudangrass306528bA59910.2bA
457051bA5969.5bB
9015,513aA60216.4aB
Pearl Millet305996bA59110.9bA
455637bB59111.8bA
909873aB60125.8aA
SE417.82.20.701
Columns with same lowercase letter are not different between harvest intervals within crop and columns with same uppercase letter are not different between crops within harvest interval.

