Using Hyperspectral and Multispectral Indices to Detect Water Stress for an Urban Turfgrass System


School of Plant and Environmental Sciences, Virginia Polytechnic and State University, Smyth Hall, Blacksburg, VA 24061, USA
*
Author to whom correspondence should be addressed.
Agronomy 2019, 9(8), 439; https://0-doi-org.brum.beds.ac.uk/10.3390/agronomy9080439
Submission received: 23 July 2019
/
Revised: 5 August 2019
/
Accepted: 7 August 2019
/
Published: 8 August 2019
(This article belongs to the Special Issue Crop Evapotranspiration)
Abstract
:Spectral reflectance measurements collected from hyperspectral and multispectral radiometers have the potential to be a management tool for detecting water and nutrient stress in turfgrass. Hyperspectral radiometers collect hundreds of narrowband reflectance data compared to multispectral radiometers that collect three to ten broadband reflectance data for a cheaper cost. Spectral reflectance data have been used to create vegetation indices such as the normalized difference vegetation index (NDVI) and the simple ratio vegetation index (RVI) to assess crop growth, density, and fertility. Other indices such as the water band index (WBI) (narrowband index) and green-to-red ratio index (GRI) (both broadband and narrowband index) have been proposed to predict soil moisture status in turfgrass systems. The objective of this study was to compare the value of multispectral and hyperspectral radiometers to assess soil volumetric water content (VWC) and tall fescue (Festuca arundinacea Schreb.) responses. The multispectral radiometer VI had the strongest relationships to turfgrass quality, biomass, and tissue N accumulation during the trial period (April 2017–August 2018). Soil VWC had the strongest relationship to WBI (r = 0.60), followed by GRI and NDVI (both r = 0.54) for the 0% evapotranspiration (ET). Nonlinear regression showed strong relationships at high water stress periods in each year for WBI (r = 0.69–0.79), GRI (r = 0.64–0.75), and NDVI (r = 0.58–0.79). Broadband index data collected using a mobile multispectral sensor is a cheaper alternative to hyperspectral radiometry and can provide better spatial coverage.
1. Introduction
Turfgrass covers approximately 2% of the continental United States [1]. This makes turfgrass the largest irrigated crop in the United States. Sufficient irrigation is necessary to maintain acceptable quality turfgrass stands. As water prices increase and availability declines due to climate change and increased human demand, water conservation is critical for successful turfgrass management. Irrigation strategies that reduce water inputs and maintains turfgrass quality are needed for landowners and turfgrass managers.
Turfgrass managers implement various strategies to optimize the efficiency of irrigation inputs. Evapotranspiration (ET)-based irrigation is designed to return less water than actual ET without compromising turfgrass quality [2]. Irrigating at 80% ET for cool-season turfgrasses has been widely accepted [3,4]. Feldhake et al. [5] and Ervin [6] suggest that ET-based irrigation does not provide adequate spatial resolution for the heterogeneity of ET that occurs at a local scale. The use of on-site atmometers is a reliable means to predict ET while overcoming the limitation of spatial resolution [2,7,8].
Hand-held moisture meters have been employed to assess soil moisture and irrigation needs at a fine-scale resolution [9,10]. Time-domain reflectometry (TDR) has been used for smaller landscape areas to directly measure soil volumetric water content (VWC) [11,12,13,14]. Time-domain reflectometers are hand-held devices that consist of metal rods that emit high-frequency electromagnetic pulses through the soil. The velocity of the pulses between the rods can be used to calculate the soil VWC [14,15]. Soil VWC measurements by TDR is limited by the time needed to collect data over large areas [4]. Carrow et al. [16] proposed using TDR and spectral reflectance mapping as a precision turfgrass management strategy to improve irrigation efficiency on a site-specific scale. Spectral reflectance data acquisition of turfgrass, via satellite or mobile devices, can contribute greatly to quantifying crop water needs, especially if integrated with soil and plant measurements [16,17].
Turfgrass managers have traditionally relied on visual evaluation to estimate turfgrass health status, irrigation or fertilizer needs, damage, or environmental stress [17]. Spectral reflectance data can overcome the subjectivity of visual assessments of turfgrass response to management practices [17,18]. Spectral reflectance data can be acquired via remote sensing radiometers on ground-based, aircraft, or satellite instruments [19]. Hyperspectral radiometers measure reflected energy in hundreds to thousands of continuous narrowbands across the electromagnetic spectrum. Multispectral radiometers are a less expensive option to measure reflected energy in three to ten broadbands [20]. These radiometers can be used in to quantify physiological attributes of healthy and stressed plant tissue due to changes in spectral reflectance in the visible red (R), red edge (RE), and near-infrared (NIR) regions [21]. Physiological differences have been detected prior to visual stress symptoms in various agronomic settings [22,23,24,25]. Spectral reflectance measurements have potential as a management tool for water and nutrient stress in turfgrass. McCall et al. [26] and Roberson [27] demonstrated at the greenhouse scale the detection of water stress using spectral reflectance. However, variations in fertility and irrigation strategies, as well as the comparison of multispectral and hyperspectral radiometers, are largely unexplored at the field-scale in turfgrass research.
Agricultural research and management have employed the use of vegetation indices (VI), typically, a ratio of two or more spectral bands, derived from spectral data to assess plant responses [28]. The most commonly used index for measuring plant performance or stress indicator is the normalized difference vegetation index (NDVI):
The normalized difference vegetation index has demonstrated correlation in turfgrass systems to soil moisture, N fertilization, tissue biomass, tissue chlorophyll concentration, and turfgrass quality parameters (e.g., color, density, and uniformity) [18,28,29,30,31,32,33,34,35,36]. Additional VI have shown useful in quantifying plant responses. The ratio vegetation index (RVI):
is sensitive to dense vegetation growth, but insensitive to sparse vegetation cover [28]. In contrast, NDVI is more sensitive to sparse vegetation and less sensitive to dense growth. Despite the ability of the NDVI and RVI to quantify plant response to fertility or to stress (e.g., soil moisture), it is unable to differentiate and determine the cause of the plant response [16].
Water indices utilizing narrowband spectral reflectance have been used to assess plant water status and drought effects [26,37,38]. Water indices have potential for early water stress detection independent of other stressors. Water absorption bands exist in the NIR region beyond the photosynthetically active radiation (PAR), reducing the confounding effect from other abiotic stresses. McCall et al. [26] determined that soil VWC had the strongest correlation to the water band index (WBI) (r ≥ 0.80), followed by the green-to-red ratio index (GRI) (r ≥ 0.50) in a greenhouse study assessing creeping bentgrass grown in a sand-based media:
and
where R refers to reflectance and the subscripts refer to a specific spectral band. In this same study, NDVI did not correlate with soil VWC. Roberson [27] found similar results in various soil textures that WBI and GRI were better at detecting moisture stress in comparison to NDVI. It is important to gather more information at field-scale regarding WBI and GRI detection of moisture stress, as GRI can be used in both hyperspectral and multispectral radiometers.
Determining the most suitable VI can provide site-specific management strategies regarding water stress and N fertility when combined with geographic information systems applications. With the advent of unmanned automated systems (drones), the use of spectral reflectance can be a cost-effective management strategy to rapidly collect large data sets and assess target vegetation stresses in real-time. Our research was to test the scalability of previous research conducted by McCall et al. [26] and Roberson [27] relating spectral reflectance data to soil VWC and N fertility in a tall fescue (Festuca arundinacea Schreb.) urban turfgrass system. The objectives of our study were to (1) compare the relationships of various vegetation indices using a traditional broadband, multispectral radiometer and a narrowband hyperspectral radiometer to soil VWC, turfgrass quality, and leaf tissue analyses; (2) define the relationship of vegetation indices to irrigation strategy; and (3) compare the relationship of different vegetation indices to different sources of N fertility including organic sources (exceptional quality biosolids-based amendments), a synthetic source (urea), and a blend of the two (exceptional quality biosolids-based amendments + urea).
2. Materials and Methods
2.1. Study Site Establishment
This study was conducted from April 2017 to August 2018 at the Virginia Tech Turfgrass Research Center in Blacksburg, VA, USA (37°12′54.31″ N, 80°24′42.14″ W) located in Cold Hardiness Zone 6b [39]. Mean monthly temperature and precipitation was reported using a nearby weather station for 2017 to 2018 [40]. The results presented are part of an ongoing research study assessing tall fescue growth and maintenance in an anthropogenically developed clayey soil that began in August 2013. Initial site description, field preparation, soil benchmark sampling and analysis, irrigation installation, fertility applications, and plant establishment management were reported by Badzmierowski et al. [41].
2.2. Experimental Design
The experimental design was a split-plot arrangement of a randomized complete block design replicated four times. Main plots were two summer irrigation treatments, and subplots were five soil fertility amendments. Irrigation treatments were (1) no water applied during critical summer months (0% ET), unless necessary to keep vegetation alive, and (2) water applied to replenish 80% of ET during drought-prone (80% ET), high-ET summer months. Irrigation was withheld from all replicates of the 0% ET main plot from 18 May–26 July 2017, and 6 June–12 July 2018. Irrigation of all main plots to 80% of ET was resumed at the end of each drought stress period. Each main plot was 20.7 × 3.7 m.
The five subplot treatments were synthetic fertilizer and four exceptional quality (EQ) biosolids products applied to provide an estimated annual plant-available nitrogen (PAN) rate of 171 kg PAN ha−1. Dimensions of the experimental area were 22.7 × 35.5 m (806 m2). Each subplot was 3.7 × 3.7 m and had 0.61-m buffer strips between subplots.
2.3. Amendment Treatments, Biosolids Analysis, and Soil Fertility
Three of the four EQ Class A biosolids treatments used in the study were processed at DC Water Blue Plains Advanced Wastewater Treatment Plant (DC Water) undergoing thermal hydrolysis and anaerobic digestion. The digested biosolids were dewatered and surface applied “as is” or blended with sand and sawdust to improve characteristics (i.e., lower moisture and increased carbon) for spreading in a turfgrass system. The three DC Water amendments are: (1) dewatered biosolids (DBN), (2) dewatered biosolids blended with sand and sawdust (BBN), and (3) dewatered biosolids blended with sand and sawdust to supply an annual P rate as recommended by Virginia Tech Soil Testing Laboratory soil test analysis plus supplemental S-coated urea fertilizer to provide equal annual PAN ha−1 (BBP). The fourth biosolids treatment was anaerobically digested, dewatered biosolids compost (CBN) produced at Spotsylvania County (Virginia, USA) Livingston.
The fifth amendment treatment was synthetic fertilizer N (as S-coated urea) (FER). Triple superphosphate (0–46–0 N–P–K) and muriate of potash (0–0–60 N–P–K) applications for 2017 to 2018 were adjusted for the synthetic fertilizer treatment plots and biosolids treatment plots, based on September 2015 soil test results [41].
Fertility amendments were applied on 29 March 2017 (24.4 kg PAN ha−1), 20 September 2017 (73.1 kg PAN ha−1), 18 October 2017 (73.1 kg PAN ha−1), and 3 April 2018 (24.4 kg PAN ha−1).
2.4. Sampling and Analysis
2.4.1. Spectral Reflectance Measurements
Spectral reflectance data were collected using two independent tools. The Spectral Evolution PSR-1100F is a handheld portable field radiometer (Spectral Evolution, Lawrence, MA, USA) fitted with a contact probe measuring a spot size of 2.5 cm directly from the canopy surface. A total of 512 unique spectra were sampled from 320 to 1100 nm at a 1.4-nm sampling bandwidth and a 3-nm spectral resolution. A BaSO4 white panel was used to calibrate a reference by placing the probe directly on the panel surface prior to each replication. Four spot measurements were taken walking a linear path in the middle of each experimental unit.
A second handheld multispectral radiometer, the Crop Circle ACS-430 (Holland Scientific, Inc., Lincoln, NE, USA), was mounted to a Bag Boy Quad Plus pushcart (Bag Boy Company, Richmond, VA, USA) to measure broadband VI. The sensor simultaneously measures crop and soil reflectance fixed at broadbands red = 670 nm, red edge = 730 nm, and near infrared = 780 nm. The hyperspectral radiometer spectral indices NDVI, RVI, and GRI were calculated using the equivalent spectra to the Crop Circle ACS-430 filters (670, 730, and 780 nm) (Table 1), while maintaining the principles described in the literature and in Equations (1)–(4) [42,43,44]. The Crop Circle ACS-430 was mounted at a stationary height of 46 cm above the turf canopy and set to collect 10 samples per second. Radiometer measurements commenced at the edge of each plot and took an average of 100 readings per 3.7 m of linear travel through the center of each subplot. Spectral reflectance sampling was conducted prior to mowing and taken to coincide with other turfgrass and soil measurements.
Previous greenhouse turfgrass trials conducted by McCall et al. [26] and Roberson [27] were used as the basis for determining indices to assess soil moisture status and turfgrass parameters (Table 1). Both studies aimed to develop relationships of soil moisture status and health of turfgrass using various vegetation indices. Based on their findings, WBI and GRI were significantly related to soil VWC. The WBI and GRI were analyzed using the hyperspectral radiometer as the manufactured filter of the Crop Circle ACS-430 cannot measure the required wavelengths. Both the Crop Circle ACS-430 and the hyperspectral radiometer were used for turfgrass growth and quality relationships to compare the continuous data collection of the Crop Circle ACS-430 and the individual points measured by the handheld hyperspectral radiometer.
2.4.2. Turfgrass and Soil Sampling
Turfgrass clipping and N analysis of tissue content remained the same as reported in Badzmierowski et al. [41]. Turfgrass clipping yield was collected every other week throughout the growing season by mowing a single pass down the center of each plot. During weeks when yields were not collected, all plots were mulched, and clippings were left in place. All biomass clippings were dried for 48 h at 60 °C and the dry clipping biomass was recorded. The biomass was ground to pass through a 0.5 mm sieve and subjected to a high-heat combustion chamber at 1200 °C for the determination of tall fescue leaf total N concentration. Clipping tissue N accumulation was calculated as the product of biomass and N concentration.
Turfgrass quality ratings were assigned by visual assessment based on guidelines established by the National Turfgrass Evaluation Program [45]. Visual assessment integrates turfgrass color, density, uniformity, and leaf texture and rates the turfgrass stand on a scale of 1 to 9, where 9 indicates an ideal turfgrass stand, 6 is the minimum acceptable quality, and 1 indicates the turfgrass is dormant or dead.
Soil VWC was collected from each subplot using a Field Scout TDR 300 (Spectrum Technologies, Inc., Plainfield, IL, USA) fitted with two 7.6 cm length, stainless steel turf rods. The average of four replicates for each subplot were recorded. Measurements were taken on turfgrass sampling dates.
2.5. Statistical Analysis
The spectral reflectance vegetation indices, visual turfgrass quality, tissue biomass, leaf tissue N accumulation, and soil VWC, were subjected to a mixed model. The model was partitioned to reflect main factors (with and without irrigation), subfactors (amendment types), blocking factor, year, and their interactions using an auto-regressive repeated measures mixed model in JMP Pro software (SAS Institute, v. 14.1, Cary, NC, USA). Pearson correlation coefficients were calculated to assess the relationships among response variables. Non-normal data were transformed using a box-cox transformation. Nonlinear regression was performed on an individual basis comparing various multispectral and hyperspectral relationships to selected turfgrass and soil variables using a four-parameter logistic model. Means were separated using a Student’s t-test or a Tukey’s post hoc test (p ≤ 0.05) when appropriate.
3. Results and Discussion
3.1. Weather
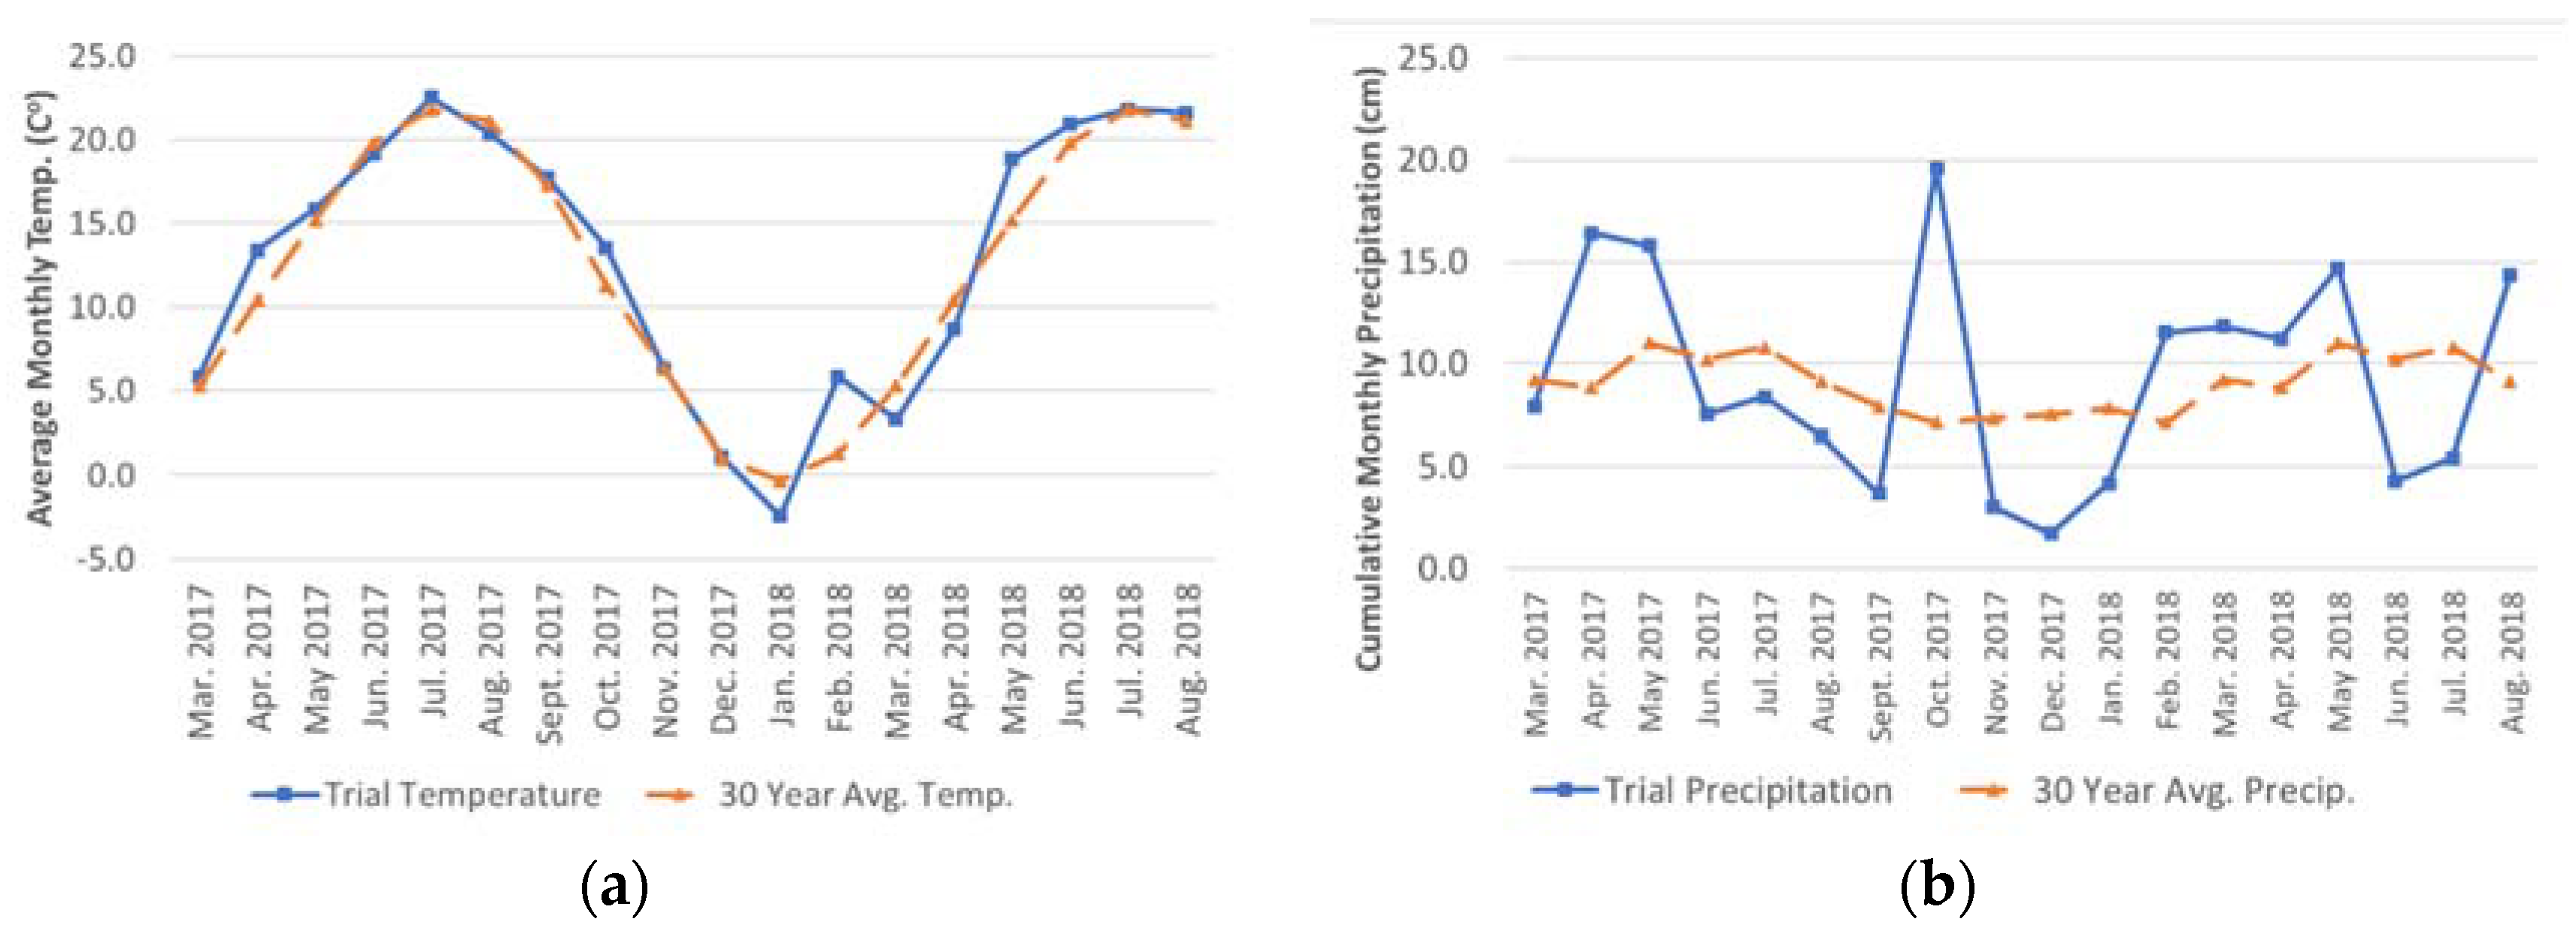
The research location experienced similar monthly average temperatures compared to the 30-year mean during the trial period (March 2017–August 2018) (Figure 1). Cumulative monthly precipitation was variable (Figure 1). The below average precipitation from in the summer of 2017 and 2018 provided the opportunity to impose two drought cycles on the tall fescue.
3.2. Overall Study Statistical Trends
Significant and strong relationships were observed in indices compared (Table 1) to each other from both radiometer instruments (data not shown). The NDVI and RVI from both instruments and the GRI and WBI measured from the hyperspectral instrument are discussed in this study. These indices were chosen due to their common use by plant scientists (NDVI), have been suggested to be more applicable to turfgrass systems (RVI), or exclude chlorophyll-related effects on water content estimation (WBI) [16,38,46,47].
The only dependent variable for which treatment interaction occurred was tall fescue quality RVIcc, where “cc” represents VI data collected by the Crop Circle ACS-430 (Table 2 and Table 3). The main factor (irrigation) elicited significant effects on all variables. Relationships were assessed separating the 0% ET and 80% ET main plots. The subfactor, fertility amendment, affected all turfgrass variables and soil VWC. Fertility amendments had no effect (p > 0.05) on VI measured by the hyperspectral radiometer but did yield a response in VI measured by the Crop Circle ACS-430 multispectral radiometer. Crop Circle ACS-430 Vis, denoted with “cc”, were additionally assessed by separating the fertility amendments.
3.3. Irrigation Effects on Tall Fescue Responses, Soil Volumetric Water Content, and Spectral Indices
Irrigating throughout the year at 80% ET resulted in greater soil VWC and improved tall fescue biomass, tissue N accumulation, and visual quality compared to plots that experienced drought during summer months (0% ET) (Table 4). This was expected as water is a limiting factor for growth.
Pearson correlation coefficients were separated by main factor (irrigation) to examine the relationships between indices analyzed and instrument used (hyperspectral vs. multispectral) since all indices were significantly affected by irrigation treatment (p < 0.001, Table 3). All spectral indices for both instruments resulted in greater values in the 80% ET compared to the 0% ET treatment (Table 5). This correlates to the observed increase of turfgrass response and soil VWC in the 80% ET for 2017 and 2018 (Table 4).
3.4. Irrigation Effects on Measurement Correlations
Each index was significantly (p < 0.0001) related to all tall fescue responses (Table 6). All indices were more associated to the corresponding tall fescue measurement for the 0% ET treatment (r = 0.39–0.83) than the 80% ET treatment (r = 0.32–0.81). The indices measured by the Crop Circle ACS-430 was best at estimating overall turfgrass quality (0% ET r = 0.77–0.81; 80% ET r = 0.54–0.63), where NDVI provided the best estimate for both irrigation treatments. The ability of the Crop Circle ACS-430 to obtain data faster and over a larger area provided a better representation of turfgrass quality compared to the isolated spot measurements using the hyperspectral radiometer (0% ET r = 0.65–0.75; 80% ET r = 0.24–0.38). The same trends were observed for biomass and tissue N accumulation. Increased correlation was observed for 0% ET vs. 80% ET and the Crop Circle ACS-430 was a better estimator of biomass and tissue N accumulation. The RVIcc was the most related index to biomass and tissue N accumulation (r = 0.76–0.83). This matches reports that RVI is a better index than NDVI for established turfgrass systems because of the near-complete canopy coverage [47].
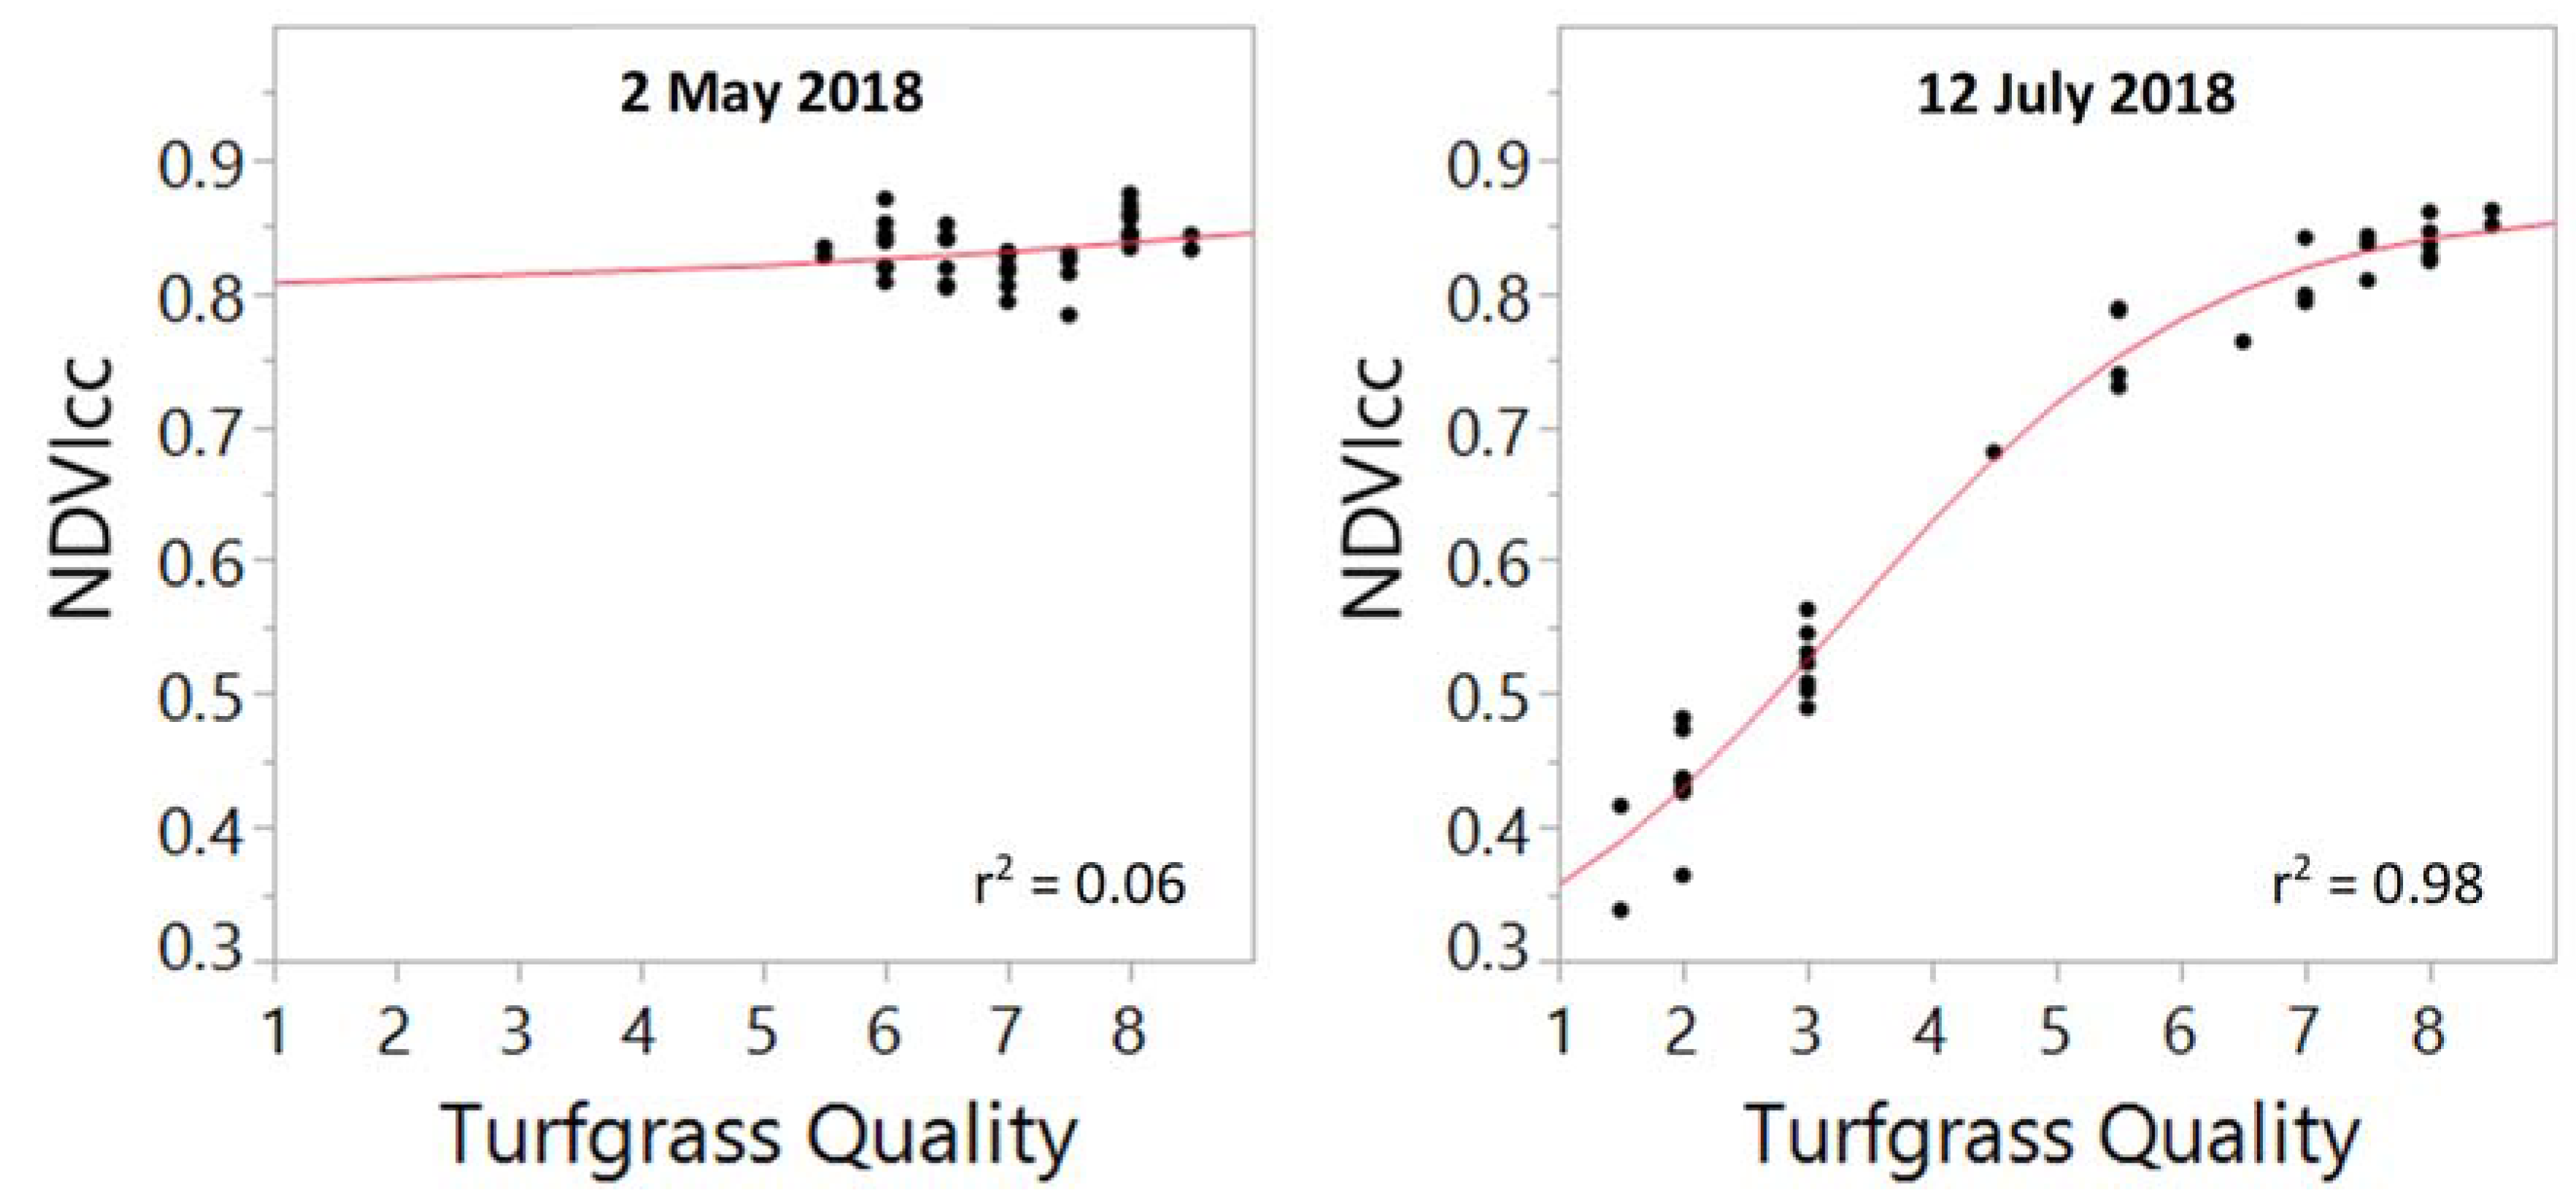
Nonlinear regression using a four-parameter logistic model of representative indices and tall fescue responses highlight the need for variability in data collected and collecting more data using tools like the Crop Circle ACS-430 radiometer (Figure 2; Table 7). The multispectral Crop Circle ACS-430 outperformed the hyperspectral radiometer in correlation to turfgrass quality and biomass for all dates except for RVI x biomass on 6 June 2018. This is most likely a result of the collection of approximately 100 readings per experimental unit vs. the four readings per experimental unit using the hyperspectral radiometer. The NDVIcc was strongly correlated to the maximum drought day during each year (26 July 2017: r = 0.87; 12 July 2017: r = 0.98). The maximum drought day was considered when irrigation was needed to prevent crop failure. Figure 2 emphasizes that the indices performed well during drought stress that 12 July 2018 had a r2 = 0.98 compared to other assessment dates when no visible drought stress was evident. Dates such as 2 May 2018 were poorly correlated as a consequence of a lack of variation in data (Figure 2). Well-maintained turfgrass (e.g., irrigation and fertilization) was not able to be used in developing strong index relationships due to a lack of stress and thus, a lack of variation in the data. The RVIcc had strong relationships to tall fescue biomass (r = 0.61–0.93) with the exceptions of 23 May 2018 and 6 June 2018 (Table 7).
All indices were more associated with soil VWC for the 0% ET treatment than the 80% ET treatment (Table 6). The WBI, GRI, and NDVI indices were the strongest correlated to soil VWC in the 0% ET treatment (r = 0.60, 0.54, and 0.54, respectively). The lack of correlation to soil VWC for the 80% ET suggests that the well-watered turfgrass was influenced by other factors (e.g., nutrient availability). Indices related to chlorophyll pigments such as NDVI are likely not a good indicator of water availability prior to drought stress as its decline only comes after drought stress [26]. The red reflectance used in NDVI is known to be significantly affected by chlorophyll content and absorption [48]. DaCosta et al. [49] found that chlorophyll concentrations decrease with drought stress. The WBI can provide a better indication of water stress prior to chlorophyll degradation as it utilizes reflectance outside the PAR.
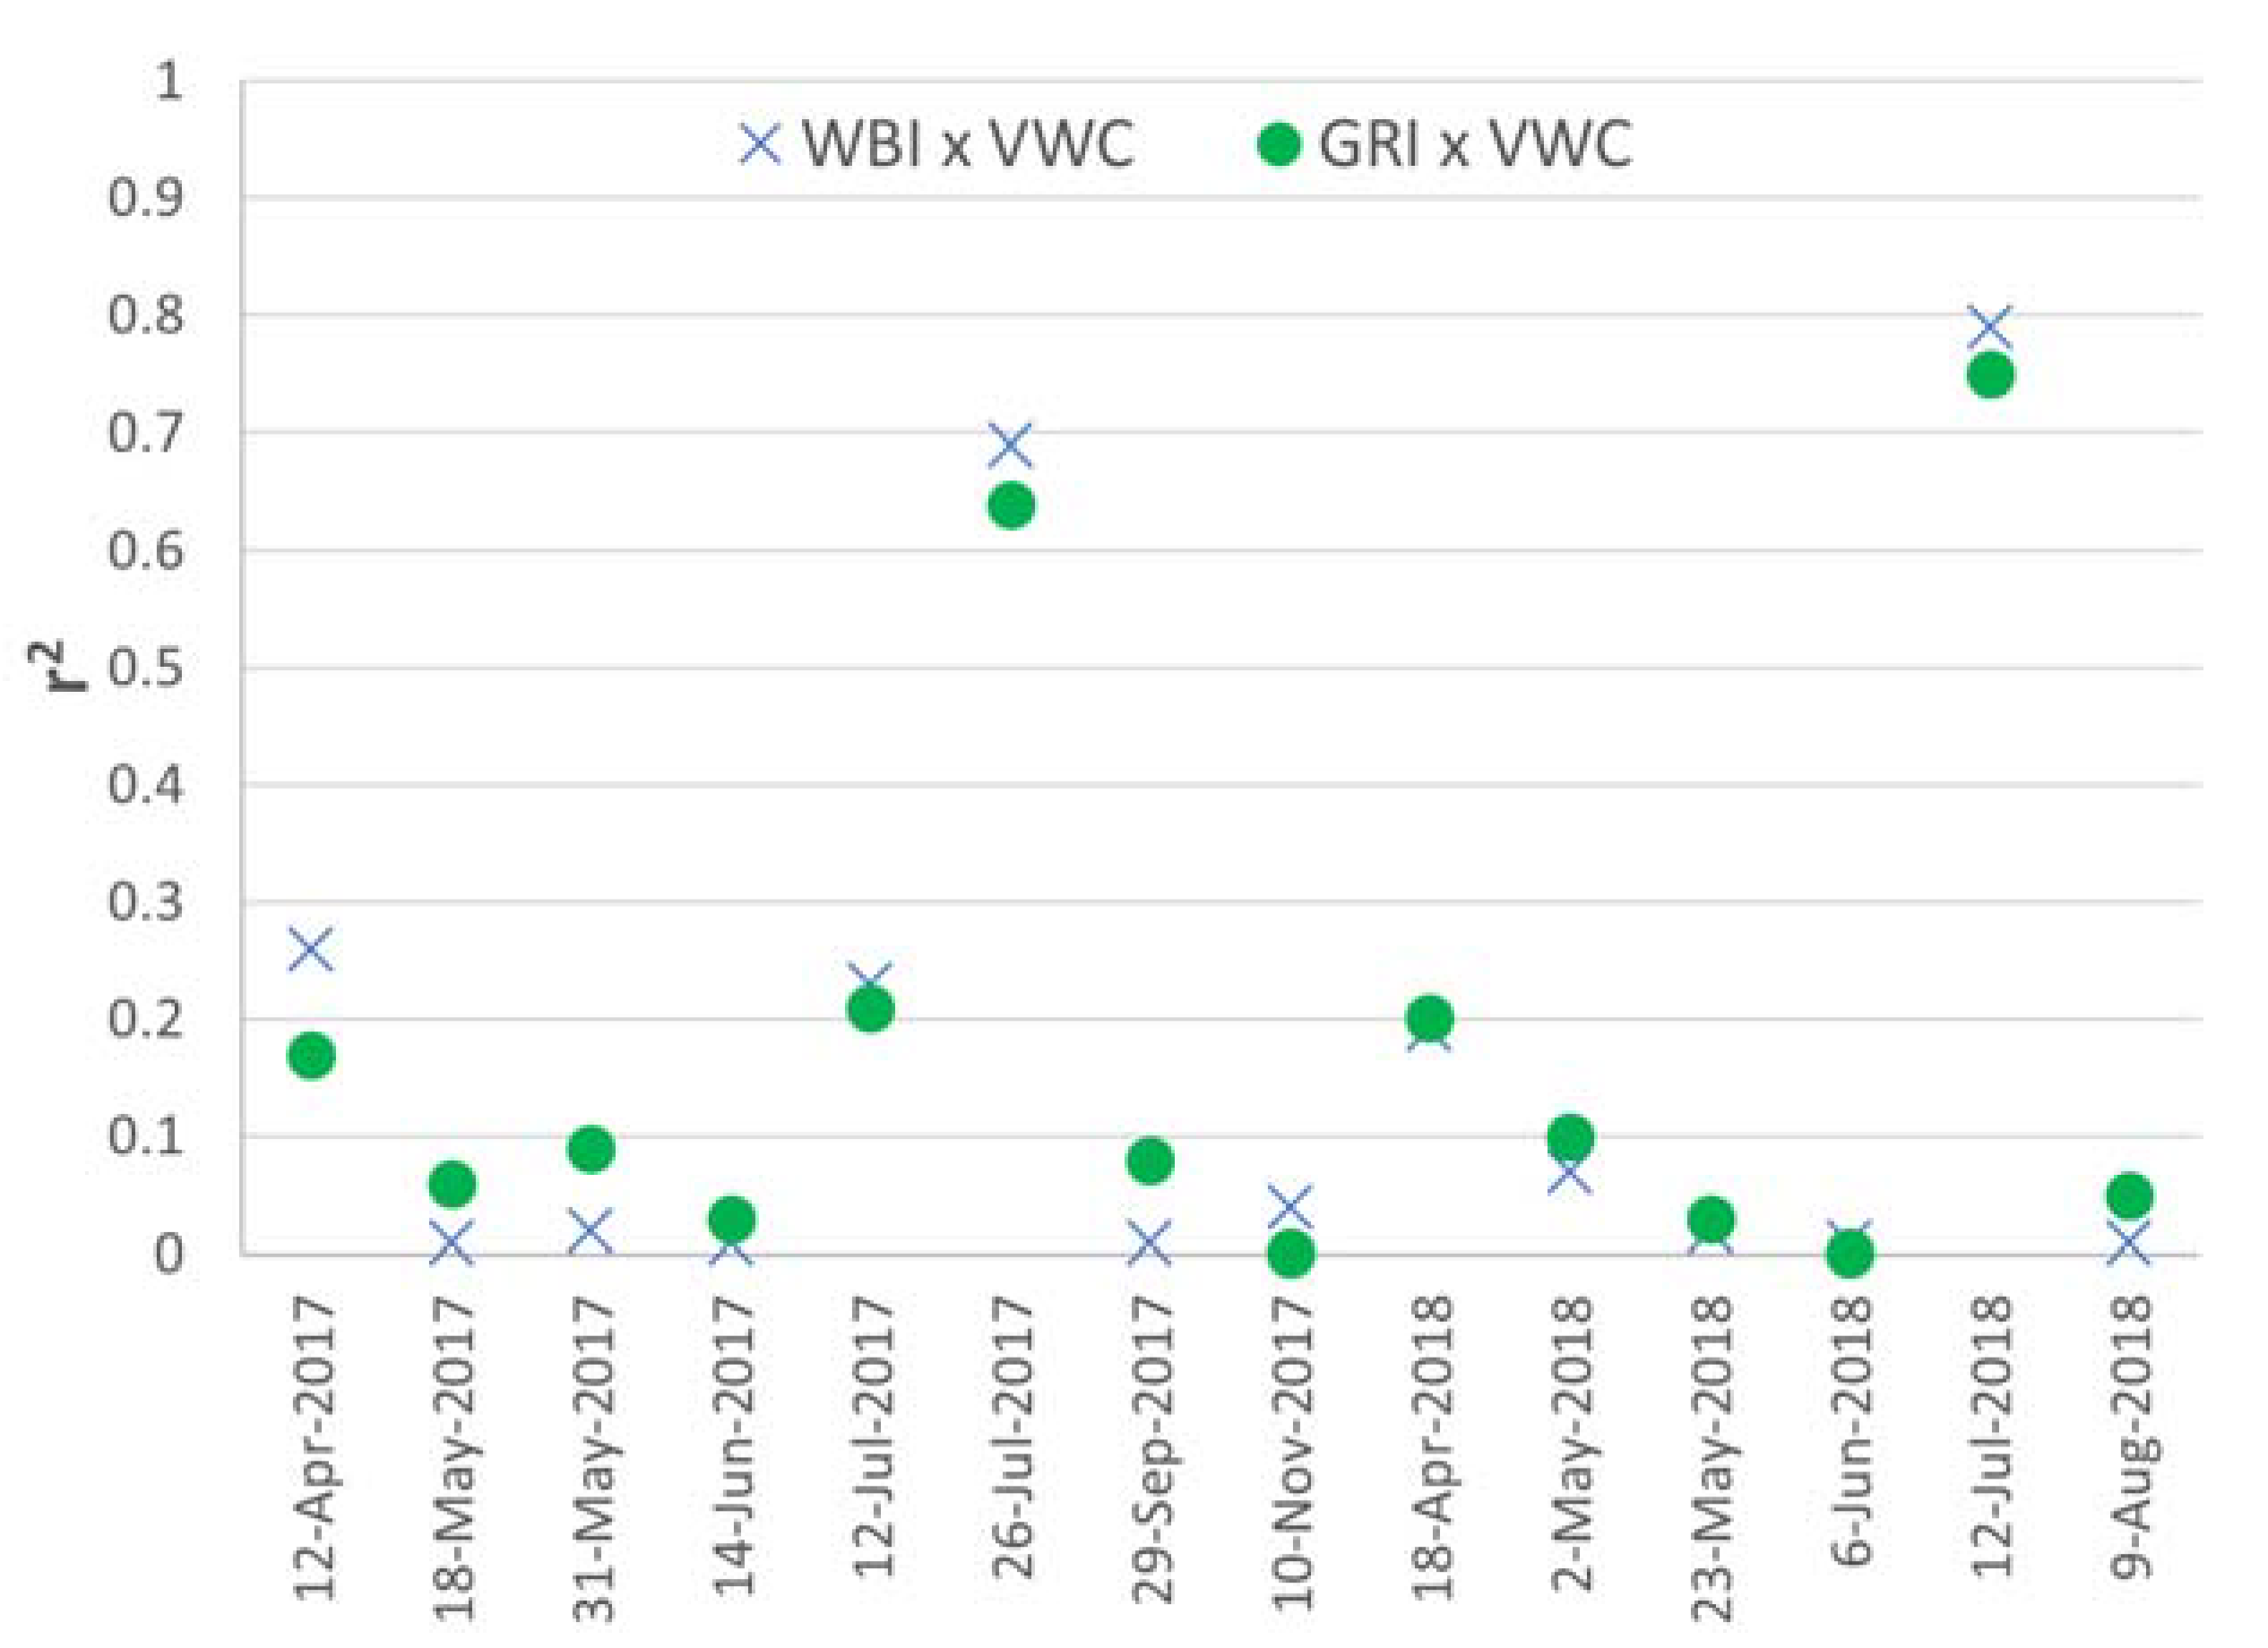
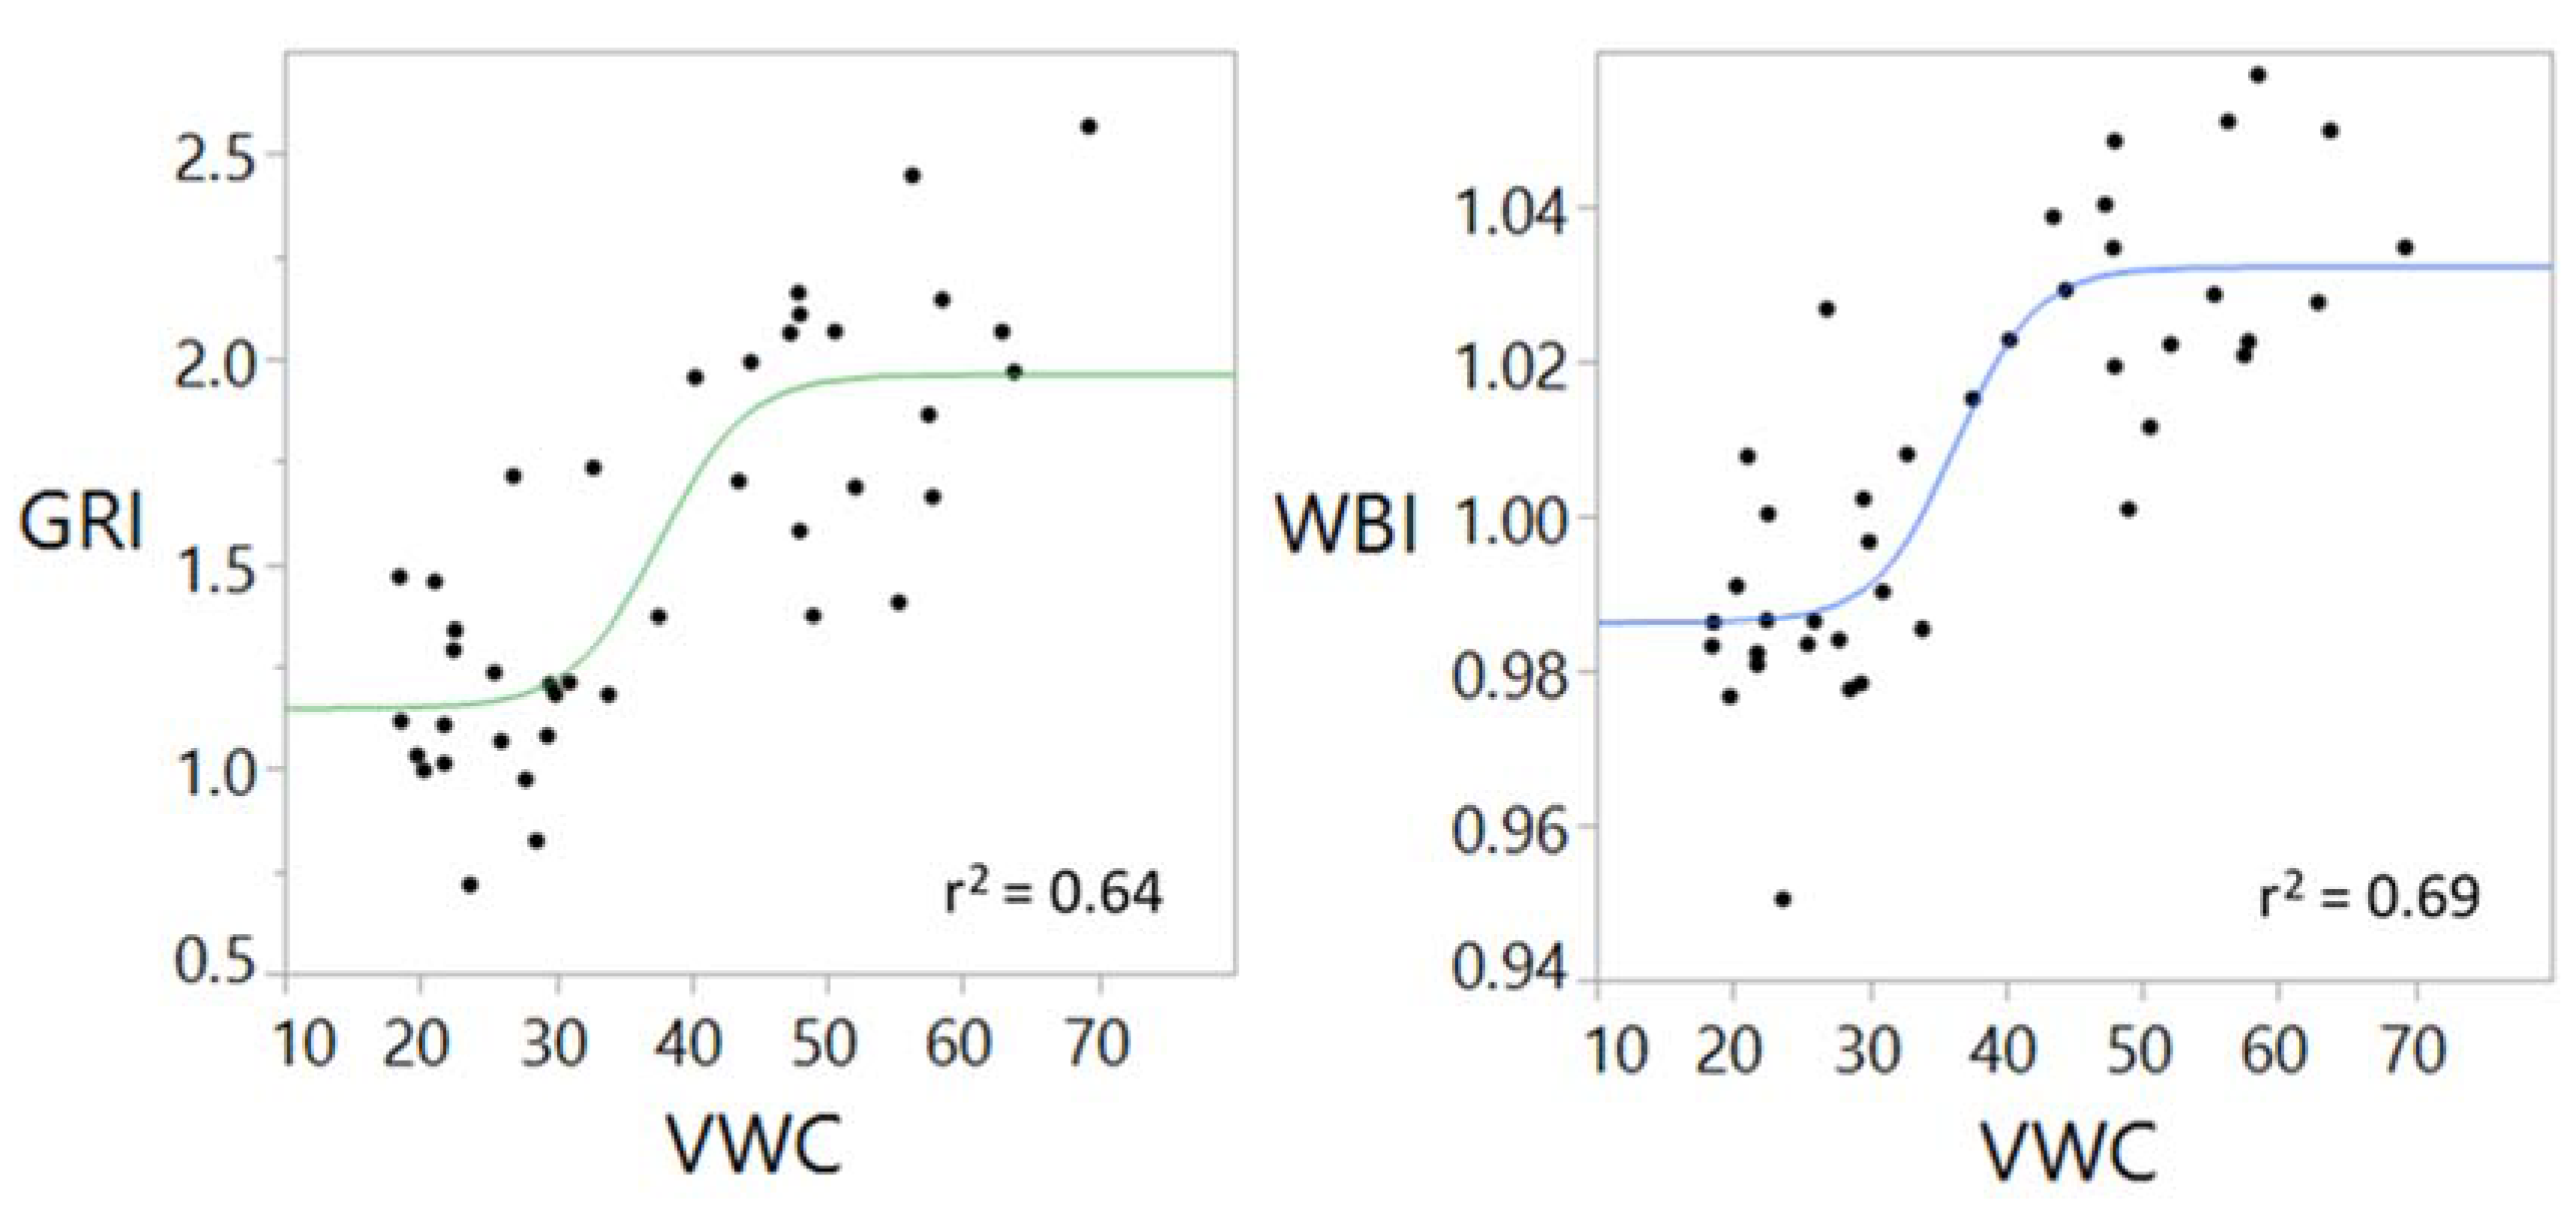
Nonlinear regression using a four-parameter logistic of WBI and GRI by date provides evidence that these indices can be used as a soil moisture management tool once relationships between spectral reflectance and soil and turfgrass parameters have been fully established. While WBI continues to be a narrowband index that is closely associated with drought stress, we also examined the GRI as a cheaper alternative to WBI with more immediate practical application. In 2017, as drought is imposed in early summer the WBI and GRI have low correlation to soil VWC (Figure 3). As the soil dries down, the relationship between the indices and VWC increases and the strongest relationship for both WBI (r2 = 0.69) and GRI (r2 = 0.64) occurs at the maximum drought day (26 July 2017) (Figure 4). This agrees with Figure 2 where increased variability of data provided stronger relationships. Nonlinear four parameter logistic regression indicates that the inflection point occurs at 36% soil VWC for WBI and 38% soil VWC for GRI. After this date, irrigation was applied to all plots and the relationship between indices and soil VWC was no longer significant (p > 0.15–0.84) for the remainder of 2017. A similar trend was observed in 2018 (Figure 3). During dates of limited water stress, there is a lack of strong correlation between indices. The greatest water stress date measured in 2018 (12 July 2018) indicated the strongest relationship of all dates measured (WBI: r2 = 0.79; GRI: r2 = 0.75) (Figure 5). Nonlinear four-parameter logistic regression indicates that the inflection point occurs at 32% soil VWC for both WBI and GRI. The results from 2017 and 2018 suggest that the onset of drought stress in tall fescue around 32–38% soil VWC, meaning that the soil VWC should be maintained above this level to prevent drought stress for tall fescue in a clay soil. Indices were separated by date as the pooled data for both irrigation treatments across all dates resulted in weak relationships for WBI (r2 = 0.20) and GRI (r2 = 0.21) to soil VWC.
We believe that with increased sampling frequency and data points, predicting water stress prior to the onset of visible symptoms could be accomplished using indices such as WBI and GRI. This was observed in a greenhouse trial by Roberson [27], where WBI and GRI detected moisture stress 27 h before NDVI. More research into validating the GRI as a water stress predictor should be prioritized as it is a far cheaper option compared to WBI. Determining turfgrass quality reduction by using indices in combination such as the NDVIcc and WBI or GRI can potentially provide indication of stress such as drought stress or quality reductions due to other stresses such as fertility.
3.5. Fertility Effects on Tall Fescue Responses, Soil Volumetric Water Content, and Spectral Indices
Fertility treatment affected all measured turfgrass and soil variables (Table 2). Only indices measured by the multispectral Crop Circle ACS-430 detected significant differences among fertility amendments (Table 3). This provides further evidence that more information can be obtained from a radiometer that can cover a large area in a cost-effective manner. Biosolids-based amendments applied at the agronomic N rate (BBN, CBN, and DBN) resulted in increased turfgrass quality, biomass, and tissue N accumulation compared to BBP and FER in 2017 (Table 8). In the following year, BBN and CBN had yielded the greater turfgrass quality, biomass, and tissue N accumulation. The improved tall fescue response from the BBN, CBN, and DBN amendments is most likely a result of a long-term accumulation of benefits (e.g., slow release of nutrients and reduced soil bulk density) derived from multiple applications of organic matter and organic N inputs beginning in 2013 [41].
The NDVIcc and RVIcc response to fertility treatment was similar to the turfgrass fertility response trends (Table 8). The NDVIcc measurements matched the biomass response of 2017, where BBN, CBN, and DBN had increased measured response by NDVIcc (0.75, 0.76, and 0.75, respectively) and lowered measurement response for BBP and FER (0.70 and 0.68, respectively). The RVIcc measurements matched and were strongly correlated (r = 0.51–0.92) to the tissue N accumulation of 2017, where BBN and CBN had increased measured response by RVIcc and lowered measurement response in BBP and FER (Table 8 and Table 9). The NDVIcc was unable to detect differences between fertility treatments in 2018, whereas RVIcc measurement response was similar to the trends observed in turfgrass parameters (Table 8). This provides further evidence that the RVI is a better option for established turfgrass systems [47].
Soil VWC was greatest in FER and BBP during 2017 (Table 8). This most likely relates to the tall fescue responses observed in 2017. The FER and BBP had the lowest biomass and quality ratings, suggesting that water was remaining in the soil. This contrasts to the BBN, CBN, and DBN amendments that had increased biomass and quality, suggesting that water was translocated from the soil pores to the leaf tissue. In 2018, only the BBN resulted in lower soil VWC despite similar values reported in 2017. Greater variability in the data is a possible explanation for the muted response in 2018 soil VWC. Increased strength between indices and soil VWC relationships were observed in 2018 (r = 0.66–0.78) despite the lack of significant difference in soil VWC during 2018 (Table 8 and Table 9). This data contributes to the idea that NDVI and RVI are not able to adequately differentiate the cause of the plant response (e.g., soil moisture vs. fertility) [16].
3.6. Practical Management Implications
Our data shows the need for continuous measurements across turfgrass systems to provide an adequate spatial representation as opposed to limited data collection points. Collecting spectral reflectance data at different heights, including the use of unmanned aerial vehicles, and direct measurements of turfgrass and soil parameters for validation should be conducted in turfgrass research to enable faster data collection over larger areas and continue the development of spectral indices’ relationships to measured variables. Our data contributes to this growing dataset that shows how spectral indices could be used to monitor drought stress. Specifically, our data shows tall fescue spectral response under heavy clay soils, which is a prevalent turfgrass-soil system in the transition zone of the United States. Spectral reflectance of various turfgrasses grown on varying soils types should respond differently when subjected to insufficient moisture availability [27]. Despite the strong correlation of WBI to soil moisture stress, it requires narrowband reflectance which increases costs and limits the number of samples collected. The GRI may be calculated using simple digital imagery. This allows for a more robust and rapid dataset collection across larger surfaces that may yield quicker development of vegetation indices relationships to measured variables.
4. Conclusions
Turfgrass management strategies that reduce water inputs and maintain turfgrass quality are needed for landowners and turfgrass managers. This research determined the value of spectral reflectance data collected from handheld hyperspectral and mobile multispectral radiometers as management tools to detect water and nutrient stress in turfgrass. In almost all responses measured, the multispectral radiometer outperformed the hyperspectral radiometer for evaluating moisture and nutrient relationships due to increased data collection. Spectral indices were best for detecting differences in turfgrass and soil responses when there was stressed and well-maintained turfgrass tissue. This variability was essential to form strong relationships between spectral indices and turfgrass and soil responses. Water stress was best determined using the water band index and green-to-red ratio index. The strong relationships to soil volumetric water content suggests that these indices can be used at the field scale as a potential tool in turfgrass water management. Continued research using the water band index and green-to-red ratio index with ground validation measurements should be conducted to improve relationships and determine soil volumetric water contents that should be maintained before visible drought stress. The detection of differences as a result of N fertility source was only able to be captured by the increased data collection from the mobile multispectral radiometer. The simple ratio vegetation index was best correlated to growth and quality of the established turfgrass stands. Increased sampling frequency and data collection of various turfgrass-soil systems should advance the turfgrass industry and managers in their ability to reduce their water usage and maintain turfgrass quality using spectral indices.
Author Contributions
Conceptualization, M.J.B., D.S.M., and G.E.; methodology, M.J.B. and D.S.M.; formal analysis, M.J.B.; data curation, M.J.B.; writing—original draft preparation, M.J.B.; writing—review and editing, D.S.M. and D.S.M.; funding acquisition, G.E.
Funding
This research was funded by the Virginia Agricultural Experiment Station and the Hatch Program of the National Institute of Food and Agriculture, USDA.
Acknowledgments
The authors would like to thank DC Water and the Metropolitan Washington Council of Governments for funding this research. We are appreciative of the Livingston composting facility (Spotsylvania County, VA, USA) for supplying biosolids products. The authors would also like to thank our Virginia Tech colleagues Travis Roberson, Benjamin Smith, and Jonathan Dickerson for their contributions in data collection and experimental site maintenance.
Conflicts of Interest
The authors declare no conflict of interest. The funders had no role in the design of the study; in the collection, analyses, or interpretation of data; in the writing of the manuscript, or in the decision to publish the results.
References
- Milesi, C.; Running, S.W.; Elvidge, C.D.; Dietz, J.B.; Tuttle, B.T.; Nemani, R.R. Mapping and Modeling the Biogeochemical Cycling of Turf Grasses in the United States. Environ. Manag. 2005, 36, 426–438. [Google Scholar] [CrossRef] [PubMed]
- Ervin, E.H.; Koski, A.J. Drought avoidance aspects and crop coefficients of Kentucky bluegrass and tall fescue turfs in the semiarid west. Crop Sci. 1998, 38, 788–795. [Google Scholar] [CrossRef]
- Kopec, D.; Shearman, R.; Riordan, T. Evapotranspiration of tall fescue turf. Hort. Sci. 1988, 23, 300–301. [Google Scholar]
- Carrow, R.N. Drought resistance aspects of turfgrasses in the southeast: Evapotranspiration and crop coefficients. Crop Sci. 1995, 35, 1685–1690. [Google Scholar] [CrossRef]
- Feldhake, C.; Danielson, R.; Butler, J. Turfgrass Evapotranspiration. I. Factors Influencing Rate in Urban Environments 1. Agron. J. 1983, 75, 824–830. [Google Scholar] [CrossRef]
- Ervin, E.H. Performance of Kentucky Bluegrass, Tall Fescue and Buffalograss under Line Source Irrigation. Ph.D. Thesis, Colorado State University, Colorado, CA, USA, 1995. [Google Scholar]
- Broner, I.; Law, R. Evaluation of a modified atmometer for estimating reference ET. Irrig. Sci. 1991, 12, 21–26. [Google Scholar] [CrossRef]
- Fontaine, T.A.; Todd, D.E., Jr. Measuring evaporation with ceramic bellani plate atmometers. JAWRA J. Am. Water Resour. Assoc. 1993, 29, 785–795. [Google Scholar] [CrossRef]
- Krum, J.; Carrow, R.; Karnok, K. Spatial mapping of complex turfgrass sites: Site-specific management units and protocols. Crop Sci. 2010, 50, 301–315. [Google Scholar] [CrossRef]
- Gatlin, R. A giant leap forward: How soil moisture meters are changing the game of putting green irrigation. USGA Green Sect. Rec. 2011, 49, 1–3. [Google Scholar]
- Dukes, M.; Scholberg, J. Soil moisture controlled subsurface drip irrigation on sandy soils. Appl. Eng. Agric. 2005, 21, 89–101. [Google Scholar] [CrossRef]
- Kieffer, D.L.; O’Connor, T.S. Managing soil moisture on golf greens using a portable wave reflectometer. In Proceedings of the 2007 28th Annual Irrigation Show, San Diego, CA, USA, 9–11 December 2007. [Google Scholar]
- Straw, C.M.; Grubbs, R.A.; Tucker, K.A.; Henry, G.M. Handheld versus mobile data acquisitions for spatial analysis of natural turfgrass sports fields. Hort. Sci. 2016, 51, 1176–1183. [Google Scholar] [CrossRef]
- Walker, J.P.; Willgoose, G.R.; Kalma, J.D. In situ measurement of soil moisture: A comparison of techniques. J. Hydrol. 2004, 293, 85–99. [Google Scholar] [CrossRef]
- Kirkham, M.B. Principles of Soil and Plant Water Relations; Academic Press: Cambridge, MA, USA, 2014. [Google Scholar]
- Carrow, R.N.; Krum, J.M.; Flitcroft, I.; Cline, V. Precision turfgrass management: Challenges and field applications for mapping turfgrass soil and stress. Precis. Agric. 2010, 11, 115–134. [Google Scholar] [CrossRef]
- Bell, G.E.; Xiong, X. The history, role, and potential of optical sensing for practical turf management. In Handbook of Turfgrass Management and Physiology; CRC Press: Boca Raton, FL, USA, 2007; pp. 641–660. [Google Scholar]
- Trenholm, L.; Carrow, R.; Duncan, R. Relationship of multispectral radiometry data to qualitative data in turfgrass research. Crop Sci. 1999, 39, 763–769. [Google Scholar] [CrossRef]
- Eismann, M.T. Hyperspectral Remote Sensing; SPIE: Bellingham, WA, USA, 2012. [Google Scholar]
- Blackburn, G.A. Hyperspectral remote sensing of plant pigments. J. Exp. Bot. 2006, 58, 855–867. [Google Scholar] [CrossRef] [PubMed] [Green Version]
- Morin, M.; Lawrence, R.; Repasky, K.S.; Sterling, T.M.; McCann, C.; Powell, S. Agreement analysis and spatial sensitivity of multispectral and hyperspectral sensors in detecting vegetation stress at management scales. J. Appl. Remote Sens. 2017, 11, 1–18. [Google Scholar] [CrossRef]
- Carter, G.A. Responses of leaf spectral reflectance to plant stress. Am. J. Bot. 1993, 80, 239–243. [Google Scholar] [CrossRef]
- Carter, G.A.; Cibula, W.G.; Miller, R.L. Narrow-band Reflectance Imagery Compared with ThermalImagery for Early Detection of Plant Stress. J. Plant Physiol. 1996, 148, 515–522. [Google Scholar] [CrossRef]
- Carter, G.A.; Miller, R.L. Early detection of plant stress by digital imaging within narrow stress-sensitive wavebands. Remote Sens. Environ. 1994, 50, 295–302. [Google Scholar] [CrossRef]
- Smith, K.; Steven, M.; Colls, J. Use of hyperspectral derivative ratios in the red-edge region to identify plant stress responses to gas leaks. Remote Sens. Environ. 2004, 92, 207–217. [Google Scholar] [CrossRef]
- McCall, D.; Zhang, X.; Sullivan, D.; Askew, S.; Ervin, E. Enhanced soil moisture assessment using narrowband reflectance vegetation indices in creeping bentgrass. Crop Sci. 2017, 57, S161–S168. [Google Scholar] [CrossRef]
- Roberson, T.L. Improving Soil Moisture Assessment of Turfgrass Systems Utilizing Field Radiometry; Virginia Tech: Blacksburg, VA, USA, 2019. [Google Scholar]
- Fitz–Rodríguez, E.; Choi, C. Monitoring turfgrass quality using multispectral radiometry. Trans. ASAE 2002, 45, 865. [Google Scholar] [CrossRef]
- Bell, G.; Martin, D.; Wiese, S.; Dobson, D.; Smith, M.; Stone, M.; Solie, J. Vehicle-mounted optical sensing. Crop Sci. 2002, 42, 197–201. [Google Scholar] [CrossRef] [PubMed]
- Bremer, D.J.; Lee, H.; Su, K.; Keeley, S.J. Relationships between normalized difference vegetation index and visual quality in cool-season turfgrass: II. Factors affecting NDVI and its component reflectances. Crop Sci. 2011, 51, 2219–2227. [Google Scholar] [CrossRef]
- Jiang, Y.; Carrow, R.N. Assessment of narrow-band canopy spectral reflectance and turfgrass performance under drought stress. Hort. Sci. 2005, 40, 242–245. [Google Scholar] [CrossRef]
- Jiang, Y.; Carrow, R.N. Broadband spectral reflectance models of turfgrass species and cultivars to drought stress. Crop Sci. 2007, 47, 1611–1618. [Google Scholar] [CrossRef]
- Jiang, Y.; Liu, H.; Cline, V. Correlations of leaf relative water content, canopy temperature, and spectral reflectance in perennial ryegrass under water deficit conditions. Hort. Sci. 2009, 44, 459–462. [Google Scholar] [CrossRef]
- Johnsen, A.R.; Horgan, B.P.; Hulke, B.S.; Cline, V. Evaluation of remote sensing to measure plant stress in creeping bentgrass (Agrostis stolonifera L.) fairways. Crop Sci. 2009, 49, 2261–2274. [Google Scholar] [CrossRef]
- Lee, H.; Bremer, D. Evaluation of cool-season turfgrasses quality with multispectral radiometry. In Proceedings of the ASA-CSSA-SSSA International Annual Meetings, Madison, WI, USA, 12–16 November 2006. [Google Scholar]
- Stiegler, J.; Bell, G.; Maness, N.; Smith, M. Spectral detection of pigment concentrations in creeping bentgrass golf greens. Int. Turf. Soc. Res. J. 2005, 10, 818–825. [Google Scholar]
- Murphy, J.T.; Owensby, C.E.; Ham, J.M.; Coyne, P.I. Estimation of vegetative characteristics by remote sensing. Acad. Res. J. Agric. Sci. Res. 2014, 2, 47–56. [Google Scholar] [CrossRef]
- Peñuelas, J.; Filella, I.; Biel, C.; Serrano, L.; Save, R. The reflectance at the 950–970 nm region as an indicator of plant water status. Int. J. Remote Sens. 1993, 14, 1887–1905. [Google Scholar] [CrossRef]
- Daly, C.; Widrlechner, M.P.; Halbleib, M.D.; Smith, J.I.; Gibson, W.P. Development of a new USDA plant hardiness zone map for the United States. J. Appl. Meteorol. Climatol. 2012, 51, 242–264. [Google Scholar] [CrossRef]
- National Oceanic and Atmospheric Administration. Unique Climatic Data; NOAA: Silver Spring, MD, USA, 2019.
- Badzmierowski, M.J.; Evanylo, G.K.; Ervin, E.H.; Boyd, A.; Brewster, C. Biosolids-Based Amendments Improve Tall Fescue Establishment and Urban Soils. Crop Sci. 2019, 59, 1273–1284. [Google Scholar] [CrossRef]
- Birth, G.S.; McVey, G.R. Measuring the Color of Growing Turf with a Reflectance Spectrophotometer 1. Agron. J. 1968, 60, 640–643. [Google Scholar] [CrossRef]
- Gamon, J.; Surfus, J. Assessing leaf pigment content and activity with a reflectometer. New Phytol. 1999, 143, 105–117. [Google Scholar] [CrossRef]
- Rouse, J.W., Jr.; Haas, R.; Schell, J.; Deering, D. Monitoring Vegetation Systems in the Great Plains with ERTS; NASA: Washington, DC, USA, 1974; Volume 1, pp. 309–317.
- Morris, K. Guidelines for using NTEP trial data. Golf Course Manag. 2000, 68, 64–69. [Google Scholar]
- Garbulsky, M.F.; Peñuelas, J.; Gamon, J.; Inoue, Y.; Filella, I. The photochemical reflectance index (PRI) and the remote sensing of leaf, canopy and ecosystem radiation use efficiencies: A review and meta-analysis. Remote Sens. Environ. 2011, 115, 281–297. [Google Scholar] [CrossRef]
- McCurdy, J.; Baldwin, C.; Philley, H.; Stewart, B.; Ruffin, J. Comparison of visual rating techniques and spectral reflectance characteristics during turf variety trial evaluations. In Proceedings of the ASA, CSSA, and SSSA International Annual Meeting, C05 Turfgrass Science, Long Beach, CA, USA, 31 October–6 November 2014. [Google Scholar]
- Gausman, H.W. Reflectance of leaf components. Remote Sens. Environ. 1977, 6, 1–9. [Google Scholar] [CrossRef]
- DaCosta, M.; Wang, Z.; Huang, B. Physiological adaptation of Kentucky bluegrass to localized soil drying. Crop Sci. 2004, 44, 1307–1314. [Google Scholar] [CrossRef]
Figure 1.
Monthly air temperature (a) and cumulative monthly precipitation (b) as measured by a local National Oceanic and Atmospheric Administration weather station (March 2017 to August 2018) vs. the 30-year mean for Blacksburg, VA, USA.
Figure 1.
Monthly air temperature (a) and cumulative monthly precipitation (b) as measured by a local National Oceanic and Atmospheric Administration weather station (March 2017 to August 2018) vs. the 30-year mean for Blacksburg, VA, USA.

Figure 2.
Example of nonlinear four parameter logistic regression used for the normalized difference vegetation index measured by the Crop Circle ACS-430 (NDVIcc) on the individual dates of 2 May 2018 and 12 July 2018.
Figure 2.
Example of nonlinear four parameter logistic regression used for the normalized difference vegetation index measured by the Crop Circle ACS-430 (NDVIcc) on the individual dates of 2 May 2018 and 12 July 2018.

Figure 3.
Nonlinear four parameter logistic regression between soil volumetric water content (VWC) and the narrowband water band index (WBI) and the green-to-red ratio index (GRI) by date.
Figure 3.
Nonlinear four parameter logistic regression between soil volumetric water content (VWC) and the narrowband water band index (WBI) and the green-to-red ratio index (GRI) by date.

Figure 4.
Nonlinear four parameter logistic regression for the green-to-red ratio index (GRI) and the water band index (WBI) compared to soil volumetric water content (VWC) for 26 July 2017.
Figure 4.
Nonlinear four parameter logistic regression for the green-to-red ratio index (GRI) and the water band index (WBI) compared to soil volumetric water content (VWC) for 26 July 2017.

Figure 5.
Nonlinear four parameter logistic regression for the green-to-red ratio index (GRI) and the water band index (WBI) compared to soil volumetric water content (VWC) for 12 July 2018.
Figure 5.
Nonlinear four parameter logistic regression for the green-to-red ratio index (GRI) and the water band index (WBI) compared to soil volumetric water content (VWC) for 12 July 2018.


Table 1.
Listing of vegetation indices investigated for correlation to tall fescue quality, biomass, tissue N accumulation, and soil volumetric water content.
Table 1.
Listing of vegetation indices investigated for correlation to tall fescue quality, biomass, tissue N accumulation, and soil volumetric water content.
| Acronym | Index Name 1 | Formula Used | Citation |
|---|---|---|---|
| NDVI | Normalized difference vegetation index | (NIR − R)/(NIR + R) | Rouse et al. 1974 2 |
| RVI | Simple ratio vegetation index | NIR/R | Birth and McVey 1968 |
| GRI | Green to red ratio index | R550/R670 | Gamon and Surfus 1999 |
| WBI | Water band index | R900/R970 | Penuelas et al. 1993 |
1 NDVI and RVI were collected using the Crop Circle ACS-430 and hyperspectral radiometer. The green-to-red ratio index (GRI) and water band index (WBI) was only measured using the hyperspectral radiometer as the ACS-430 model cannot measure the required wavelengths; 2 Formulas were modified to use spectra equivalent to filters used on the Crop Circle ACS-430 multispectral radiometer (red = 670 nm, red edge = 730 nm, and near infrared = 780 nm).
Table 2.
Mixed model effects p-values for tall fescue quality, biomass, leaf tissue N accumulation, and soil volumetric water content (VWC).
Table 2.
Mixed model effects p-values for tall fescue quality, biomass, leaf tissue N accumulation, and soil volumetric water content (VWC).
| Source | Tall Fescue Quality | Tall Fescue Biomass | Tissue N Accumulation | Soil VWC |
|---|---|---|---|---|
| Irrigation (Irr.) | <0.0001 | 0.002 | 0.0002 | <0.0001 |
| Fertility (Fert.) | <0.0001 | 0.0003 | 0.0007 | <0.0001 |
| Block | 0.025 | --- | --- | <0.0001 |
| Year | --- | 0.0002 | --- | --- |
| Irr. × Fert. | --- | --- | --- | --- |
| Irr. × Block | --- | --- | --- | --- |
| Irr. × Year | 0.002 | --- | --- | --- |
| Irr. × Fert. × Block | --- | --- | --- | --- |
| Irr. × Fert. × Year | --- | --- | --- | --- |
| Irr. × Block × Year | --- | --- | --- | --- |
| Fert. × Block | --- | --- | --- | --- |
| Fert. × Year | --- | --- | --- | --- |
| Fert. × Block × Year | --- | --- | --- | --- |
| Block × Year | --- | --- | --- | --- |
| Irr. × Fert. × Block × Year | --- | --- | --- | --- |
Table 3.
Mixed model effects p-values for spectral reflectance vegetation indices using a multispectral and hyperspectral radiometer for all dates of the trial.
Table 3.
Mixed model effects p-values for spectral reflectance vegetation indices using a multispectral and hyperspectral radiometer for all dates of the trial.
| Source | NDVI 1 | NDVICC | RVI | RVICC | GRI | WBI |
|---|---|---|---|---|---|---|
| Irrigation (Irr.) | <0.0001 | <0.0001 | <0.0001 | <0.0001 | 0.0007 | 0.0006 |
| Fertility (Fert.) | --- | 0.016 | --- | 0.012 | --- | --- |
| Block | --- | --- | --- | --- | --- | --- |
| Year | --- | 0.0004 | --- | <0.0001 | --- | --- |
| Irr. × Fert. | --- | --- | --- | --- | --- | --- |
| Irr. × Block | --- | --- | --- | --- | --- | --- |
| Irr. × Year | --- | --- | --- | --- | --- | --- |
| Irr. × Fert. × Block | --- | --- | --- | --- | --- | --- |
| Irr. × Fert. × Year | --- | --- | --- | --- | --- | --- |
| Irr. × Block × Year | --- | --- | --- | --- | --- | --- |
| Fert. × Block | --- | --- | --- | --- | --- | --- |
| Fert. × Year | --- | --- | --- | 0.044 | --- | --- |
| Fert. × Block × Year | --- | --- | --- | --- | --- | --- |
| Block × Year | --- | --- | --- | --- | --- | --- |
| Irr. × Fert. × Block × Year | --- | --- | --- | --- | --- | --- |
1 NDVI, normalized difference vegetation index; RVI, simple ratio vegetation index; GRI, green-to-red ratio index; WBI, water band index. Multispectral Crop Circle ACS-430 calculated indices represented by “cc”. Indices not denoted with “cc” were calculated by the hyperspectral radiometer.
Table 4.
Irrigation strategies effects on turfgrass biomass, leaf tissue N accumulation, and visual quality of tall fescue. Means reported are the average among the sampling dates for each year. Sampling was conducted between April and October for 2017 and between April and August of 2018.
Table 4.
Irrigation strategies effects on turfgrass biomass, leaf tissue N accumulation, and visual quality of tall fescue. Means reported are the average among the sampling dates for each year. Sampling was conducted between April and October for 2017 and between April and August of 2018.
| Tall fescue Quality 1 | Biomass | Tissue N Accumulation 2 | Soil VWC 3 | |||||
|---|---|---|---|---|---|---|---|---|
| Treatment | 2017 | 2018 | 2017 | 2018 | 2017 | 2018 | 2017 | 2018 |
| kg ha−1 | kg ha−1 | % | ||||||
| 0% ET 4 | 6.1b 5 | 5.8b | 80.8b | 102b | 3.0b | 3.5b | 40b | 39b |
| 80% ET | 6.6a | 7.2a | 114a | 156a | 4.8a | 5.7a | 49a | 51a |
1 Visual quality ratings are rated on a scale of 1 to 9, where 9 indicates an ideal turfgrass stand, 6 is the minimum acceptable quality, and 1 indicates the turfgrass is dormant or dead; 2 Based on the product of tissue N% and biomass; 3 Soil volumetric water content (VWC) determined using time-domain reflectometry TDR; 4 0% evapotranspiration (ET), no irrigation was applied during summer stress months unless crop death was imminent and 80% ET, irrigation was applied at 80% of measured evapotranspiration. 5 Means in the same column followed by the same lowercase letter are not significantly different at p < 0.05.
Table 5.
Irrigation strategies effects on spectral indexes. Means reported are the average among the sampling dates for each year. Sampling was conducted between April and October for 2017 and between April and August of 2018.
Table 5.
Irrigation strategies effects on spectral indexes. Means reported are the average among the sampling dates for each year. Sampling was conducted between April and October for 2017 and between April and August of 2018.
| NDVI 1 | NDVIcc | RVI | RVIcc | GRI | WBI | |||||||
|---|---|---|---|---|---|---|---|---|---|---|---|---|
| Treatment | 2017 | 2018 | 2017 | 2018 | 2017 | 2018 | 2017 | 2018 | 2017 | 2018 | 2017 | 2018 |
| 0% ET 2 | 0.69b 3 | 0.69b | 0.70b | 0.70b | 7.5b | 7.2b | 6.5b | 7.5b | 1.8b | 1.7b | 1.02b | 1.02b |
| 80% ET | 0.73a | 0.77a | 0.76a | 0.83a | 8.2a | 9.2a | 8.4a | 11a | 1.9a | 1.9a | 1.03a | 1.03a |
1 NDVI, normalized difference vegetation index; RVI, simple ratio vegetation index; GRI, green-to-red ratio index; WBI, water band index. Multispectral Crop Circle ACS-430 calculated indices represented by “cc”. Indices not denoted with “cc” were calculated by the hyperspectral radiometer; 2 0% evapotranspiration (ET), no irrigation was applied during summer stress months unless crop death was imminent and 80% ET, irrigation was applied at 80% of measured evapotranspiration; 3 Means in the same column followed by the same lowercase letter are not significantly different at p < 0.05.
Table 6.
Pearson correlation coefficients (r) between turfgrass quality, tissue N content, tissue biomass, soil volumetric water content (VWC), and vegetation indices derived from spectral reflectance of tall fescue grown in Blacksburg, VA utilizing two irrigation strategies.
Table 6.
Pearson correlation coefficients (r) between turfgrass quality, tissue N content, tissue biomass, soil volumetric water content (VWC), and vegetation indices derived from spectral reflectance of tall fescue grown in Blacksburg, VA utilizing two irrigation strategies.
| Turfgrass Quality | Biomass | Tissue N Accumulation (kg ha−1) | Soil VWC | |||||
|---|---|---|---|---|---|---|---|---|
| Index | 0% ET 1 | 80% ET | 0% ET | 80% ET | 0% ET | 80% ET | 0% ET | 80% ET |
| NDVI 2 | 0.75 * | 0.38 | 0.64 | 0.49 | 0.62 | 0.48 | 0.54 | NS |
| NDVICC | 0.81 | 0.63 | 0.70 | 0.75 | 0.68 | 0.70 | 0.49 | NS |
| RVI | 0.65 | 0.32 | 0.64 | 0.44 | 0.64 | 0.46 | 0.49 | NS |
| RVICC | 0.77 | 0.54 | 0.83 | 0.81 | 0.78 | 0.76 | 0.42 | NS |
| GRI | 0.70 | 0.24 | 0.64 | 0.29 | 0.62 | 0.30 | 0.54 | NS |
| WBI | 0.71 | 0.24 | 0.66 | 0.30 | 0.65 | 0.32 | 0.60 | 0.17 |
1 0% evapotranspiration (ET), no irrigation was applied during summer stress months unless crop death was imminent; 80% ET, irrigation was applied at 80% of measured evapotranspiration; 2 NDVI, normalized difference vegetation index; RVI, simple ratio vegetation index; GRI, green-to-red ratio index; WBI, water band index. Multispectral Crop Circle ACS-430 calculated indices represented by “cc”. Indices not denoted with “cc” were calculated by the hyperspectral radiometer; * All significant at p < 0.001 except for soil volumetric water content (VWC) × WBI 80% ET (p < 0.01) and those denoted as “NS” are not significant at p = 0.05.
Table 7.
Coefficient of determination (r2) of individual dates comparing hyperspectral and multispectral responses between vegetation indices and measured turfgrass parameters using a nonlinear regression four-parameter logistic model.
Table 7.
Coefficient of determination (r2) of individual dates comparing hyperspectral and multispectral responses between vegetation indices and measured turfgrass parameters using a nonlinear regression four-parameter logistic model.
| Index | 18 May 2017 | 14 June 2017 | 28 June 2017 | 12 July 2017 | 26 July 2017 | 16 August 2017 | 13 September 2017 | 29 September 2017 | 10 November 2017 | 18 April 2018 | 2 May 2018 | 23 May 2018 | 6 June 2018 | 19 June 2018 | 12 July 2018 | 19 July 2018 | 9 August 2018 |
|---|---|---|---|---|---|---|---|---|---|---|---|---|---|---|---|---|---|
| NDVI 1 × Turfgrass Quality (TQ) 2 | 0.06 | 0.16 | --- 3 | 0.26 | 0.69 | --- | --- | 0.22 | 0.01 | 0.04 | 0.04 | 0.11 | 0.20 | --- | 0.90 | --- | 0.27 |
| NDVIcc × TQ | 0.35 | 0.69 | 0.77 | 0.61 | 0.81 | 0.79 | 0.81 | 0.56 | --- | --- | 0.06 | 0.15 | 0.29 | 0.91 | 0.98 | 0.93 | 0.76 |
| RVI × Biomass 4 | --- | 0.11 | --- | 0.34 | 0.62 | --- | --- | 0.06 | 0.15 | 0.04 | --- | 0.32 | 0.33 | --- | 0.72 | --- | 0.34 |
| RVIcc × Biomass | --- | 0.81 | 0.84 | 0.83 | 0.85 | 0.84 | 0.93 | 0.64 | --- | --- | --- | 0.34 | 0.11 | 0.77 | 0.83 | --- | 0.61 |
1 NDVI, normalized difference vegetation index; RVI, simple ratio vegetation index. Multispectral Crop Circle ACS-430 calculated indices represented by “cc”. Indices not denoted with “cc” were calculated by the hyperspectral radiometer; 2 Relationship between turfgrass quality (TQ) and NDVI and NDVIcc by date; 3 Dashes indicate measurement unable to be taken on that date; 4 Relationship between tall fescue biomass and RVI and RVIcc by date.
Table 8.
Fertility amendments effects on turfgrass quality, biomass, leaf tissue N accumulation, soil volumetric water content (VWC), normalized vegetation index (NDVI) and simple ratio vegetation index (RVI). Means reported are the average among the sampling dates for each year. Sampling was conducted between April and October for 2017 and between April and August of 2018.
| Tall Fescue Quality 1 | Biomass | Tissue N Accumulation 2 | Soil VWC 3 | NDVIcc 4 | RVIcc | |||||||
|---|---|---|---|---|---|---|---|---|---|---|---|---|
| Treatment 5 | 2017 | 2018 | 2017 | 2018 | 2017 | 2018 | 2017 | 2018 | 2017 | 2018 | 2017 | 2018 |
| kg ha−1 | kg ha−1 | % | ||||||||||
| FER | 4.9d 6 | 5.7d | 54.5b | 90.0c | 2.1c | 2.9c | 49a | 48a | 0.68b | 0.75a | 5.9c | 8.67b |
| DBN | 6.7b | 6.5bc | 97.5a | 126b | 3.7b | 4.6ab | 46bc | 45a | 0.75a | 0.76a | 7.8b | 8.89ab |
| BBN | 7.4a | 7.0ab | 139a | 162a | 6.0a | 6.0a | 37d | 38b | 0.77a | 0.77a | 8.9a | 9.98ab |
| BBP | 5.6c | 6.2cd | 74.4b | 101bc | 2.9c | 3.4bc | 47ab | 47a | 0.70b | 0.76a | 6.4c | 9.33ab |
| CBN | 7.4a | 7.2a | 122a | 165a | 4.8ab | 6.0a | 44c | 45a | 0.76a | 0.78a | 8.5ab | 10.2a |
1 Visual quality ratings are rated on a scale of 1 to 9, where 9 indicates an ideal turfgrass stand, 6 is the minimum acceptable quality, and 1 indicates the turfgrass is dormant or dead; 2 Based on the product of tissue N% and biomass. 3 Soil volumetric water content determined using time-domain reflectometry TDR; 4 NDVI, normalized difference vegetation index; RVI, simple ratio vegetation index. Multispectral Crop Circle ACS-430 calculated indices represented by “cc”; 5 FER, annually applied synthetic N–P–K fertilizer; DBN, biosolids applied annually at an agronomic N rate; BBN, blended biosolids–sand–sawdust applied annually at an agronomic N rate; BBP, blended biosolids–sand–sawdust applied annually at an agronomic P rate plus supplemental fertilizer N; CBN, composted biosolids applied annually at an agronomic N rate; 6 Means in the same column followed by the same lowercase letter are not significantly different at p < 0.05.
Table 9.
Pearson correlation coefficients (r) between turfgrass quality, leaf tissue N accumulation, soil volumetric water content (VWC), and vegetation indices derived from traditional multispectral Crop Circle ACS-430 of tall fescue grown under five different fertility amendments in Blacksburg, VA.
| Turfgrass Quality | Tissue N Accumulation (kg ha−1) | Soil VWC | ||||||||||
|---|---|---|---|---|---|---|---|---|---|---|---|---|
| 2017 | 2018 | 2017 | 2018 | 2017 | 2018 | |||||||
| Index | NDVIcc 1 | RVIcc | NDVIcc | RVIcc | NDVIcc | RVIcc | NDVIcc | RVIcc | NDVIcc | RVIcc | NDVIcc | RVIcc |
| FER 2 | 0.68 * | 0.59 | 0.83 | 0.73 | 0.38 | 0.51 | NS | NS | NS | NS | 0.71 | 0.66 |
| BBN | 0.67 | 0.44 | 0.90 | 0.84 | 0.63 | 0.86 | 0.25 | 0.49 | 0.36 | 0.33 | 0.68 | 0.78 |
| BBP | 0.53 | 0.40 | 0.82 | 0.73 | 0.80 | 0.92 | −0.74 | −0.46 | 0.27 | NS | 0.70 | 0.76 |
| DBN | 0.41 | 0.23 | 0.87 | 0.82 | 0.66 | 0.86 | 0.46 | 0.59 | 0.39 | 0.30 | 0.66 | 0.70 |
| CBN | 0.47 | 0.30 | 0.87 | 0.82 | 0.72 | 0.91 | −0.43 | NS | 0.47 | 0.42 | 0.69 | 0.77 |
1 NDVI, normalized difference vegetation index; RVI, simple ratio vegetation index; 2 FER, annually applied synthetic N–P–K fertilizer; BBN, blended biosolids–sand–sawdust applied annually at an agronomic N rate; BBP, blended biosolids–sand–sawdust applied annually at an agronomic P rate plus supplemental fertilizer N; DBN, biosolids applied annually at an agronomic N rate; CBN, composted biosolids applied annually at an agronomic N rate; * All significant at p < 0.001 except those denoted as NS which are not significant at p = 0.05.
© 2019 by the authors. Licensee MDPI, Basel, Switzerland. This article is an open access article distributed under the terms and conditions of the Creative Commons Attribution (CC BY) license (http://creativecommons.org/licenses/by/4.0/).
Share and Cite
MDPI and ACS Style
Badzmierowski, M.J.; McCall, D.S.; Evanylo, G. Using Hyperspectral and Multispectral Indices to Detect Water Stress for an Urban Turfgrass System. Agronomy 2019, 9, 439. https://0-doi-org.brum.beds.ac.uk/10.3390/agronomy9080439
AMA Style
Badzmierowski MJ, McCall DS, Evanylo G. Using Hyperspectral and Multispectral Indices to Detect Water Stress for an Urban Turfgrass System. Agronomy. 2019; 9(8):439. https://0-doi-org.brum.beds.ac.uk/10.3390/agronomy9080439
Chicago/Turabian StyleBadzmierowski, Mike J., David S. McCall, and Gregory Evanylo. 2019. "Using Hyperspectral and Multispectral Indices to Detect Water Stress for an Urban Turfgrass System" Agronomy 9, no. 8: 439. https://0-doi-org.brum.beds.ac.uk/10.3390/agronomy9080439
Note that from the first issue of 2016, this journal uses article numbers instead of page numbers. See further details here.