
p38 Mediates Resistance to FGFR Inhibition in Non-Small Cell Lung Cancer

 , , , ,
  , , and
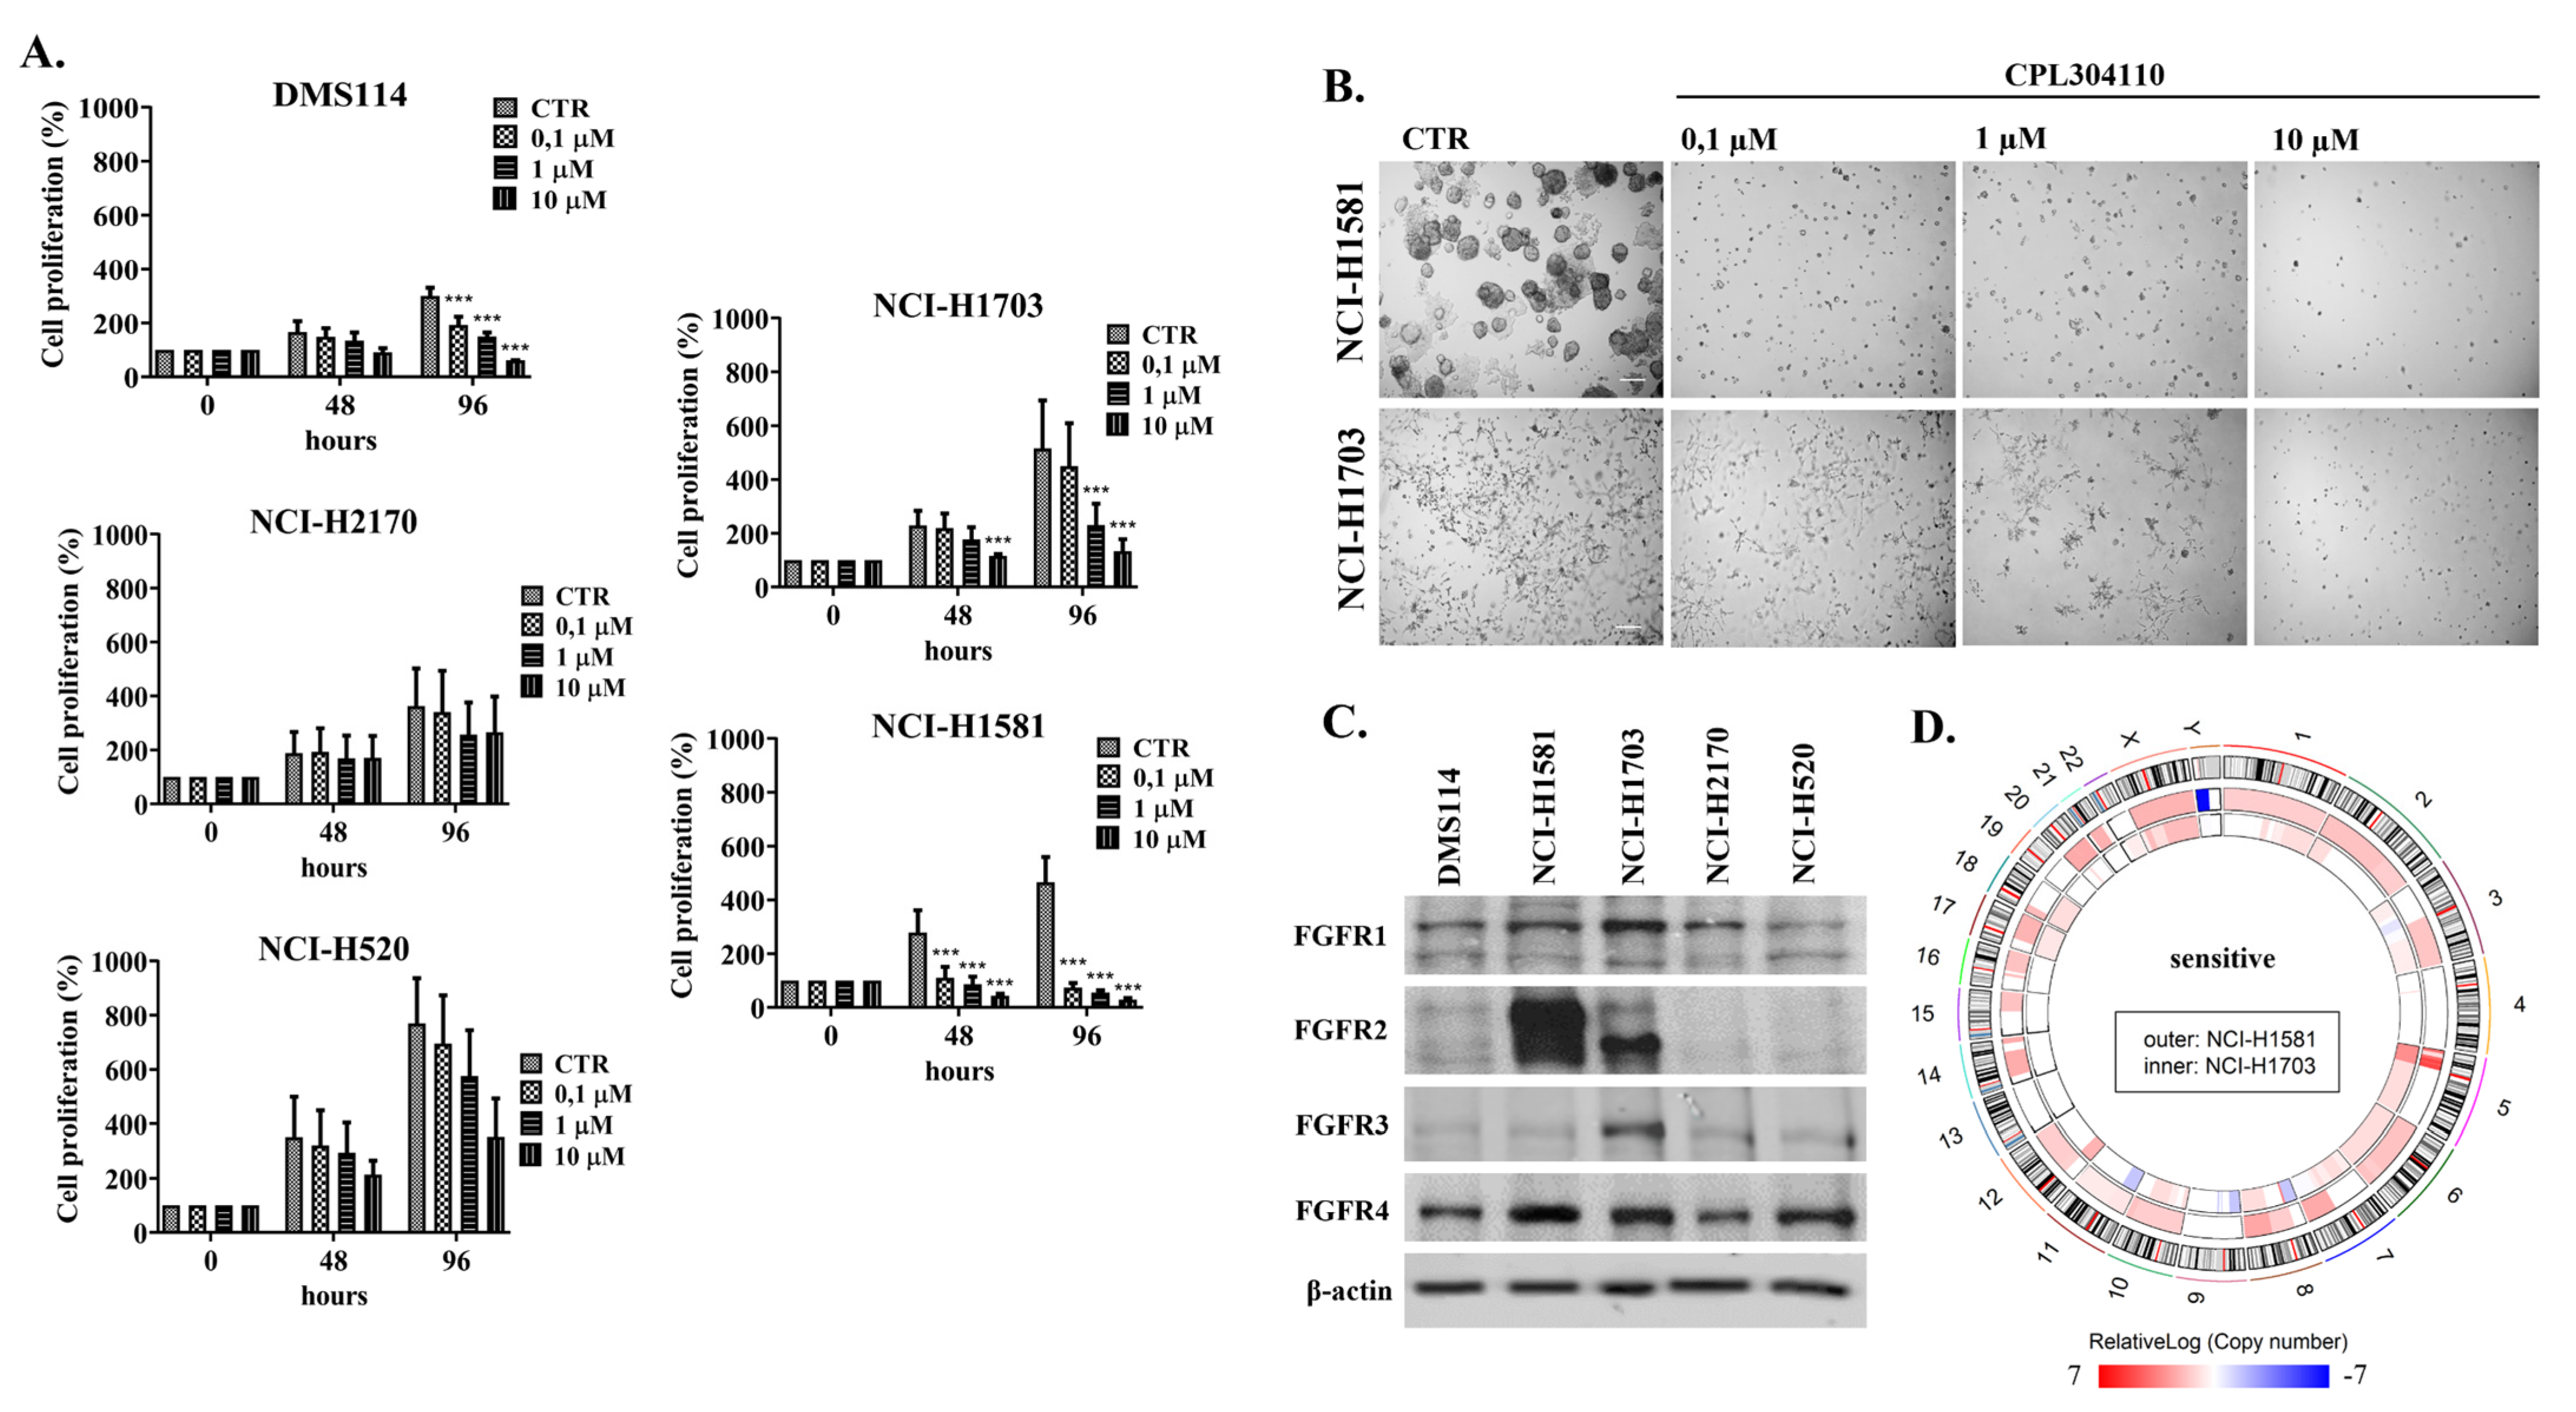
Abstract
:1. Introduction
2. Materials and Methods
2.1. Cell Lines and Cell Culture Reagents
2.2. Cell Proliferation Assay
2.3. Clonogenic Assay
2.4. Culturing Cells in Three-Dimensional BD Matrigel®
2.5. Generation of CPL304110-Resistant Cell Lines
2.6. Overexpression of p38
2.7. Western Blotting Analysis
2.8. Cell Cycle Analysis
2.9. Array-Based Comparative Genomic Hybridisation (aCGH)
2.10. aCGH Data Analysis
2.11. Transcriptome Sequencing (RNA-Seq)
2.12. RNA-seq Data Analysis
2.13. Statistical Analysis
3. Results
3.1. Differential Response of NSCLC Cell Lines to CPL304110 Inhibitor
3.2. CPL304110 Induces Cell Cycle Arrest in Sensitive Cells
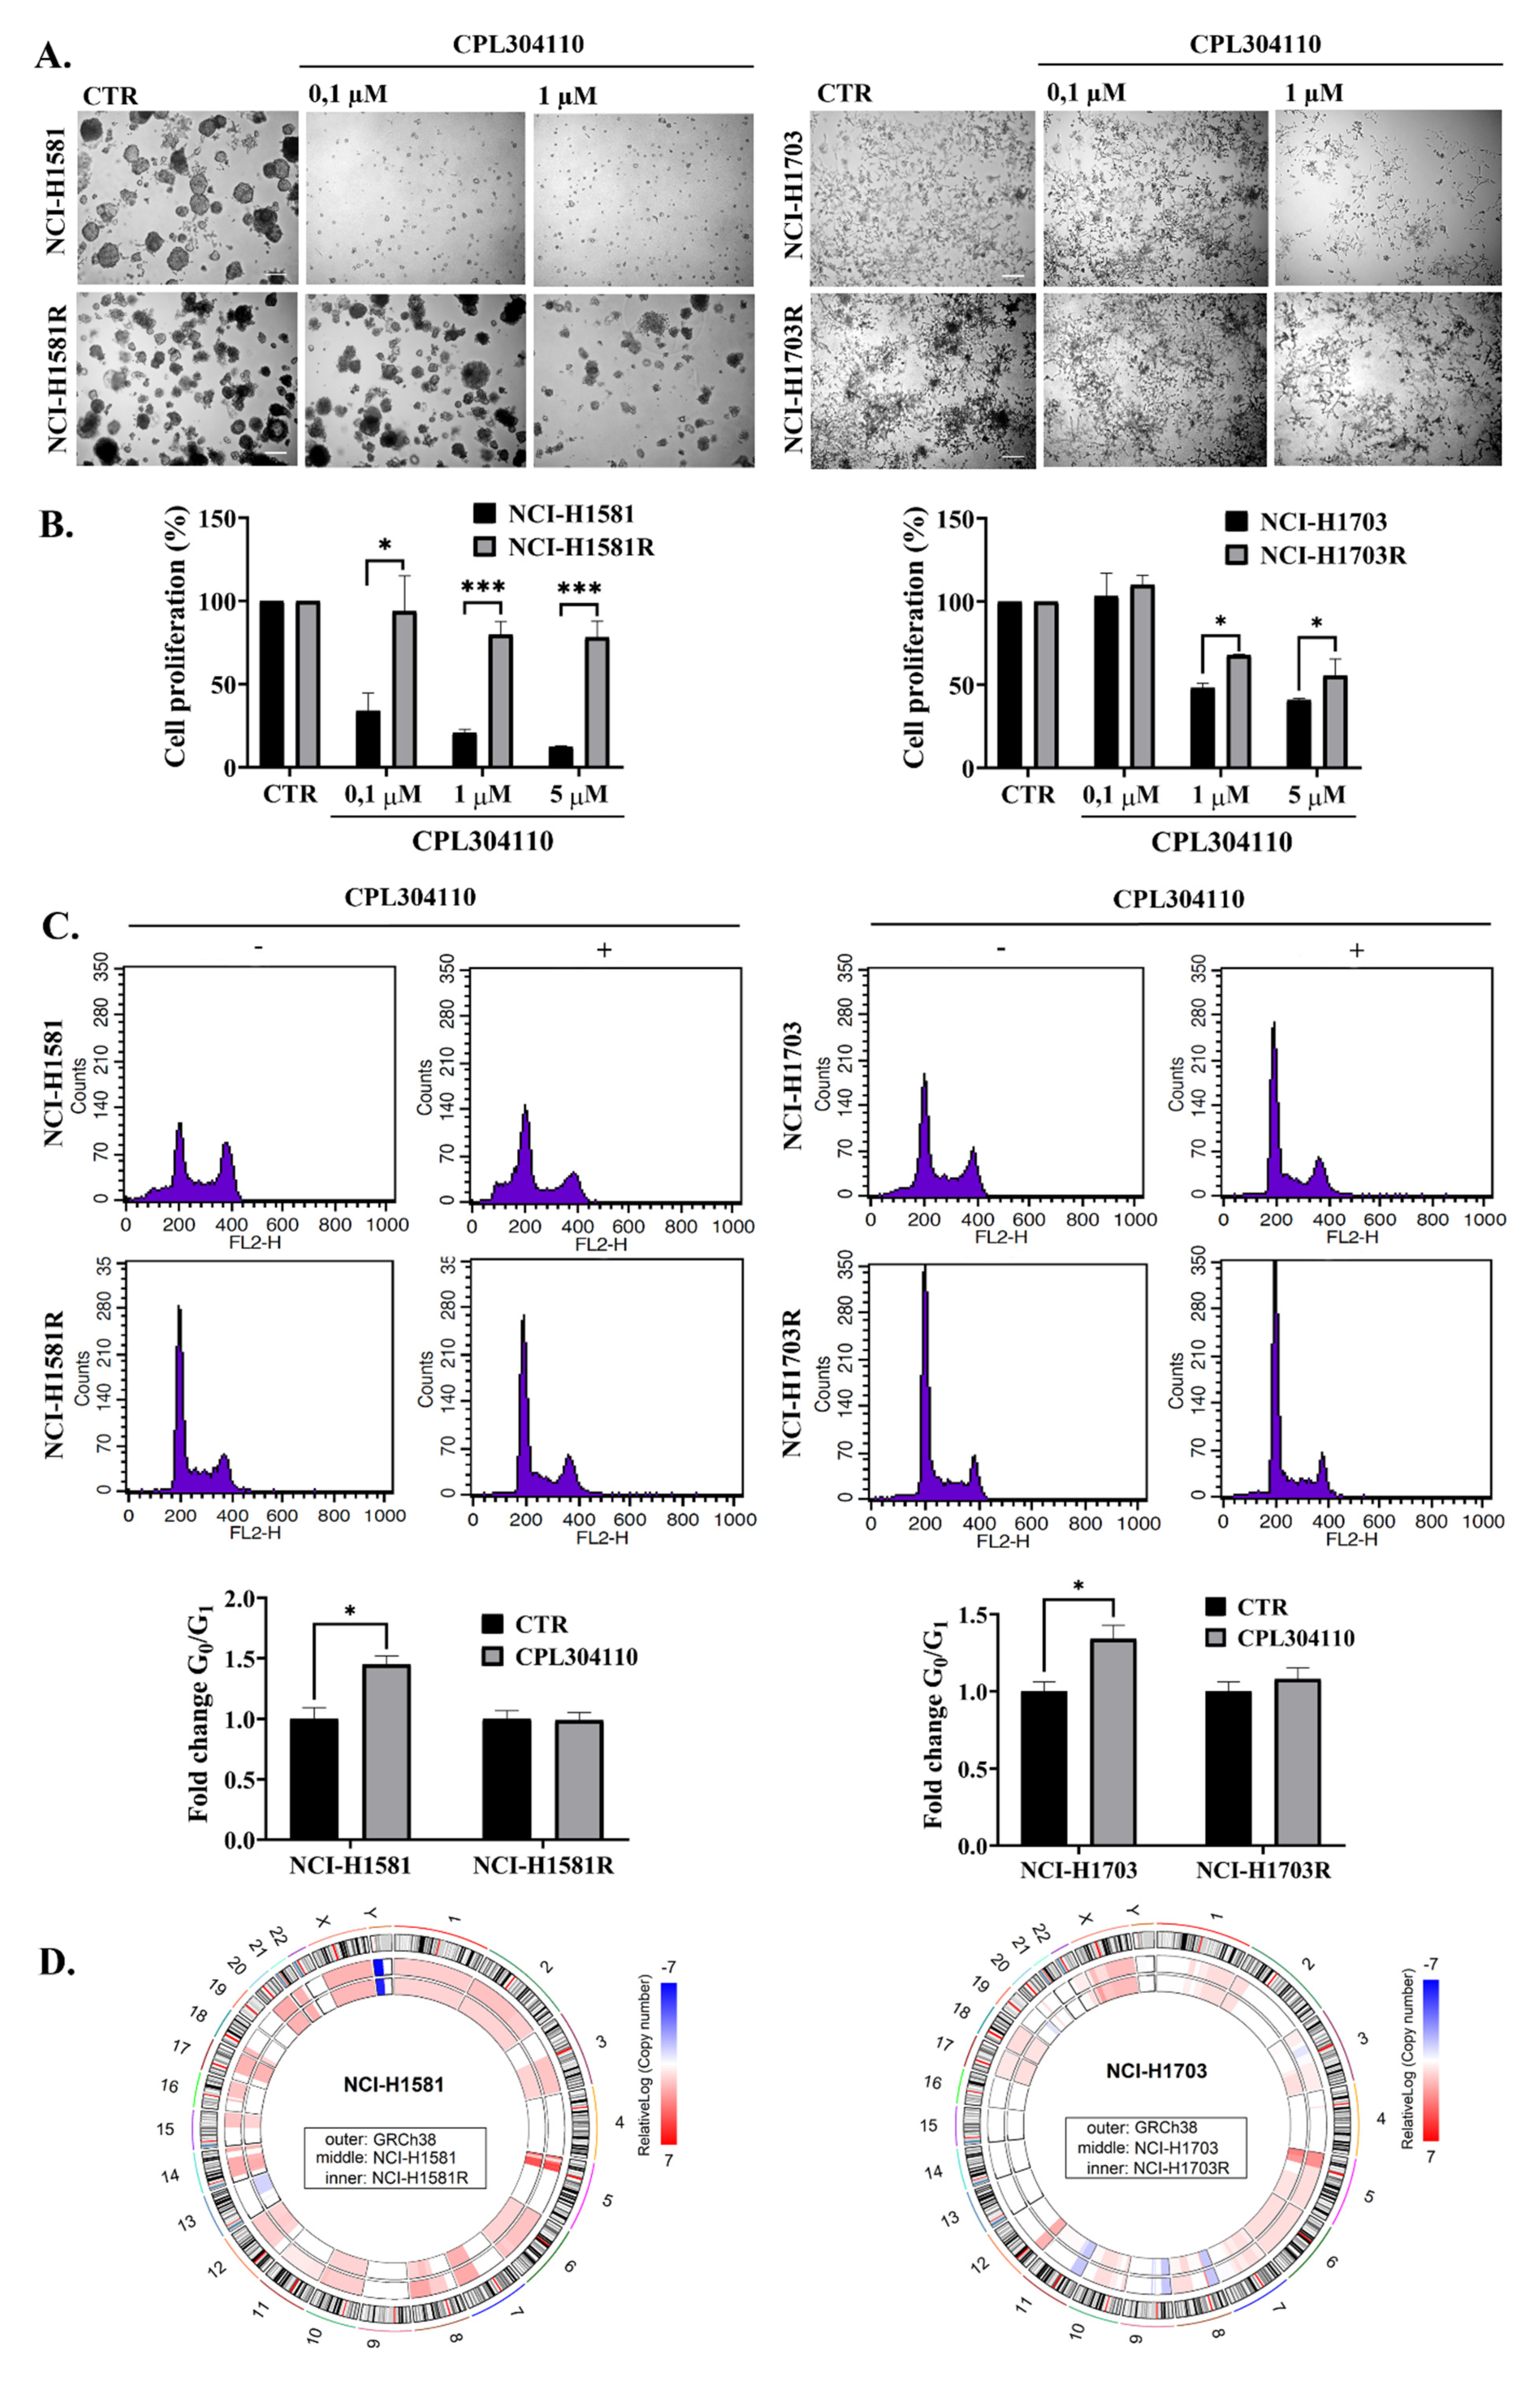
3.3. Identification of Potential Biomarker of Acquired Resistance to CPL304110 Inhibitor
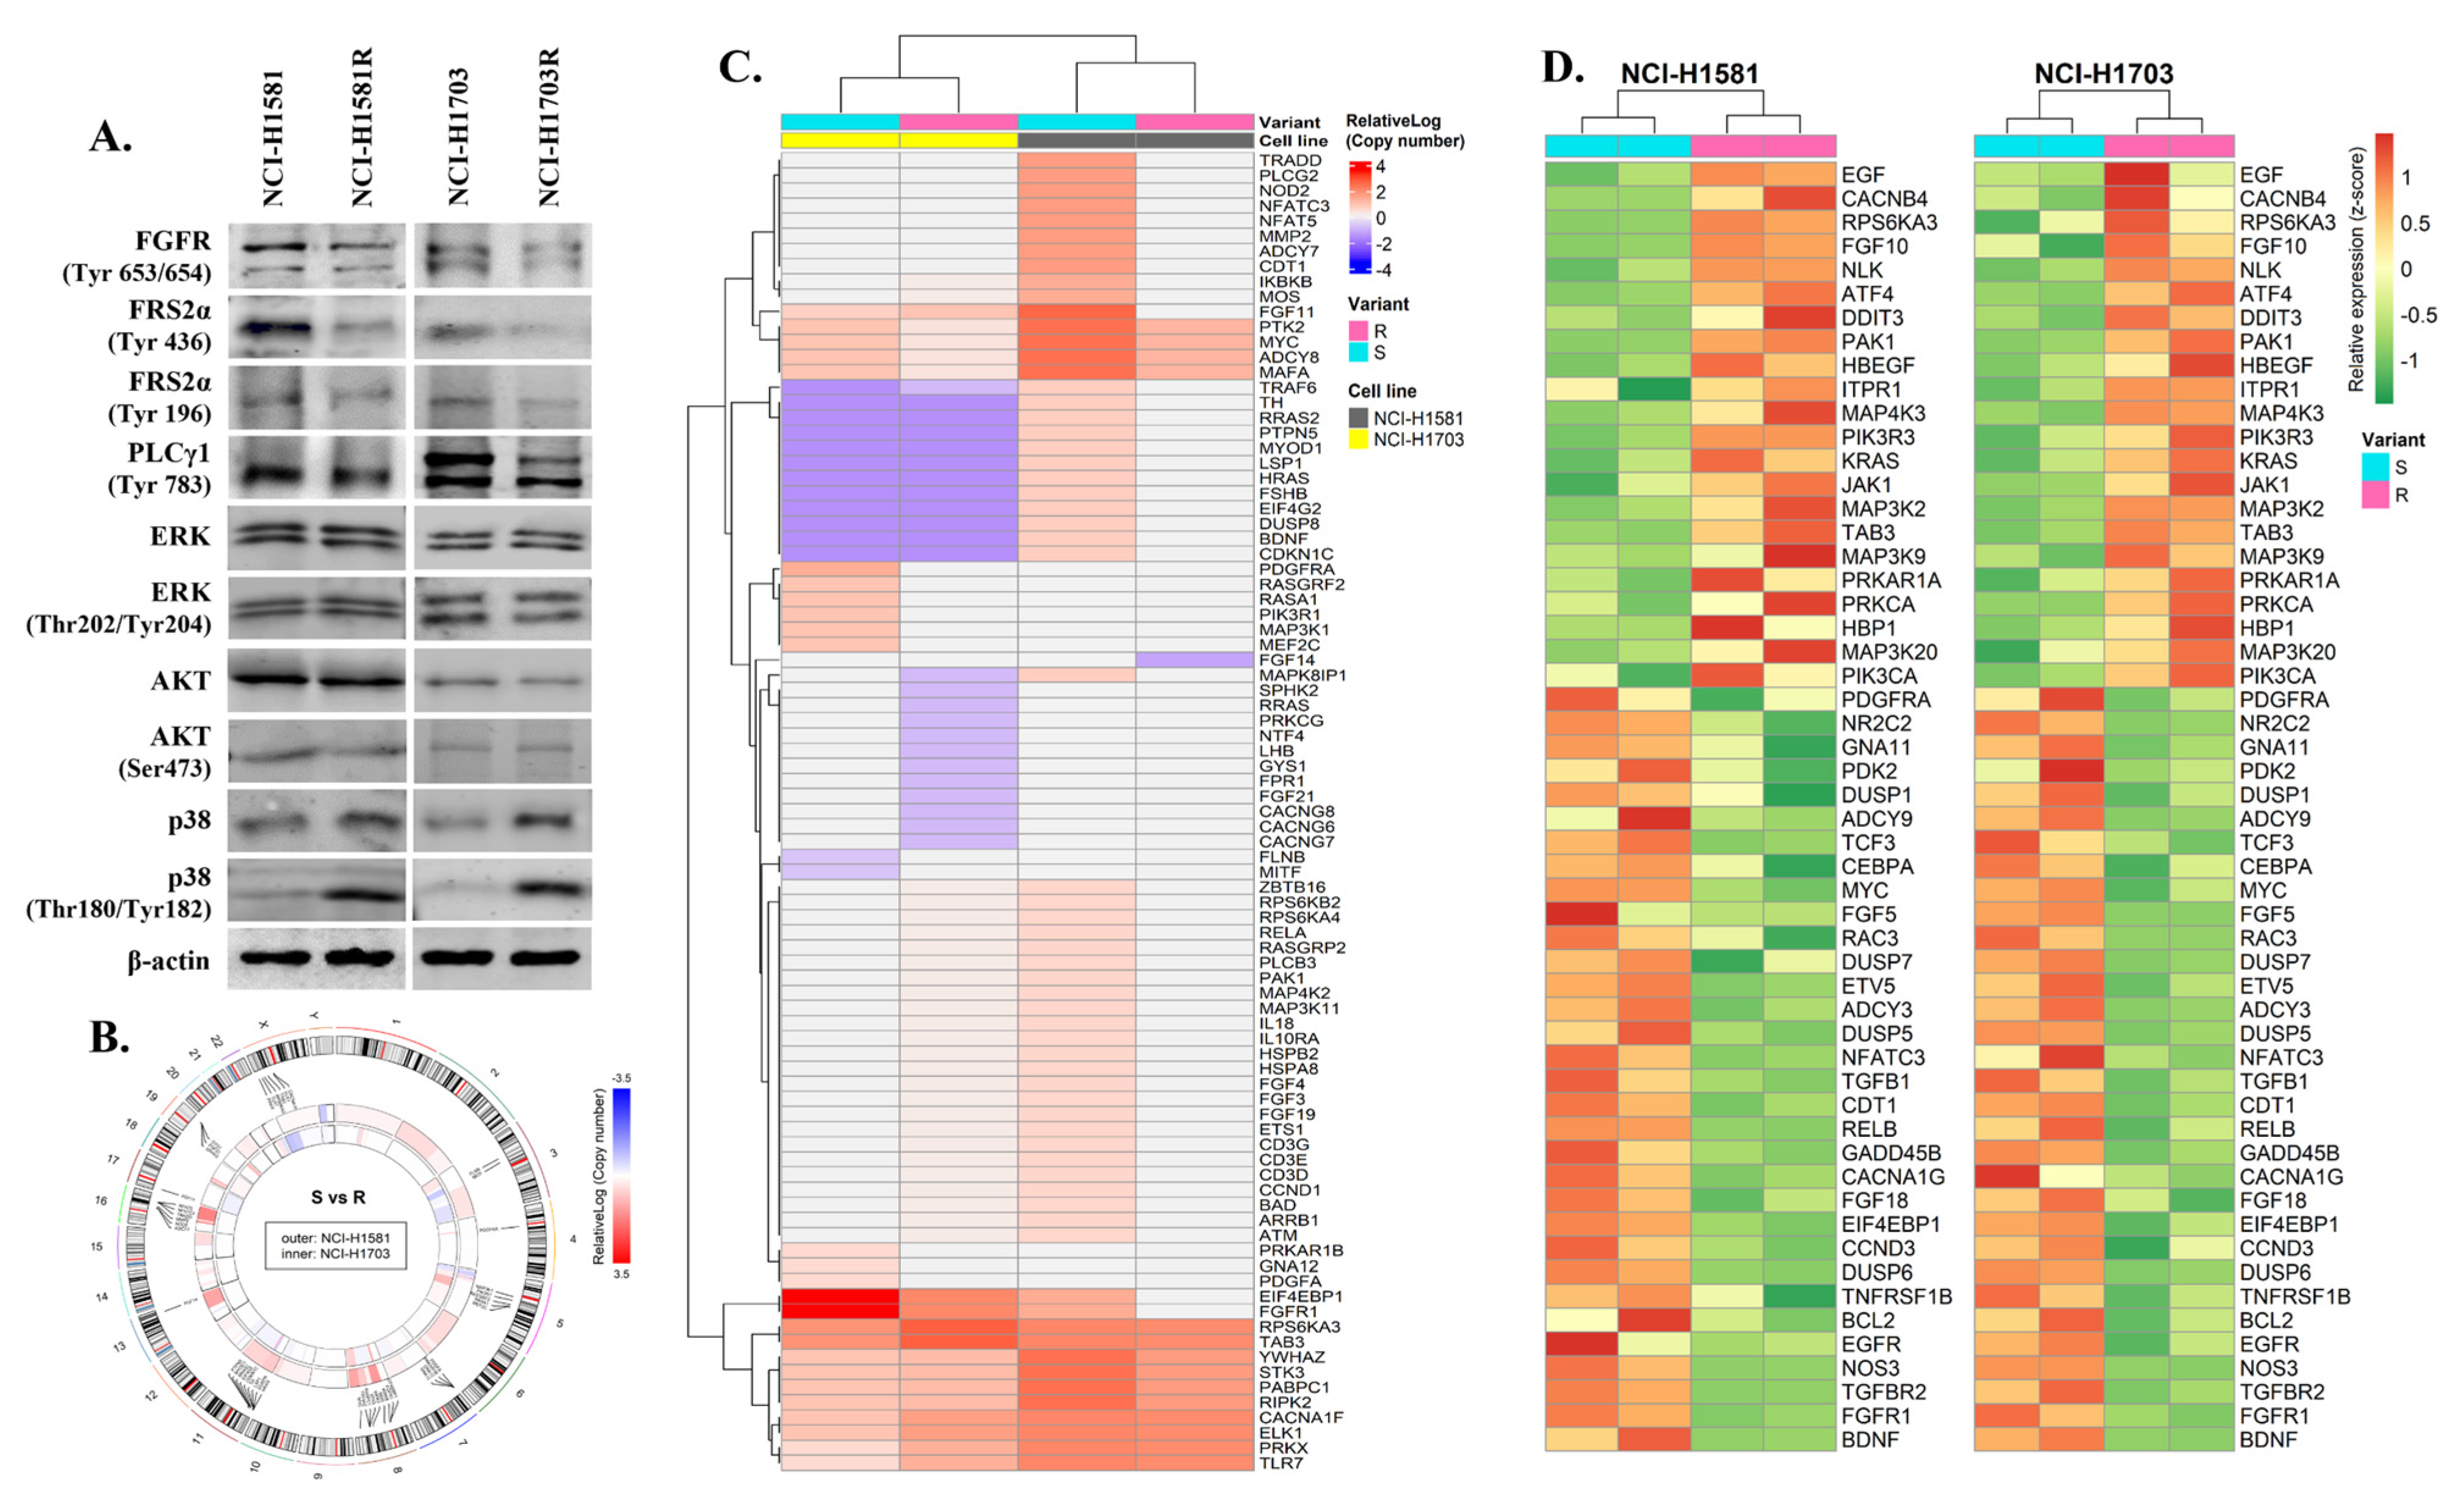
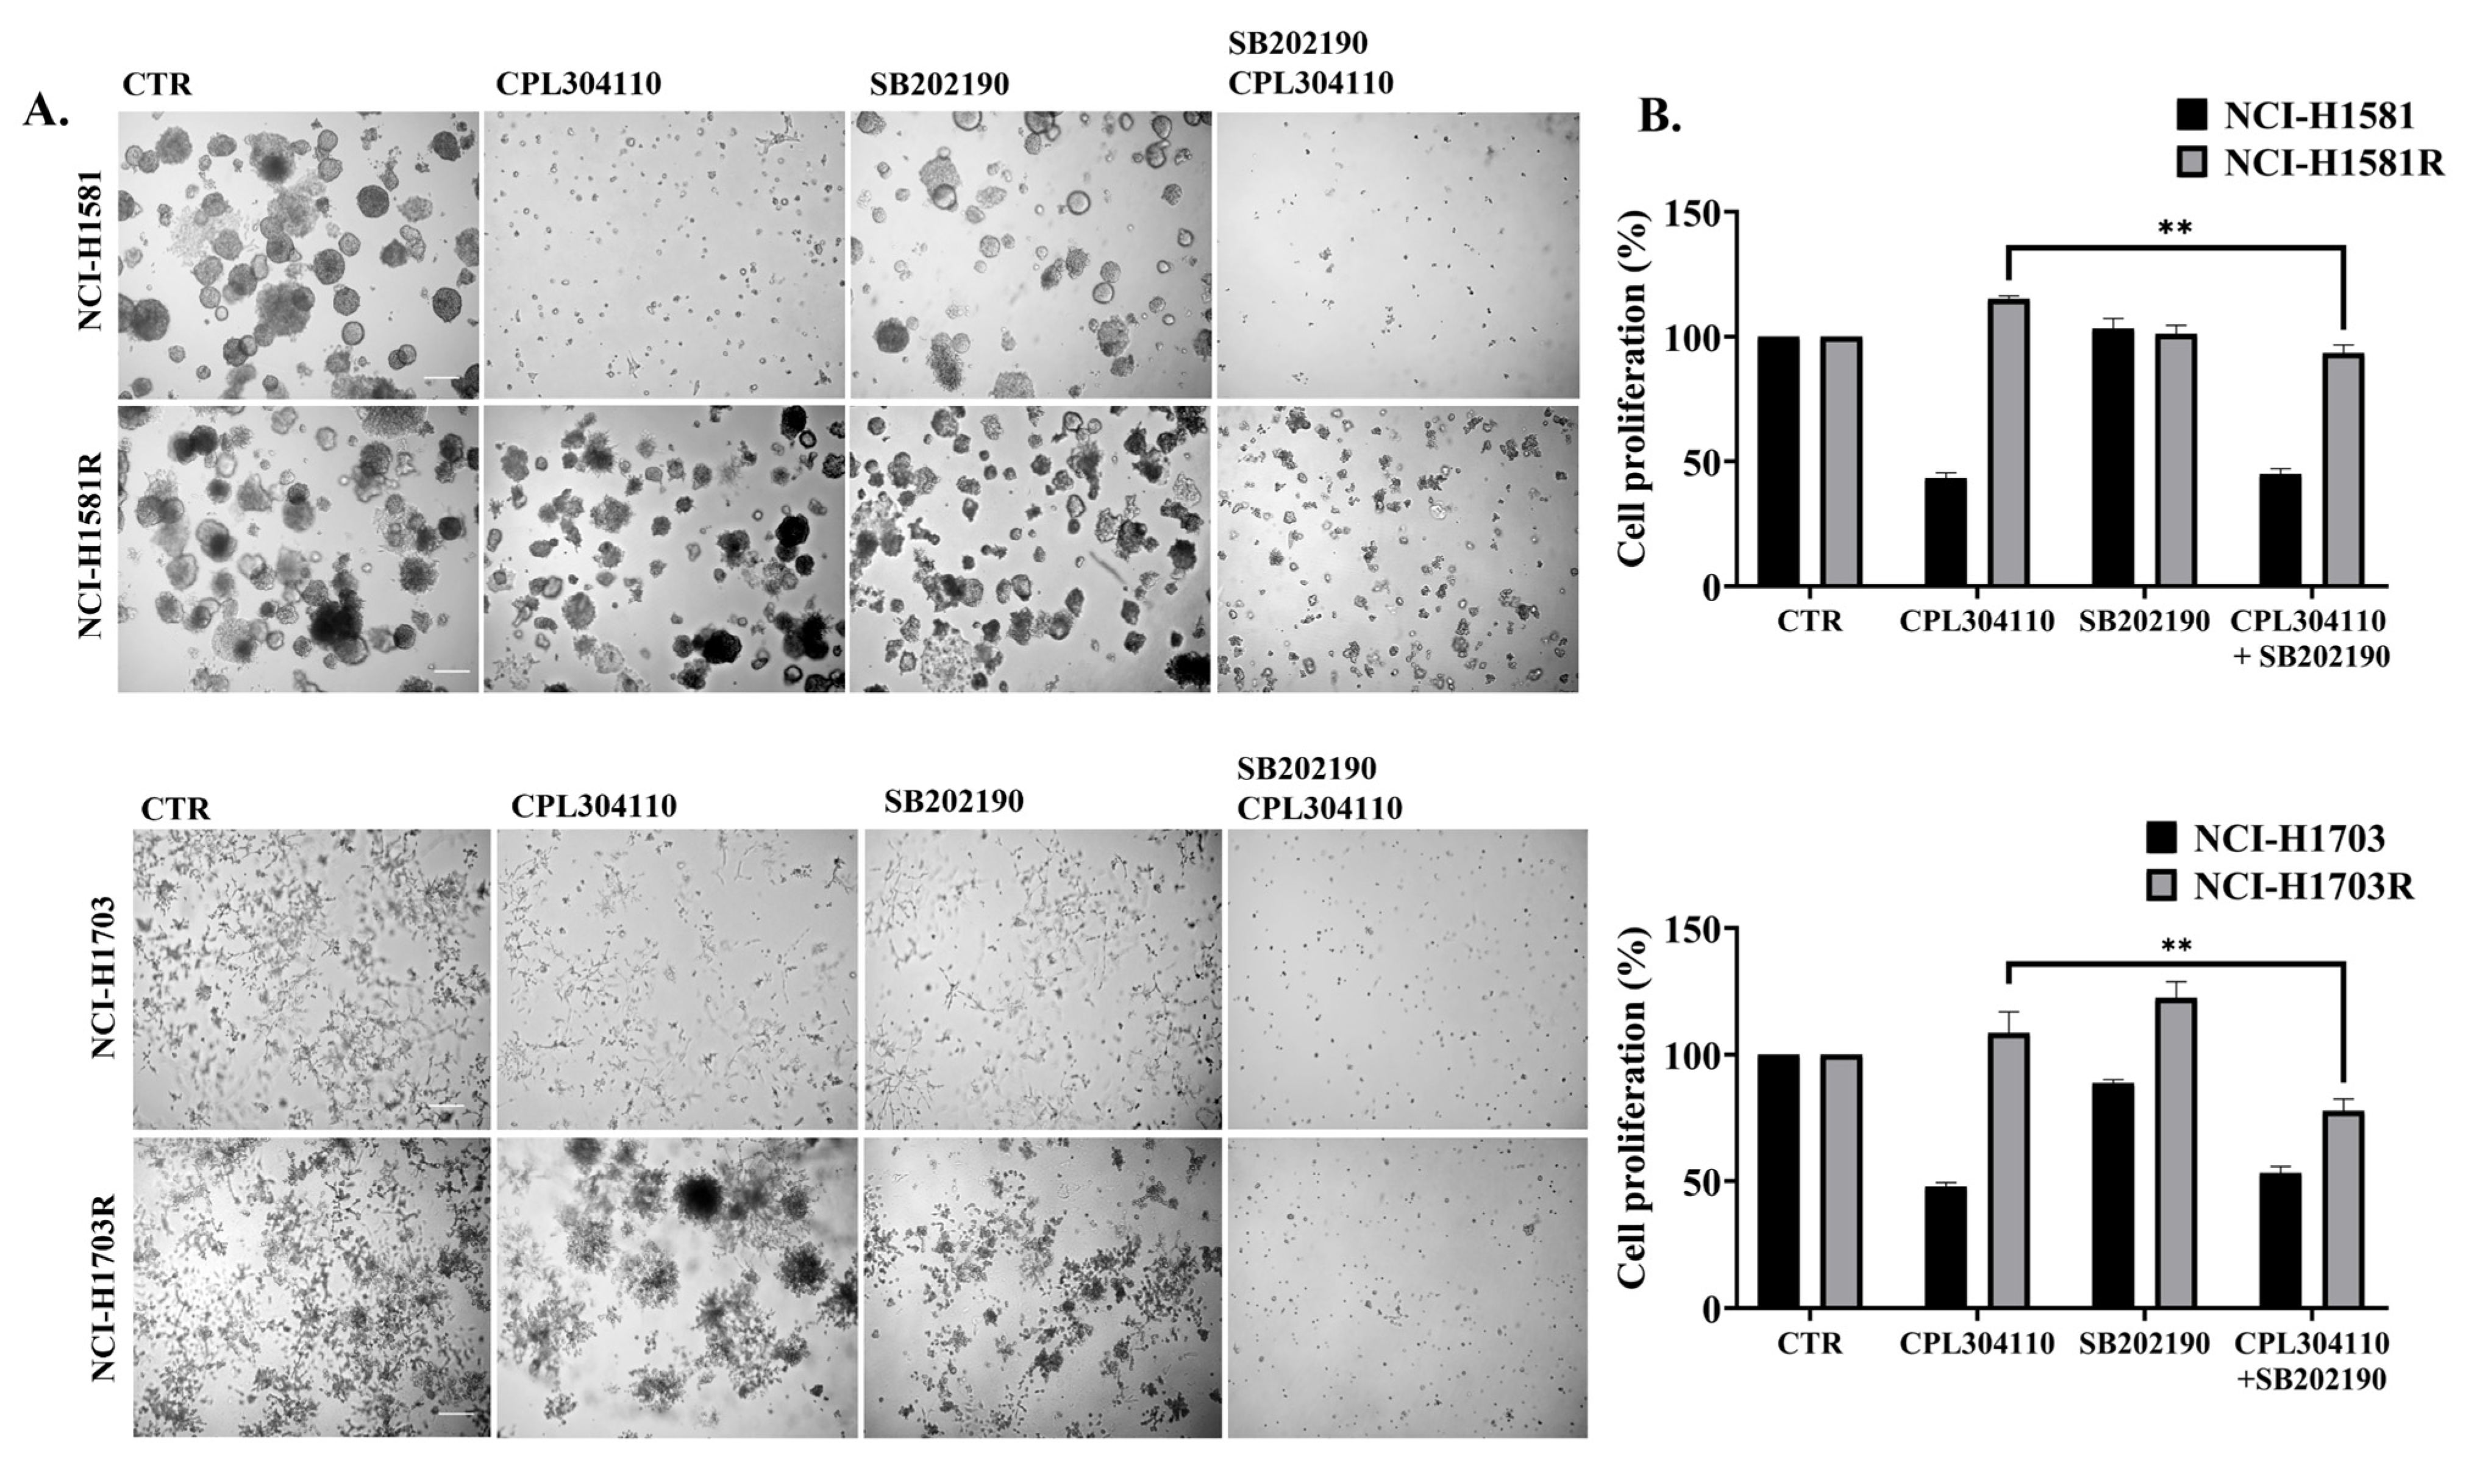
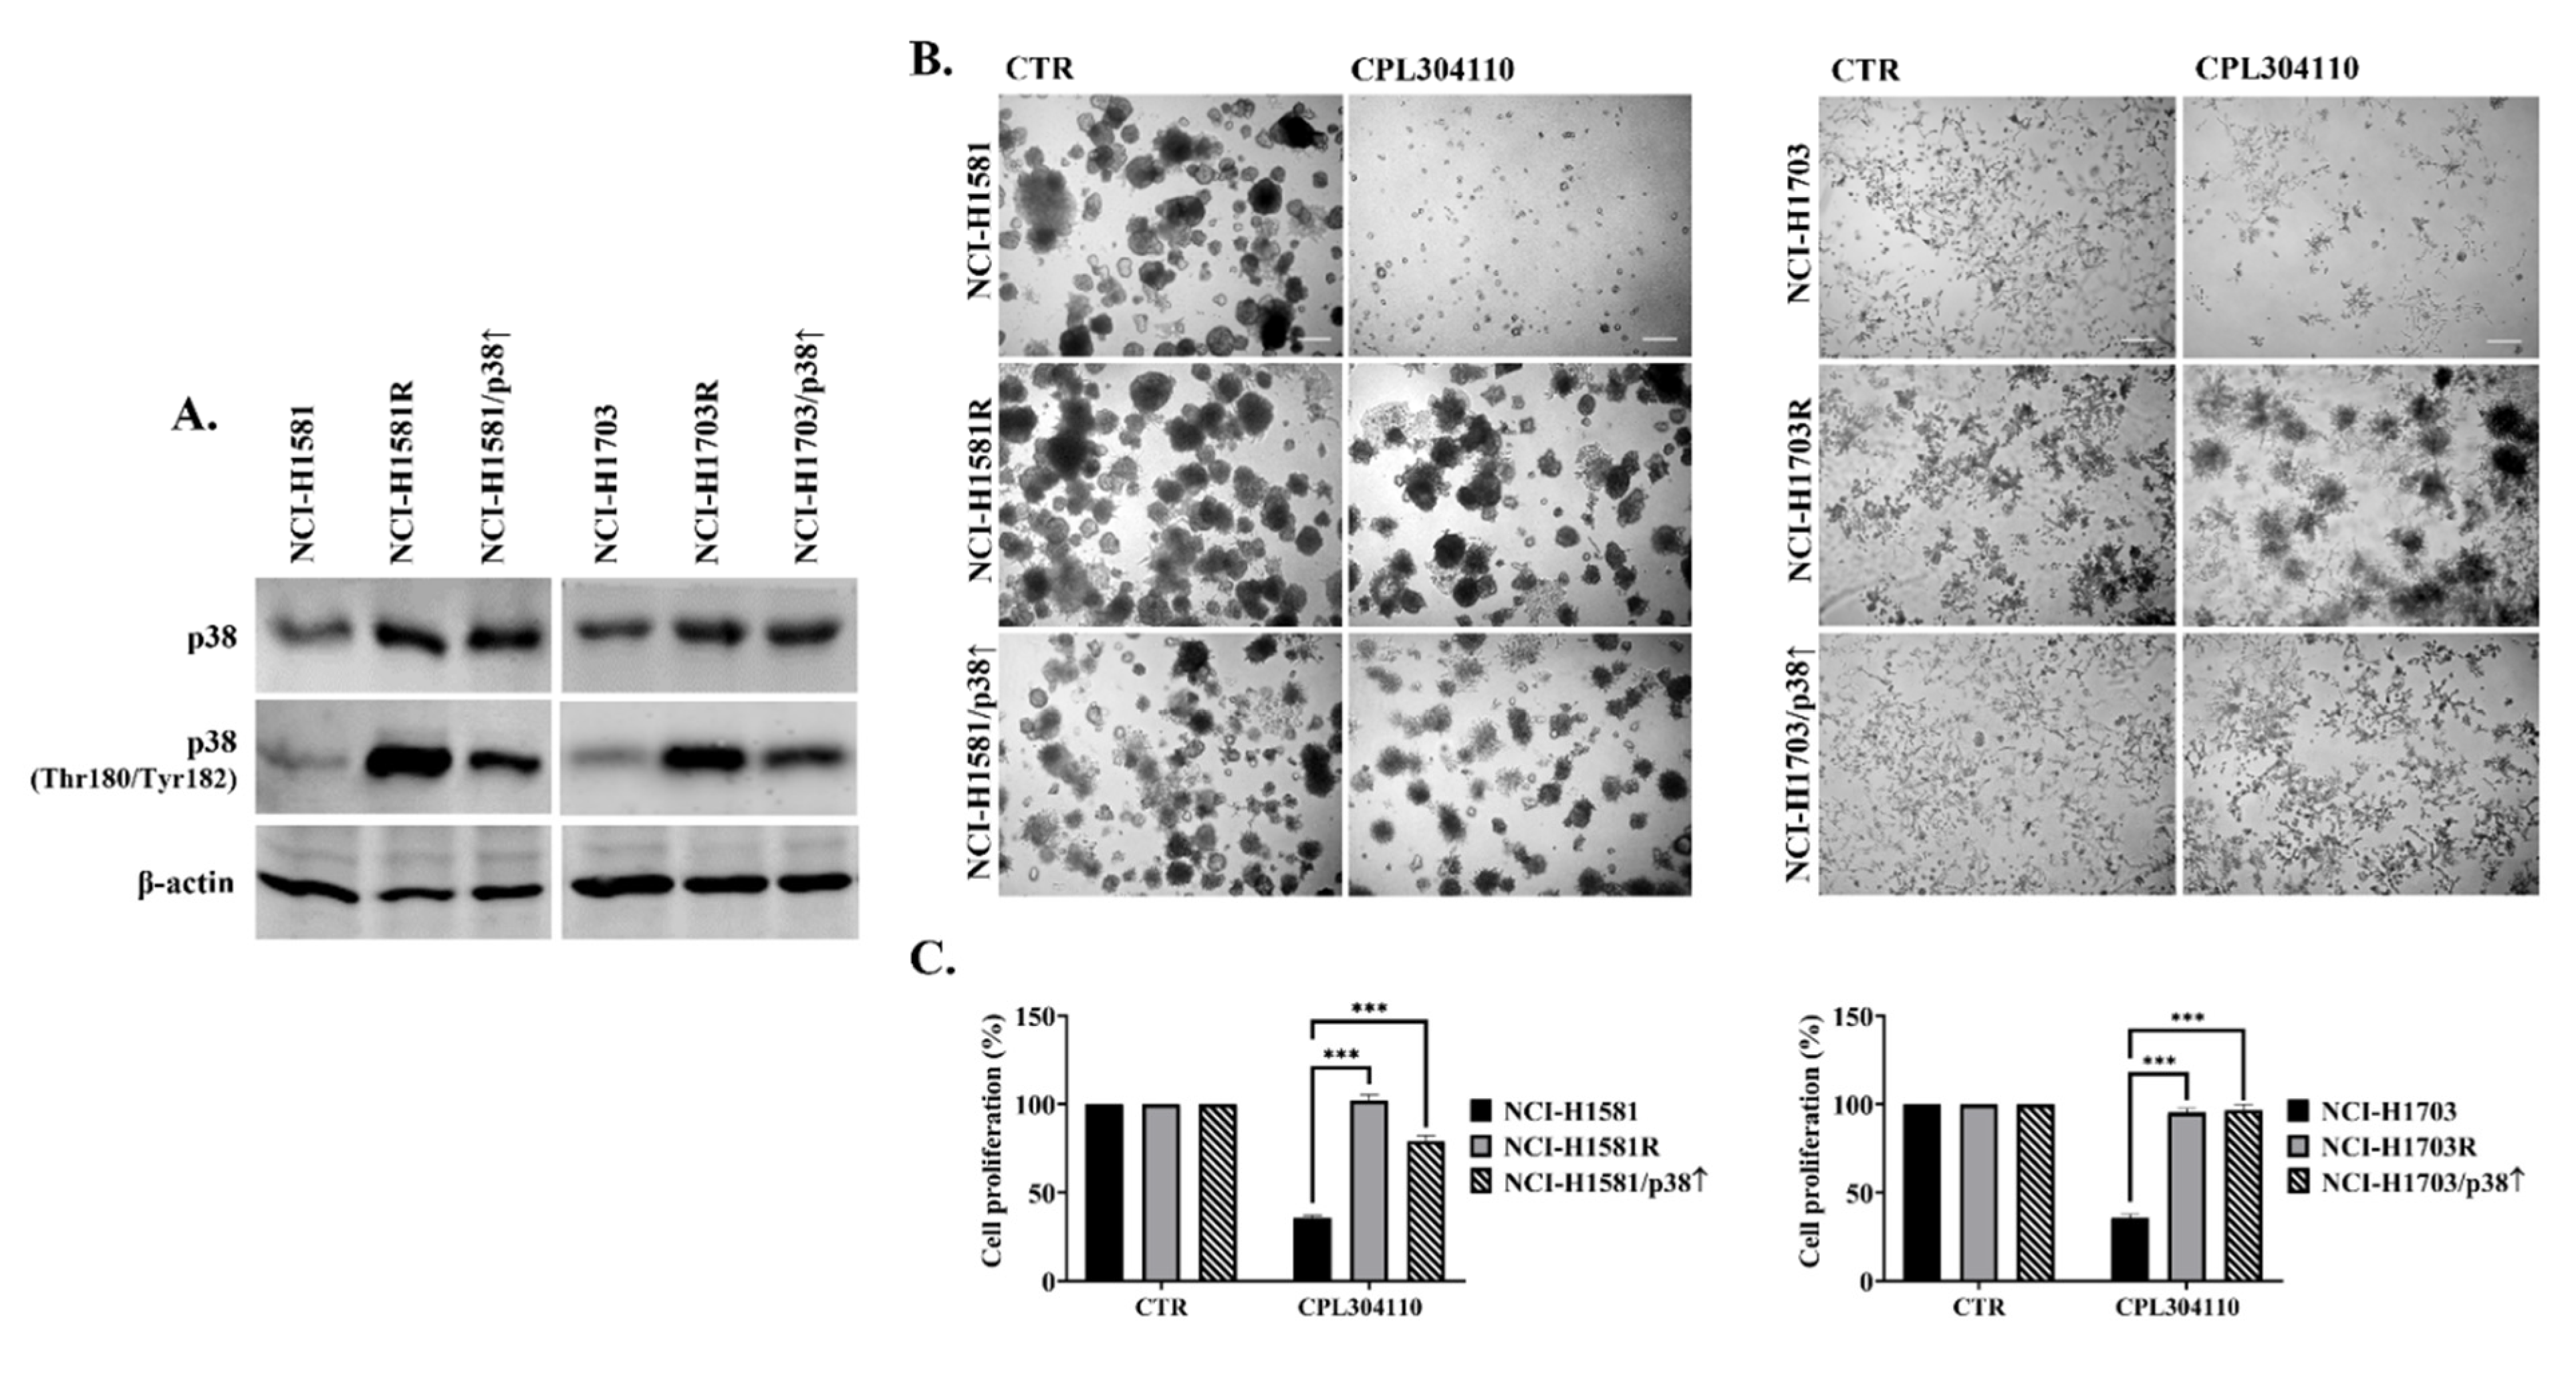
3.4. p38 Mediates Resistance to FGFR Inhibition in Lung Cancer Cells
4. Discussion
Supplementary Materials
Author Contributions
Funding
Institutional Review Board Statement
Informed Consent Statement
Data Availability Statement
Acknowledgments
Conflicts of Interest
References
- Sung, H.; Ferlay, J.; Siegel, R.L.; Laversanne, M.; Soerjomataram, I.; Jemal, A.; Bray, F. Global Cancer Statistics 2020: GLOBOCAN Estimates of Incidence and Mortality Worldwide for 36 Cancers in 185 Countries. CA Cancer J. Clin. 2021, 71, 209–249. [Google Scholar] [CrossRef]
- Cohen, P.; Cross, D.; Jänne, P.A. Kinase drug discovery 20 years after imatinib: Progress and future directions. Nat. Rev. Drug Discov. 2021, 20, 551–569. [Google Scholar] [CrossRef] [PubMed]
- Sankar, K.; Gadgeel, S.M.; Qin, A. Molecular therapeutic targets in non-small cell lung cancer. Expert Rev. Anticancer Ther. 2020, 20, 647–661. [Google Scholar] [CrossRef]
- Network, C.G.A.R. Comprehensive genomic characterization of squamous cell lung cancers. Nature 2012, 489, 519–525. [Google Scholar] [CrossRef]
- Turner, N.; Grose, R. Fibroblast growth factor signalling: From development to cancer. Nat. Rev. Cancer 2010, 10, 116–129. [Google Scholar] [CrossRef]
- Dienstmann, R.; Rodon, J.; Prat, A.; Perez-Garcia, J.; Adamo, B.; Felip, E.; Cortes, J.; Iafrate, A.J.; Nuciforo, P.; Tabernero, J. Genomic aberrations in the FGFR pathway: Opportunities for targeted therapies in solid tumors. Ann. Oncol. 2014, 25, 552–563. [Google Scholar] [CrossRef]
- Helsten, T.; Elkin, S.; Arthur, E.; Tomson, B.N.; Carter, J.; Kurzrock, R. The FGFR Landscape in Cancer: Analysis of 4,853 Tumors by Next-Generation Sequencing. Clin. Cancer Res. 2016, 22, 259–267. [Google Scholar] [CrossRef] [PubMed] [Green Version]
- Wu, Y.M.; Su, F.; Kalyana-Sundaram, S.; Khazanov, N.; Ateeq, B.; Cao, X.; Lonigro, R.J.; Vats, P.; Wang, R.; Lin, S.F.; et al. Identification of targetable FGFR gene fusions in diverse cancers. Cancer Discov. 2013, 3, 636–647. [Google Scholar] [CrossRef] [Green Version]
- Touat, M.; Ileana, E.; Postel-Vinay, S.; André, F.; Soria, J.C. Targeting FGFR Signaling in Cancer. Clin. Cancer Res. 2015, 21, 2684–2694. [Google Scholar] [CrossRef] [Green Version]
- Zhou, Y.; Wu, C.; Lu, G.; Hu, Z.; Chen, Q.; Du, X. FGF/FGFR signaling pathway involved resistance in various cancer types. J. Cancer 2020, 11, 2000–2007. [Google Scholar] [CrossRef]
- Yue, S.; Li, Y.; Chen, X.; Wang, J.; Li, M.; Chen, Y.; Wu, D. FGFR-TKI resistance in cancer: Current status and perspectives. J. Hematol. Oncol. 2021, 14, 23. [Google Scholar] [CrossRef] [PubMed]
- Dai, S.; Zhou, Z.; Chen, Z.; Xu, G.; Chen, Y. Fibroblast Growth Factor Receptors (FGFRs): Structures and Small Molecule Inhibitors. Cells 2019, 8, 614. [Google Scholar] [CrossRef] [PubMed] [Green Version]
- Kitowska, K.; Gorska-Arcisz, M.; Antoun, D.; Zarczynska, I.; Czaplinska, D.; Szczepaniak, A.; Skladanowski, A.C.; Wieczorek, M.; Stanczak, A.; Skupinska, M.; et al. MET-Pyk2 Axis Mediates Acquired Resistance to FGFR Inhibition in Cancer Cells. Front. Oncol. 2021, 11, 633410. [Google Scholar] [CrossRef] [PubMed]
- Malchers, F.; Ercanoglu, M.; Schütte, D.; Castiglione, R.; Tischler, V.; Michels, S.; Dahmen, I.; Brägelmann, J.; Menon, R.; Heuckmann, J.M.; et al. Mechanisms of Primary Drug Resistance in FGFR1-Amplified Lung Cancer. Clin. Cancer Res. 2017, 23, 5527–5536. [Google Scholar] [CrossRef] [PubMed] [Green Version]
- Datta, J.; Damodaran, S.; Parks, H.; Ocrainiciuc, C.; Miya, J.; Yu, L.; Gardner, E.P.; Samorodnitsky, E.; Wing, M.R.; Bhatt, D.; et al. Akt Activation Mediates Acquired Resistance to Fibroblast Growth Factor Receptor Inhibitor BGJ398. Mol. Cancer Ther. 2017, 16, 614–624. [Google Scholar] [CrossRef] [Green Version]
- Weiss, J.; Sos, M.L.; Seidel, D.; Peifer, M.; Zander, T.; Heuckmann, J.M.; Ullrich, R.T.; Menon, R.; Maier, S.; Soltermann, A.; et al. Frequent and Focal FGFR1 Amplification Associates With Therapeutically Tractable FGFR1 Dependency in Squamous-cell Lung Cancer. Sci. Transl. Med. 2010, 2, 62ra93. [Google Scholar] [CrossRef] [Green Version]
- Yamani, A.; Zdżalik-Bielecka, D.; Lipner, J.; Stańczak, A.; Piórkowska, N.; Stańczak, P.S.; Olejkowska, P.; Hucz-Kalitowska, J.; Magdycz, M.; Dzwonek, K.; et al. Discovery and optimization of novel pyrazole-benzimidazole CPL304110, as a potent and selective inhibitor of fibroblast growth factor receptors FGFR (1–3). Eur. J. Med. Chem. 2021, 210, 112990. [Google Scholar] [CrossRef]
- Mieszkowska, M.; Piasecka, D.; Potemski, P.; Debska-Szmich, S.; Rychlowski, M.; Kordek, R.; Sadej, R.; Romanska, H.M. Tetraspanin CD151 impairs heterodimerization of ErbB2/ErbB3 in breast cancer cells. Transl. Res. 2019, 207, 44–55. [Google Scholar] [CrossRef]
- Commo, F.; Guinney, J.; Ferté, C.; Bot, B.; Lefebvre, C.; Soria, J.C.; André, F. rCGH: A comprehensive array-based genomic profile platform for precision medicine. Bioinformatics 2016, 32, 1402–1404. [Google Scholar] [CrossRef] [Green Version]
- Zhang, H.; Meltzer, P.; Davis, S. RCircos: An R package for Circos 2D track plots. BMC Bioinform. 2013, 14, 244. [Google Scholar] [CrossRef] [Green Version]
- Patro, R.; Duggal, G.; Love, M.I.; Irizarry, R.A.; Kingsford, C. Salmon provides fast and bias-aware quantification of transcript expression. Nat. Methods 2017, 14, 417–419. [Google Scholar] [CrossRef] [PubMed] [Green Version]
- Soneson, C.; Love, M.I.; Robinson, M.D. Differential analyses for RNA-seq: Transcript-level estimates improve gene-level inferences. F1000Research 2015, 4, 1521. [Google Scholar] [CrossRef] [PubMed]
- Love, M.I.; Huber, W.; Anders, S. Moderated estimation of fold change and dispersion for RNA-seq data with DESeq2. Genome Biol. 2014, 15, 550. [Google Scholar] [CrossRef] [Green Version]
- Subramanian, A.; Tamayo, P.; Mootha, V.K.; Mukherjee, S.; Ebert, B.L.; Gillette, M.A.; Paulovich, A.; Pomeroy, S.L.; Golub, T.R.; Lander, E.S.; et al. Gene set enrichment analysis: A knowledge-based approach for interpreting genome-wide expression profiles. Proc. Natl. Acad. Sci. USA 2005, 102, 15545–15550. [Google Scholar] [CrossRef] [PubMed] [Green Version]
- Yu, G.; Wang, L.G.; Han, Y.; He, Q.Y. clusterProfiler: An R package for comparing biological themes among gene clusters. Omics J. Integr. Biol. 2012, 16, 284–287. [Google Scholar] [CrossRef]
- Liberzon, A.; Subramanian, A.; Pinchback, R.; Thorvaldsdóttir, H.; Tamayo, P.; Mesirov, J.P. Molecular signatures database (MSigDB) 3.0. Bioinformatics 2011, 27, 1739–1740. [Google Scholar] [CrossRef]
- Fearon, A.E.; Carter, E.P.; Clayton, N.S.; Wilkes, E.H.; Baker, A.M.; Kapitonova, E.; Bakhouche, B.A.; Tanner, Y.; Wang, J.; Gadaleta, E.; et al. PHLDA1 Mediates Drug Resistance in Receptor Tyrosine Kinase-Driven Cancer. Cell Rep. 2018, 22, 2469–2481. [Google Scholar] [CrossRef] [Green Version]
- Bockorny, B.; Rusan, M.; Chen, W.; Liao, R.G.; Li, Y.; Piccioni, F.; Wang, J.; Tan, L.; Thorner, A.R.; Li, T.; et al. RAS-MAPK Reactivation Facilitates Acquired Resistance in. Mol Cancer Ther. 2018, 17, 1526–1539. [Google Scholar] [CrossRef] [Green Version]
- Niederst, M.J.; Engelman, J.A. Bypass mechanisms of resistance to receptor tyrosine kinase inhibition in lung cancer. Sci. Signal. 2013, 6, re6. [Google Scholar] [CrossRef] [Green Version]
- Adachi, Y.; Watanabe, K.; Kita, K.; Kitai, H.; Kotani, H.; Sato, Y.; Inase, N.; Yano, S.; Ebi, H. Resistance mediated by alternative receptor tyrosine kinases in FGFR1-amplified lung cancer. Carcinogenesis 2017, 38, 1063–1072. [Google Scholar] [CrossRef]
- Yang, Y.; Lu, T.; Li, Z.; Lu, S. FGFR1 regulates proliferation and metastasis by targeting CCND1 in FGFR1 amplified lung cancer. Cell Adhes. Migr. 2020, 14, 82–95. [Google Scholar] [CrossRef]
- Wang, K.; Ji, W.; Yu, Y.; Li, Z.; Niu, X.; Xia, W.; Lu, S. FGFR1-ERK1/2-SOX2 axis promotes cell proliferation, epithelial-mesenchymal transition, and metastasis in FGFR1-amplified lung cancer. Oncogene 2018, 37, 5340–5354. [Google Scholar] [CrossRef] [PubMed]
- Wang, Y.; Gao, W.; Xu, J.; Chen, X.; Yang, Y.; Zhu, Y.; Yin, Y.; Guo, R.; Liu, P.; Shu, Y.; et al. The Role of FGFR1 Gene Amplification as a Poor Prognostic Factor in Squamous Cell Lung Cancer: A Meta-Analysis of Published Data. Biomed. Res. Int. 2015, 2015, 763080. [Google Scholar] [CrossRef] [PubMed] [Green Version]
- Schildhaus, H.U.; Nogova, L.; Wolf, J.; Buettner, R. FGFR1 amplifications in squamous cell carcinomas of the lung: Diagnostic and therapeutic implications. Transl. Lung Cancer Res. 2013, 2, 92–100. [Google Scholar] [CrossRef]
- Kas, S.M.; de Ruiter, J.R.; Schipper, K.; Schut, E.; Bombardelli, L.; Wientjens, E.; Drenth, A.P.; de Korte-Grimmerink, R.; Mahakena, S.; Phillips, C.; et al. Transcriptomics and Transposon Mutagenesis Identify Multiple Mechanisms of Resistance to the FGFR Inhibitor AZD4547. Cancer Res. 2018, 78, 5668–5679. [Google Scholar] [CrossRef] [Green Version]
- Mora Vidal, R.; Regufe da Mota, S.; Hayden, A.; Markham, H.; Douglas, J.; Packham, G.; Crabb, S.J. Epidermal Growth Factor Receptor Family Inhibition Identifies P38 Mitogen-activated Protein Kinase as a Potential Therapeutic Target in Bladder Cancer. Urology 2018, 112, 225.e221–225.e227. [Google Scholar] [CrossRef] [Green Version]
- Yin, N.; Lepp, A.; Ji, Y.; Mortensen, M.; Hou, S.; Qi, X.M.; Myers, C.R.; Chen, G. The K-Ras effector p38γ MAPK confers intrinsic resistance to tyrosine kinase inhibitors by stimulating. J. Biol. Chem. 2017, 292, 15070–15079. [Google Scholar] [CrossRef] [PubMed] [Green Version]
- Yeung, Y.T.; Yin, S.; Lu, B.; Fan, S.; Yang, R.; Bai, R.; Zhang, C.; Bode, A.M.; Liu, K.; Dong, Z. Losmapimod Overcomes Gefitinib Resistance in Non-small Cell Lung Cancer by Preventing Tetraploidization. EBioMedicine 2018, 28, 51–61. [Google Scholar] [CrossRef] [PubMed] [Green Version]
- Malchers, F.; Dietlein, F.; Schöttle, J.; Lu, X.; Nogova, L.; Albus, K.; Fernandez-Cuesta, L.; Heuckmann, J.M.; Gautschi, O.; Diebold, J.; et al. Cell-autonomous and non-cell-autonomous mechanisms of transformation by amplified FGFR1 in lung cancer. Cancer Discov. 2014, 4, 246–257. [Google Scholar] [CrossRef] [Green Version]
- Nunes-Xavier, C.; Romá-Mateo, C.; Ríos, P.; Tárrega, C.; Cejudo-Marín, R.; Tabernero, L.; Pulido, R. Dual-specificity MAP kinase phosphatases as targets of cancer treatment. Anticancer Agents Med. Chem. 2011, 11, 109–132. [Google Scholar] [CrossRef]
- Bagnyukova, T.V.; Restifo, D.; Beeharry, N.; Gabitova, L.; Li, T.; Serebriiskii, I.G.; Golemis, E.A.; Astsaturov, I. DUSP6 regulates drug sensitivity by modulating DNA damage response. Br. J. Cancer 2013, 109, 1063–1071. [Google Scholar] [CrossRef] [PubMed] [Green Version]
- Hu, X.; Tang, Z.; Ma, S.; Yu, Y.; Chen, X.; Zang, G. Tripartite motif-containing protein 7 regulates hepatocellular carcinoma cell proliferation via the DUSP6/p38 pathway. Biochem. Biophys. Res. Commun. 2019, 511, 889–895. [Google Scholar] [CrossRef] [PubMed]


Publisher’s Note: MDPI stays neutral with regard to jurisdictional claims in published maps and institutional affiliations. |
© 2021 by the authors. Licensee MDPI, Basel, Switzerland. This article is an open access article distributed under the terms and conditions of the Creative Commons Attribution (CC BY) license (https://creativecommons.org/licenses/by/4.0/).
Share and Cite
Zarczynska, I.; Gorska-Arcisz, M.; Cortez, A.J.; Kujawa, K.A.; Wilk, A.M.; Skladanowski, A.C.; Stanczak, A.; Skupinska, M.; Wieczorek, M.; Lisowska, K.M.; et al. p38 Mediates Resistance to FGFR Inhibition in Non-Small Cell Lung Cancer. Cells 2021, 10, 3363. https://0-doi-org.brum.beds.ac.uk/10.3390/cells10123363
Zarczynska I, Gorska-Arcisz M, Cortez AJ, Kujawa KA, Wilk AM, Skladanowski AC, Stanczak A, Skupinska M, Wieczorek M, Lisowska KM, et al. p38 Mediates Resistance to FGFR Inhibition in Non-Small Cell Lung Cancer. Cells. 2021; 10(12):3363. https://0-doi-org.brum.beds.ac.uk/10.3390/cells10123363
Chicago/Turabian StyleZarczynska, Izabela, Monika Gorska-Arcisz, Alexander Jorge Cortez, Katarzyna Aleksandra Kujawa, Agata Małgorzata Wilk, Andrzej Cezary Skladanowski, Aleksandra Stanczak, Monika Skupinska, Maciej Wieczorek, Katarzyna Marta Lisowska, and et al. 2021. "p38 Mediates Resistance to FGFR Inhibition in Non-Small Cell Lung Cancer" Cells 10, no. 12: 3363. https://0-doi-org.brum.beds.ac.uk/10.3390/cells10123363