
Long-Term Hyperglycemia Causes Depressive Behaviors in Mice with Hypoactive Glutamatergic Activity in the Medial Prefrontal Cortex, Which Is Not Reversed by Insulin Treatment
 ,
,  , , and
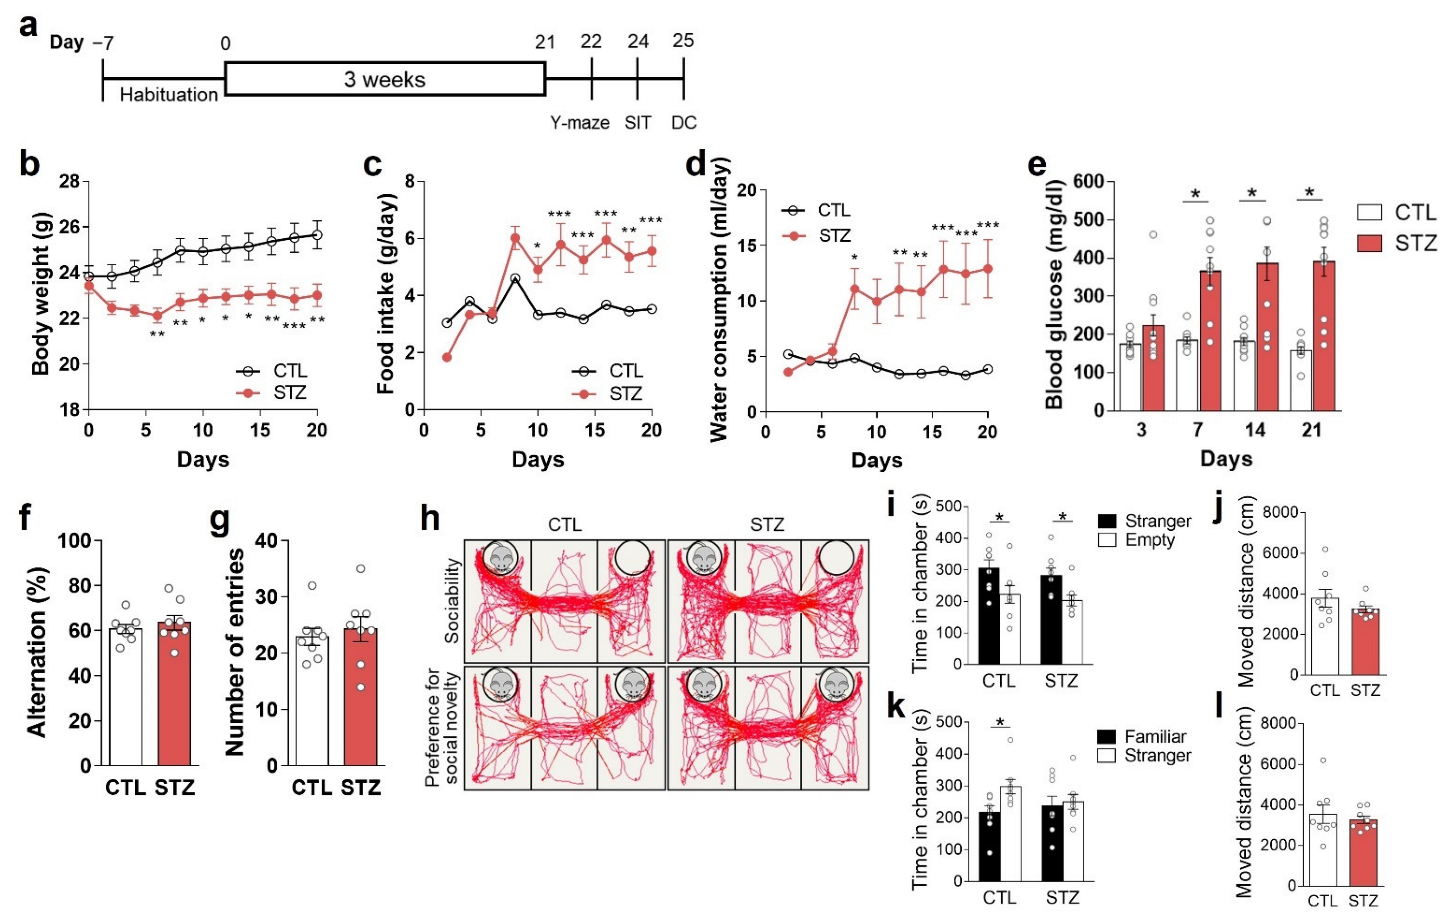
Abstract
:1. Introduction
2. Materials and Methods
2.1. Animals
2.2. STZ-Induced Hyperglycemia Model and Insulin Treatment
2.3. Behavioral Assessments
2.4. Immunohistochemistry
2.5. Western Blot Analysis
2.6. Immunoprecipitation
2.7. Measurements of GS Activity, ROS/RNS, and Amino Acid Levels
2.8. Glutamatergic Neurotransmission Activity Analysis
2.9. Statistical Analysis
3. Results
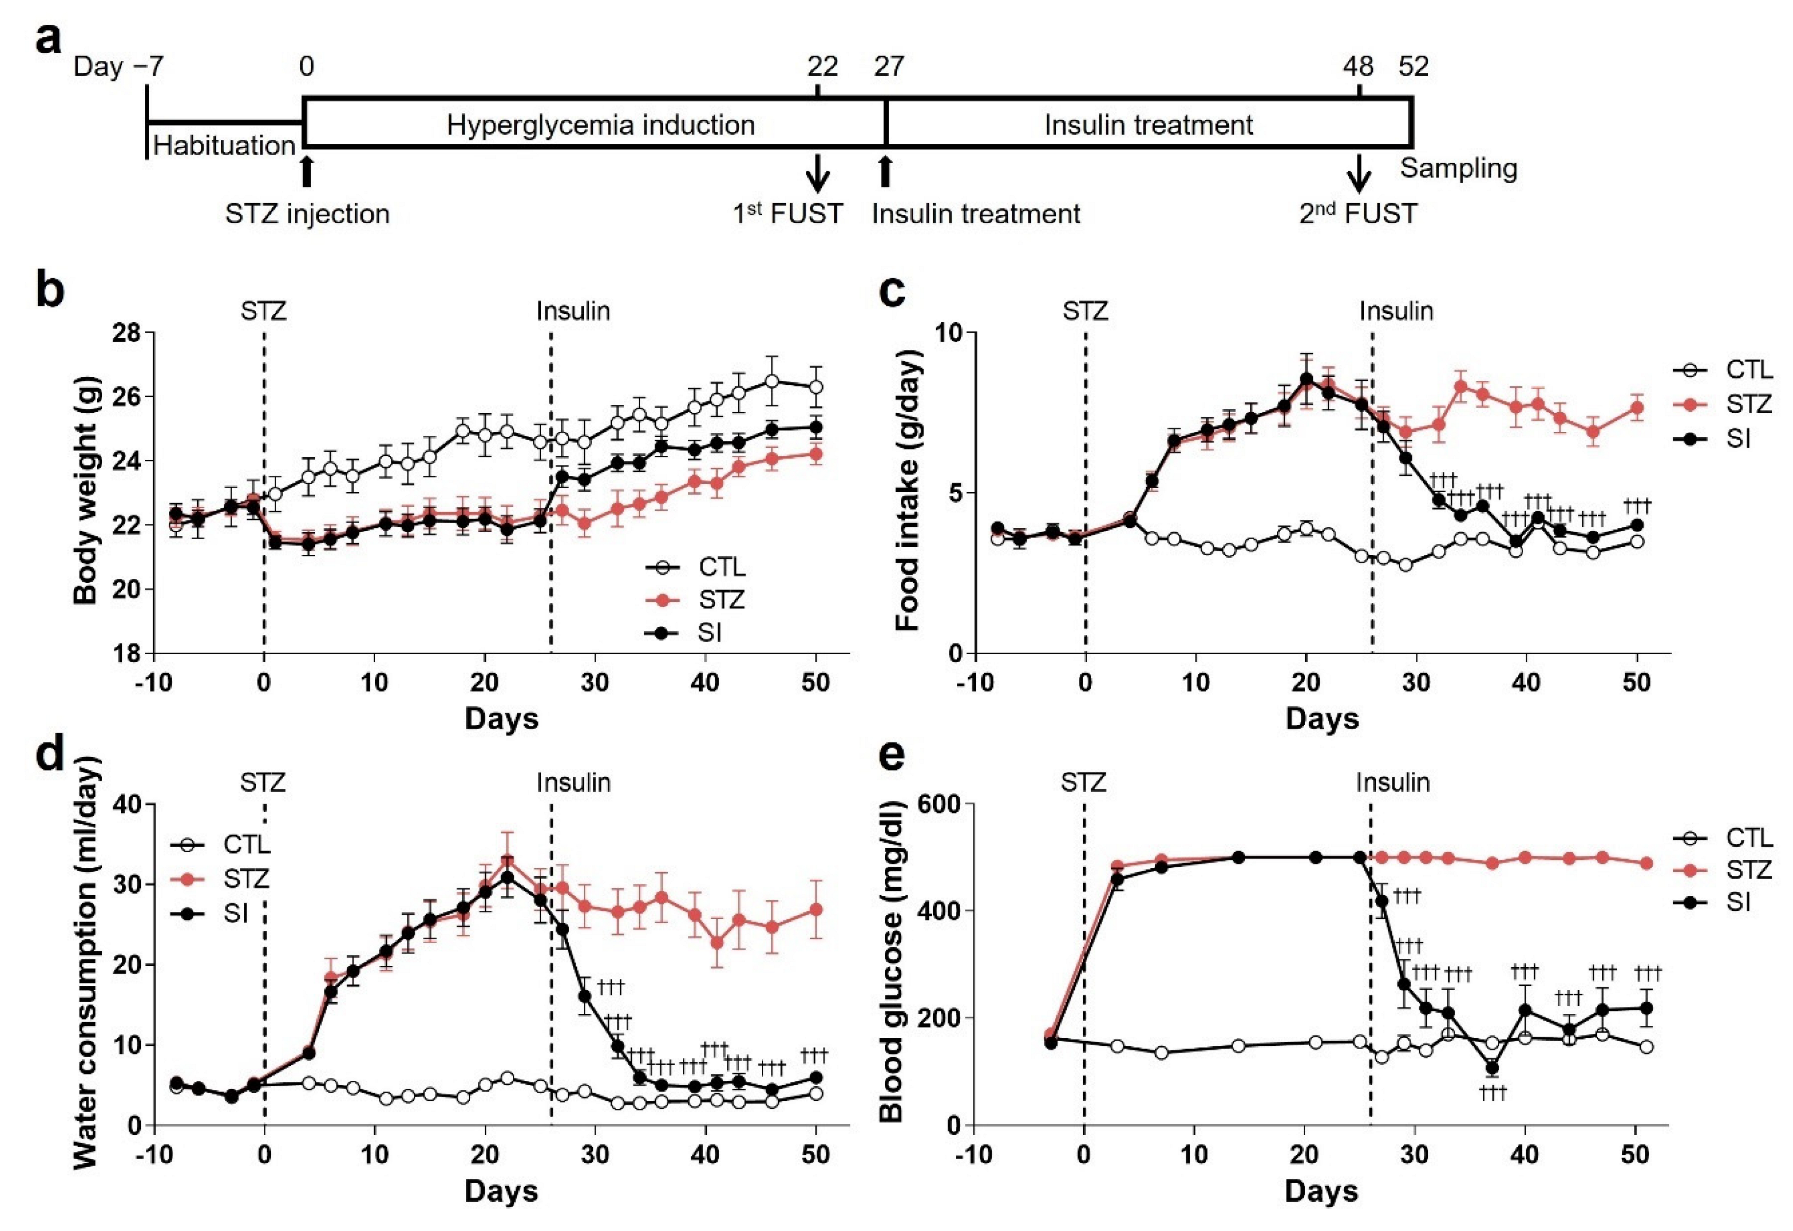
3.1. Hyperglycemia Was Induced by STZ Injection
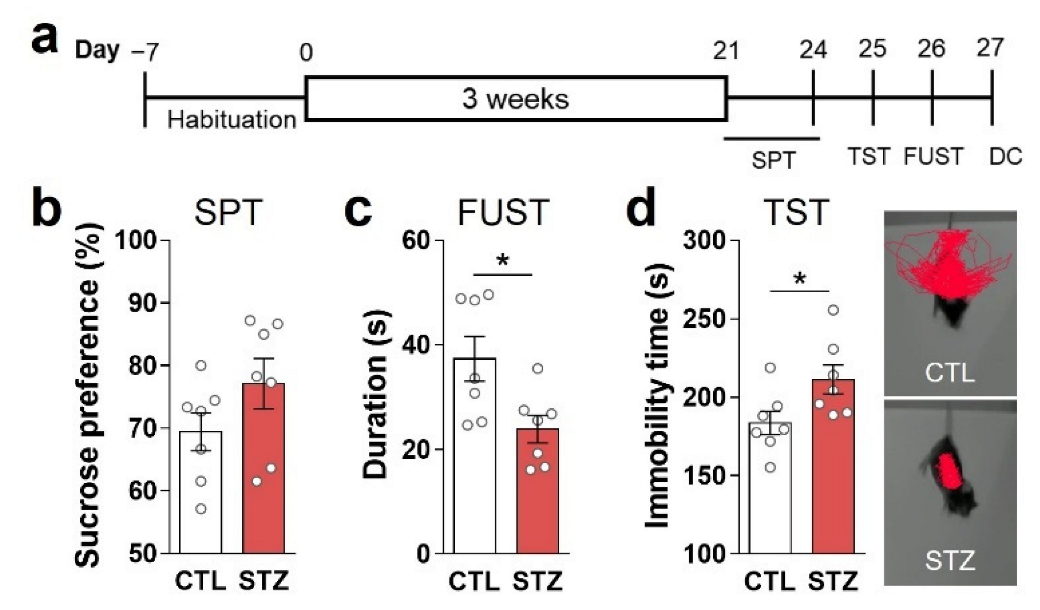
3.2. Hyperglycemia Caused Anhedonic and Despair Behaviors
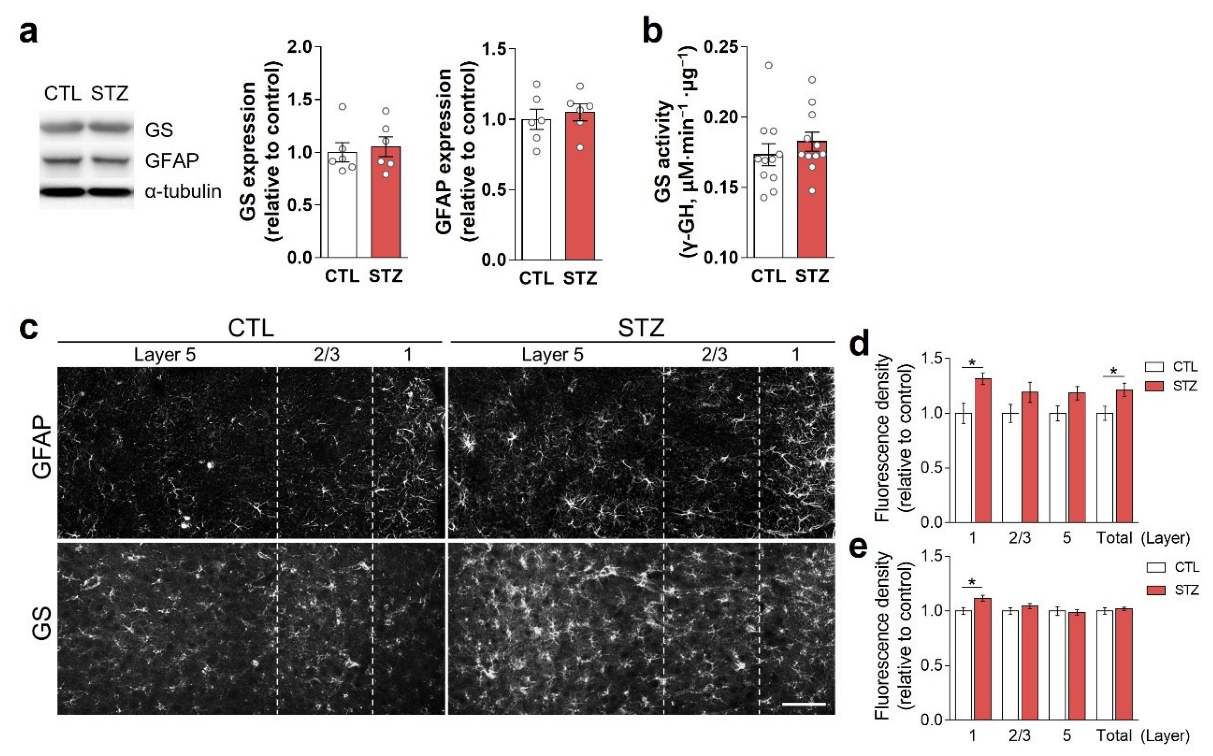
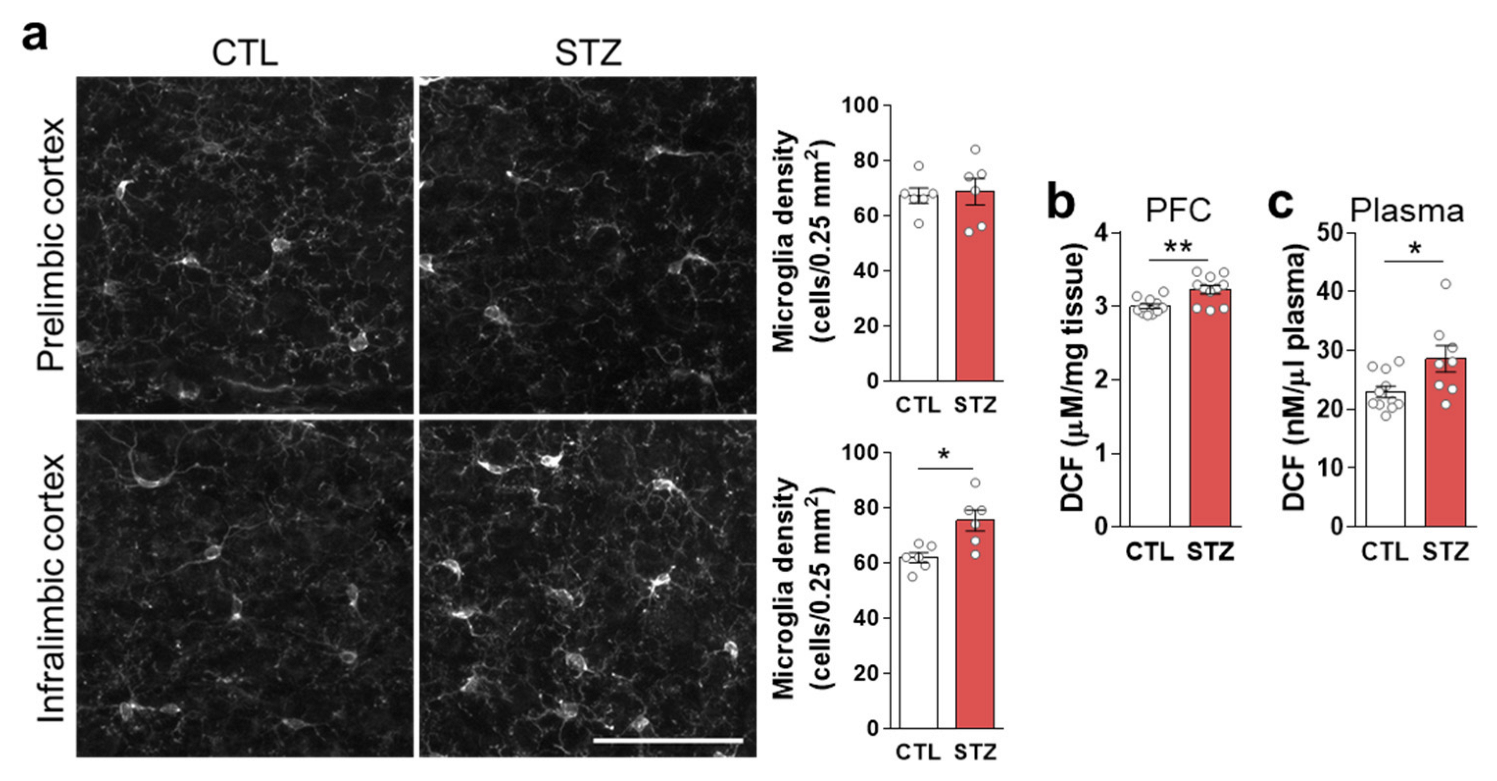
3.3. Hyperglycemia-Induced Gliosis and Oxidative/Nitrative Stress in the Medial Prefrontal Cortex and Plasma
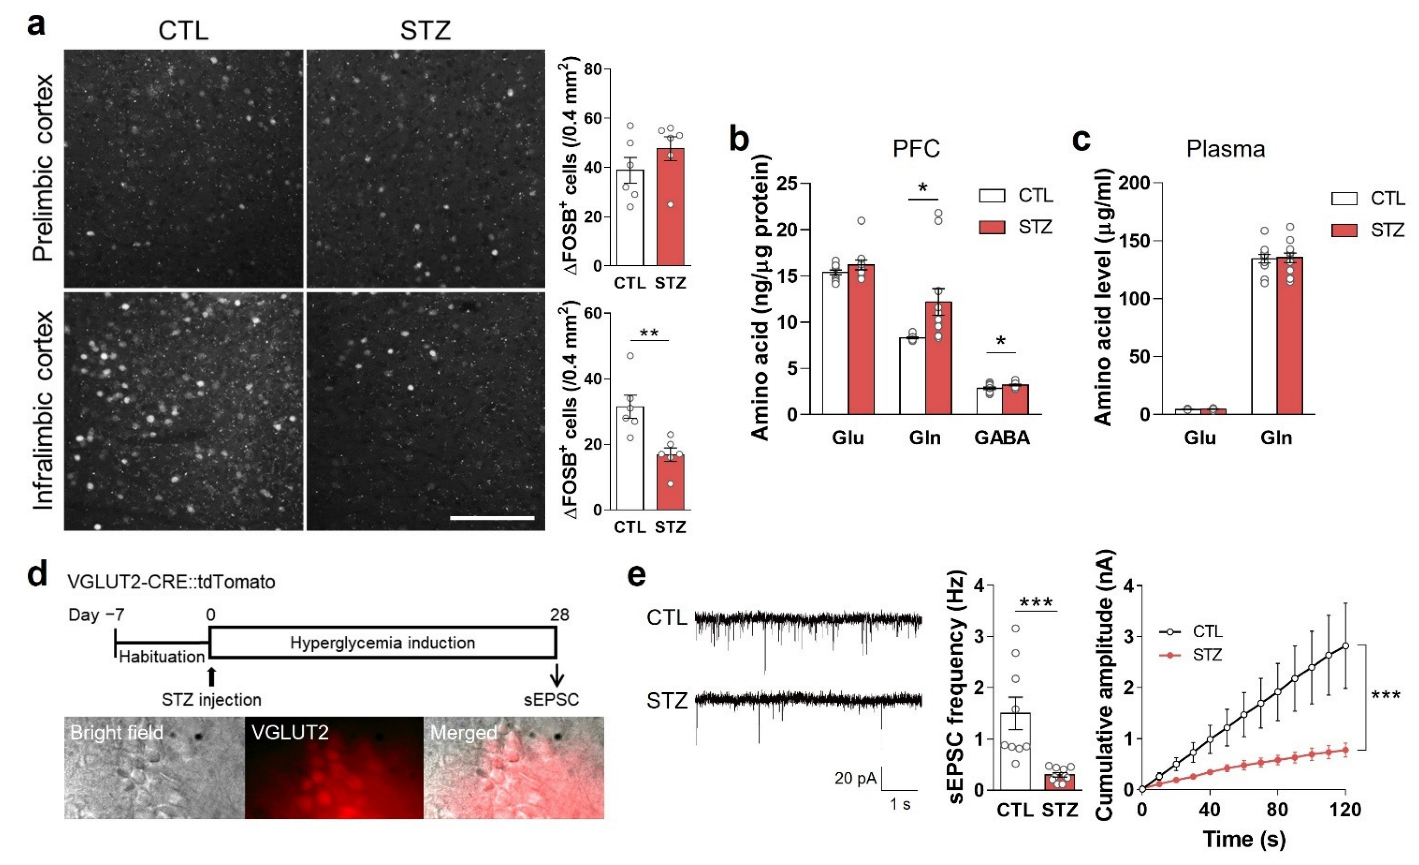
3.4. Hyperglycemia Decreased Glutamatergic Neuronal Activity
3.5. Insulin Treatment Partially Reversed Hyperglycemic Phenotypes
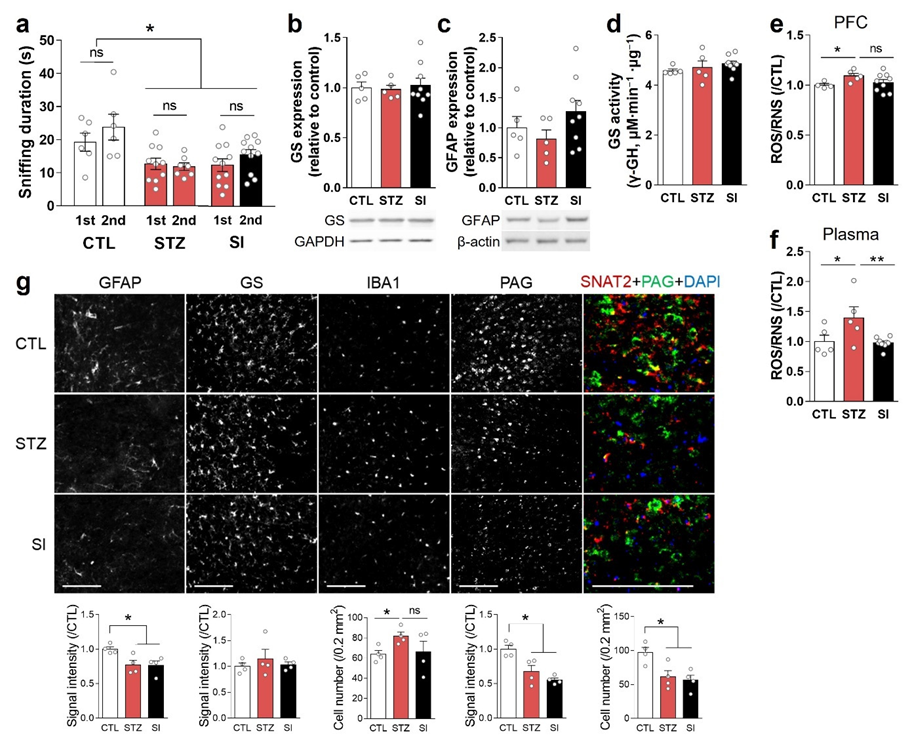
3.6. Insulin Treatment Could Not Completely Reverse Hyperglycemia-Induced Depressive-like Behaviors and Alterations in the PFC
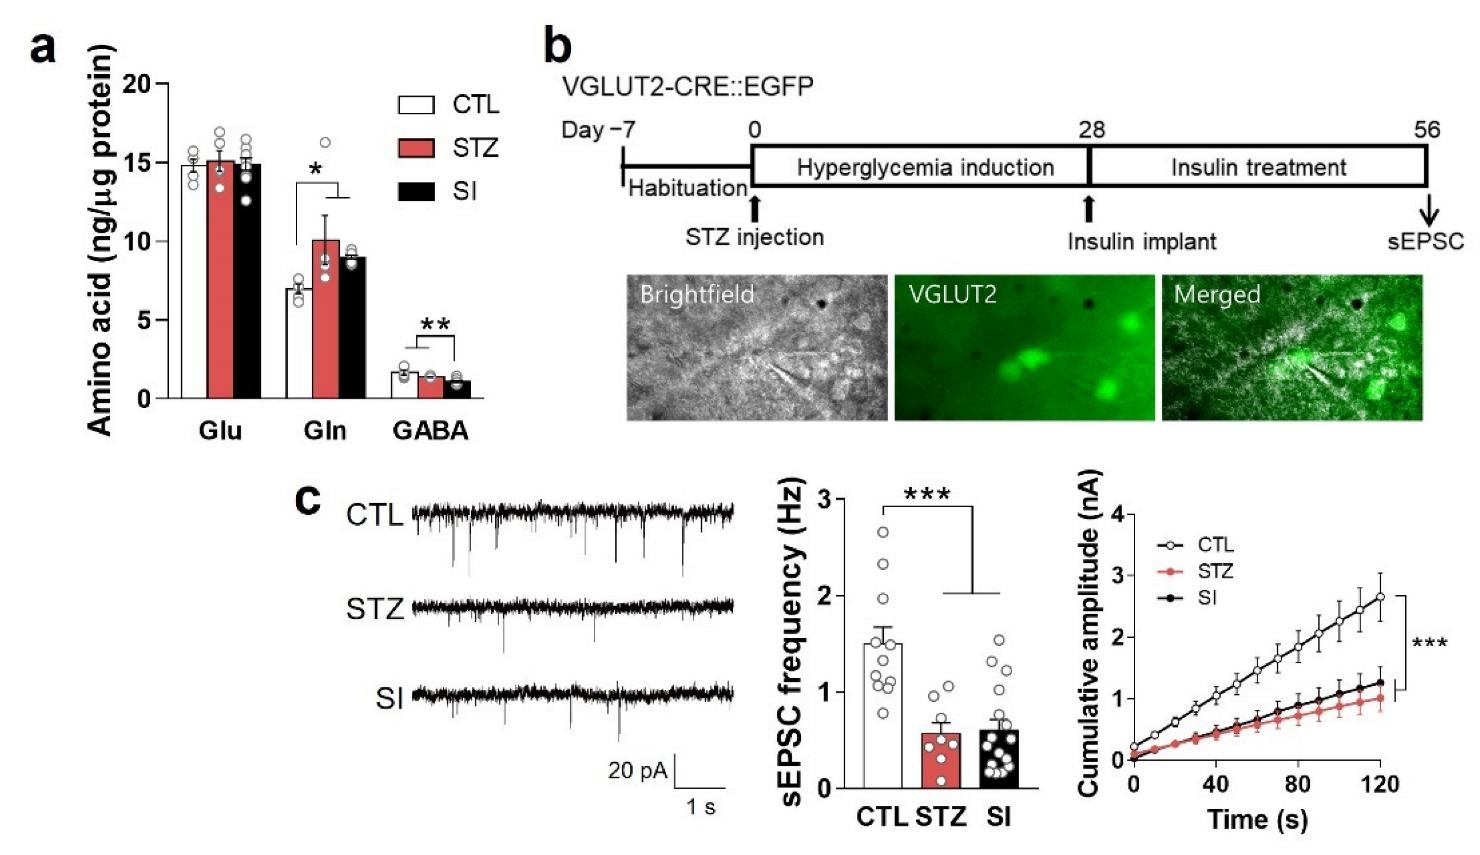
3.7. Neurotransmitter and Hypoactive Glutamatergic Signaling Did Not Change with Insulin Treatment
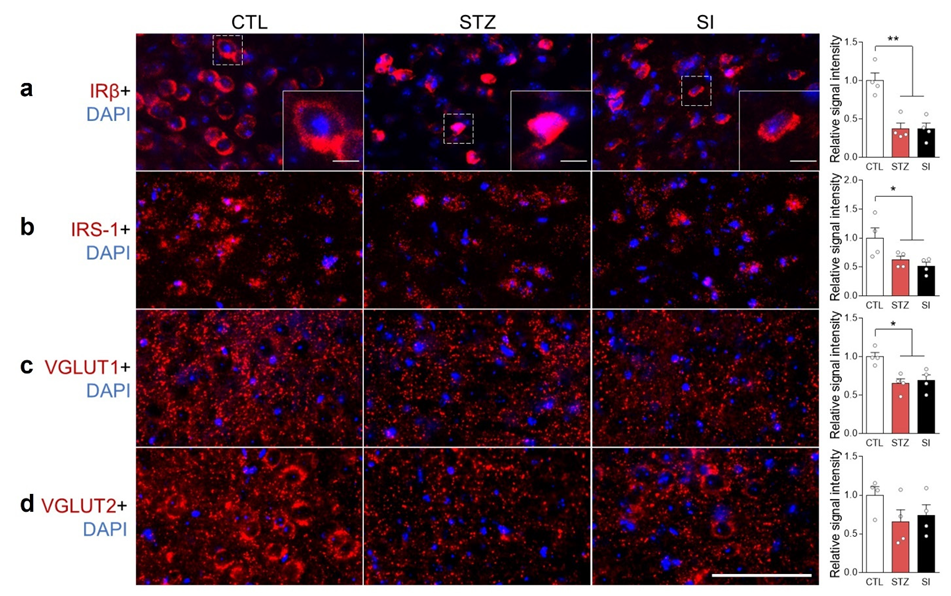
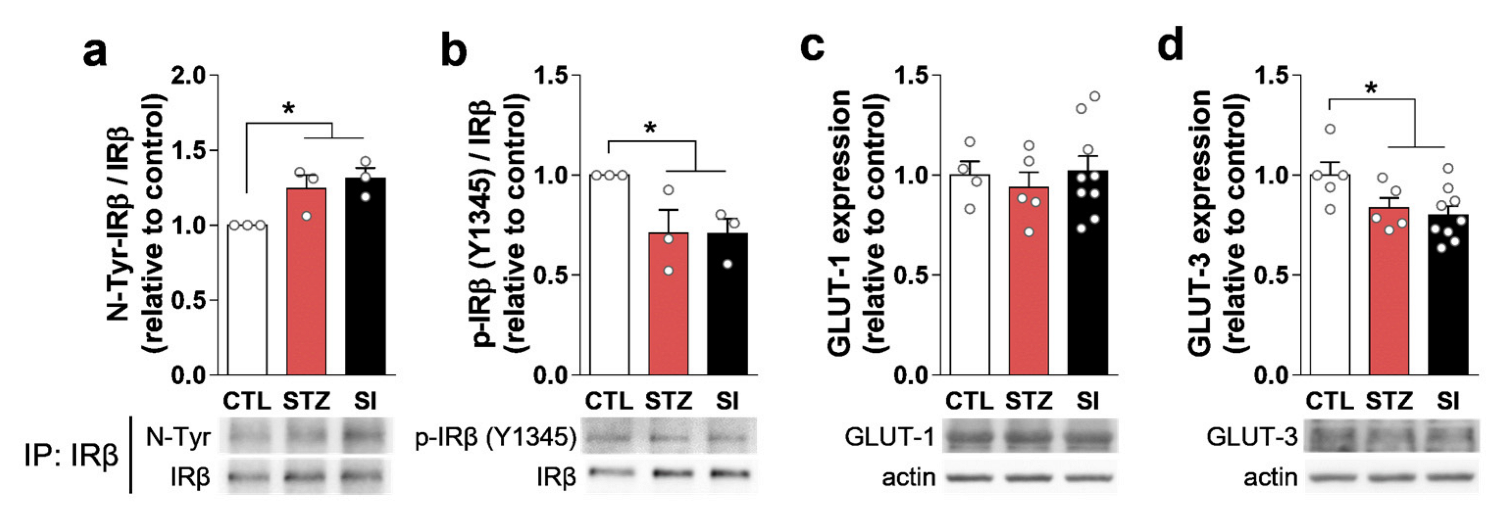
3.8. Hyperglycemia Decreased IRβ and Changed Its Localization in the mPFC
4. Discussion
Author Contributions
Funding
Institutional Review Board Statement
Informed Consent Statement
Data Availability Statement
Acknowledgments
Conflicts of Interest
References
- Bak, E.; Marcisz-Dyla, E.; Mlynarska, A.; Sternal, D.; Kadlubowska, M.; Marcisz, C. Prevalence of Depressive Symptoms in Patients with Type 1 and 2 Diabetes Mellitus. Patient Prefer. Adherence 2020, 14, 443–454. [Google Scholar] [CrossRef] [PubMed] [Green Version]
- Roy, T.; Lloyd, C.E. Epidemiology of depression and diabetes: A systematic review. J. Affect. Disord. 2012, 142, S8–S21. [Google Scholar] [CrossRef] [PubMed]
- Anderson, R.J.; Freedland, K.E.; Clouse, R.E.; Lustman, P.J. The prevalence of comorbid depression in adults with diabetes: A meta-analysis. Diabetes Care 2001, 24, 1069–1078. [Google Scholar] [CrossRef] [PubMed] [Green Version]
- Bai, X.; Liu, Z.; Li, Z.; Yan, D. The association between insulin therapy and depression in patients with type 2 diabetes mellitus: A meta-analysis. BMJ Open 2018, 8, e020062. [Google Scholar] [CrossRef]
- Woo, Y.S.; Lim, H.K.; Wang, S.M.; Bahk, W.M. Clinical Evidence of Antidepressant Effects of Insulin and Anti-Hyperglycemic Agents and Implications for the Pathophysiology of Depression—A Literature Review. Int. J. Mol. Sci. 2020, 21, 6969. [Google Scholar] [CrossRef]
- Son, H.; Jung, S.; Kim, J.Y.; Goo, Y.M.; Cho, K.M.; Lee, D.H.; Roh, G.S.; Kang, S.S.; Cho, G.J.; Choi, W.S.; et al. Type 1 diabetes alters astrocytic properties related with neurotransmitter supply, causing abnormal neuronal activities. Brain Res. 2015, 1602, 32–43. [Google Scholar] [CrossRef]
- Quincozes-Santos, A.; Bobermin, L.D.; de Assis, A.M.; Goncalves, C.A.; Souza, D.O. Fluctuations in glucose levels induce glial toxicity with glutamatergic, oxidative and inflammatory implications. Biochim. Biophys. Acta (BBA) Mol. Basis Dis. 2017, 1863, 1–14. [Google Scholar] [CrossRef]
- Sandireddy, R.; Yerra, V.G.; Areti, A.; Komirishetty, P.; Kumar, A. Neuroinflammation and Oxidative Stress in Diabetic Neuropathy: Futuristic Strategies Based on These Targets. Int. J. Endocrinol. 2014, 2014, 674987. [Google Scholar] [CrossRef] [Green Version]
- van Sloten, T.; Schram, M. Understanding depression in type 2 diabetes: A biological approach in observational studies. F1000Research 2018, 7, 1283. [Google Scholar] [CrossRef]
- Son, H.; Baek, J.H.; Go, B.S.; Jung, D.H.; Sontakke, S.B.; Chung, H.J.; Lee, D.H.; Roh, G.S.; Kang, S.S.; Cho, G.J.; et al. Glutamine has antidepressive effects through increments of glutamate and glutamine levels and glutamatergic activity in the medial prefrontal cortex. Neuropharmacology 2018, 143, 143–152. [Google Scholar] [CrossRef]
- Kang, J.S.; Baek, J.H.; Jung, S.; Chung, H.J.; Lee, D.K.; Kim, H.J. Ingestion of bis(2-ethylhexyl) phthalate (DEHP) during adolescence causes depressive-like behaviors through hypoactive glutamatergic signaling in the medial prefrontal cortex. Environ. Pollut. 2021, 289, 117978. [Google Scholar] [CrossRef] [PubMed]
- Hayashi, K.; Kojima, R.; Ito, M. Strain differences in the diabetogenic activity of streptozotocin in mice. Biol. Pharm. Bull. 2006, 29, 1110–1119. [Google Scholar] [CrossRef] [PubMed] [Green Version]
- Baek, J.H.; Vignesh, A.; Son, H.; Lee, D.H.; Roh, G.S.; Kang, S.S.; Cho, G.J.; Choi, W.S.; Kim, H.J. Glutamine Supplementation Ameliorates Chronic Stress-induced Reductions in Glutamate and Glutamine Transporters in the Mouse Prefrontal Cortex. Exp. Neurobiol. 2019, 28, 270–278. [Google Scholar] [CrossRef] [PubMed]
- Lee, Y.; Son, H.; Kim, G.; Kim, S.; Lee, D.H.; Roh, G.S.; Kang, S.S.; Cho, G.J.; Choi, W.S.; Kim, H.J. Glutamine deficiency in the prefrontal cortex increases depressive-like behaviours in male mice. J. Psychiatry Neurosci. 2013, 38, 183–191. [Google Scholar] [CrossRef] [PubMed] [Green Version]
- Lee, D.K.; Jeong, J.H.; Chun, S.K.; Chua, S., Jr.; Jo, Y.H. Interplay between glucose and leptin signalling determines the strength of GABAergic synapses at POMC neurons. Nat. Commun. 2015, 6, 6618. [Google Scholar] [CrossRef] [Green Version]
- Rodriguez-Perdigon, M.; Solas, M.; Moreno-Aliaga, M.J.; Ramirez, M.J. Lipoic acid improves neuronal insulin signalling and rescues cognitive function regulating VGlut1 expression in high-fat-fed rats: Implications for Alzheimer’s disease. Biochim. Biophys. Acta (BBA) Mol. Basis Dis. 2016, 1862, 511–517. [Google Scholar] [CrossRef]
- Du, X.; Li, J.; Li, M.; Yang, X.; Qi, Z.; Xu, B.; Liu, W.; Xu, Z.; Deng, Y. Research progress on the role of type I vesicular glutamate transporter (VGLUT1) in nervous system diseases. Cell Biosci. 2020, 10, 26. [Google Scholar] [CrossRef] [Green Version]
- Coleman, E.S.; Dennis, J.C.; Braden, T.D.; Judd, R.L.; Posner, P. Insulin treatment prevents diabetes-induced alterations in astrocyte glutamate uptake and GFAP content in rats at 4 and 8 weeks of diabetes duration. Brain Res. 2010, 1306, 131–141. [Google Scholar] [CrossRef] [Green Version]
- Ho, N.; Balu, D.T.; Hilario, M.R.F.; Blendy, J.A.; Lucki, I. Depressive phenotypes evoked by experimental diabetes are reversed by insulin. Physiol. Behav. 2012, 105, 702–708. [Google Scholar] [CrossRef] [Green Version]
- Dutta, S.; Sengupta, P. Men and mice: Relating their ages. Life Sci. 2016, 152, 244–248. [Google Scholar] [CrossRef]
- Ransom, B.R.; Ransom, C.B. Astrocytes: Multitalented stars of the central nervous system. Methods Mol. Biol. 2012, 814, 3–7. [Google Scholar] [CrossRef] [PubMed]
- Belanger, M.; Allaman, I.; Magistretti, P.J. Brain energy metabolism: Focus on astrocyte-neuron metabolic cooperation. Cell Metab. 2011, 14, 724–738. [Google Scholar] [CrossRef] [PubMed] [Green Version]
- Popoli, M.; Yan, Z.; McEwen, B.S.; Sanacora, G. The stressed synapse: The impact of stress and glucocorticoids on glutamate transmission. Nat. Rev. Neurosci. 2011, 13, 22–37. [Google Scholar] [CrossRef] [Green Version]
- Danbolt, N.C. Glutamate uptake. Prog. Neurobiol. 2001, 65, 1–105. [Google Scholar] [CrossRef] [PubMed]
- Dienel, G.A. Brain Glucose Metabolism: Integration of Energetics with Function. Physiol. Rev. 2019, 99, 949–1045. [Google Scholar] [CrossRef] [PubMed]
- Leão, L.L.; Tangen, G.; Barca, M.L.; Engedal, K.; Santos, S.H.S.; Machado, F.S.M.; de Paula, A.M.B.; Monteiro-Junior, R.S. Does hyperglycemia downregulate glucose transporters in the brain? Med. Hypotheses 2020, 139, 109614. [Google Scholar] [CrossRef]
- Hou, W.K.; Xian, Y.X.; Zhang, L.; Lai, H.; Hou, X.G.; Xu, Y.X.; Yu, T.; Xu, F.Y.; Song, J.; Fu, C.L.; et al. Influence of blood glucose on the expression of glucose trans-porter proteins 1 and 3 in the brain of diabetic rats. Chin. Med. J. 2007, 120, 1704–1709. [Google Scholar] [CrossRef] [PubMed]
- Divakaruni, A.S.; Wallace, M.; Buren, C.; Martyniuk, K.; Andreyev, A.Y.; Li, E.; Fields, J.A.; Cordes, T.; Reynolds, I.J.; Bloodgood, B.L.; et al. Inhibition of the mitochondrial pyruvate carrier protects from excitotoxic neuronal death. J. Cell Biol. 2017, 216, 1091–1105. [Google Scholar] [CrossRef] [Green Version]
- White, P.J.; Charbonneau, A.; Cooney, G.J.; Marette, A. Nitrosative modifications of protein and lipid signaling molecules by reactive nitrogen species. Am. J. Physiol. Endocrinol. Metab. 2010, 299, E868–E878. [Google Scholar] [CrossRef] [Green Version]
- Charbonneau, A.; Marette, A. Inducible Nitric Oxide Synthase Induction Underlies Lipid-Induced Hepatic Insulin Resistance in Mice: Potential Role of Tyrosine Nitration of Insulin Signaling Proteins. Diabetes 2010, 59, 861–871. [Google Scholar] [CrossRef]


Publisher’s Note: MDPI stays neutral with regard to jurisdictional claims in published maps and institutional affiliations. |
© 2022 by the authors. Licensee MDPI, Basel, Switzerland. This article is an open access article distributed under the terms and conditions of the Creative Commons Attribution (CC BY) license (https://creativecommons.org/licenses/by/4.0/).
Share and Cite
Baek, J.H.; Son, H.; Kang, J.S.; Yoo, D.Y.; Chung, H.J.; Lee, D.K.; Kim, H.J. Long-Term Hyperglycemia Causes Depressive Behaviors in Mice with Hypoactive Glutamatergic Activity in the Medial Prefrontal Cortex, Which Is Not Reversed by Insulin Treatment. Cells 2022, 11, 4012. https://0-doi-org.brum.beds.ac.uk/10.3390/cells11244012
Baek JH, Son H, Kang JS, Yoo DY, Chung HJ, Lee DK, Kim HJ. Long-Term Hyperglycemia Causes Depressive Behaviors in Mice with Hypoactive Glutamatergic Activity in the Medial Prefrontal Cortex, Which Is Not Reversed by Insulin Treatment. Cells. 2022; 11(24):4012. https://0-doi-org.brum.beds.ac.uk/10.3390/cells11244012
Chicago/Turabian StyleBaek, Ji Hyeong, Hyeonwi Son, Jae Soon Kang, Dae Young Yoo, Hye Jin Chung, Dong Kun Lee, and Hyun Joon Kim. 2022. "Long-Term Hyperglycemia Causes Depressive Behaviors in Mice with Hypoactive Glutamatergic Activity in the Medial Prefrontal Cortex, Which Is Not Reversed by Insulin Treatment" Cells 11, no. 24: 4012. https://0-doi-org.brum.beds.ac.uk/10.3390/cells11244012