
Histone H3 Lysine 4 and 27 Trimethylation Landscape of Human Alzheimer’s Disease


 ,
,  , , , , and
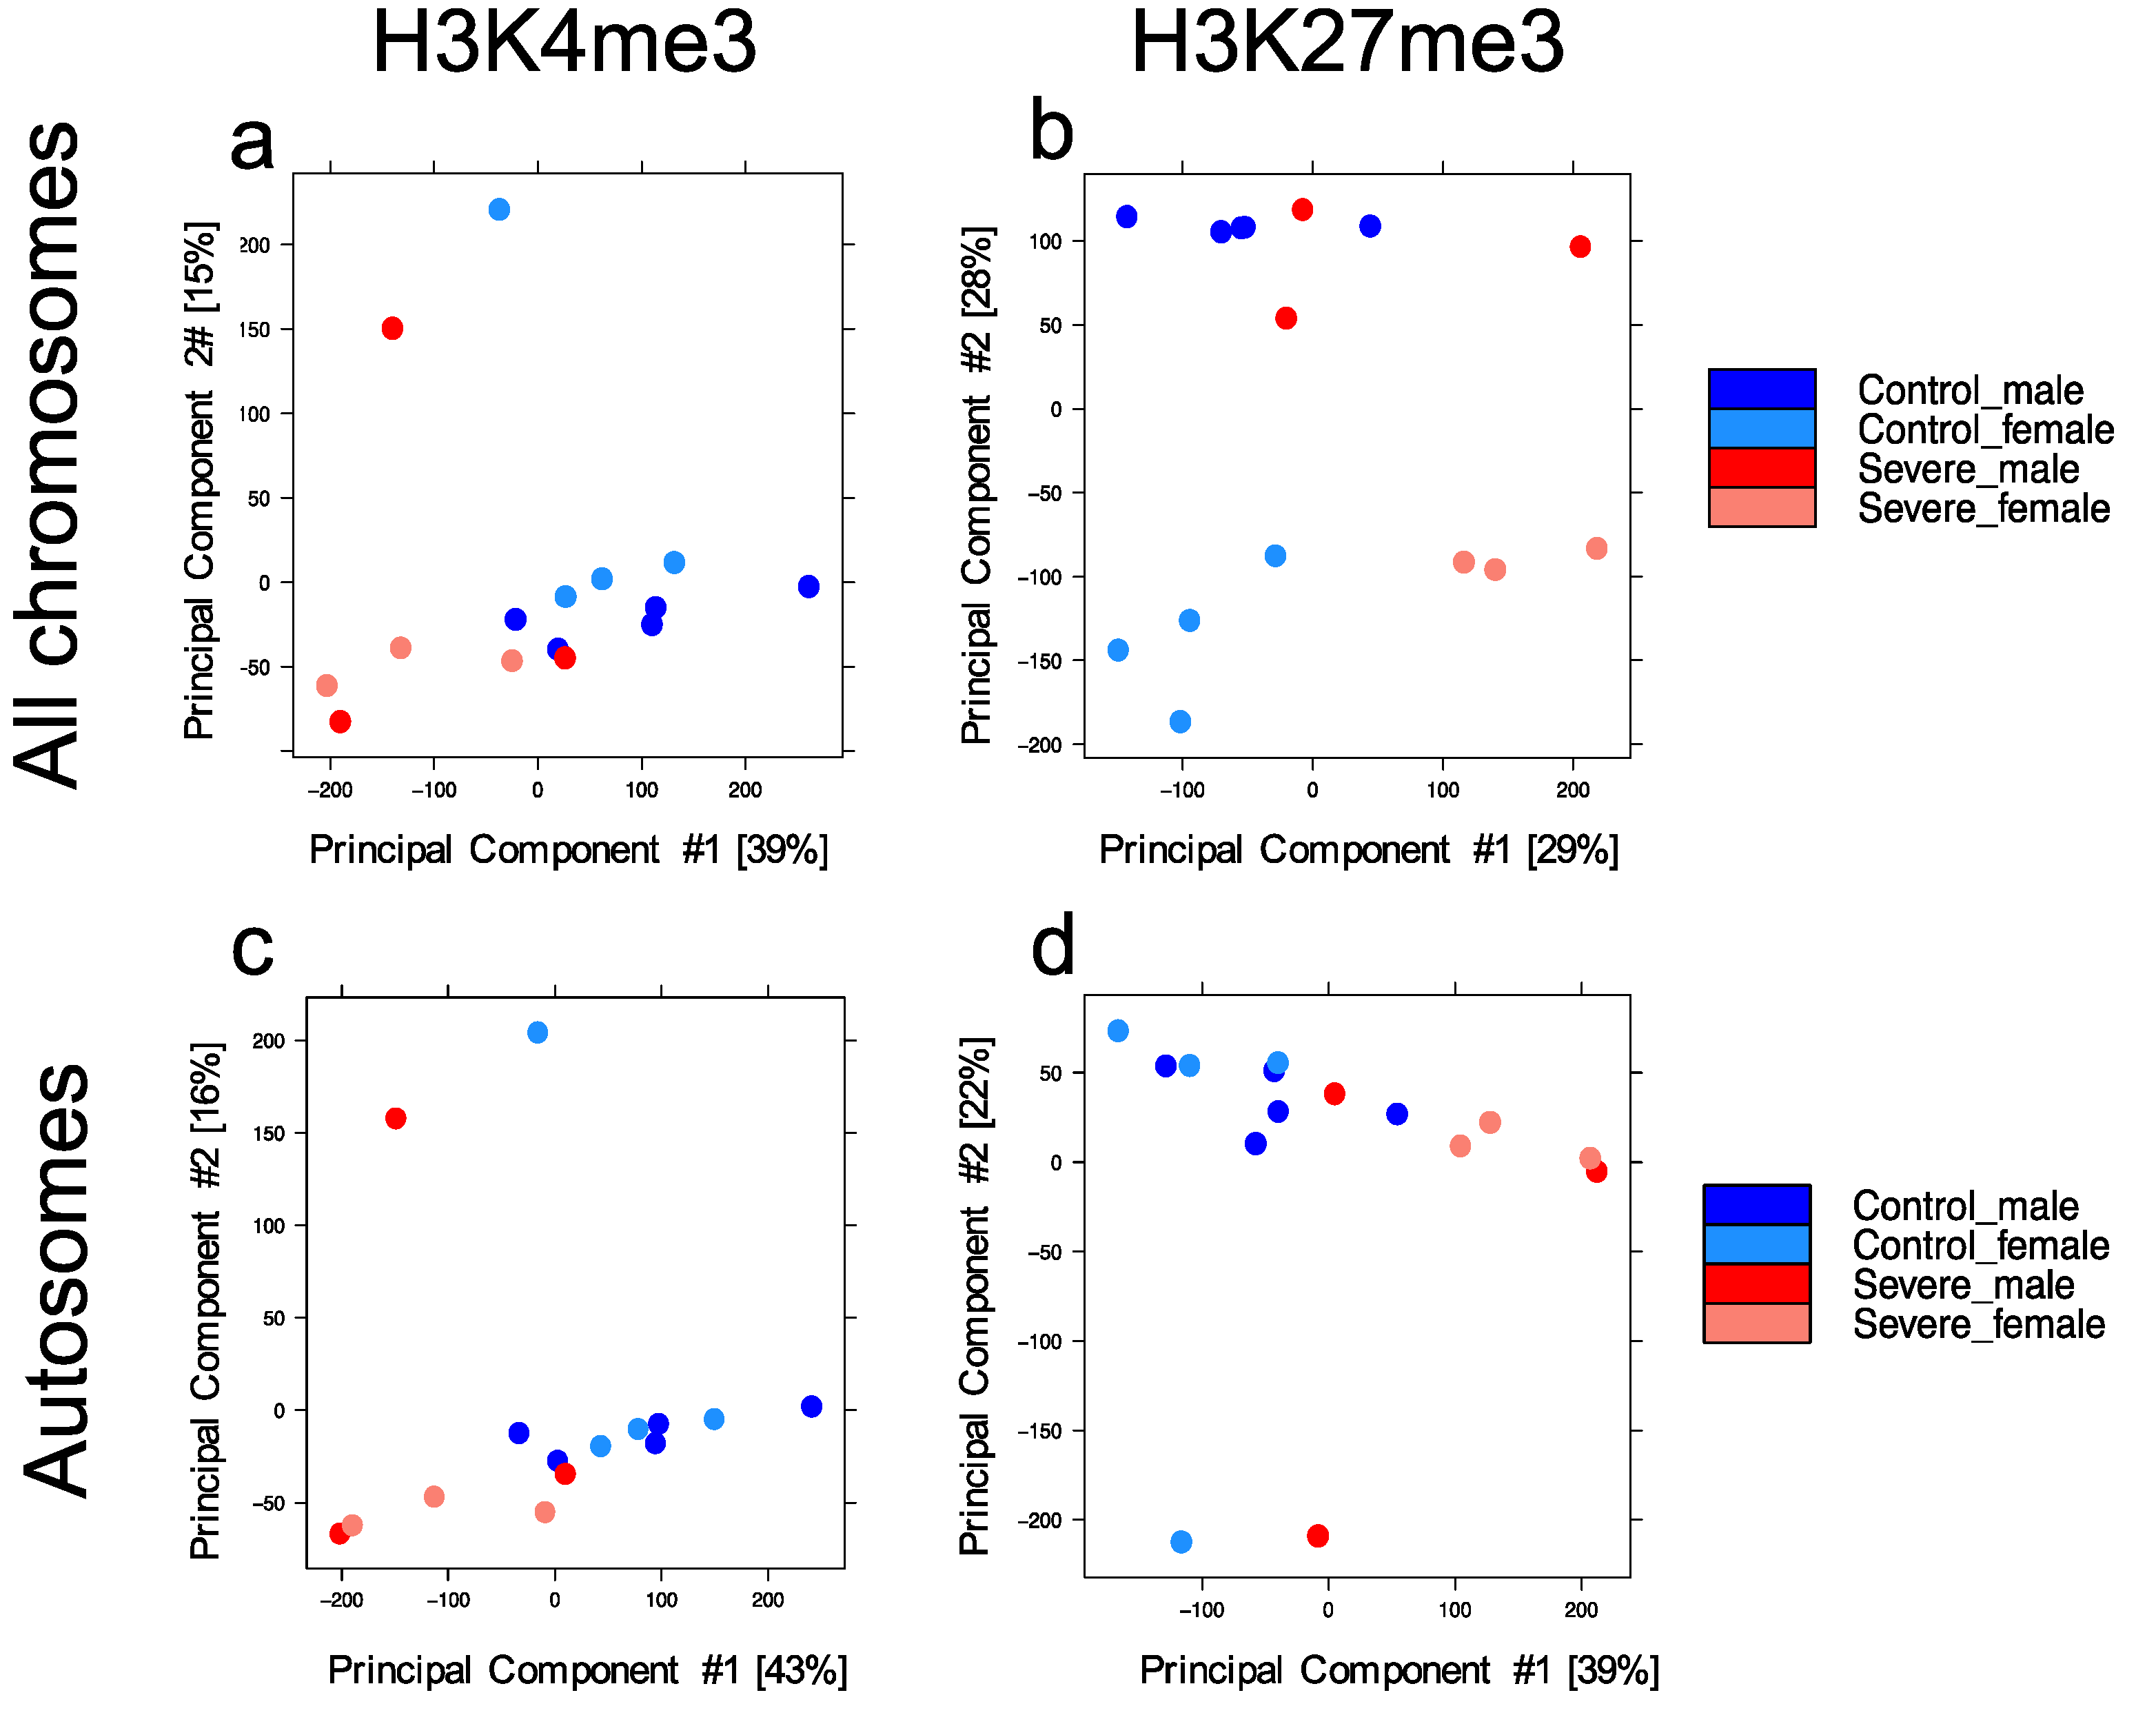
Abstract
:1. Introduction
2. Materials and Methods
2.1. Samples
2.2. ChIP-Seq
2.3. Computational Pipeline
3. Results
3.1. Entorhinal Cortex Dataset for Genome-Wide Profile of H3k4me3 and H3k27me3
3.2. Severe Alzheimer’s Disease Has an Impact on H3k4me3 and H3k27me3 Landscape
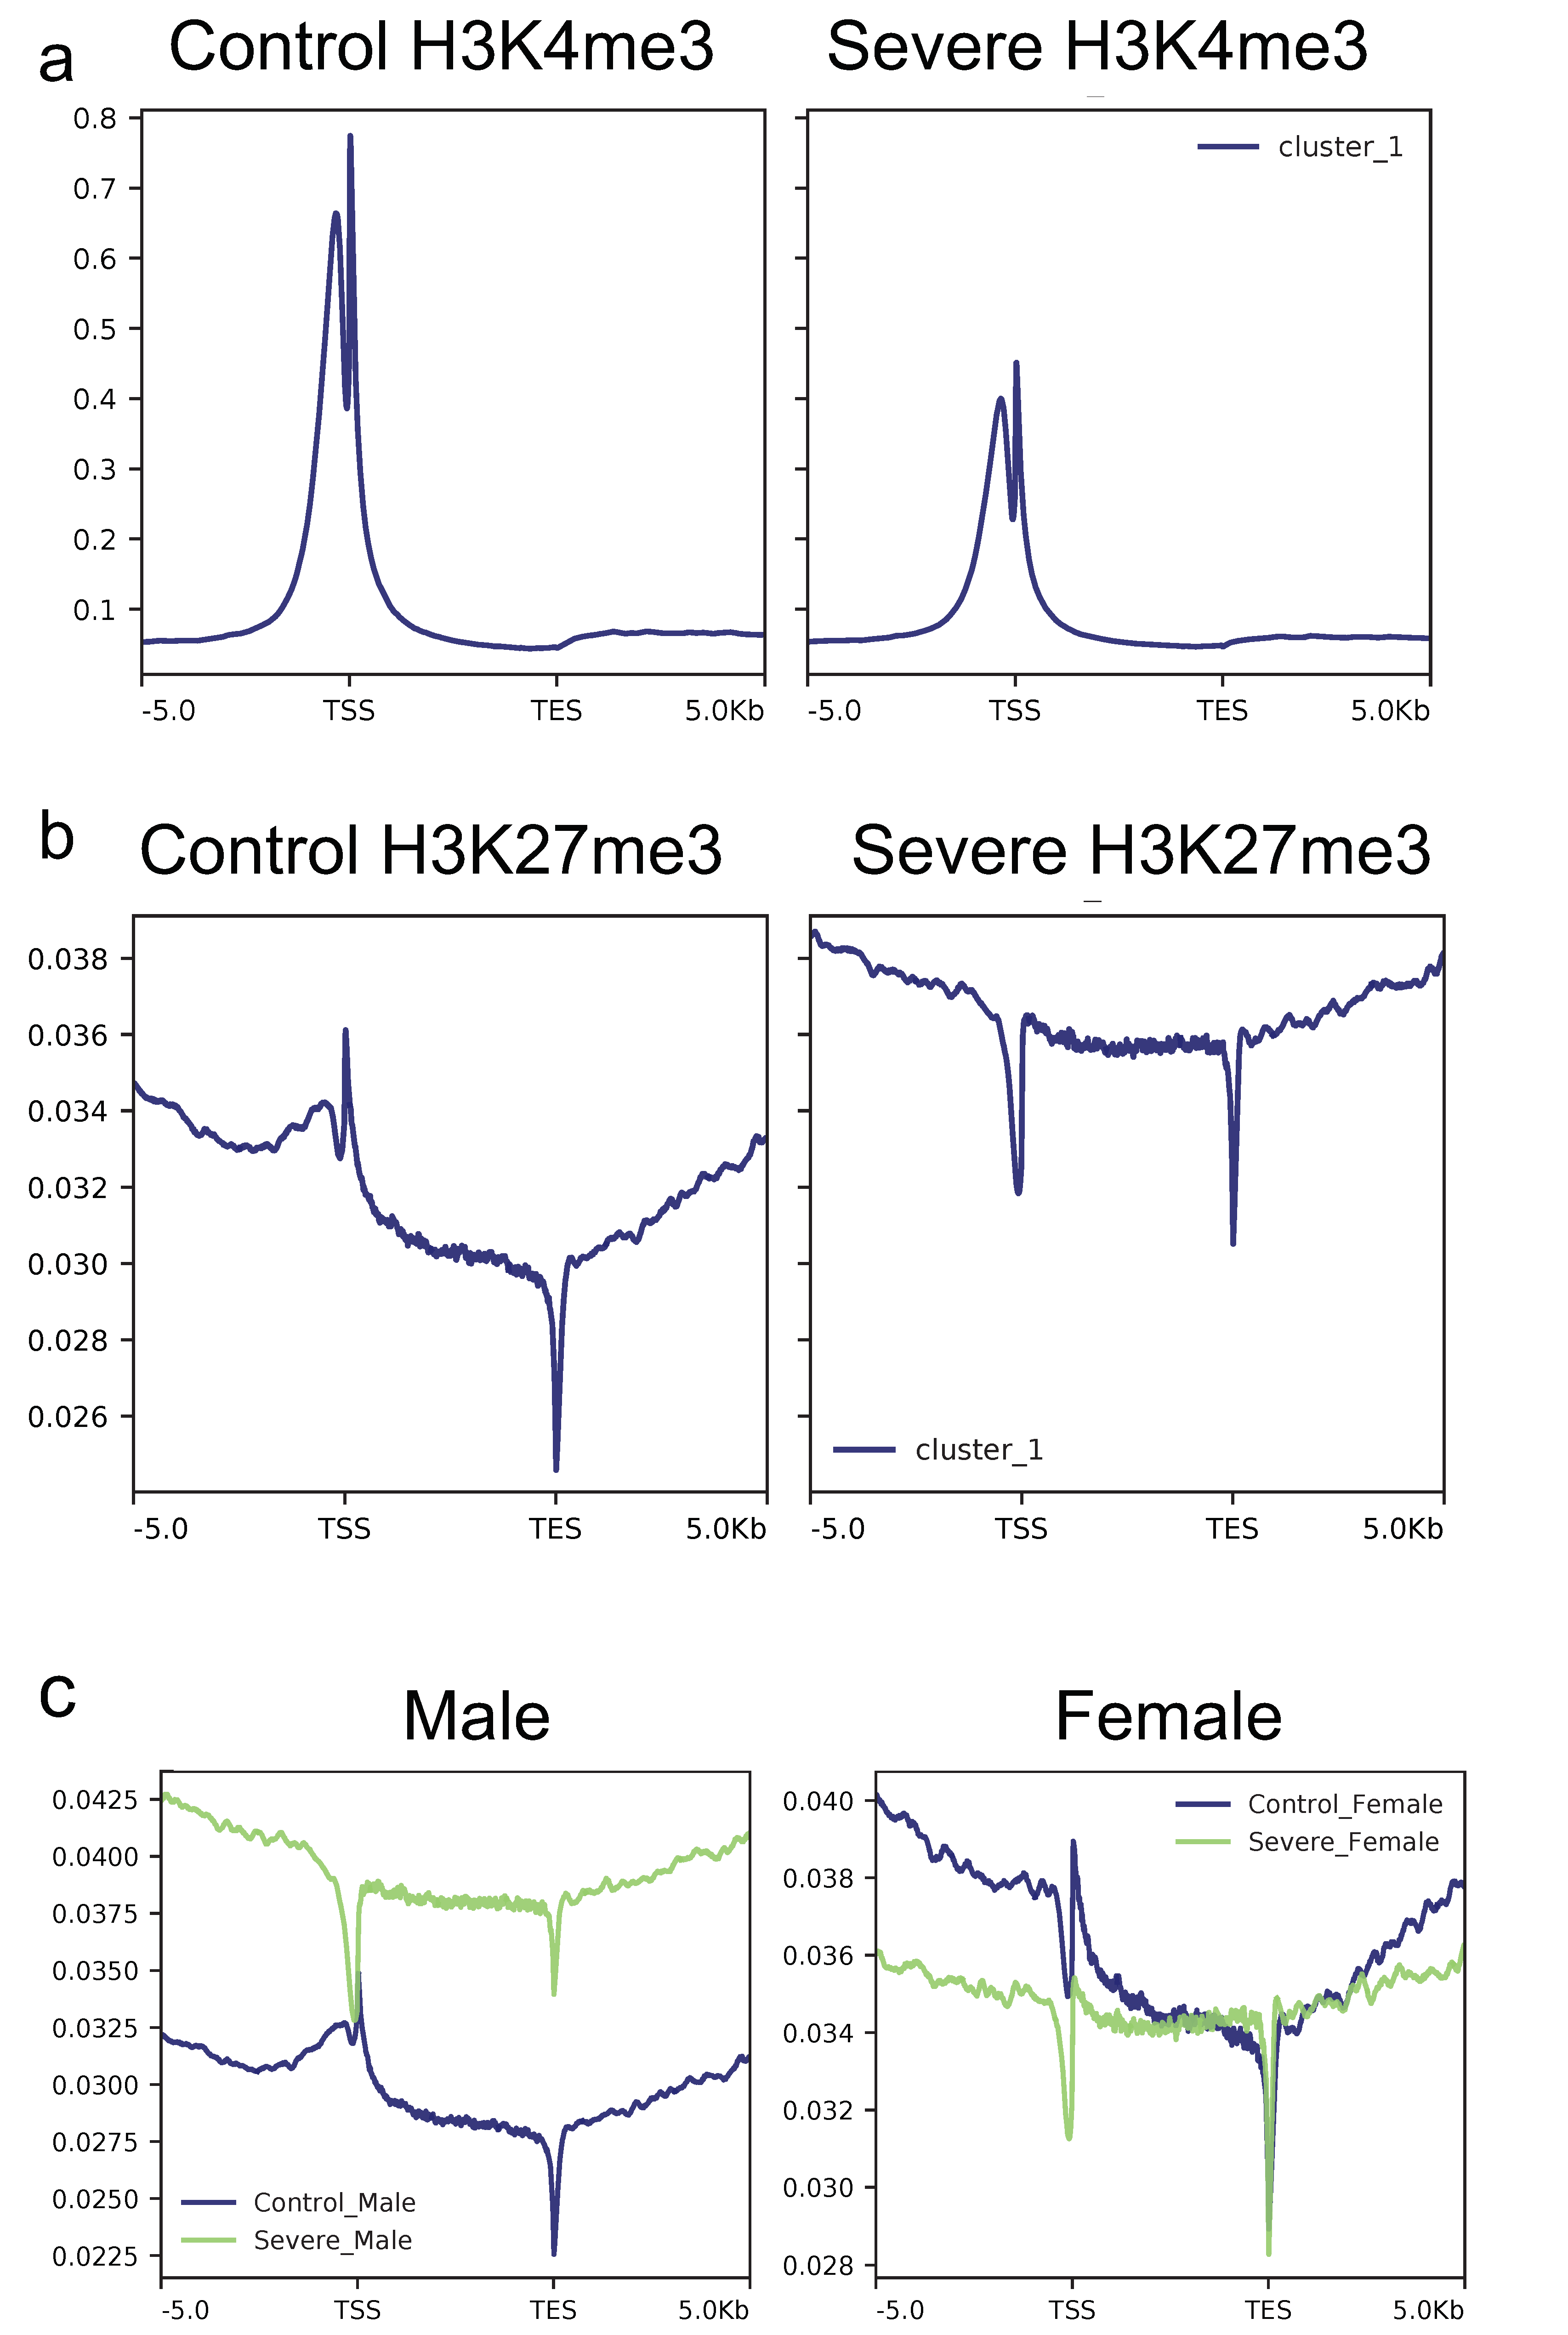
3.3. Severe AD Patients Show a Decreased H3k4me3 and a Concomitant Increase of H3k27me3 Signal in Gene Loci
3.4. Severe Alzheimer’s Disease Is Characterized by a More Spread in H3k4me3 Signal
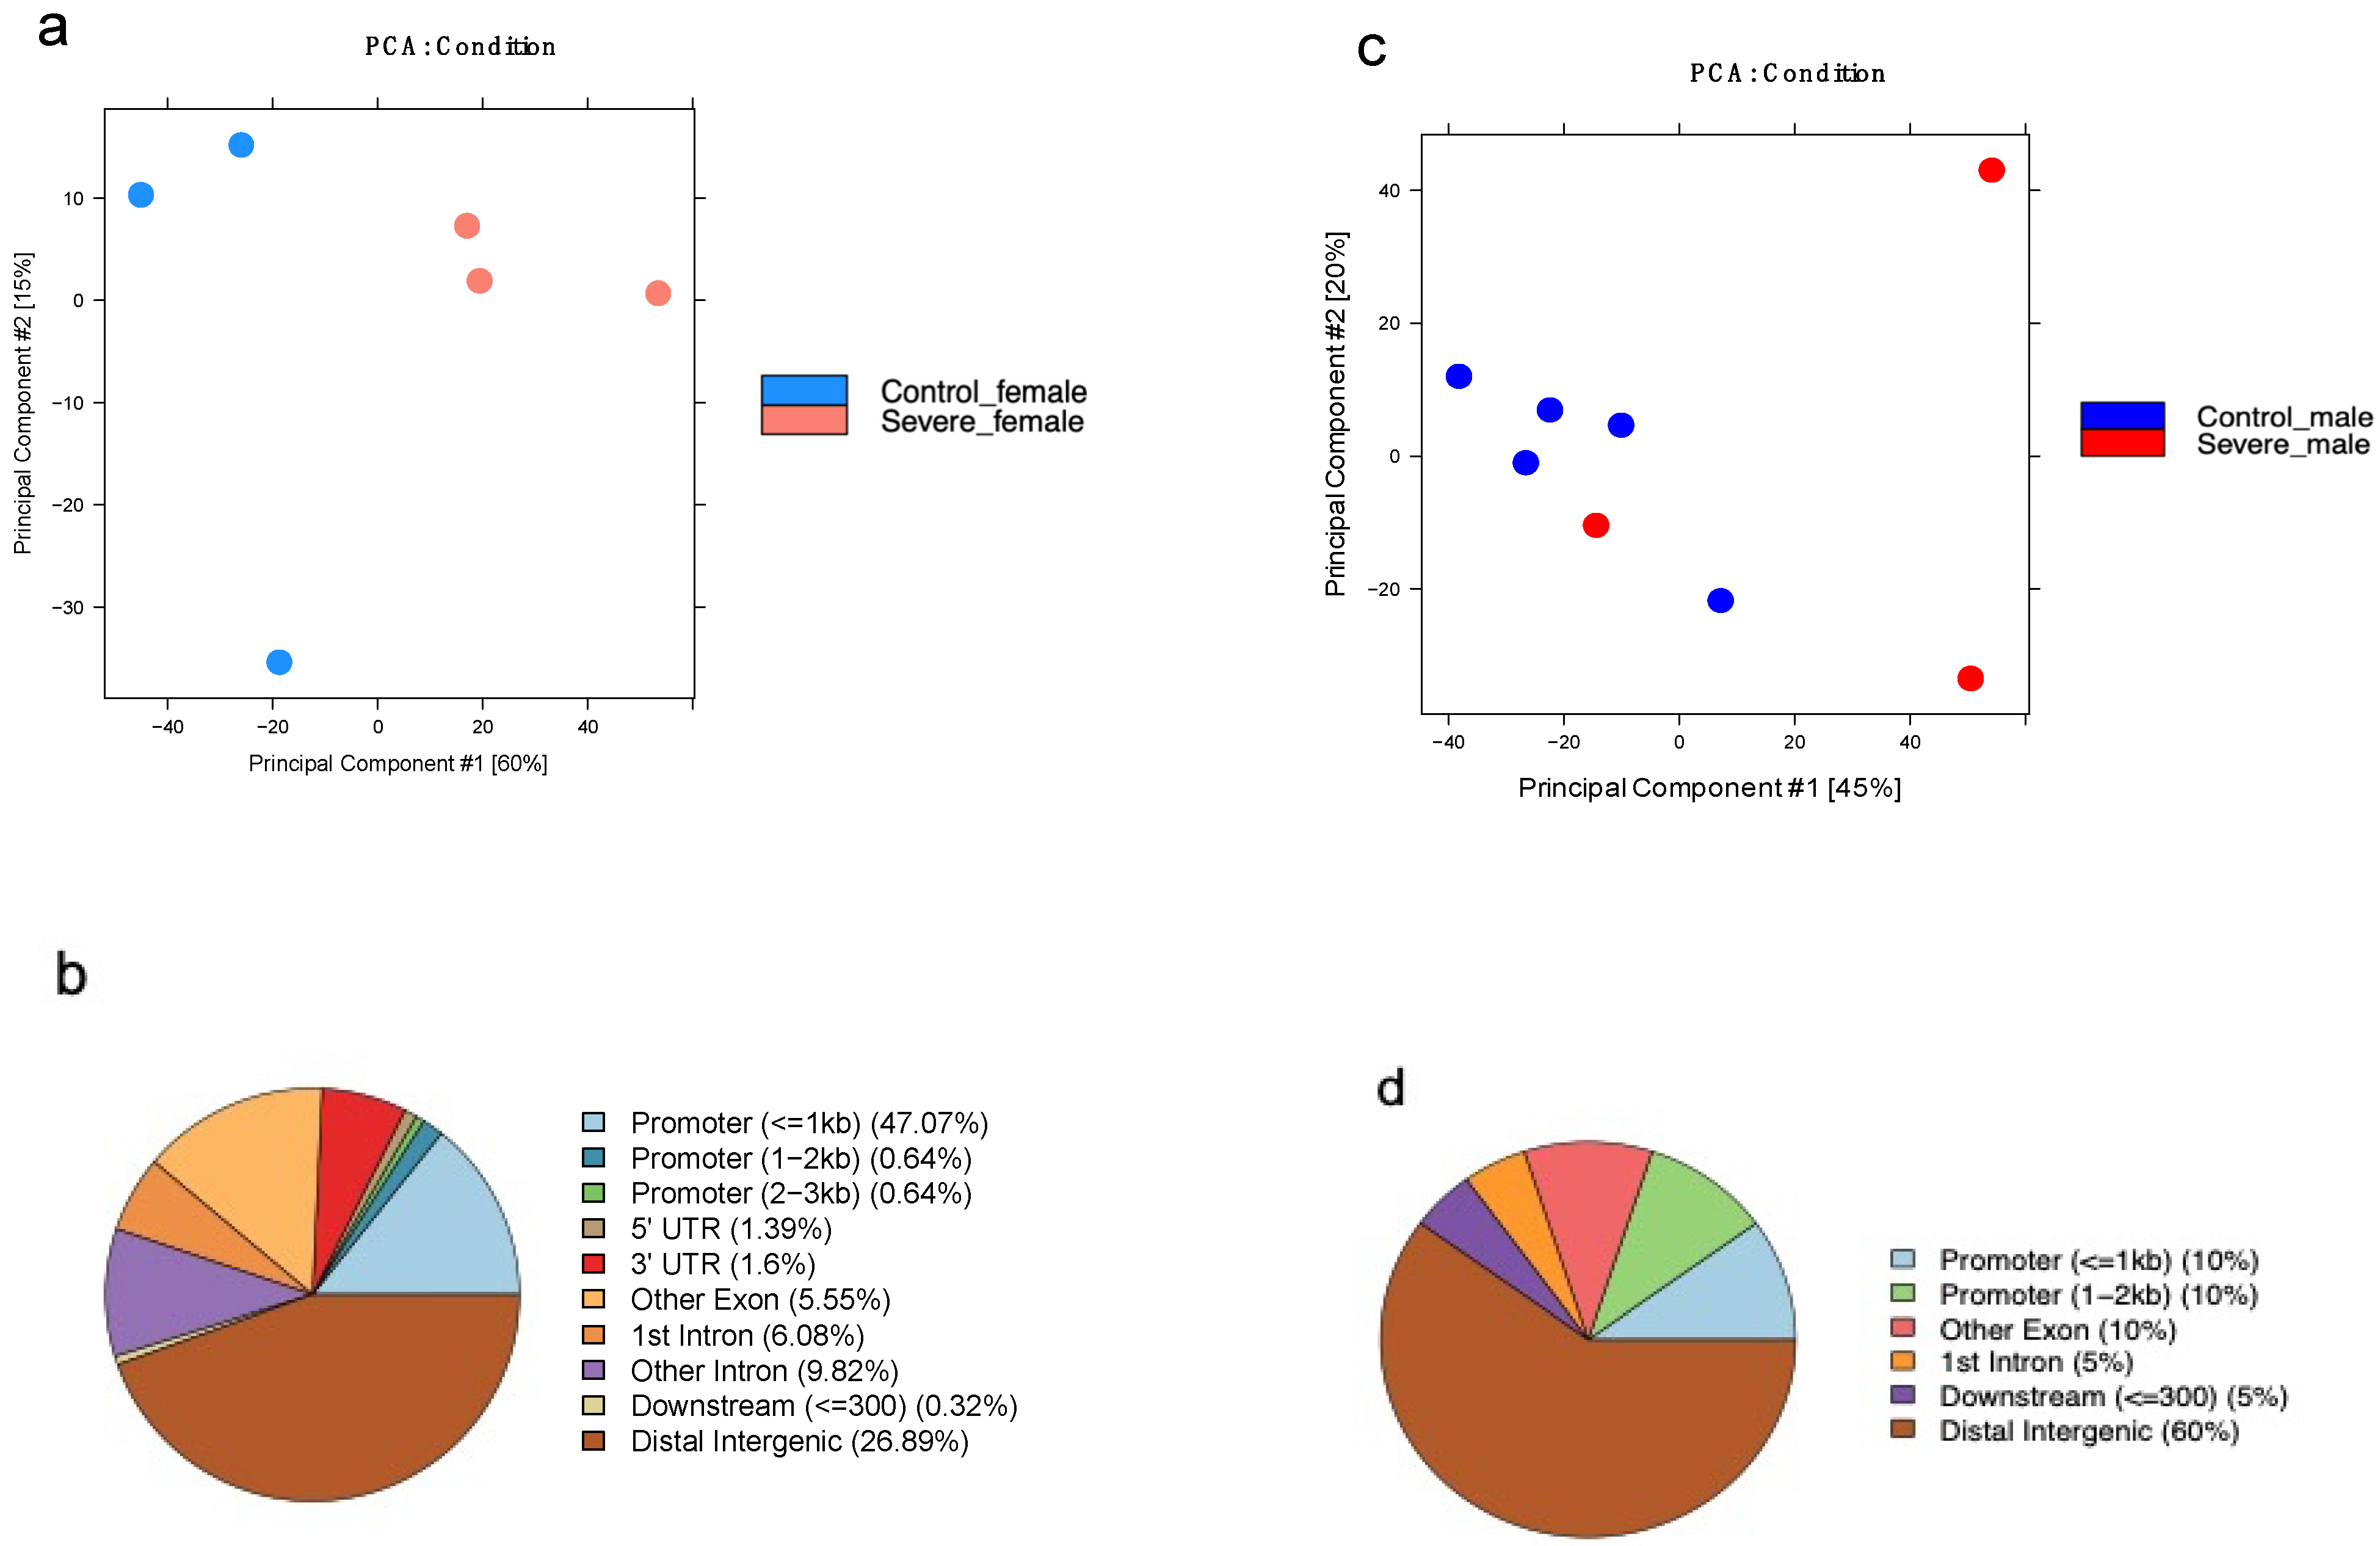
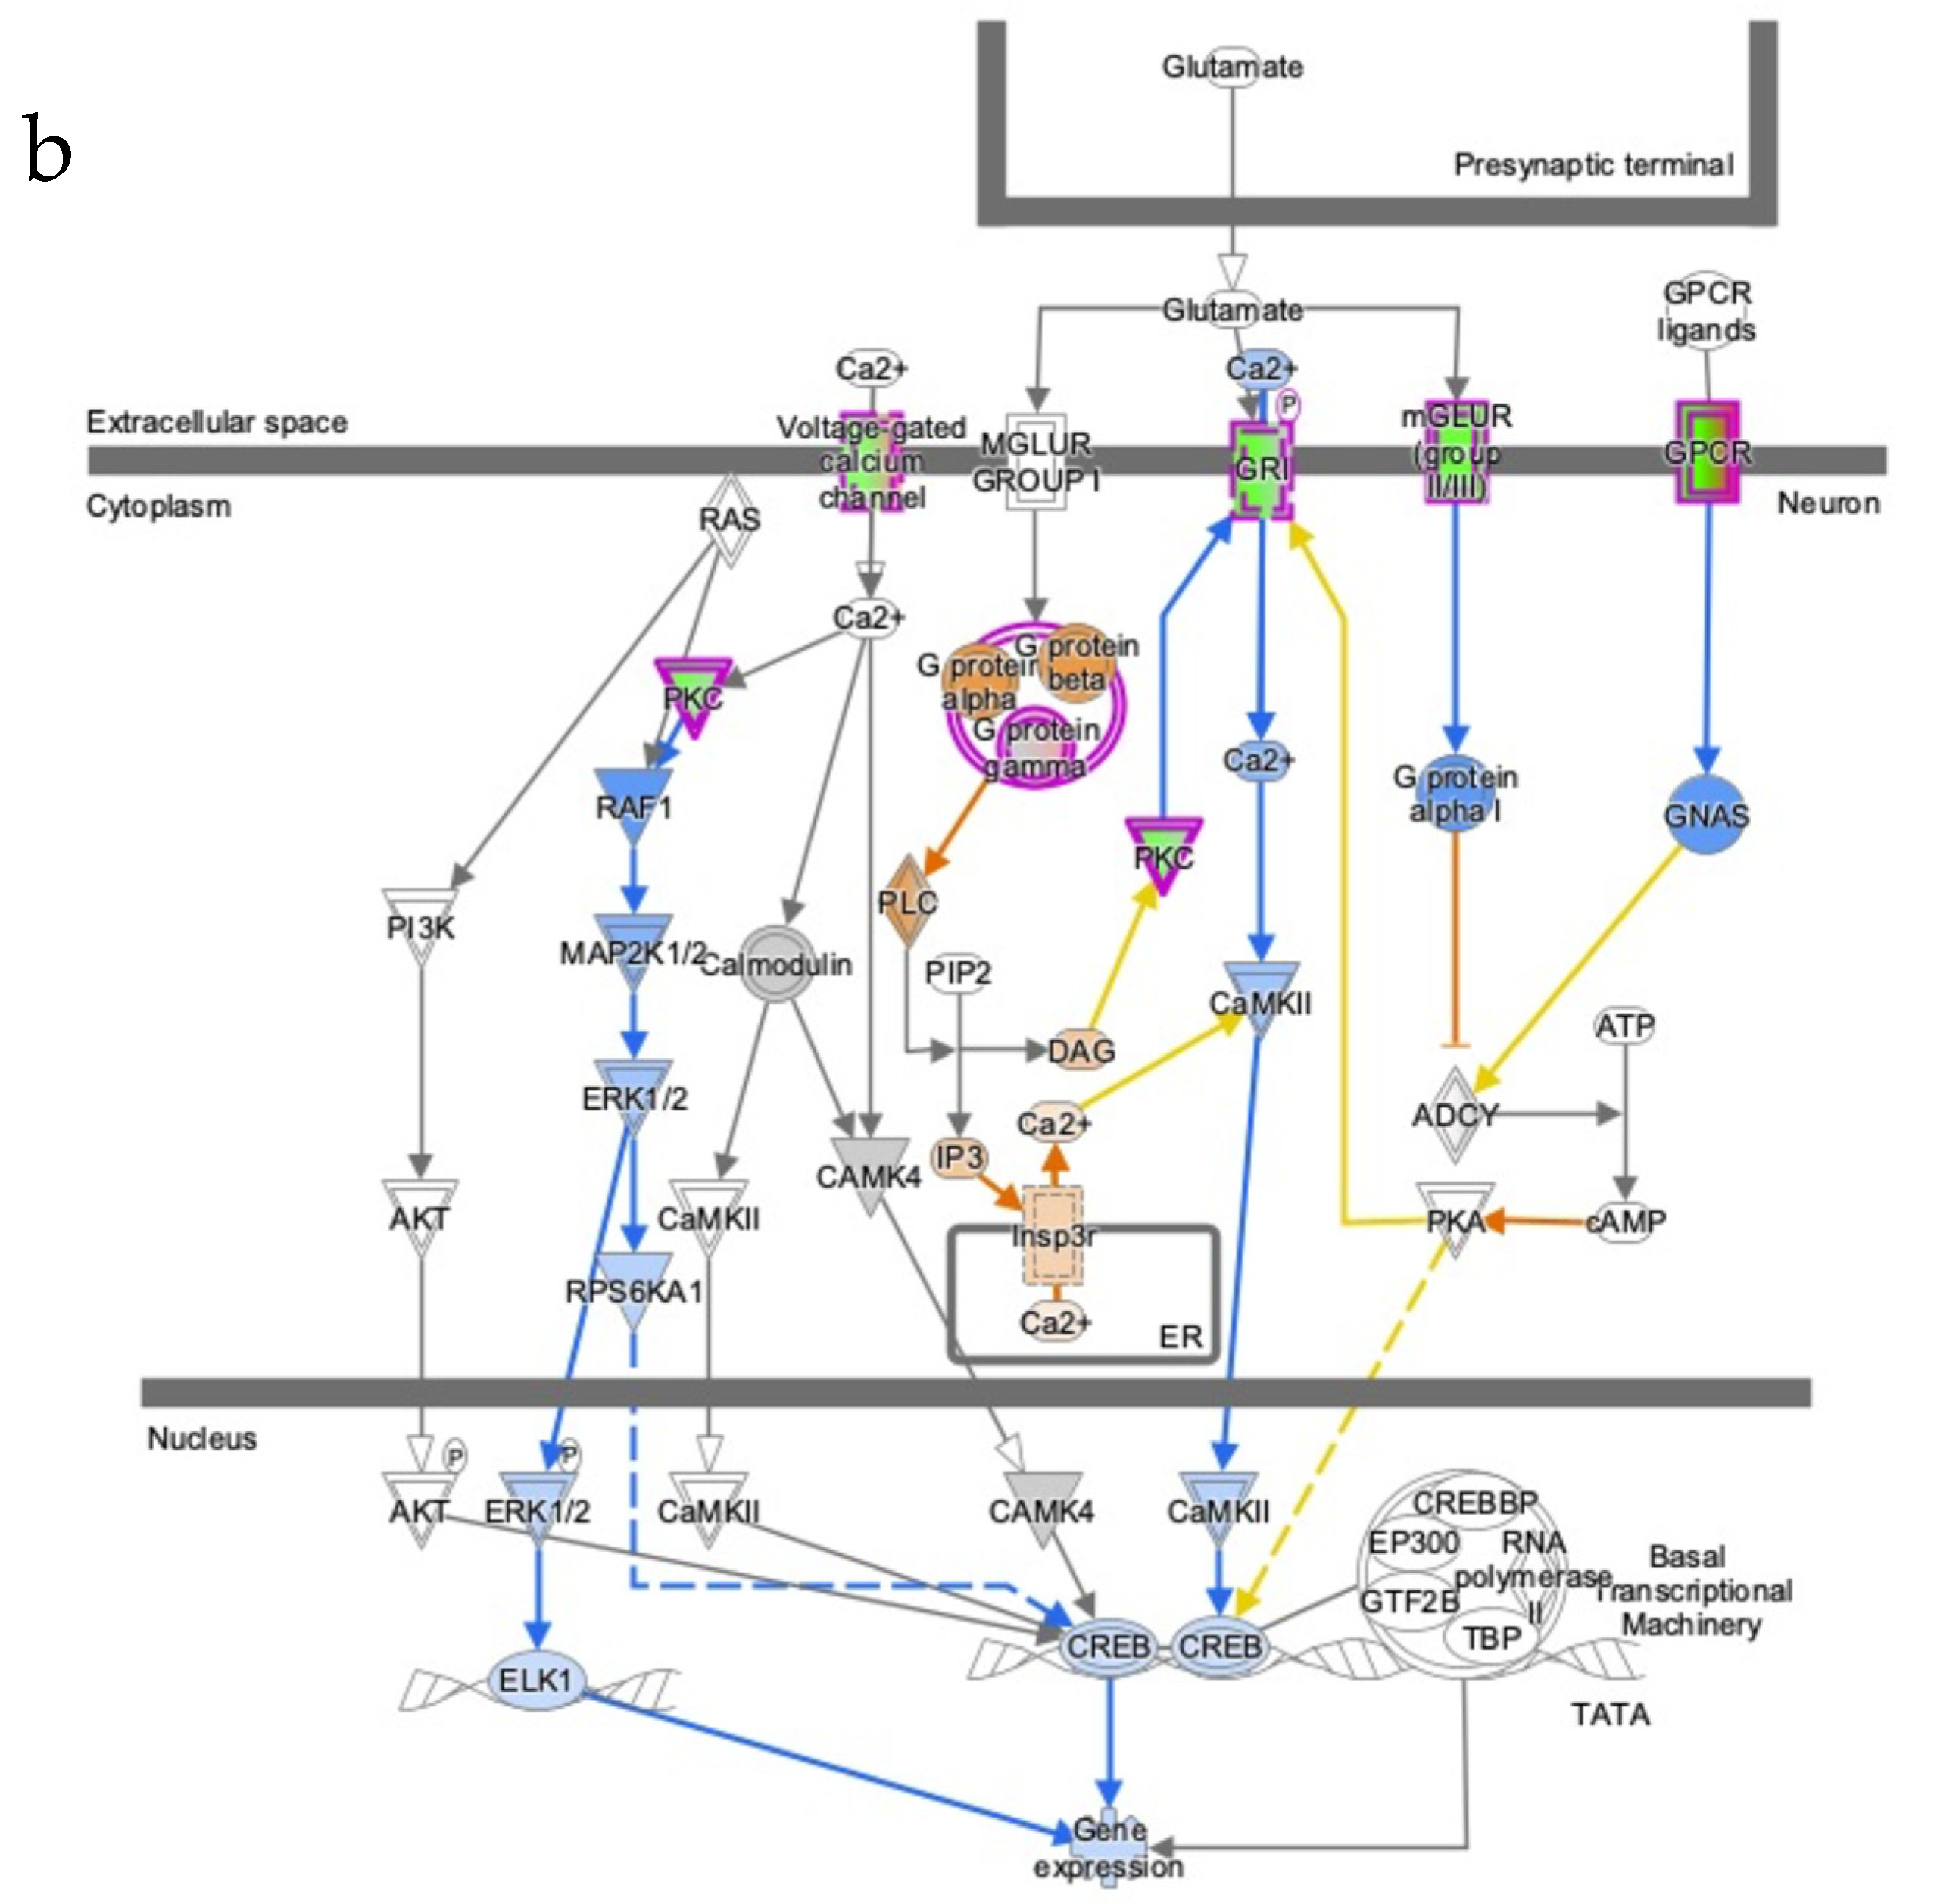
3.5. Severe AD Is Associated with a Reduction of H3k4me3 Signal on Promoter of Genes Involved in Several AD-Related Pathways
3.6. AD Affects the H3K27me3 Female Landscape
4. Discussion
Supplementary Materials
Author Contributions
Funding
Institutional Review Board Statement
Informed Consent Statement
Data Availability Statement
Conflicts of Interest
References
- Giau, V.V.; Bagyinszky, E.; Yang, Y.S.; Youn, Y.C.; An, S.S.A.; Kim, S.Y. Genetic Analyses of Early-Onset Alzheimer’s Disease Using next Generation Sequencing. Sci. Rep. 2019, 9, 8368. [Google Scholar] [CrossRef] [Green Version]
- Chen, X.-Q.; Mobley, W.C. Alzheimer Disease Pathogenesis: Insights From Molecular and Cellular Biology Studies of Oligomeric Aβ and Tau Species. Front. Neurosci. 2019, 13, 659. [Google Scholar] [CrossRef] [PubMed]
- Montine, T.J.; Phelps, C.H.; Beach, T.G.; Bigio, E.H.; Cairns, N.J.; Dickson, D.W.; Duyckaerts, C.; Frosch, M.P.; Masliah, E.; Mirra, S.S.; et al. National Institute on Aging-Alzheimer’s Association Guidelines for the Neuropathologic Assessment of Alzheimer’s Disease: A Practical Approach. Acta Neuropathol. 2012, 123, 1–11. [Google Scholar] [CrossRef] [Green Version]
- Mrdjen, D.; Fox, E.J.; Bukhari, S.A.; Montine, K.S.; Bendall, S.C.; Montine, T.J. The Basis of Cellular and Regional Vulnerability in Alzheimer’s Disease. Acta Neuropathol. 2019, 138, 729–749. [Google Scholar] [CrossRef]
- Mattson, M.P.; Guthrie, P.B.; Kater, S.B. Intrinsic Factors in the Selective Vulnerability of Hippocampal Pyramidal Neurons. Prog. Clin. Biol. Res. 1989, 317, 333–351. [Google Scholar] [PubMed]
- Armada-Moreira, A.; Gomes, J.I.; Pina, C.C.; Savchak, O.K.; Gonçalves-Ribeiro, J.; Rei, N.; Pinto, S.; Morais, T.P.; Martins, R.S.; Ribeiro, F.F.; et al. Going the Extra (Synaptic) Mile: Excitotoxicity as the Road Toward Neurodegenerative Diseases. Front. Cell Neurosci. 2020, 14, 90. [Google Scholar] [CrossRef] [PubMed]
- Conway, M.E. Alzheimer’s Disease: Targeting the Glutamatergic System. Biogerontology 2020, 21, 257–274. [Google Scholar] [CrossRef] [Green Version]
- Wang, S.-C.; Oelze, B.; Schumacher, A. Age-Specific Epigenetic Drift in Late-Onset Alzheimer’s Disease. PLoS ONE 2008, 3, e2698. [Google Scholar] [CrossRef] [Green Version]
- Dyer, M.; Phipps, A.J.; Mitew, S.; Taberlay, P.C.; Woodhouse, A. Age, but Not Amyloidosis, Induced Changes in Global Levels of Histone Modifications in Susceptible and Disease-Resistant Neurons in Alzheimer’s Disease Model Mice. Front. Aging Neurosci. 2019, 11, 68. [Google Scholar] [CrossRef] [Green Version]
- Klein, H.-U.; McCabe, C.; Gjoneska, E.; Sullivan, S.E.; Kaskow, B.J.; Tang, A.; Smith, R.V.; Xu, J.; Pfenning, A.R.; Bernstein, B.E.; et al. Epigenome-Wide Study Uncovers Large-Scale Changes in Histone Acetylation Driven by Tau Pathology in Aging and Alzheimer’s Human Brains. Nat. Neurosci. 2019, 22, 37–46. [Google Scholar] [CrossRef]
- Nativio, R.; Lan, Y.; Donahue, G.; Sidoli, S.; Berson, A.; Srinivasan, A.R.; Shcherbakova, O.; Amlie-Wolf, A.; Nie, J.; Cui, X.; et al. An Integrated Multi-Omics Approach Identifies Epigenetic Alterations Associated with Alzheimer’s Disease. Nat. Genet. 2020, 52, 1024–1035. [Google Scholar] [CrossRef] [PubMed]
- Bannister, A.J.; Kouzarides, T. Regulation of Chromatin by Histone Modifications. Cell Res. 2011, 21, 381–395. [Google Scholar] [CrossRef] [PubMed]
- Bathini, P.; Dupanloup, I.; Zenaro, E.; Terrabuio, E.; Fischer, A.; Ballabani, E.; Doucey, M.-A.; Alberi, L. Systemic Inflammation Causes Microglial Dysfunction with a Mixed AD-like Pathology. bioRxiv 2020, 1–35. [Google Scholar] [CrossRef]
- Perna, A.; Marathe, S.; Dreos, R.; Falquet, L.; Akarsu Egger, H.; Auber, L.A. Revealing NOTCH-Dependencies in Synaptic Targets Associated with Alzheimer’s Disease. Mol. Cell. Neurosci. 2021, 115, 103657. [Google Scholar] [CrossRef]
- Amatori, S.; Persico, G.; Paolicelli, C.; Hillje, R.; Sahnane, N.; Corini, F.; Furlan, D.; Luzi, L.; Minucci, S.; Giorgio, M.; et al. Epigenomic Profiling of Archived FFPE Tissues by Enhanced PAT-ChIP (EPAT-ChIP) Technology. Clin. Epigenet. 2018, 10, 143. [Google Scholar] [CrossRef]
- Li, H.; Durbin, R. Fast and Accurate Short Read Alignment with Burrows-Wheeler Transform. Bioinformatics 2009, 25, 1754–1760. [Google Scholar] [CrossRef] [Green Version]
- Danecek, P.; Bonfield, J.K.; Liddle, J.; Marshall, J.; Ohan, V.; Pollard, M.O.; Whitwham, A.; Keane, T.; McCarthy, S.A.; Davies, R.M.; et al. Twelve Years of SAMtools and BCFtools. Gigascience 2021, 10, giab008. [Google Scholar] [CrossRef]
- Zhang, Y.; Liu, T.; Meyer, C.A.; Eeckhoute, J.; Johnson, D.S.; Bernstein, B.E.; Nusbaum, C.; Myers, R.M.; Brown, M.; Li, W.; et al. Model-Based Analysis of ChIP-Seq (MACS). Genome Biol. 2008, 9, R137. [Google Scholar] [CrossRef] [Green Version]
- Stovner, E.B.; Sætrom, P. Epic2 Efficiently Finds Diffuse Domains in ChIP-Seq Data. Bioinformatics 2019, 35, 4392–4393. [Google Scholar] [CrossRef]
- Stark, R.; Brown, G. DiffBind: Differential Binding Analysis of ChIP-Seq Peak Data. In R Package Version; 2011. [Google Scholar]
- Yu, G.; Wang, L.-G.; He, Q.-Y. ChIPseeker: An R/Bioconductor Package for ChIP Peak Annotation, Comparison and Visualization. Bioinformatics 2015, 31, 2382–2383. [Google Scholar] [CrossRef] [Green Version]
- Ramírez, F.; Ryan, D.P.; Grüning, B.; Bhardwaj, V.; Kilpert, F.; Richter, A.S.; Heyne, S.; Dündar, F.; Manke, T. DeepTools2: A next Generation Web Server for Deep-Sequencing Data Analysis. Nucleic Acids. Res. 2016, 44, W160–W165. [Google Scholar] [CrossRef] [PubMed]
- Avner, P.; Heard, E. X-Chromosome Inactivation: Counting, Choice and Initiation. Nat. Rev. Genet. 2001, 2, 59–67. [Google Scholar] [CrossRef] [PubMed]
- Kouzarides, T. Chromatin Modifications and Their Function. Cell 2007, 128, 693–705. [Google Scholar] [CrossRef] [Green Version]
- Casciaro, F.; Persico, G.; Rusin, M.; Amatori, S.; Montgomery, C.; Rutkowsky, J.R.; Ramsey, J.J.; Cortopassi, G.; Fanelli, M.; Giorgio, M. The Histone H3 K4me3, K27me3, and K27ac Genome-Wide Distributions Are Differently Influenced by Sex in Brain Cortexes and Gastrocnemius of the Alzheimer’s Disease PSAPP Mouse Model. Epigenomes 2021, 5, 26. [Google Scholar] [CrossRef]
- Lunnon, K.; Mill, J. Epigenetic Studies in Alzheimer’s Disease: Current Findings, Caveats, and Considerations for Future Studies. Am. J. Med. Genet. B Neuropsychiatr. Genet. 2013, 162, 789–799. [Google Scholar] [CrossRef] [PubMed] [Green Version]
- Smith, R.G.; Lunnon, K. DNA Modifications and Alzheimer’s Disease. Adv. Exp. Med. Biol. 2017, 978, 303–319. [Google Scholar] [CrossRef] [PubMed]
- Marzi, S.J.; Leung, S.K.; Ribarska, T.; Hannon, E.; Smith, A.R.; Pishva, E.; Poschmann, J.; Moore, K.; Troakes, C.; Al-Sarraj, S.; et al. A Histone Acetylome-Wide Association Study of Alzheimer’s Disease Identifies Disease-Associated H3K27ac Differences in the Entorhinal Cortex. Nat. Neurosci. 2018, 21, 1618–1627. [Google Scholar] [CrossRef] [Green Version]
- Nativio, R.; Donahue, G.; Berson, A.; Lan, Y.; Amlie-Wolf, A.; Tuzer, F.; Toledo, J.B.; Gosai, S.J.; Gregory, B.D.; Torres, C.; et al. Dysregulation of the Epigenetic Landscape of Normal Aging in Alzheimer’s Disease. Nat. Neurosci. 2018, 21, 497–505. [Google Scholar] [CrossRef] [Green Version]
- Boros, J.; Arnoult, N.; Stroobant, V.; Collet, J.-F.; Decottignies, A. Polycomb Repressive Complex 2 and H3K27me3 Cooperate with H3K9 Methylation To Maintain Heterochromatin Protein 1α at Chromatin. Mol. Cell. Biol. 2014, 34, 3662–3674. [Google Scholar] [CrossRef] [Green Version]


Publisher’s Note: MDPI stays neutral with regard to jurisdictional claims in published maps and institutional affiliations. |
© 2022 by the authors. Licensee MDPI, Basel, Switzerland. This article is an open access article distributed under the terms and conditions of the Creative Commons Attribution (CC BY) license (https://creativecommons.org/licenses/by/4.0/).
Share and Cite
Persico, G.; Casciaro, F.; Amatori, S.; Rusin, M.; Cantatore, F.; Perna, A.; Auber, L.A.; Fanelli, M.; Giorgio, M. Histone H3 Lysine 4 and 27 Trimethylation Landscape of Human Alzheimer’s Disease. Cells 2022, 11, 734. https://0-doi-org.brum.beds.ac.uk/10.3390/cells11040734
Persico G, Casciaro F, Amatori S, Rusin M, Cantatore F, Perna A, Auber LA, Fanelli M, Giorgio M. Histone H3 Lysine 4 and 27 Trimethylation Landscape of Human Alzheimer’s Disease. Cells. 2022; 11(4):734. https://0-doi-org.brum.beds.ac.uk/10.3390/cells11040734
Chicago/Turabian StylePersico, Giuseppe, Francesca Casciaro, Stefano Amatori, Martina Rusin, Francesco Cantatore, Amalia Perna, Lavinia Alberi Auber, Mirco Fanelli, and Marco Giorgio. 2022. "Histone H3 Lysine 4 and 27 Trimethylation Landscape of Human Alzheimer’s Disease" Cells 11, no. 4: 734. https://0-doi-org.brum.beds.ac.uk/10.3390/cells11040734