Article

Regulation of Oncogenic Targets by miR-99a-3p (Passenger Strand of miR-99a-Duplex) in Head and Neck Squamous Cell Carcinoma

1
Department of Functional Genomics, Chiba University Graduate School of Medicine, Chiba 260-8670, Japan
2
Department of Otorhinolaryngology/Head and Neck Surgery, Chiba University Graduate School of Medicine, Chiba 260-8670, Japan
3
Department of Biochemistry and Genetics, Chiba University Graduate School of Medicine, Chiba 260-8670, Japan
*
Author to whom correspondence should be addressed.
These authors contributed equally to this work.
Submission received: 3 November 2019 / Revised: 26 November 2019 / Accepted: 27 November 2019 / Published: 28 November 2019
(This article belongs to the Special Issue microRNA as Therapeutic Target)

Abstract

:
To identify novel oncogenic targets in head and neck squamous cell carcinoma (HNSCC), we have analyzed antitumor microRNAs (miRNAs) and their controlled molecular networks in HNSCC cells. Based on our miRNA signature in HNSCC, both strands of the miR-99a-duplex (miR-99a-5p: the guide strand, and miR-99a-3p: the passenger strand) are downregulated in cancer tissues. Moreover, low expression of miR-99a-5p and miR-99a-3p significantly predicts poor prognosis in HNSCC, and these miRNAs regulate cancer cell migration and invasion. We previously showed that passenger strands of miRNAs have antitumor functions. Here, we screened miR-99a-3p-controlled oncogenes involved in HNSCC pathogenesis. Thirty-two genes were identified as miR-99a-3p-regulated genes, and 10 genes (STAMBP, TIMP4, TMEM14C, CANX, SUV420H1, HSP90B1, PDIA3, MTHFD2, BCAT1, and SLC22A15) significantly predicted 5-year overall survival. Notably, among these genes, STAMBP, TIMP4, TMEM14C, CANX, and SUV420H1 were independent prognostic markers of HNSCC by multivariate analyses. We further investigated the oncogenic function of STAMBP in HNSCC cells using knockdown assays. Our data demonstrated that the aggressiveness of phenotypes in HNSCC cells was attenuated by siSTAMBP transfection. Moreover, aberrant STAMBP expression was detected in HNSCC clinical specimens by immunohistochemistry. This strategy may contribute to the clarification of the molecular pathogenesis of this disease.

1. Introduction

Head and neck squamous cell carcinoma (HNSCC) is the sixth most common cancer, with approximately 650,000 new cases diagnosed annually and 400,000 HNSCC-related deaths worldwide each year [1]. Tobacco and alcohol drinking habits are the major risk factors of HNSCC carcinogenesis [2]. In the past decade, our understanding of the role of human papillomavirus in the development of oropharyngeal squamous cell carcinoma has significantly changed the treatment strategy of this disease [3,4]. HNSCC is typically diagnosed when already at an advanced stage. Despite advancements in surgery, radiation therapy, and chemotherapy, patients with advanced HNSCC have a poor prognosis [1,4] owing to recurrence, metastasis, and treatment resistance [5]. The median overall survival time for patients with recurrence and metastasis is 10–13 months in the setting of first-line chemotherapy and 6 months in the second-line setting [6]. Recently, epidermal growth factor receptor inhibitors and immune checkpoint inhibitors have emerged as therapeutic approaches in HNSCC treatment [7,8]. However, these treatments do not yield satisfactory results.
MicroRNAs (miRNAs) exist widely in eukaryotes, and more than 2500 types of mature miRNAs have been discovered in humans [9,10]. miRNAs are transcribed from the human genome and then processed into mature miRNAs of approximately 18–22 bases [9,10]. miRNAs are classified as noncoding RNAs and function to suppress the translation of mRNAs by binding to the complementary sequence in the 3′-untranslated region (3′-UTR) of the targeted mRNA [9,10]. Notably, one miRNA targets multiple mRNAs, and there are multiple miRNA binding sites in the UTRs of one mRNA [9,10]. Therefore, changes in the expression of miRNAs are involved in various diseases, including human cancers, suggesting that miRNAs play important roles in disease development [11,12,13,14,15].
We have been studying antitumor miRNAs and their oncogenic networks in HNSCC cells based on HNSCC miRNA signatures [16,17,18,19,20]. Our previous studies have shown that the antitumor miR-29 family directly controls laminin-332 and integrins (ITGA6, ITGB4, and ITGB1), and miR-199 family targets ITGA3 in HNSCC cells [21,22,23]. Moreover, the antitumor miR-26 family, miR-29 family, and miR-218 inhibit cancer cell migration and invasion in HNSCC cells, and these miRNAs coordinately regulate lysyl oxidase like 2 [24]. These antitumor miRNAs (the miR-26 family, the miR-29 family, miR-218, and the miR-199 family) target proteins involved in the epithelial-mesenchymal transition, indicating their pivotal roles in metastasis in cancer cells.
In this study, we focused on miR-99a-5p (the guide strand of the miR-99a-duplex) and miR-99a-3p (the passenger strand) based on our HNSCC miRNA signature determined by RNA sequencing [20]. Previous studies have shown that downregulation of miR-99a-5p occurs in various cancers and that the expression of this miRNA attenuates malignant phenotypes in cancer cells, suggesting that miR-99a-5p acts as an antitumor miRNA [25,26]. However, few reports have described the roles of the passenger strand miR-99a-3p in HNSCC, and oncogenic networks controlled by miR-99a-3p are still unknown. In the general concept of miRNA biogenesis, passenger strands of miRNAs are degraded in the cytosol and have no function [9,10]. However, our previous studies showed that some passenger strands of miRNAs, e.g., miR-145-3p, miR-150-3p, and miR-199a/b-3p were downregulated in the signature and acted as antitumor miRNAs in malignant cells. Importantly, several targets regulated by these passenger strands of miRNAs acted as oncogenes, and their aberrant expressions were closely associated with the poor prognosis of the patients [23,27,28,29,30]. Therefore, the analysis of passenger strands of miRNAs is useful for understanding the molecular pathogenesis of HNSCC.
Our functional assays indicated that ectopic expression of both strands of the miR-99a-duplex significantly attenuated malignant phenotypes in HNSCC cells. We further analyzed miR-99a-3p-regulated oncogenic genes involved in HNSCC molecular pathogenesis. In total, 32 genes were identified as miR-99a-3p-controlled genes, and 10 genes (STAMBP, TIMP4, TMEM14C, CANX, SUV420H1, HSP90B1, PDIA3, MTHFD2, BCAT1, and SLC22A15) significantly predicted 5-year overall survival in patients with HNSCC. Moreover, our findings revealed that aberrant expression of STAMBP enhanced cancer cell aggressiveness in HNSCC.

2. Materials and Methods

2.1. Clinical Human HNSCC Specimens and HNSCC Cell Lines

Twenty-two clinical specimens were obtained from patients with HNSCC following surgical tumor resection at Chiba University Hospital (2008–2013, Chiba, Japan). The patients’ clinical characteristics are shown in Table 1. Written informed consent was obtained from all patients before the use of their specimens. This study was approved by the Bioethics Committee of Chiba University (approval number: 811(690)). Normal tissue was collected from the most distant cancerous part of the same specimen. A total of 22 pairs of HNSCC tissues and adjacent normal (noncancerous) tissues were obtained in this study.
Two HNSCC cell lines, FaDu (American Type Culture Collection, Manassas, VA, UAS) and SAS cells (RIKEN Cell Bank, Tsukuba, Ibaraki, Japan), were used in this study.

2.2. RNA Extraction and Quantitative Real-Time Reverse Transcription Polymerase Chain Reaction (qRT-PCR)

RNA was extracted from clinical specimens and cell lines as previously described [20,23,30,31,32]. miRNA expression levels were evaluated using qRT-PCR as described previously [20,23,30,31,32]. The TaqMan probes and primers used in this study are listed in Table S2.

2.3. Transfection of miRNAs, siRNAs, and Plasmid Vectors into HNSCC Cells

The procedures for transfection of miRNAs, siRNAs, and plasmid vectors into HNSCC cells were described previously [20,23,30,31,32]. The reagents used in this study are listed in Table S2.

2.4. Functional Assays in HNSCC Cells (Cell Proliferation, Migration and Invasion Assays)

The procedures for functional assays in cancer cells (proliferation, migration, and invasion) are described in our previous studies [20,23,30,31,32]. Cells were transfected with 10nM miRNAs or siRNAs. Cell proliferation was evaluated with XTT assays. Migration assays were performed with uncoated transwell polycarbonate membrane filters, invasion assays with modified Boyden chambers.

2.5. Measurement of miR-99a-3p Incorporated into the RISC

Immunoprecipitation using anti-Ago2 antibodies was performed to determine whether miR-99a-3p was incorporated into the RISC. FaDu and SAS were transfected with 10nM miRNAs for 48 h and the collected cells went through immunoprecipitation using human anti-Ago2 antibodies (microRNA Isolation Kit, Human Ago2; Wako, Osaka, Japan) according to the manufacture’s protocol. Obtained miRNAs proceeded to qRT-PCR. For normalization of the results, miR-26a was measured, whose expression was not affected by miR-99a-5p/3p transfection. The procedure for immunoprecipitation was described in previous studies [23,30,31,32]. The reagents used in this study are listed in Table S2.

2.6. Identification of miR-99a-3p and miR-99a-5p Targets in HNSCC Cells

The strategy for identification of miRNA targets in this study is summarized in Figure S5. Two expression profiles (i.e., miR-99a-5p-transfected FaDu cells [GEO accession number: GSE123318], miR-99a-3p-transfected FaDu cells [accession number: GSE123318]) were used in this screening. The TargetScanHuman database (http://www.targetscan.org/vert_72/) was used to predict miRNA binding sites.

2.7. Plasmid Construction and Dual-Luciferase Reporter Assays

Plasmid vectors, including vectors containing the wild-type sequences of miR-99a-3p binding sites in the 3′-UTR of STAMBP or the deletion sequences of miR-99a-3p binding sites in the 3′-UTR of STAMBP, were prepared. The inserted sequences are shown in Figure S7. The procedures for transfection and dual luciferase reporter assays were described in our previous studies [20,23,30,31,32]. The reagents used in this study are listed in Table S2.

2.8. Clinical Data Analyses of miRNAs and Target Genes in HNSCC Specimens

TCGA (https://tcga-data.nci.nih.gov/tcga/) was applied to investigate the clinical significance of miRNAs and their target genes. Gene expression and clinical data were obtained from cBioPortal (http://www.cbioportal.org/) and OncoLnc (http://www.oncolnc.org/) (data downloaded on 1 August 2019).

2.9. Western Blotting and Immunohistochemistry

The procedures for Western blotting and immunohistochemistry were described in our previous studies [20,23,30,31,32]. The antibodies used in this study are listed in Table S2.

2.10. Statistical Analyses

Mann–Whitney U tests were applied for comparisons between two groups. For multiple groups, one-way analysis of variance and Tukey tests for post-hoc analysis were applied. These analyses were performed with JMP Pro 14 (SAS Institute Inc., Cary, NC, USA).

3. Results

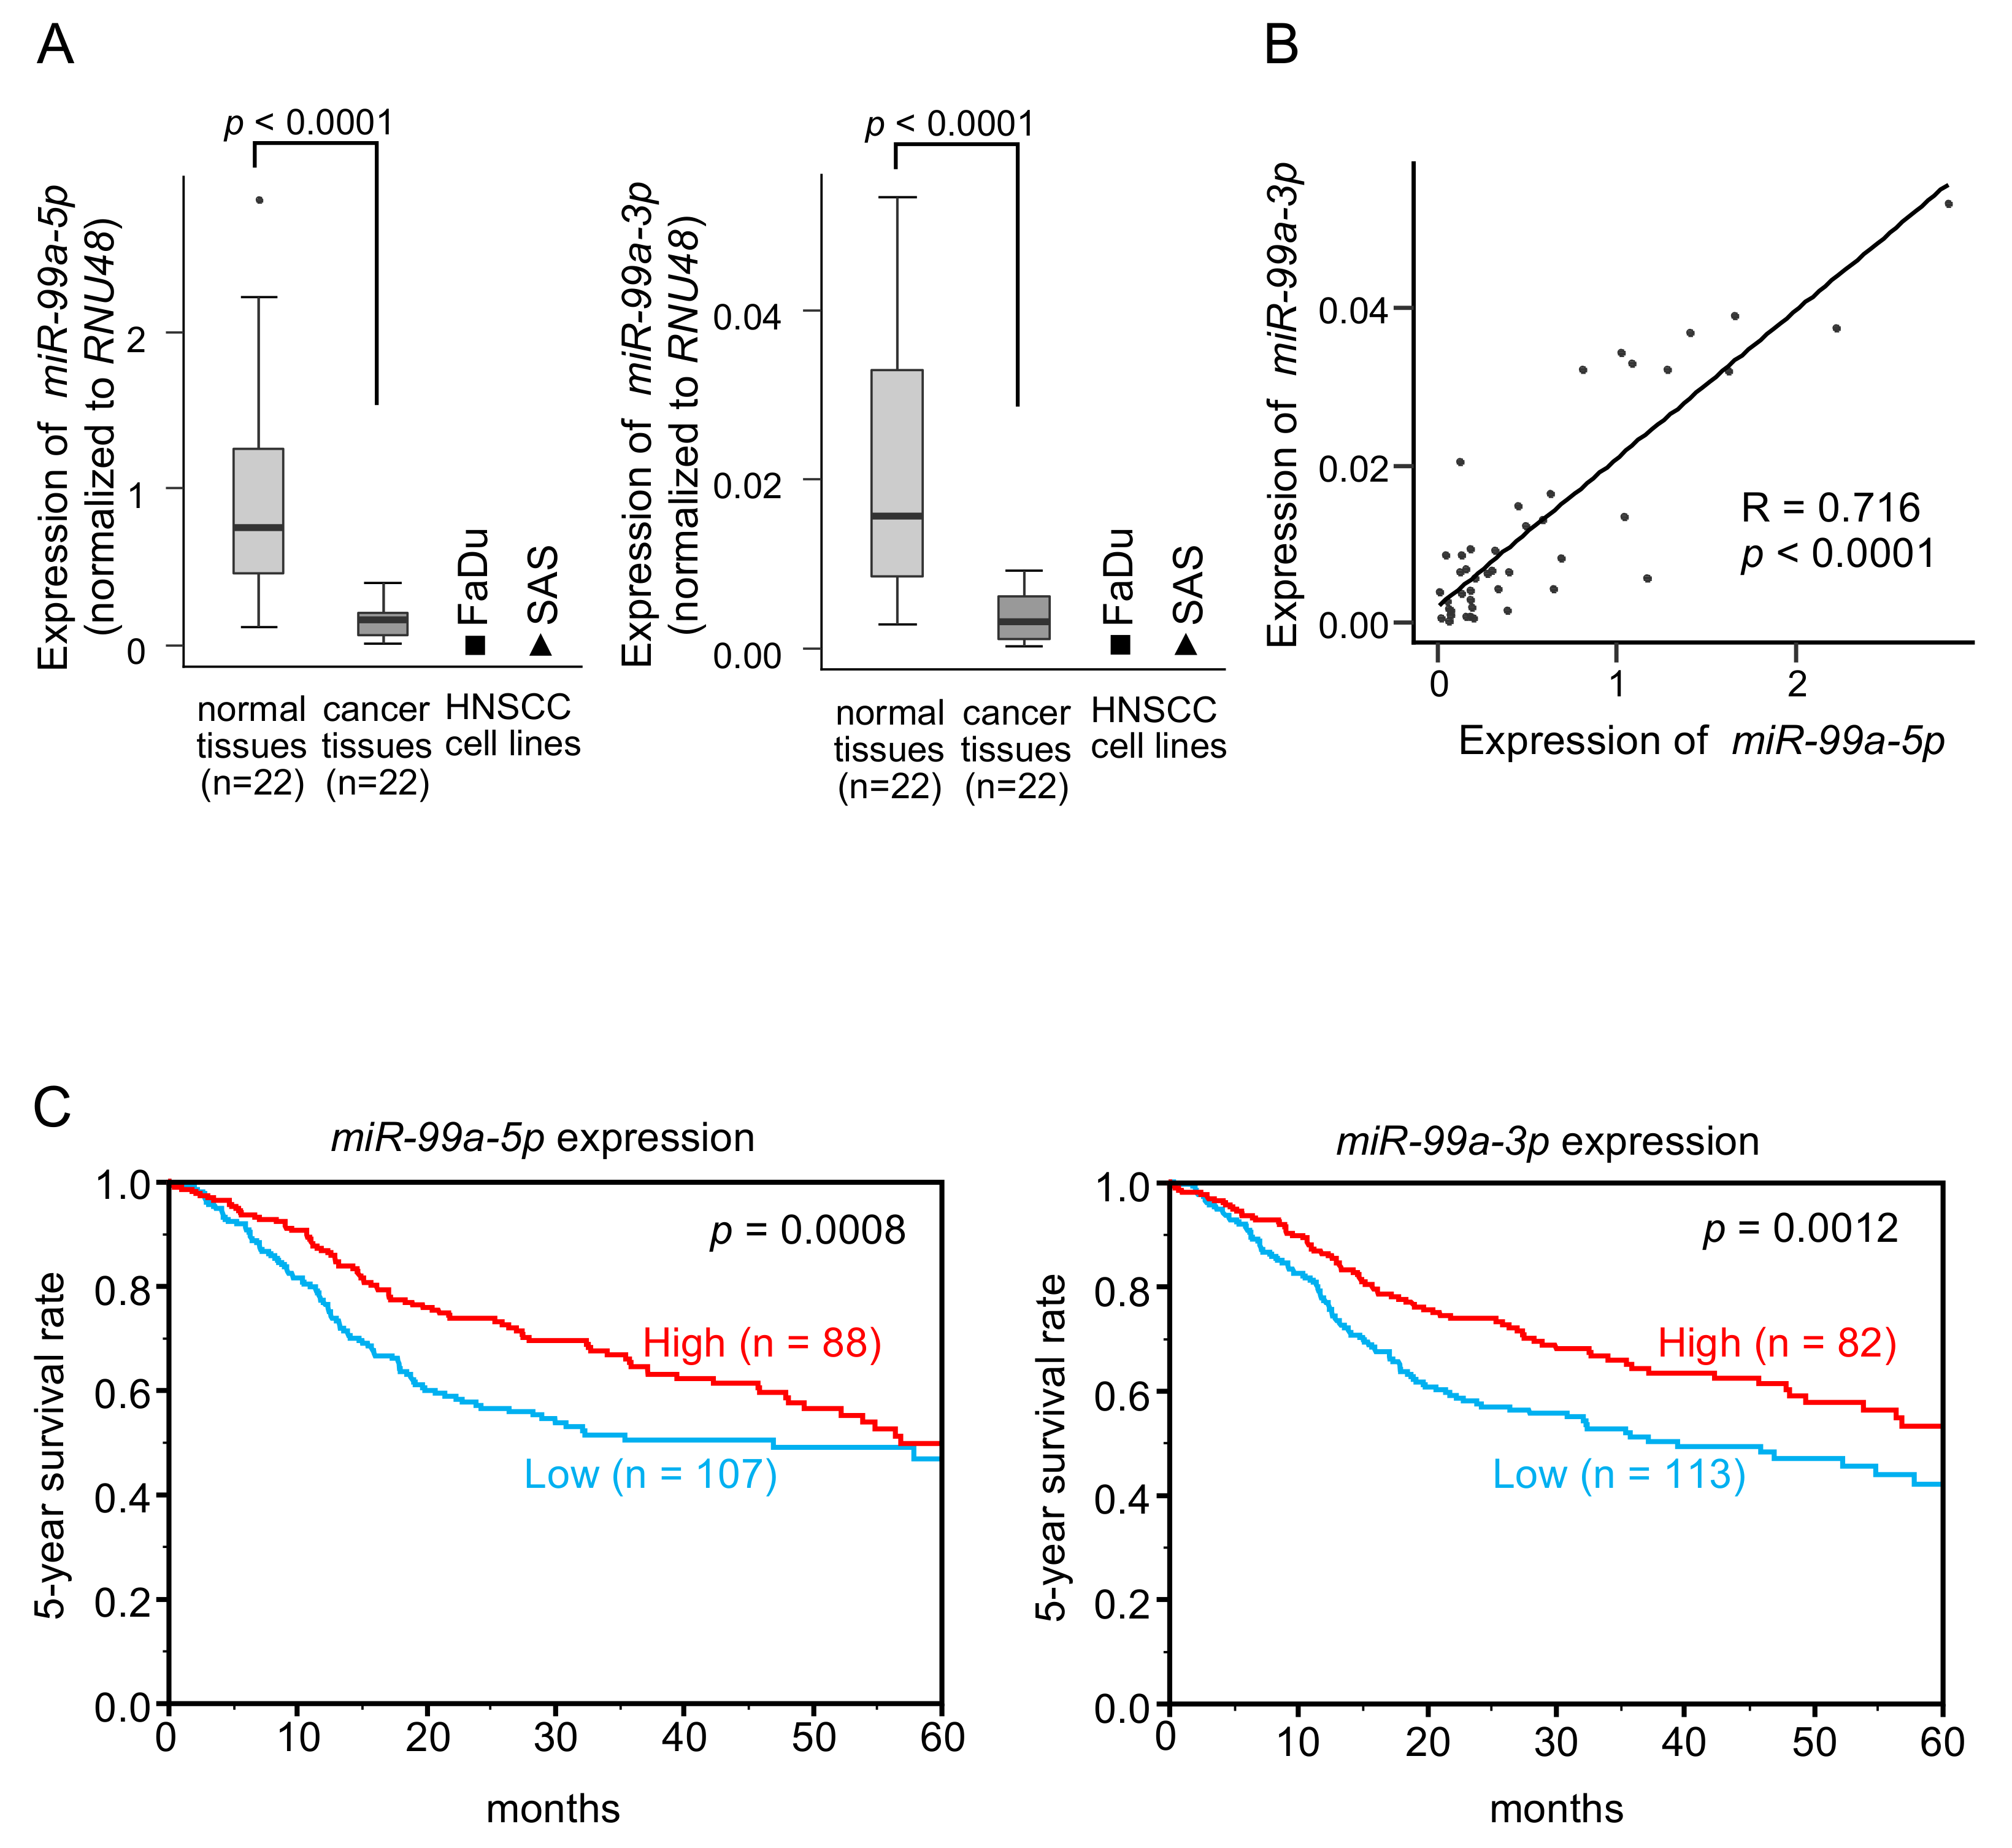
3.1. Downregulation and Clinical Significance of miR-99a-5p and miR-99a-3p in HNSCC Clinical Specimens

The clinical features of HNSCC specimens are listed in Table 1. Expression levels of miR-99a-5p and miR-99a-3p were significantly low in cancer tissues compared with those in normal tissues from the same patients (p < 0.0001 and p < 0.0001, respectively; Figure 1A and Figure S1). The expression levels of these miRNAs in two HNSCC cell lines (FaDu and SAS cells) were also very low compared with those in normal tissues (Figure 1A and Figure S1). A positive correlation was detected between miR-99a-5p and miR-99a-3p expression levels by Spearman’s rank analysis (R = 0.716, p < 0.0001; Figure 1B).
Cohort analysis using data from The Cancer Genome Atlas (TCGA) database revealed that low expression of miR-99a-5p and miR-99a-3p was associated with poorer survival in patients with HNSCC (p = 0.0008 and p = 0.0012, respectively; Figure 1C). We confirmed positive correlation of these miRNAs expression by using TCGA database sets (Figure S2).

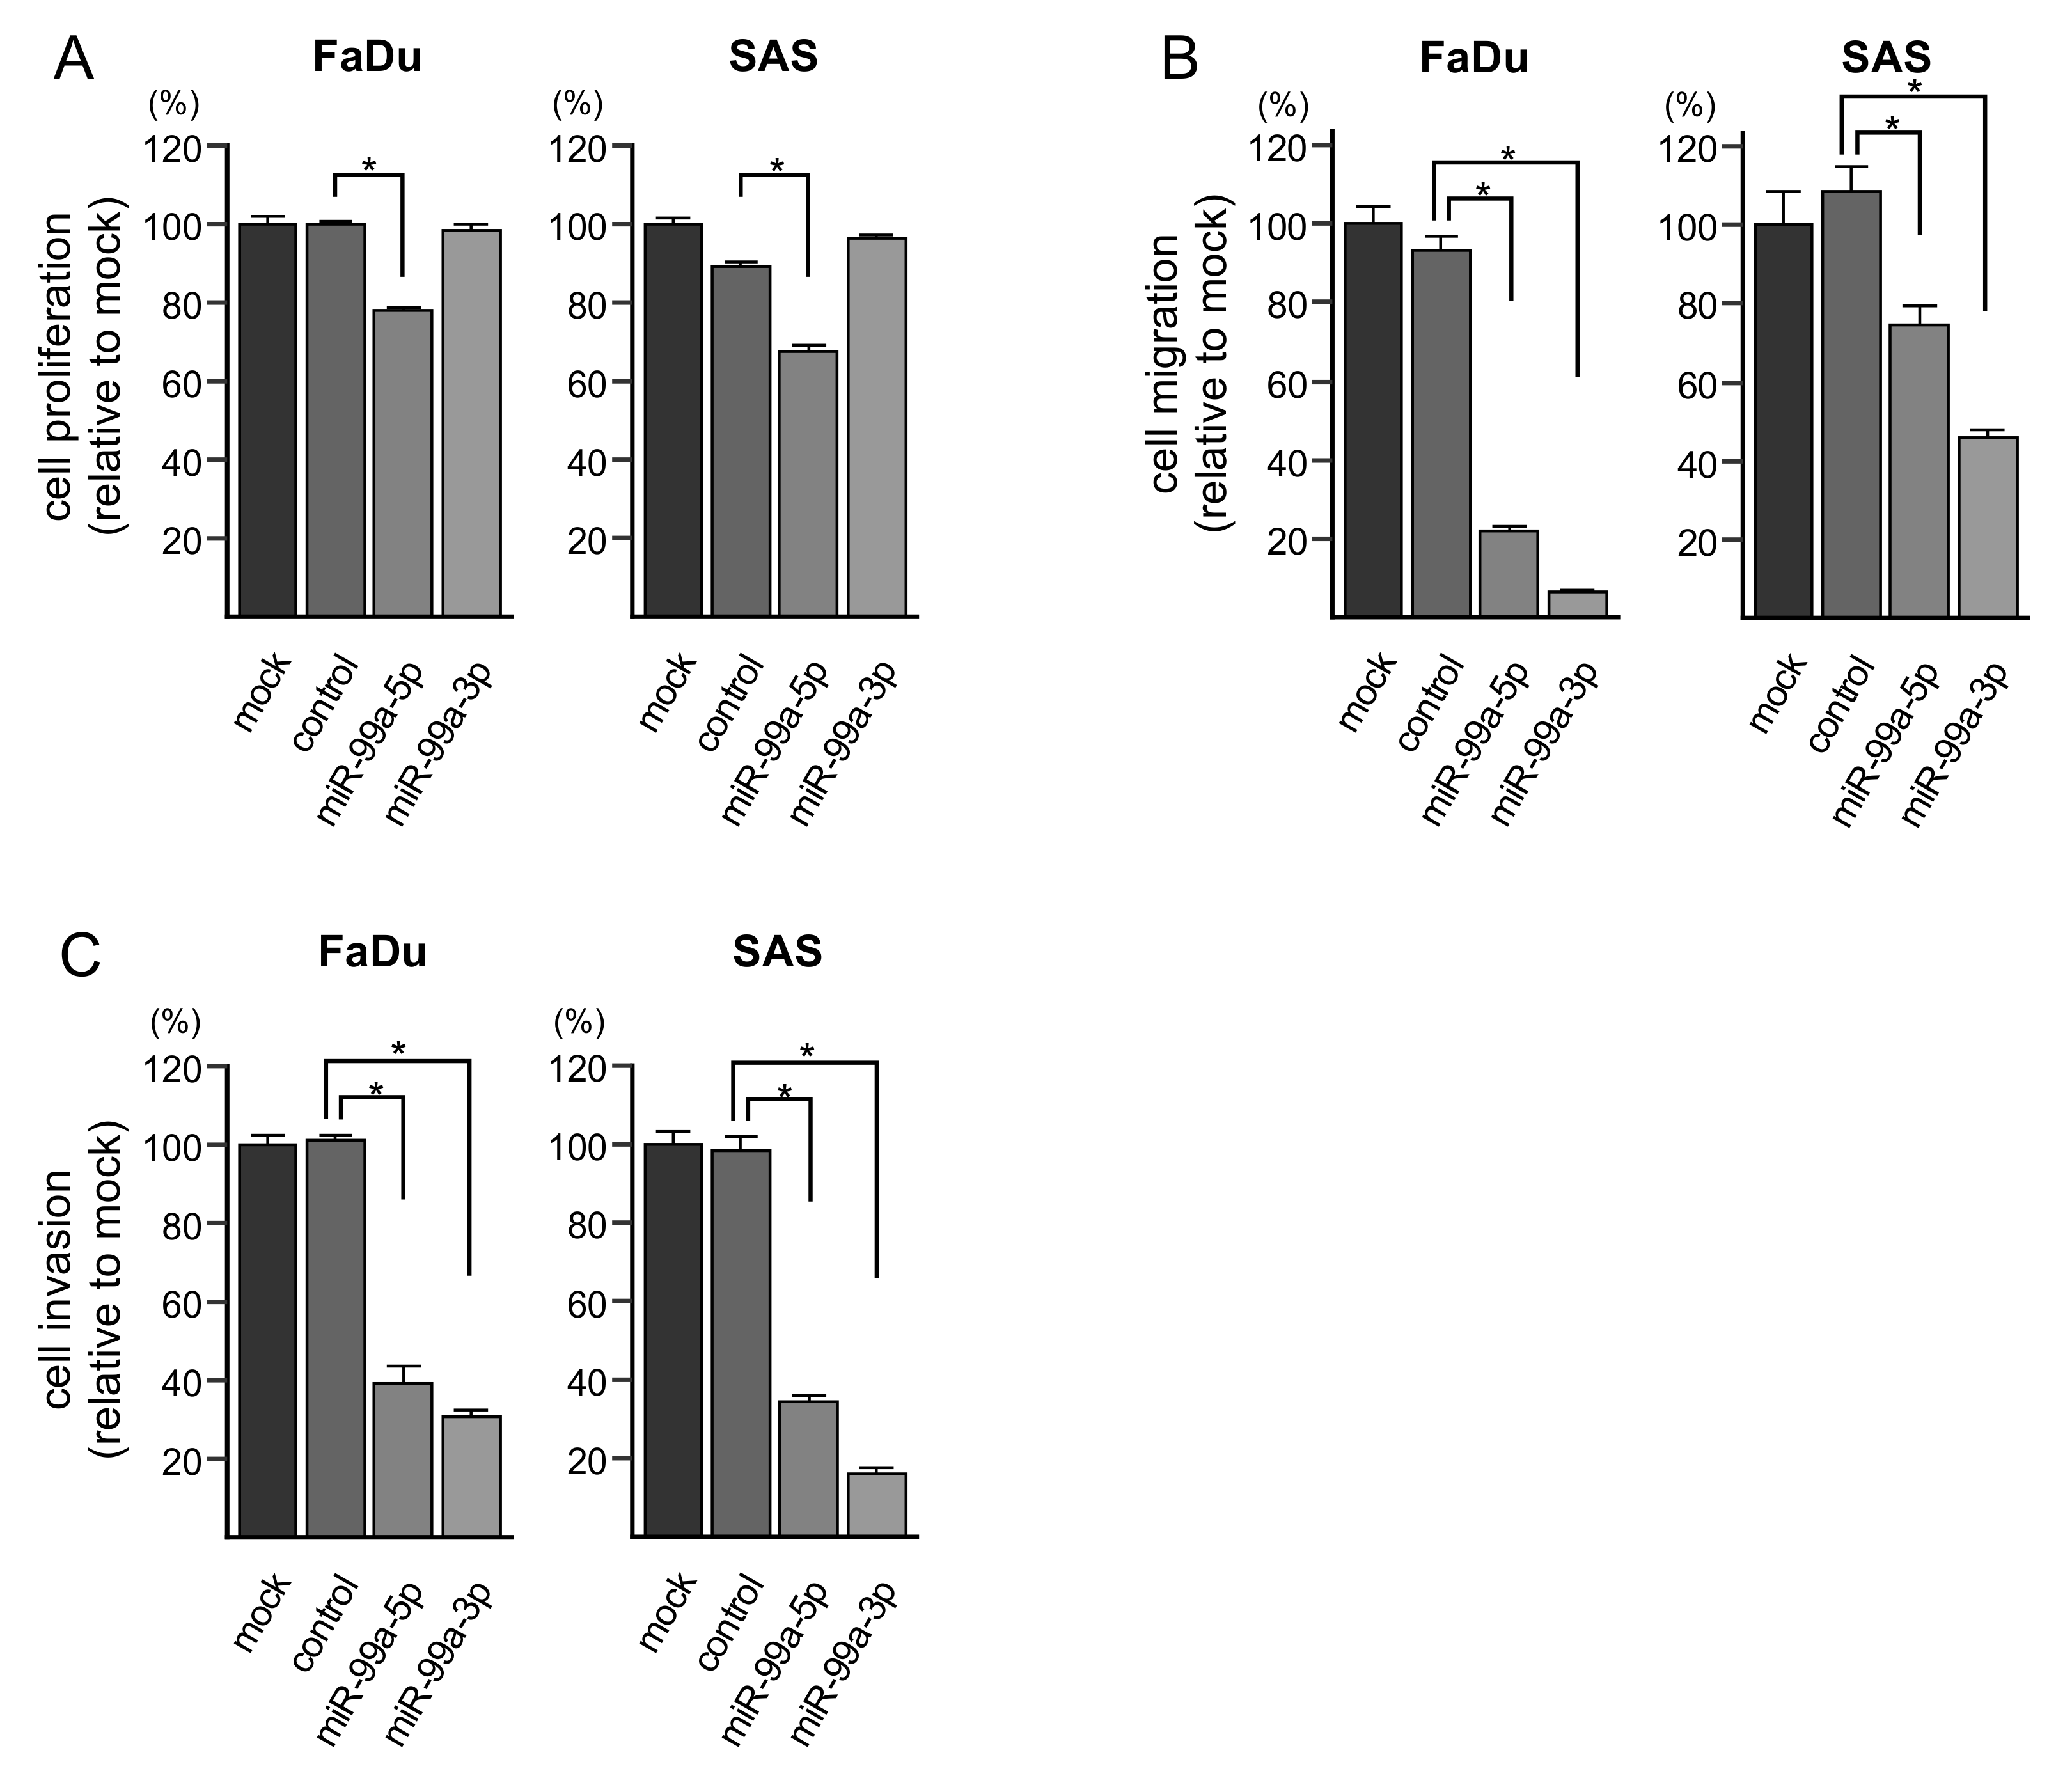
3.2. Ectopic Expression of miR-99a-5p and miR-99a-3p on Cell Proliferation, Migration and Invasion in HNSCC Cells

To investigate the anti-tumor functions of miR-99a-5p and miR-99a-3p in HNSCC cells, we assessed changes in cell proliferation, migration, and invasion after transfection of these miRNAs into FaDu and SAS cells. Notably, ectopic expression of miR-99a-5p significantly decreased cell proliferation (Figure 2A). However, cell proliferation was not affected by miR-99a-3p transfection. Additionally, the migration and invasion of FaDu and SAS cells were significantly suppressed by miR-99a-5p and miR-99a-3p transfection (Figure 2B,C). Photomicrographs are presented in Figure S3.

3.3. Incorporation of miR-99a-5p and miR-99a-3p into the RNA-Induced Silencing Complex (RISC) in HNSCC Cells

Ago2 is an essential component of the RISC. Therefore, to verify that miR-99a-5p and miR-99a-3p had functions in HNSCC cells, immunoprecipitation assays were carried out using anti-Ago2 antibodies. After transfection of both miRNAs to SAS cells, the amounts of miR-99a-5p and miR-99a-3p were significantly increased relative to that in control (untransfected) cells (Figure S4). These data showed that miR-99a-5p (the guide strand) and miR-99a-3p (the passenger strand) were both incorporated into the RISC in HNSCC cells.

3.4. Screening of Molecular Targets Regulated by miR-99a-5p and miR-99a-3p in HNSCC Cells

To identify the genes controlled by miR-99a-5p and miR-99a-3p in HNSCC cells, we used gene expression data obtained by RNA microarray analysis of miR-99a-5p- or miR-99a-3p-transfected FaDu cells and data from the TargetScanHuman database (release 7.2), which provided annotated putative targets for each miRNA. Our strategy searching for miR-99a-5p and miR-99a-3p target genes is shown in Figure S5.
Using this strategy, only genes from miR-99a-3p-transfected FaDu cells endured the selection process. For miR-99a-3p, 114 genes were identified as putative target genes in HNSCC cells (Table 2). Eighteen genes were identified as miR-99a-5p-controlled genes, none of which showed correlations with prognosis in TCGA database (Table S1).

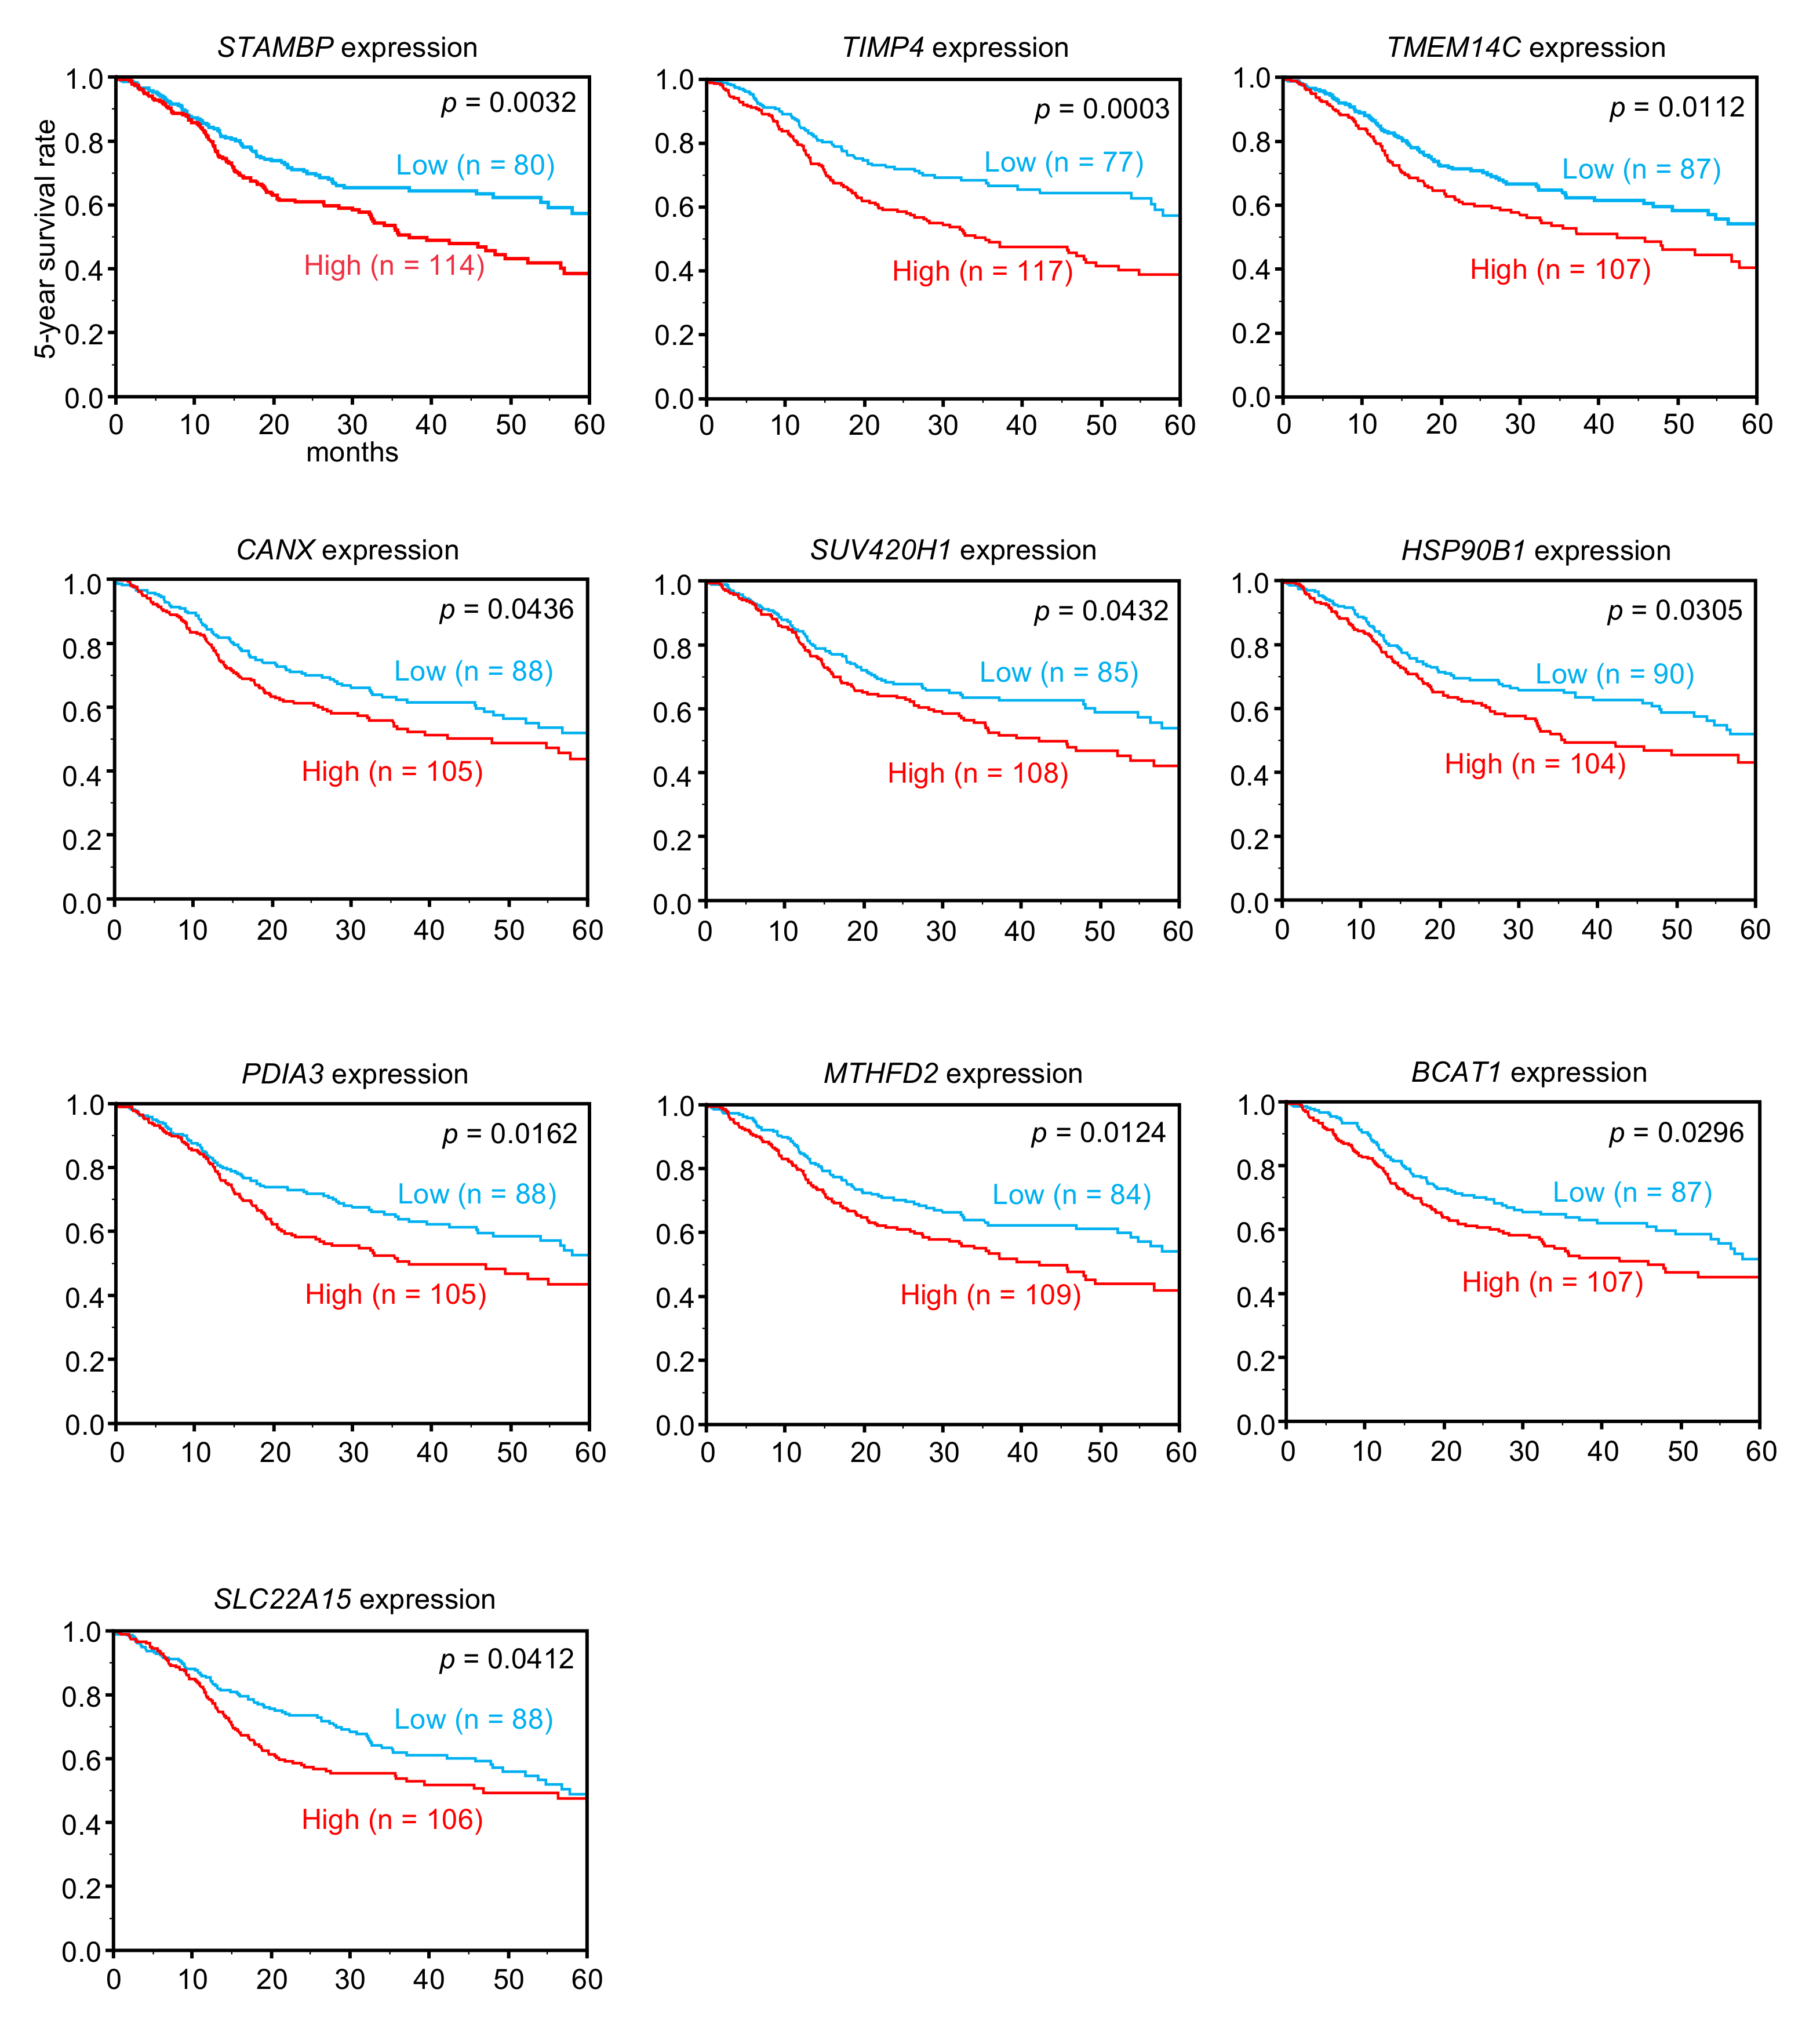
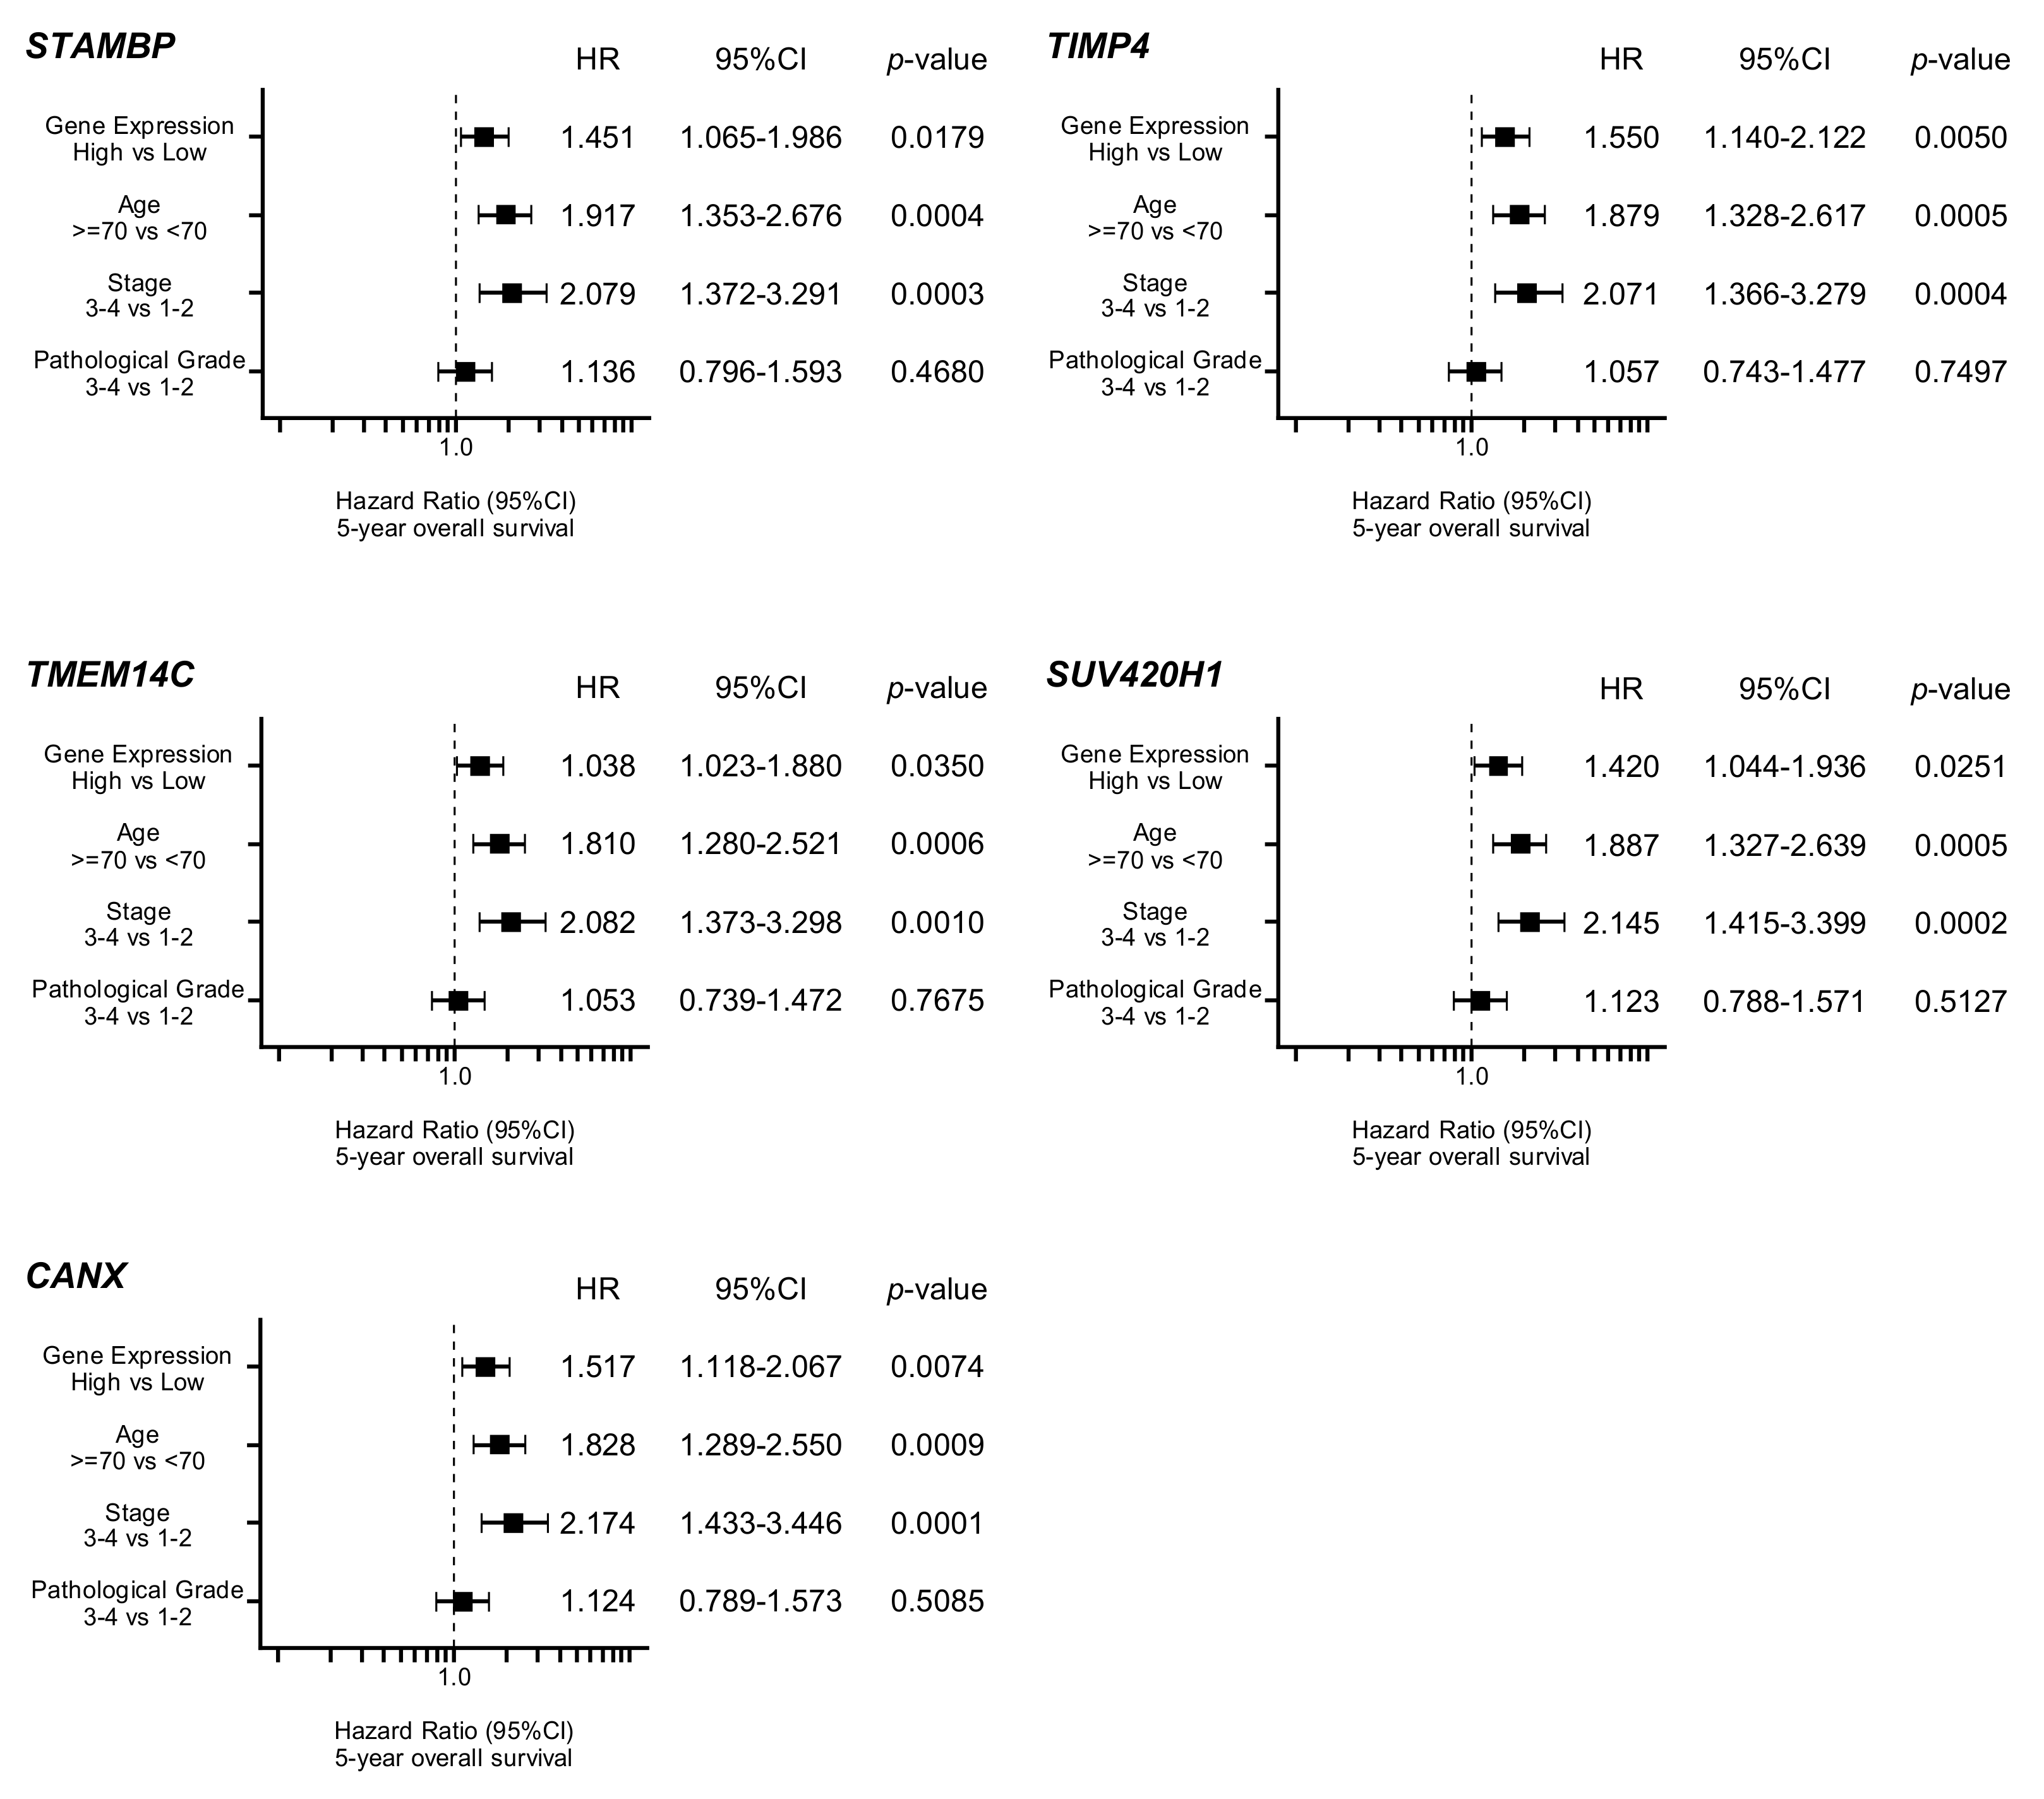
3.5. Clinical Significance of miR-99a-3p Targets in HNSCC Pathogenesis

By using TCGA database, we narrowed down the list of 114 genes according to correlations with 5-year overall survival rates. Among the genes, high expression of 10 genes (STAMBP, TIMP4, TMEM14C, CANX, SUV420H1, HSP90B1, PDIA3, MTHFD2, BCAT1, and SLC22A15) was associated with poor prognosis (5-year overall survival rate: p < 0.05) in patients with HNSCC (Table 2 and Figure 3). Furthermore, multivariate analysis elucidated that expression levels of five genes (STAMBP, TIMP4, TMEM14C, SUV420H1, and CANX) were independent prognostic factors for 5-year overall survival in these patients (Figure 4).

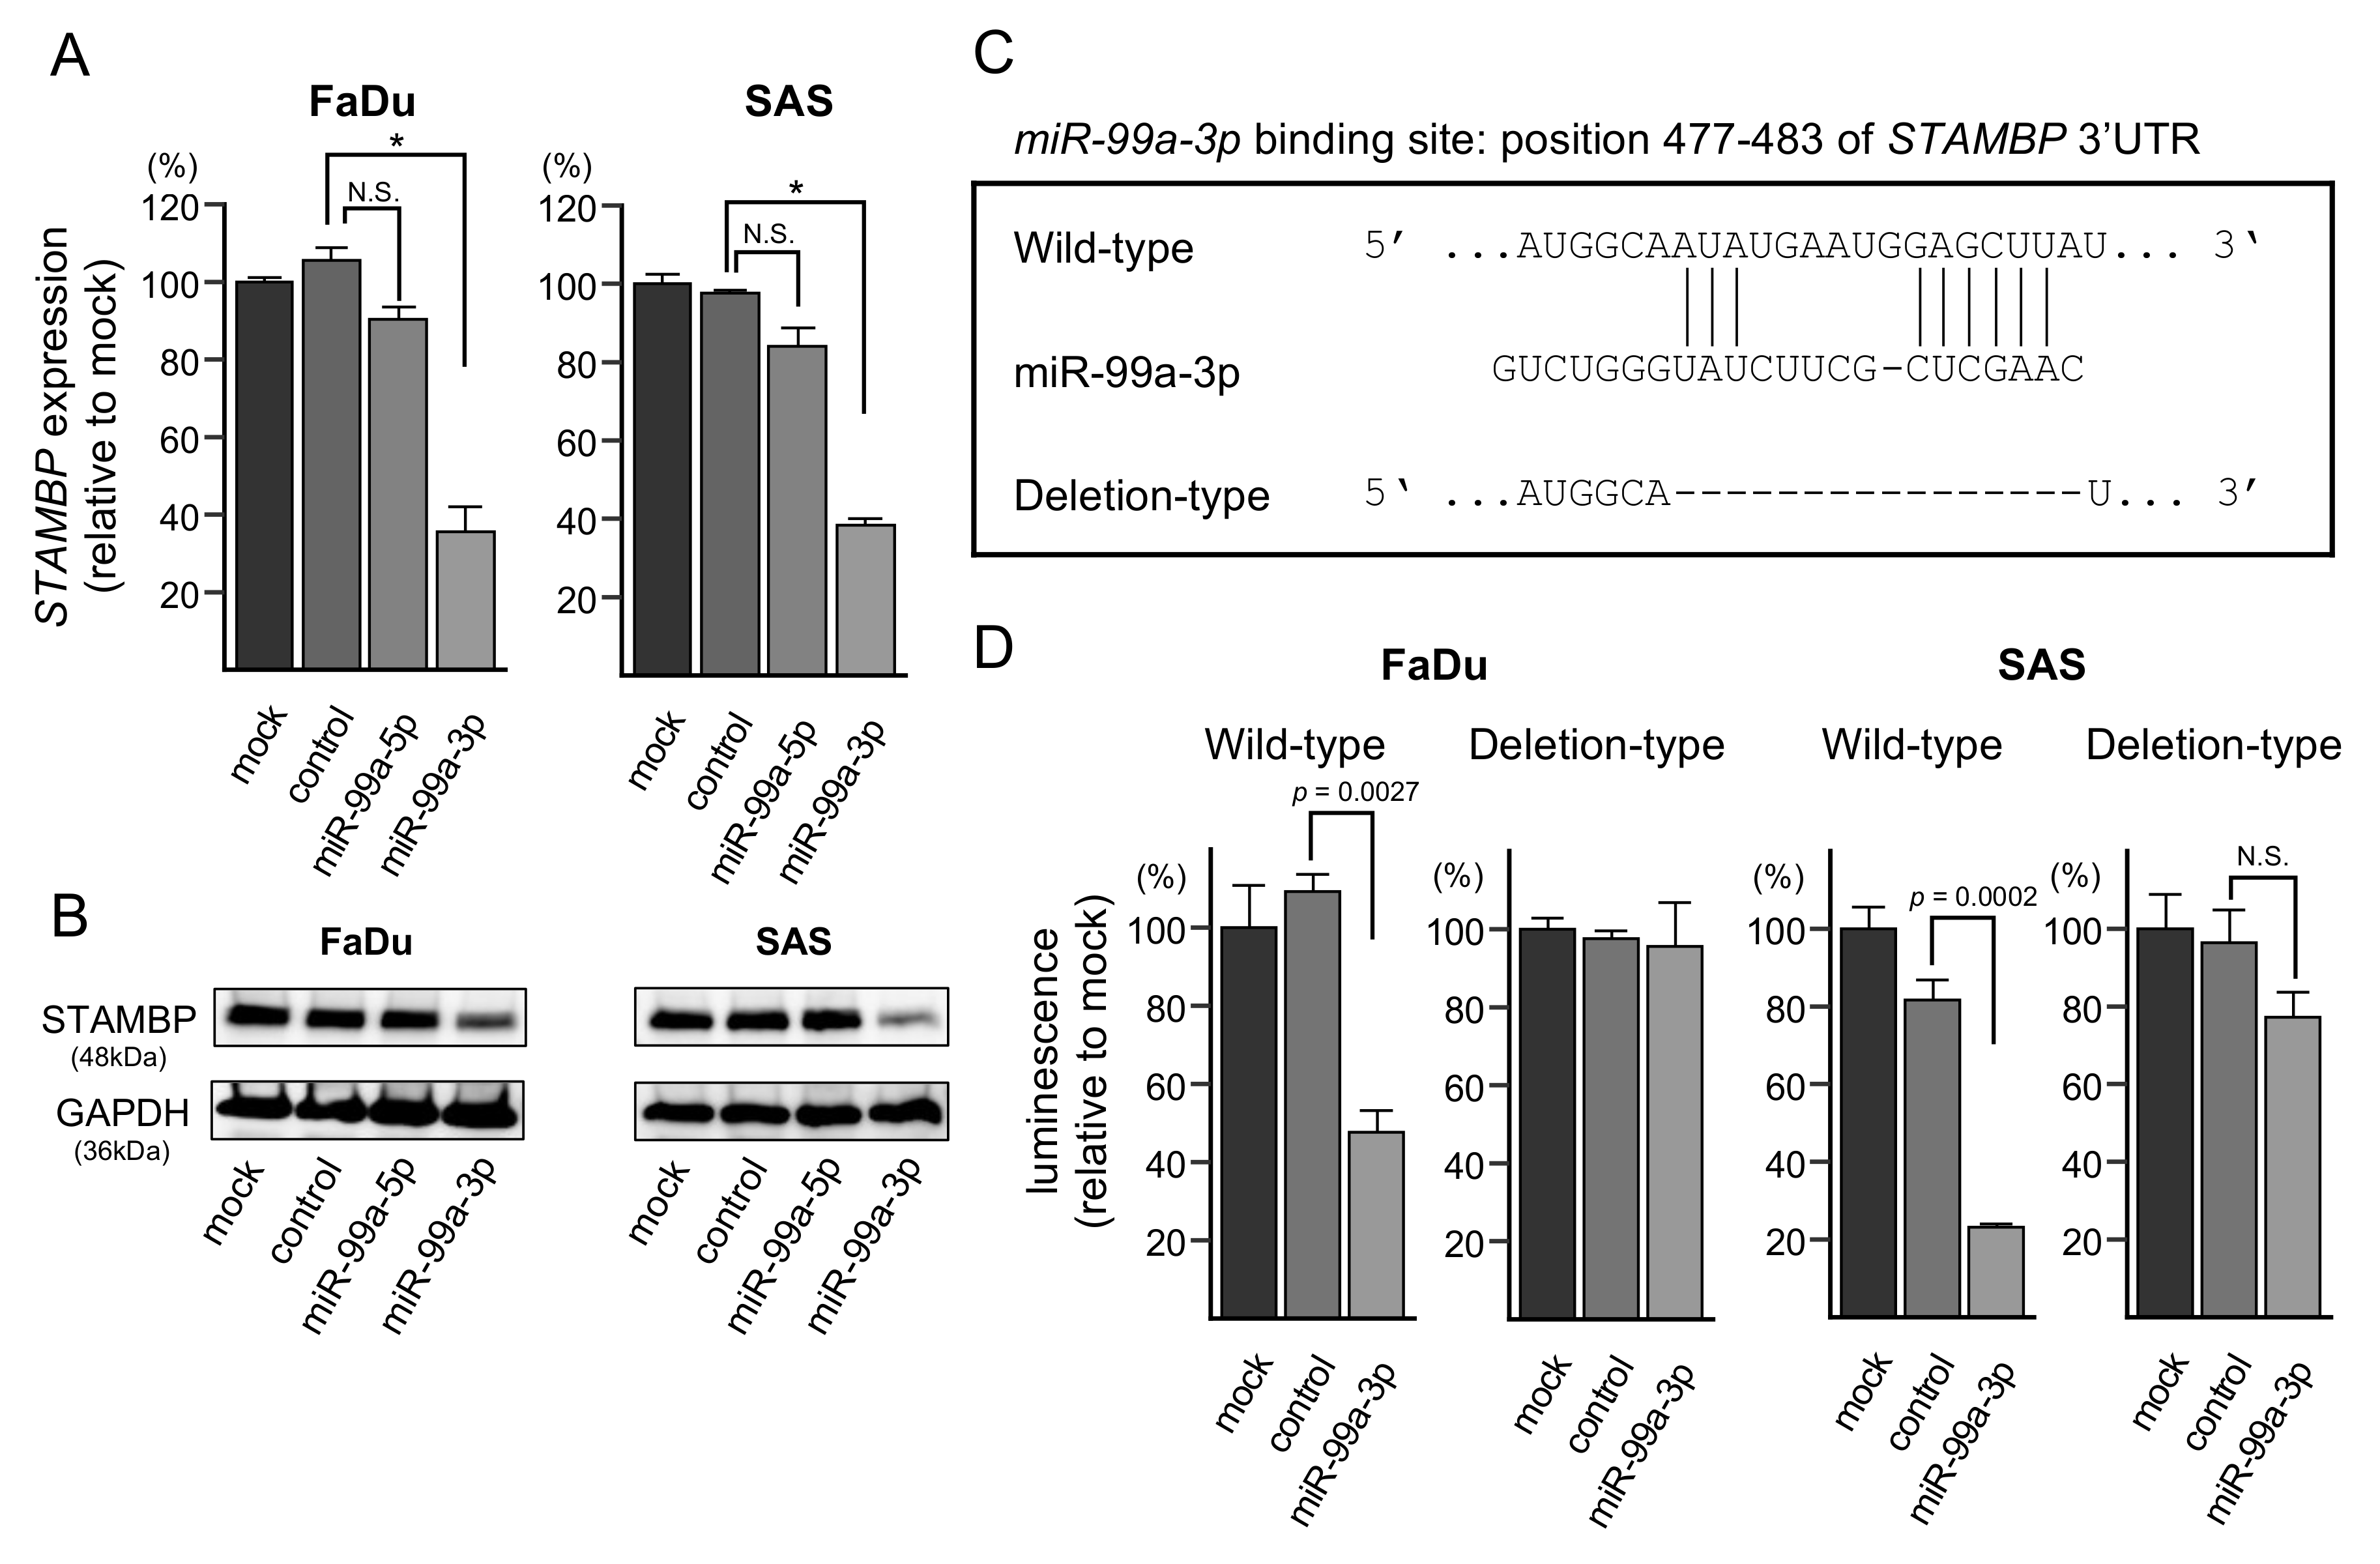
3.6. Direct Regulation of STAMBP by miR-99a-3p in HNSCC Cells

In cells transfected with miR-99a-3p, the levels of STAMBP mRNA and STAMBP protein were significantly lower than in mock- or miR-control-transfected cells (Figure 5A,B). The whole pictures of Western blotting are shown in Figure S6. In addition, we investigated whether the other four genes (TIMP4, TMEM14C, SUV420H1, and CANX) were controlled by miR-99a-3p in HNSCC cells at the RNA levels. Consistent with the estimation of TargetScanHuman database, the expression levels of the four genes were also downregulated by miR-99a-3p transfection in HNSCC cells (Figure S8).
Next, we performed dual-luciferase reporter assays to determine whether STAMBP was directly regulated by miR-99a-3p. We used vectors encoding the partial wild-type sequences of the 3′-UTR of STAMBP, including the predicted miR-99a-3p target site deletion vector lacking the miR-99a-3p binding site (Figure 5C and Figure S7). We found that luciferase activity was significantly decreased by cotransfection with miR-99a-3p and the vector carrying the wild-type 3′-UTR of STAMBP, whereas transfection with the deletion vector blocked the decrease in luminescence in FaDu and SAS cells (Figure 5D). These data demonstrated that miR-99a-3p directly bound to the 3′-UTR of STAMBP.

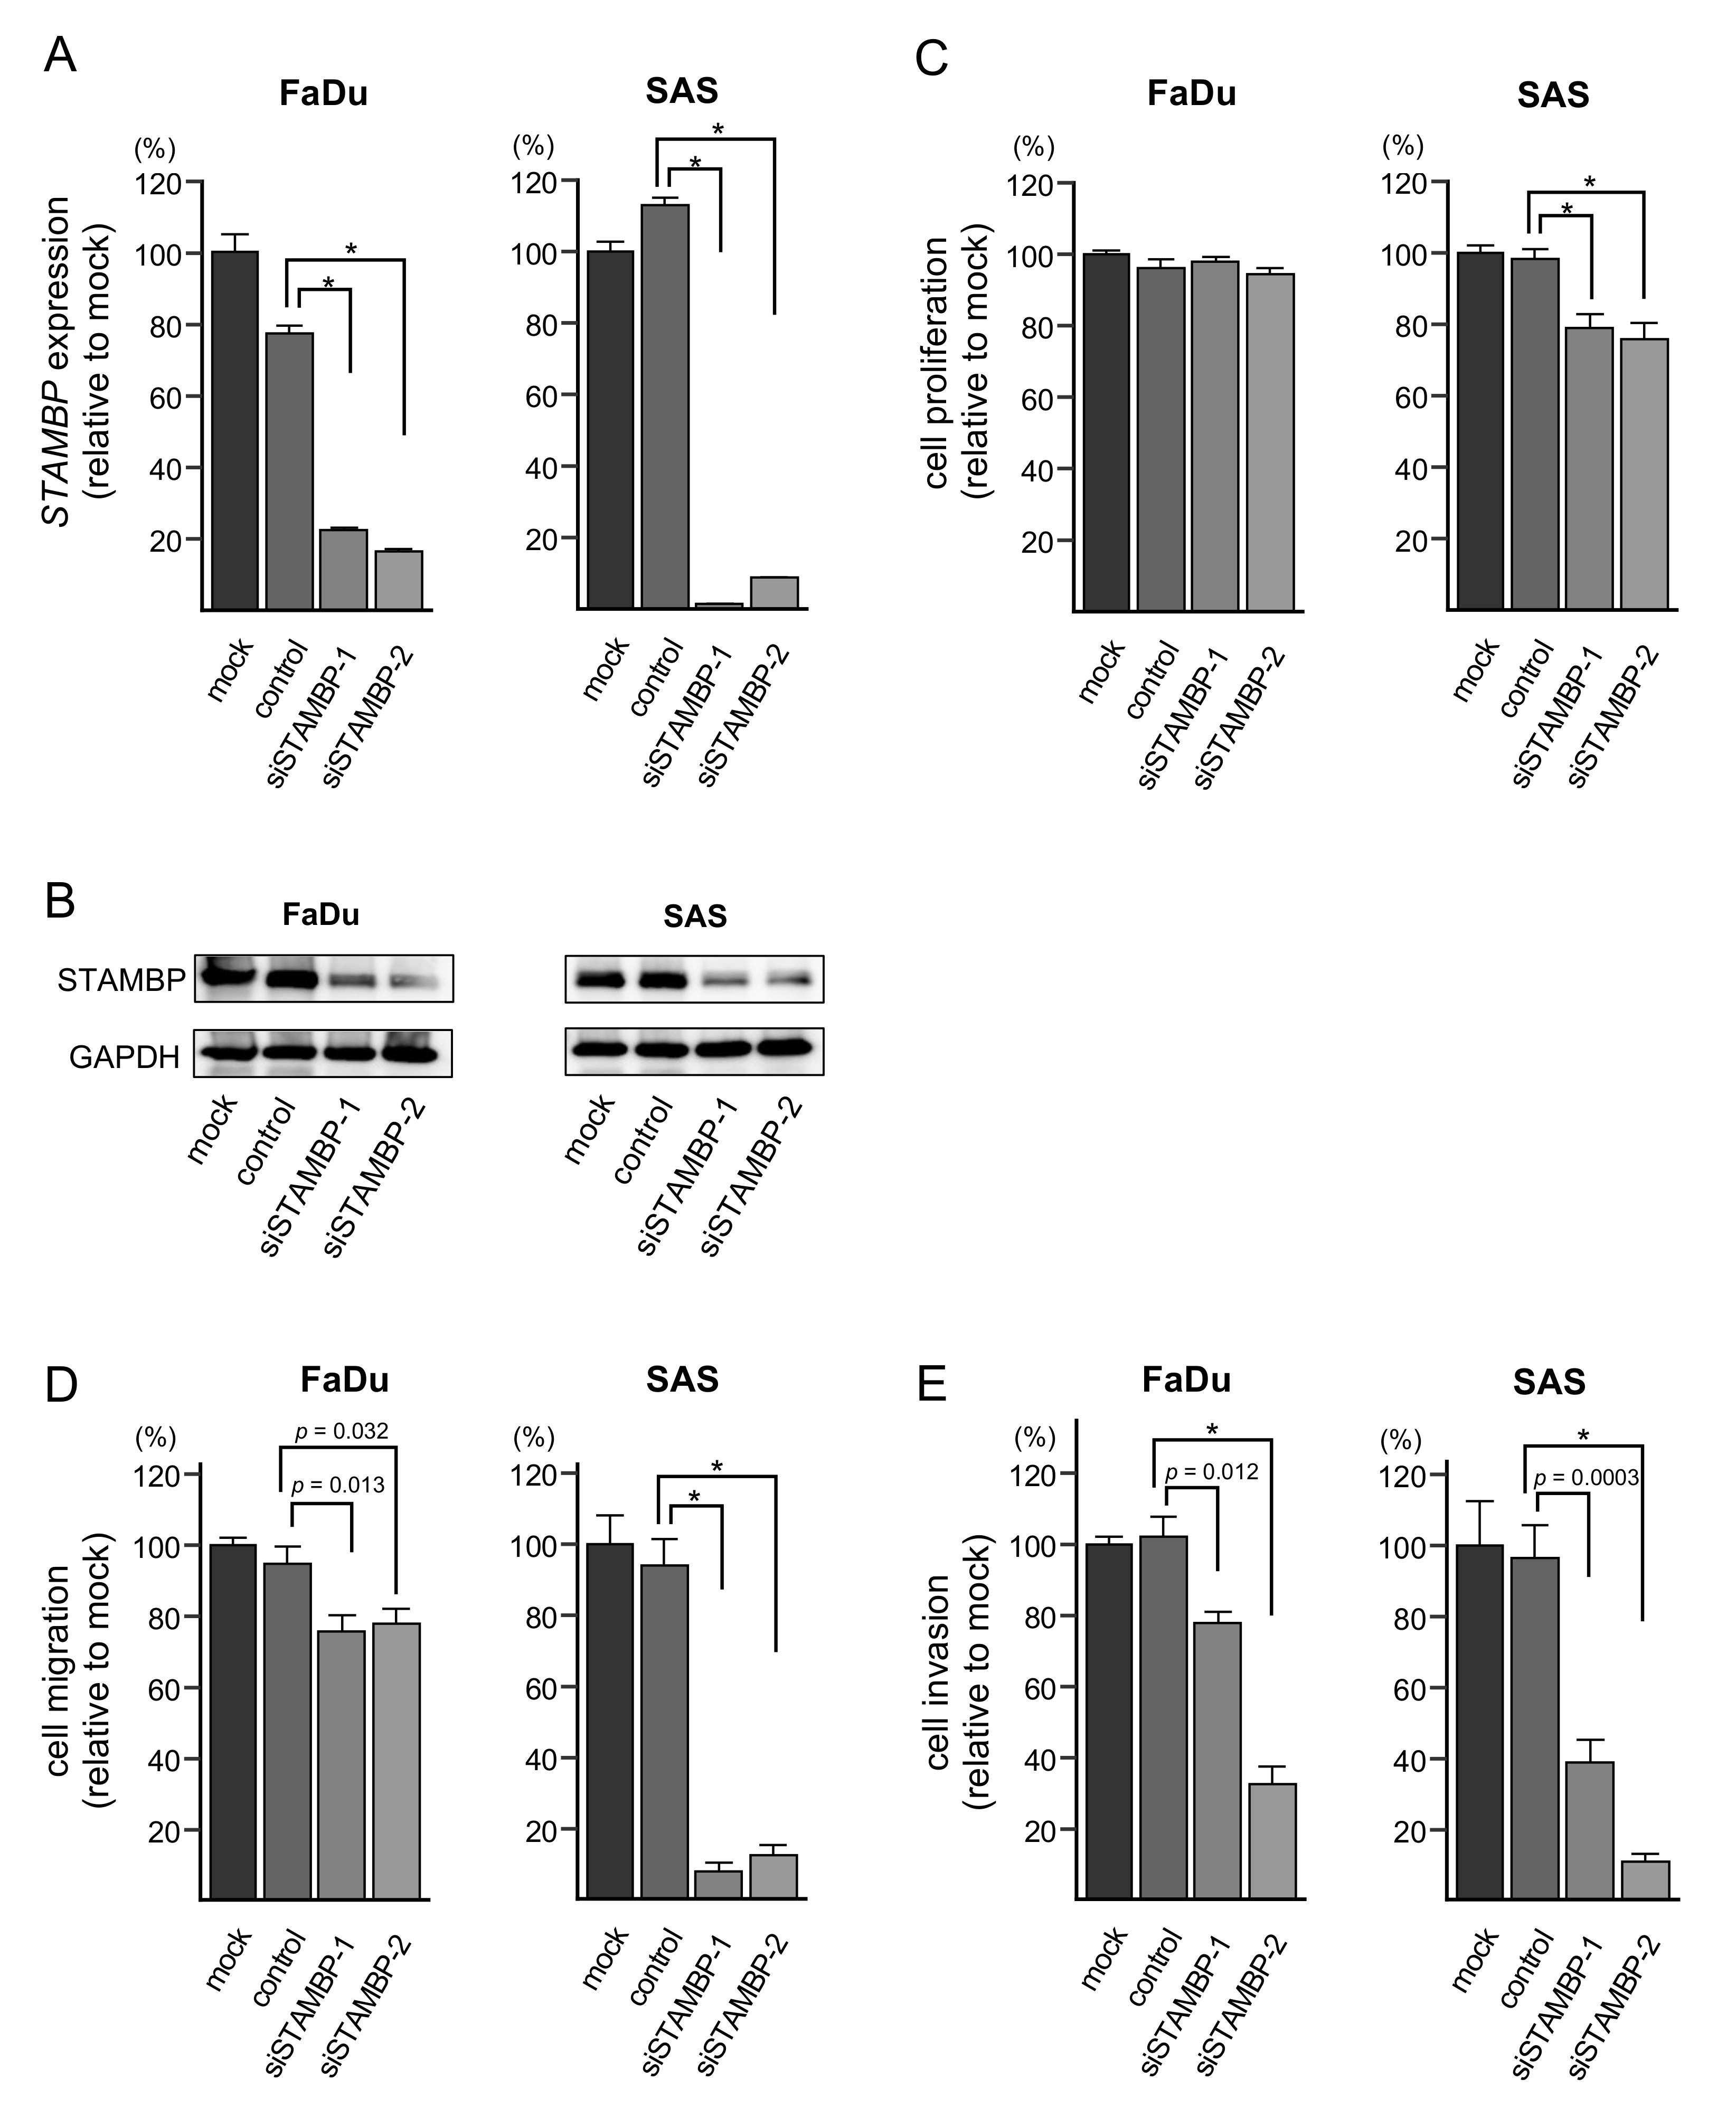
3.7. Effects of STAMBP Knockdown on Cell Proliferation, Migration, and Invasion in HNSCC Cells

To investigate the oncogenic functions of STAMBP in HNSCC cells, knockdown assays were conducted using small interfering RNAs (siRNAs). Both mRNA and protein expression levels were successfully suppressed by siSTAMBP-1 and siSTAMBP-2 transfection into FaDu and SAS cells (Figure 6A,B). The whole pictures of Western blotting are shown in Figure S6.
In functional assays, cell proliferation was not suppressed by siSTAMBP transfection into FaDu cells. Besides, in SAS cells, cell proliferation was significantly suppressed by siSTAMBP transfection (Figure 6C). Cell migration and invasive abilities were significantly blocked by knockdown of STAMBP (siSTAMBP-1 and siSTAMBP-2) in FaDu and SAS cells (Figure 6D,E). The photomicrographs are shown in Figure S3. Regarding the cell proliferation assay, the results differed between FaDu cells and SAS cells. To explain this phenomenon, a detailed analysis of genes involved in cell cycle and cell division for two cell lines will be necessary.

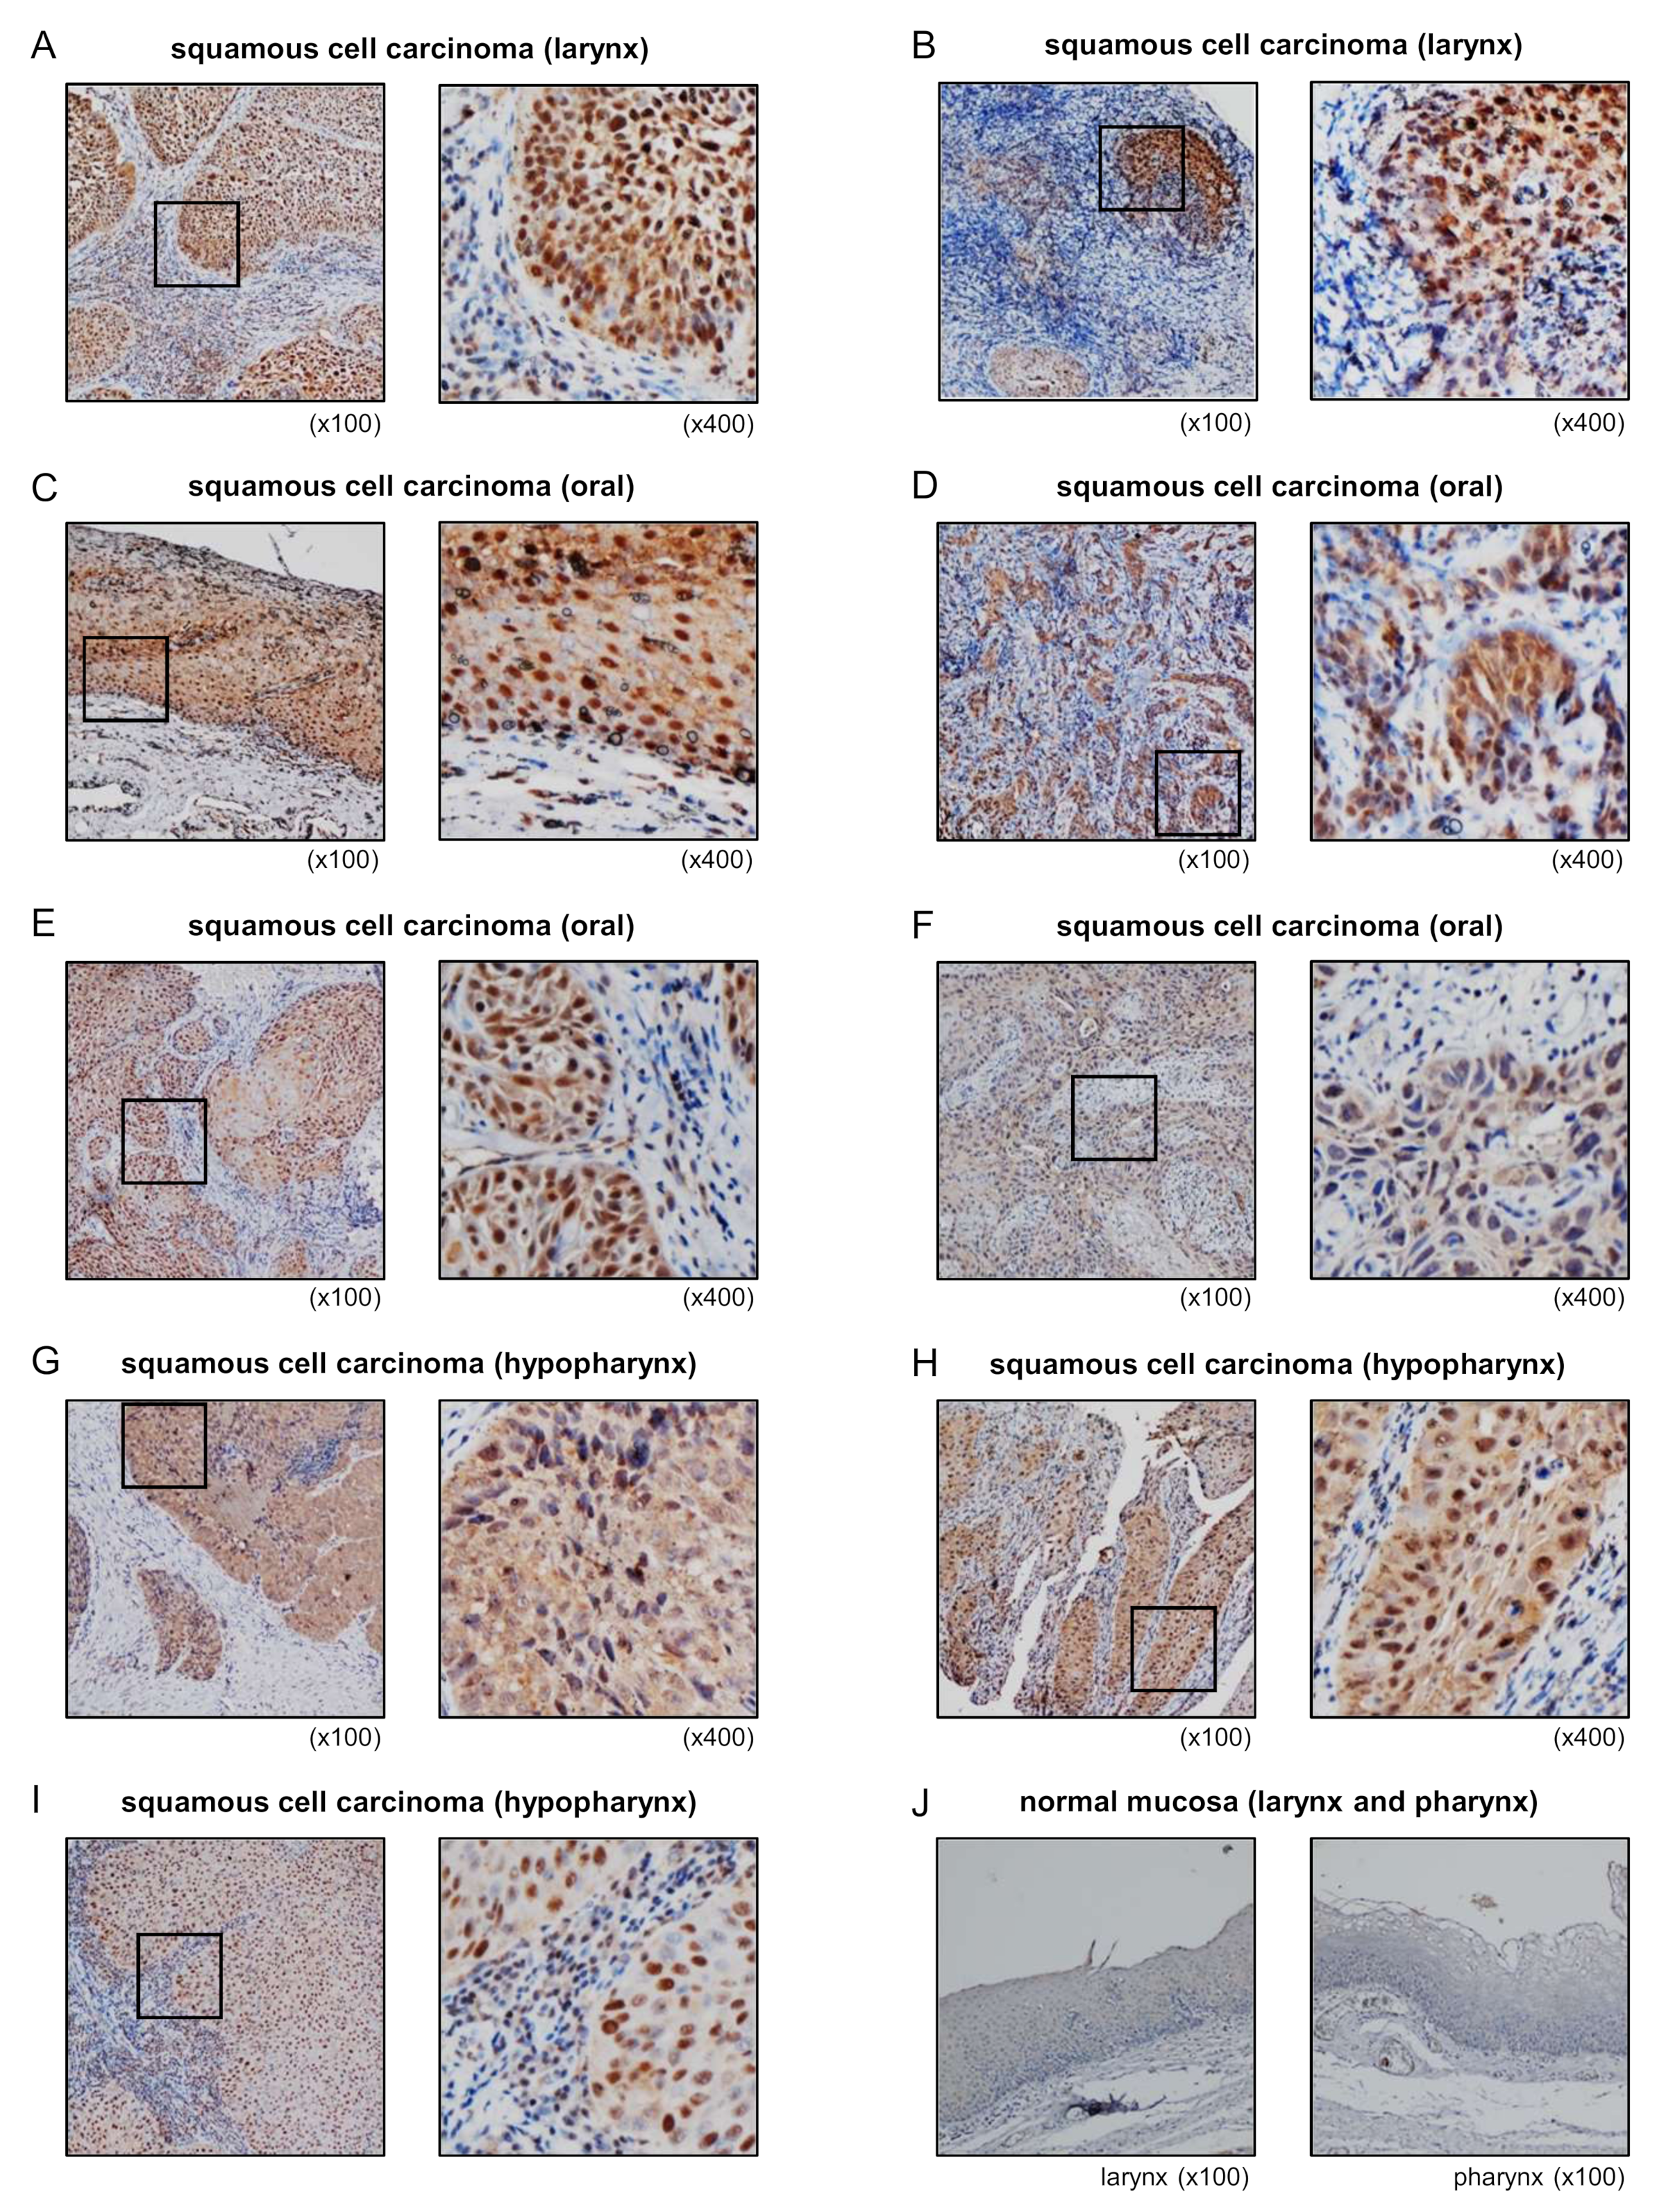
3.8. Overexpression of STAMBP in HNSCC Clinical Specimens

Expression of STAMBP protein was evaluated using HNSCC clinical specimens. Overexpression of STAMBP was detected in cancer lesions in HNSCC clinical specimens (Figure 7A–H). In contrast to cancer lesions, expression of STAMBP was extremely weak in normal mucosa (Figure 7J). Information on clinical specimens used for immunostaining is shown in Table 3.
To confirm our immunostaining results, we analyzed gene expression data of GEO database (accession number: GSE6631). Analysis of gene expression data showed that expression of STAMBP was significantly upregulated in HNSCC clinical specimens (Figure S9).

4. Discussion

Owing to the high rate of recurrence and metastasis in HNSCC, HNSCC is still a deadly cancer, with an average 50% overall 5-year survival rate [1,2,3,4,5,6]. In order to improve treatment outcomes in patients with HNSCC, it is essential to develop treatments for cases with recurrence and metastasis. Advanced genomic approaches are effective for elucidating the molecular pathogenesis of HNSCC, leading to the identification of molecular targets for treatment.
As part of the unique biological nature of miRNAs, a single miRNA can control (directly or indirectly) many RNA transcripts in each cell. Therefore, the aberrant expression of miRNA influences multiple pathways, including cell proliferation, migration, invasion, and apoptosis. Aberrantly expressed miRNAs disrupt RNA expression networks, resulting in cancer cell initiation, development, metastasis, and drug resistance [11,12,13,14,15]. Accordingly, we have sequentially identified antitumor miRNAs and their controlled molecular targets and pathways in HNSCC cells based on miRNA signatures [16,17,18,19,20]. We recently created an HNSCC miRNA expression signature by RNA sequencing [20]. Notably, our signatures revealed that some miRNA passenger strands, e.g., miR-143-5p, miR-145-3p, miR-150-3p, miR-199a-3p, and miR-199b-3p were downregulated in HNSCC tissues and that their expression status was closely involved in HNSCC molecular pathogenesis [20,23,27]. More recently, our group revealed that passenger strands of miRNAs exert antitumor roles by targeting several oncogenes in prostate cancer, renal cell carcinoma, esophageal squamous cell carcinoma, and lung cancer [28,29,30,31,32,33,34]. The participation of passenger strands of miRNAs in carcinogenesis is a new concept in cancer research.
In this study, we revealed that both strands of the miR-99a-duplex (miR-99a-5p and miR-99a-3p) acted as antitumor miRNAs in HNSCC cells. Moreover, we showed that 18 and 30 genes were putative targets of miR-99a-5p and miR-99a-3p regulation, respectively. Many studies have shown that miR-99a-5p acts as an antitumor miRNA in various cancers by targeting many oncogenes [35,36,37,38,39]. In contrast to miR-99a-5p, few papers have analyzed the functional significance of miR-99a-3p in cancer cells. Previously, downregulation of miR-99a-3p was detected in castration-resistant prostate cancer (CRPC), and ectopic expression of miR-99a-3p was found to attenuate cancer cell aggressive phenotypes [40]. Moreover, miR-99a-3p was shown to regulate non-SMC condensin I complex subunit G directly, and its overexpression was detected in CRPC clinical specimens, showing a significant association with shorter disease-free survival and advanced clinical stage [40]. In renal cell carcinoma cells, miR-99a-3p significantly inhibits cell proliferation and colony formation through regulating ribonucleotide reductase regulatory subunit-M2 [41]. More recently, lower expression of miR-99a-3p and its mediated molecular pathways were detected in HNSCC by in silico analysis, TCGA database, and Genotype-Tissue Expression sequencing databases [42]. These studies indicated that the downregulation of miR-99a-3p was closely involved in cancer pathogenesis.
In this study, we aimed to identify oncogenic targets regulated by miR-99a-3p in HNSCC cells. In total, 114 genes were identified as miR-99a-3p-controlled genes, and 10 of these genes (STAMBP, TIMP4, TMEM14C, CANX, SUV420H1, HSP90B1, PDIA3, MTHFD2, BCAT1, and SLC22A15) significantly predicted 5-year overall survival. Notably, among these genes, STAMBP, TIMP4, TMEM14C, CANX, and SUV420H1 were independent prognostic markers of HNSCC, as demonstrated by multivariate analyses. Our preliminary analysis has shown that these genes were controlled by miR-99a-3p in HNSCC cells (Figure S8). Further detailed examinations are necessary in the future. A previous study showed that TIMP4 secretion was regulated by the expression of LOX/SNAI2 axis and contributed to the malignant phenotype of cancers, e.g., thyroid cancer, colon cancer, and breast cancer [43]. Calnexin CANX is an integral protein of the endoplasmic reticulum and acts as a chaperon. In colorectal cancer, overexpression of CANX predicted poor prognosis of the patients, and its knockdown attenuated aggressive phenotypes of cancer cells [44]. Another study showed that serum levels of CANX were significantly higher in patients with lung cancer, and its expression was a useful sero-diagnostic marker of the patients [45]. Overexpression of SUV420H1 (acts as lysine methyl transferase) enhanced oncogenic ERK signaling through ERK phosphorylation and transcription [46]. These genes may be candidate prognostic markers and therapeutic targets in HNSCC. Functional analysis of these genes will reveal new molecular pathologies for HNSCC.
Among these targets, we further investigated the oncogenic roles of STAMBP in HNSCC cells. STAM-binding protein (STAMBP) is a deubiquitinating enzyme that interacts with the SH3 domain of STAM. This protein plays key roles in cell surface receptor-mediated endocytosis and sorting and in cytokine-mediated signaling for MYC induction and cell cycle progression [47,48,49,50,51]. Whole-exome sequencing revealed that the microcephaly-capillary malformation syndrome was related to recessive mutations in STAMBP [52]. In cancer research, almost no functional analysis of STAMBP has been conducted. A recent study showed that STAMBP expression contributes to melanoma cell migration and invasion through the stabilization of SLUG expression [53]. This result was consistent with our current HNSCC data. In this study, overexpression of STAMBP was detected in HNSCC clinical specimens; knockdown assays using siRNAs demonstrated that migration and invasion were significantly reduced in HNSCC cells. Thus, overexpression of STAMBP may promote cancer cell metastasis. Further studies are needed to analyze the molecular networks controlled by STAMBP in various cancers.

5. Conclusions

Based on the miRNA expression signature of HNSCC, we revealed that miR-99a-3p (the passenger strand) acted as an antitumor miRNA in HNSCC cells. In total, 10 genes (STAMBP, TIMP4, TMEM14C, CANX, SUV420H1, HSP90B1, PDIA3, MTHFD2, BCAT1, and SLC22A15) were regulated by miR-99a-3p in HNSCC cells and were closely involved in HNSCC molecular pathogenesis. STAMBP expression was directly controlled by miR-99a-3p, and its overexpression enhanced cancer cell migration and invasion. Our strategy, i.e., identification of antitumor miRNAs and their targets, may be an attractive tool to reveal novel prognostic and therapeutic targets in HNSCC.

Supplementary Materials

The following are available online at https://0-www-mdpi-com.brum.beds.ac.uk/2073-4409/8/12/1535/s1, Figure S1: Comparison of expression levels of miR-99a-5p and miR-99a- 3p in cancer tissues and normal tissues; Figure S2: Spearman’s rank tests showing positive correlations between expression levels of miR-99a-5p and miR-99a-3p in TCGA datasets; Figure S3: Photomicrographs of migration and invasion following miRNA or siRNA transfection into HNSCC cells; Figure S4: Incorporation of miR-99a-5p and miR-99a-3p into the RISC in HNSCC cells.; Figure S5: Strategy for identification of miR-99a-5p and miR-99a-3p targets in HNSCC cells; Figure S6: Whole Western blotting images following miRNA or siRNA transfection into HNSCC cells; Figure S7: Nucleotide sequences cloned into luciferase reporter assay vectors; Figure S8: TIMP4, TMEM14C, SUV420H1, and CANX in miR-99a-3p transfected FaDu and SAS cells. miR-99a-3p binding sites in 3′UTR of each genes are also shown; Figure S9: Significantly increased (p = 0.0060) STAMBP expression levels in clinical samples of HNSCC (N = 22; GSE6631 dataset); Table S1: Candidate target genes regulated by miR-99a-5p; Table S2: Reagents used in this study.

Author Contributions

Research planning and paper writing, N.S.; functional analysis of cells, R.O., K.K., Y.Y. and S.M.; clinical data analysis, R.O., K.K. and Y.Y.; gene expression analysis, R.O., Y.Y., S.M., N.K. and T.K.; collection and management of clinical samples, N.K., T.K. and T.H.; data validation, S.M. and T.H.; funding acquisition, N.S., K.K., N.K., T.K. and T.H.

Funding

This research was funded by KAKENHI grants (grant nos. 17K16893, 17K11375, 18K09338, 19K09863, 19K18795, 19K18759).

Conflicts of Interest

The authors declare no conflicts of interest.

References

  1. Siegel, R.L.; Miller, K.D.; Jemal, A. Cancer statistics, 2019. CA Cancer J. Clin. 2019, 69, 7–34. [Google Scholar] [CrossRef] [PubMed]
  2. Leemans, C.R.; Braakhuis, B.J.; Brakenhoff, R.H. The molecular biology of head and neck cancer. Nat. Rev. Cancer 2011, 11, 9–22. [Google Scholar] [CrossRef] [PubMed]
  3. D’Souza, G.; Kreimer, A.R.; Viscidi, R.; Pawlita, M.; Fakhry, C.; Koch, W.M.; Westra, W.H.; Gillison, M.L. Case-control study of human papillomavirus and oropharyngeal cancer. N. Engl. J. Med 2007, 356, 1944–1956. [Google Scholar] [CrossRef] [PubMed]
  4. Seiwert, T.Y.; Zuo, Z.; Keck, M.K.; Khattri, A.; Pedamallu, C.S.; Stricker, T.; Brown, C.; Pugh, T.J.; Stojanov, P.; Cho, J.; et al. Integrative and comparative genomic analysis of HPV-positive and HPV-negative head and neck squamous cell carcinomas. Clin. Cancer Res. 2015, 21, 632–641. [Google Scholar] [CrossRef] [PubMed]
  5. Bonner, J.A.; Harari, P.M.; Giralt, J.; Cohen, R.B.; Jones, C.U.; Sur, R.K.; Raben, D.; Baselga, J.; Spencer, S.A.; Zhu, J.; et al. Radiotherapy plus cetuximab for locoregionally advanced head and neck cancer: 5-year survival data from a phase 3 randomised trial, and relation between cetuximab-induced rash and survival. Lancet Oncol. 2010, 11, 21–28. [Google Scholar] [CrossRef]
  6. Ferris, R.L.; Blumenschein, G., Jr.; Fayette, J.; Guigay, J.; Colevas, A.D.; Licitra, L.; Harrington, K.; Kasper, S.; Vokes, E.E.; Even, C.; et al. Nivolumab for Recurrent Squamous-Cell Carcinoma of the Head and Neck. N. Engl. J. Med. 2016, 375, 1856–1867. [Google Scholar] [CrossRef]
  7. Argiris, A.; Harrington, K.J.; Tahara, M.; Schulten, J.; Chomette, P.; Ferreira Castro, A.; Licitra, L. Evidence-Based Treatment Options in Recurrent and/or Metastatic Squamous Cell Carcinoma of the Head and Neck. Front. Oncol. 2017, 7, 72. [Google Scholar] [CrossRef]
  8. Hsieh, J.C.; Wang, H.M.; Wu, M.H.; Chang, K.P.; Chang, P.H.; Liao, C.T.; Liau, C.T. Review of emerging biomarkers in head and neck squamous cell carcinoma in the era of immunotherapy and targeted therapy. Head Neck 2019, 41, 19–45. [Google Scholar] [CrossRef]
  9. Ha, M.; Kim, V.N. Regulation of microRNA biogenesis. Nat. Rev. Mol. Cell Biol. 2014, 15, 509–524. [Google Scholar] [CrossRef]
  10. Gebert, L.F.R.; MacRae, I.J. Regulation of microRNA function in animals. Nat. Rev. Mol. Cell Biol. 2019, 20, 21–37. [Google Scholar] [CrossRef]
  11. Nohata, N.; Hanazawa, T.; Kinoshita, T.; Okamoto, Y.; Seki, N. MicroRNAs function as tumor suppressors or oncogenes: aberrant expression of microRNAs in head and neck squamous cell carcinoma. Auris Nasus Larynx 2013, 40, 143–149. [Google Scholar] [CrossRef] [PubMed]
  12. Lin, S.; Gregory, R.I. MicroRNA biogenesis pathways in cancer. Nat. Rev. Cancer 2015, 15, 321–333. [Google Scholar] [CrossRef] [PubMed]
  13. Koshizuka, K.; Hanazawa, T.; Arai, T.; Okato, A.; Kikkawa, N.; Seki, N. Involvement of aberrantly expressed microRNAs in the pathogenesis of head and neck squamous cell carcinoma. Cancer Metastasis Rev. 2017, 36, 525–545. [Google Scholar] [CrossRef] [PubMed]
  14. Rupaimoole, R.; Slack, F.J. MicroRNA therapeutics: towards a new era for the management of cancer and other diseases. Nat. Rev. Drug Discov. 2017, 16, 203–222. [Google Scholar] [CrossRef] [PubMed]
  15. Anfossi, S.; Babayan, A.; Pantel, K.; Calin, G.A. Clinical utility of circulating non-coding RNAs-an update. Nat. Rev. Clin. Oncol. 2018, 15, 541–563. [Google Scholar] [CrossRef] [PubMed]
  16. Kikkawa, N.; Hanazawa, T.; Fujimura, L.; Nohata, N.; Suzuki, H.; Chazono, H.; Sakurai, D.; Horiguchi, S.; Okamoto, Y.; Seki, N. miR-489 is a tumour-suppressive miRNA target PTPN11 in hypopharyngeal squamous cell carcinoma (HSCC). Br. J. Cancer 2010, 103, 877–884. [Google Scholar] [CrossRef] [PubMed]
  17. Nohata, N.; Hanazawa, T.; Kikkawa, N.; Sakurai, D.; Fujimura, L.; Chiyomaru, T.; Kawakami, K.; Yoshino, H.; Enokida, H.; Nakagawa, M.; et al. Tumour suppressive microRNA-874 regulates novel cancer networks in maxillary sinus squamous cell carcinoma. Br. J. Cancer 2011, 105, 833–841. [Google Scholar] [CrossRef]
  18. Fukumoto, I.; Kinoshita, T.; Hanazawa, T.; Kikkawa, N.; Chiyomaru, T.; Enokida, H.; Yamamoto, N.; Goto, Y.; Nishikawa, R.; Nakagawa, M.; et al. Identification of tumour suppressive microRNA-451a in hypopharyngeal squamous cell carcinoma based on microRNA expression signature. Br. J. Cancer 2014, 111, 386–394. [Google Scholar] [CrossRef]
  19. Fukumoto, I.; Hanazawa, T.; Kinoshita, T.; Kikkawa, N.; Koshizuka, K.; Goto, Y.; Nishikawa, R.; Chiyomaru, T.; Enokida, H.; Nakagawa, M.; et al. MicroRNA expression signature of oral squamous cell carcinoma: functional role of microRNA-26a/b in the modulation of novel cancer pathways. Br. J. Cancer 2015, 112, 891–900. [Google Scholar] [CrossRef]
  20. Koshizuka, K.; Nohata, N.; Hanazawa, T.; Kikkawa, N.; Arai, T.; Okato, A.; Fukumoto, I.; Katada, K.; Okamoto, Y.; Seki, N. Deep sequencing-based microRNA expression signatures in head and neck squamous cell carcinoma: Dual strands of pre-miR-150 as antitumor miRNAs. Oncotarget 2017, 8, 30288–30304. [Google Scholar] [CrossRef]
  21. Kinoshita, T.; Nohata, N.; Hanazawa, T.; Kikkawa, N.; Yamamoto, N.; Yoshino, H.; Itesako, T.; Enokida, H.; Nakagawa, M.; Okamoto, Y.; et al. Tumour-suppressive microRNA-29s inhibit cancer cell migration and invasion by targeting laminin-integrin signalling in head and neck squamous cell carcinoma. Br. J. Cancer 2013, 109, 2636–2645. [Google Scholar] [CrossRef] [PubMed]
  22. Koshizuka, K.; Kikkawa, N.; Hanazawa, T.; Yamada, Y.; Okato, A.; Arai, T.; Katada, K.; Okamoto, Y.; Seki, N. Inhibition of integrin beta1-mediated oncogenic signalling by the antitumor microRNA-29 family in head and neck squamous cell carcinoma. Oncotarget 2018, 9, 3663–3676. [Google Scholar] [CrossRef] [PubMed]
  23. Koshizuka, K.; Hanazawa, T.; Kikkawa, N.; Arai, T.; Okato, A.; Kurozumi, A.; Kato, M.; Katada, K.; Okamoto, Y.; Seki, N. Regulation of ITGA3 by the anti-tumor miR-199 family inhibits cancer cell migration and invasion in head and neck cancer. Cancer Sci. 2017, 108, 1681–1692. [Google Scholar] [CrossRef] [PubMed]
  24. Fukumoto, I.; Kikkawa, N.; Matsushita, R.; Kato, M.; Kurozumi, A.; Nishikawa, R.; Goto, Y.; Koshizuka, K.; Hanazawa, T.; Enokida, H.; et al. Tumor-suppressive microRNAs (miR-26a/b, miR-29a/b/c and miR-218) concertedly suppressed metastasis-promoting LOXL2 in head and neck squamous cell carcinoma. J. Hum. Genet. 2016, 61, 109–118. [Google Scholar] [CrossRef]
  25. Chen, D.; Cabay, R.J.; Jin, Y.; Wang, A.; Lu, Y.; Shah-Khan, M.; Zhou, X. MicroRNA Deregulations in Head and Neck Squamous Cell Carcinomas. J. Oral. Maxillofac. Res. 2013, 4, e2. [Google Scholar] [CrossRef]
  26. Chen, Y.T.; Yao, J.N.; Qin, Y.T.; Hu, K.; Wu, F.; Fang, Y.Y. Biological role and clinical value of miR-99a-5p in head and neck squamous cell carcinoma (HNSCC): A bioinformatics-based study. FEBS Open Bio 2018, 8, 1280–1298. [Google Scholar] [CrossRef]
  27. Yamada, Y.; Koshizuka, K.; Hanazawa, T.; Kikkawa, N.; Okato, A.; Idichi, T.; Arai, T.; Sugawara, S.; Katada, K.; Okamoto, Y.; et al. Passenger strand of miR-145-3p acts as a tumor-suppressor by targeting MYO1B in head and neck squamous cell carcinoma. Int. J. Oncol. 2018, 52, 166–178. [Google Scholar] [CrossRef]
  28. Goto, Y.; Kurozumi, A.; Arai, T.; Nohata, N.; Kojima, S.; Okato, A.; Kato, M.; Yamazaki, K.; Ishida, Y.; Naya, Y.; et al. Impact of novel miR-145-3p regulatory networks on survival in patients with castration-resistant prostate cancer. Br. J. Cancer 2017, 117, 409–420. [Google Scholar] [CrossRef]
  29. Misono, S.; Seki, N.; Mizuno, K.; Yamada, Y.; Uchida, A.; Arai, T.; Kumamoto, T.; Sanada, H.; Suetsugu, T.; Inoue, H. Dual strands of the miR-145 duplex (miR-145-5p and miR-145-3p) regulate oncogenes in lung adenocarcinoma pathogenesis. J. Hum. Genet. 2018, 63, 1015–1028. [Google Scholar] [CrossRef]
  30. Misono, S.; Seki, N.; Mizuno, K.; Yamada, Y.; Uchida, A.; Sanada, H.; Moriya, S.; Kikkawa, N.; Kumamoto, T.; Suetsugu, T.; et al. Molecular Pathogenesis of Gene Regulation by the miR-150 Duplex: miR-150-3p Regulates TNS4 in Lung Adenocarcinoma. Cancers 2019, 11. [Google Scholar] [CrossRef]
  31. Yamada, Y.; Arai, T.; Kojima, S.; Sugawara, S.; Kato, M.; Okato, A.; Yamazaki, K.; Naya, Y.; Ichikawa, T.; Seki, N. Regulation of antitumor miR-144-5p targets oncogenes: Direct regulation of syndecan-3 and its clinical significance. Cancer Sci. 2018, 109, 2919–2936. [Google Scholar] [CrossRef] [PubMed] [Green Version]
  32. Uchida, A.; Seki, N.; Mizuno, K.; Misono, S.; Yamada, Y.; Kikkawa, N.; Sanada, H.; Kumamoto, T.; Suetsugu, T.; Inoue, H. Involvement of dual-strand of the miR-144 duplex and their targets in the pathogenesis of lung squamous cell carcinoma. Cancer Sci. 2019, 110, 420–432. [Google Scholar] [CrossRef] [PubMed] [Green Version]
  33. Sanada, H.; Seki, N.; Mizuno, K.; Misono, S.; Uchida, A.; Yamada, Y.; Moriya, S.; Kikkawa, N.; Machida, K.; Kumamoto, T.; et al. Involvement of Dual Strands of miR-143 (miR-143-5p and miR-143-3p) and Their Target Oncogenes in the Molecular Pathogenesis of Lung Adenocarcinoma. Int. J. Mol. Sci. 2019, 20. [Google Scholar] [CrossRef] [PubMed] [Green Version]
  34. Shimonosono, M.; Idichi, T.; Seki, N.; Yamada, Y.; Arai, T.; Arigami, T.; Sasaki, K.; Omoto, I.; Uchikado, Y.; Kita, Y.; et al. Molecular pathogenesis of esophageal squamous cell carcinoma: Identification of the antitumor effects of miR1453p on gene regulation. Int. J. Oncol. 2019, 54, 673–688. [Google Scholar] [CrossRef] [Green Version]
  35. Shi, Y.; Bo, Z.; Pang, G.; Qu, X.; Bao, W.; Yang, L.; Ma, Y. MiR-99a-5p regulates proliferation, migration and invasion abilities of human oral carcinoma cells by targeting NOX4. Neoplasma 2017, 64, 666–673. [Google Scholar] [CrossRef]
  36. Tsai, T.F.; Lin, J.F.; Chou, K.Y.; Lin, Y.C.; Chen, H.E.; Hwang, T.I. miR-99a-5p acts as tumor suppressor via targeting to mTOR and enhances RAD001-induced apoptosis in human urinary bladder urothelial carcinoma cells. OncoTargets Ther. 2018, 11, 239–252. [Google Scholar] [CrossRef] [Green Version]
  37. Yin, H.; Ma, J.; Chen, L.; Piao, S.; Zhang, Y.; Zhang, S.; Ma, H.; Li, Y.; Qu, Y.; Wang, X.; et al. MiR-99a Enhances the Radiation Sensitivity of Non-Small Cell Lung Cancer by Targeting mTOR. Cell Physiol. Biochem. 2018, 46, 471–481. [Google Scholar] [CrossRef]
  38. Liu, Y.; Li, B.; Yang, X.; Zhang, C. MiR-99a-5p inhibits bladder cancer cell proliferation by directly targeting mammalian target of rapamycin and predicts patient survival. J. Cell Biochem. 2019, 120, 19330–19337. [Google Scholar] [CrossRef]
  39. Tao, C.; Sun, H.; Sang, W.; Li, S. miRNA-99a inhibits cell invasion and migration in liver cancer by directly targeting HOXA1. Oncol. Lett. 2019, 17, 5108–5114. [Google Scholar] [CrossRef] [Green Version]
  40. Arai, T.; Okato, A.; Yamada, Y.; Sugawara, S.; Kurozumi, A.; Kojima, S.; Yamazaki, K.; Naya, Y.; Ichikawa, T.; Seki, N. Regulation of NCAPG by miR-99a-3p (passenger strand) inhibits cancer cell aggressiveness and is involved in CRPC. Cancer Med. 2018, 7, 1988–2002. [Google Scholar] [CrossRef]
  41. Osako, Y.; Yoshino, H.; Sakaguchi, T.; Sugita, S.; Yonemori, M.; Nakagawa, M.; Enokida, H. Potential tumorsuppressive role of microRNA99a3p in sunitinibresistant renal cell carcinoma cells through the regulation of RRM2. Int. J. Oncol. 2019, 54, 1759–1770. [Google Scholar] [CrossRef] [PubMed]
  42. Wei, G.G.; Guo, W.P.; Tang, Z.Y.; Li, S.H.; Wu, H.Y.; Zhang, L.C. Expression level and prospective mechanism of miRNA-99a-3p in head and neck squamous cell carcinoma based on miRNA-chip and miRNA-sequencing data in 1, 167 cases. Pathol. Res. Pr. 2019, 215, 963–976. [Google Scholar] [CrossRef] [PubMed]
  43. Boufraqech, M.; Zhang, L.; Nilubol, N.; Sadowski, S.M.; Kotian, S.; Quezado, M.; Kebebew, E. Lysyl Oxidase (LOX) Transcriptionally Regulates SNAI2 Expression and TIMP4 Secretion in Human Cancers. Clin. Cancer Res. 2016, 22, 4491–4504. [Google Scholar] [CrossRef] [PubMed] [Green Version]
  44. Ryan, D.; Carberry, S.; Murphy, A.C.; Lindner, A.U.; Fay, J.; Hector, S.; McCawley, N.; Bacon, O.; Concannon, C.G.; Kay, E.W.; et al. Calnexin, an ER stress-induced protein, is a prognostic marker and potential therapeutic target in colorectal cancer. J. Transl. Med. 2016, 14, 196. [Google Scholar] [CrossRef] [PubMed] [Green Version]
  45. Kobayashi, M.; Nagashio, R.; Jiang, S.X.; Saito, K.; Tsuchiya, B.; Ryuge, S.; Katono, K.; Nakashima, H.; Fukuda, E.; Goshima, N.; et al. Calnexin is a novel sero-diagnostic marker for lung cancer. Lung Cancer 2015, 90, 342–345. [Google Scholar] [CrossRef] [PubMed] [Green Version]
  46. Vougiouklakis, T.; Sone, K.; Saloura, V.; Cho, H.S.; Suzuki, T.; Dohmae, N.; Alachkar, H.; Nakamura, Y.; Hamamoto, R. SUV420H1 enhances the phosphorylation and transcription of ERK1 in cancer cells. Oncotarget 2015, 6, 43162–43171. [Google Scholar] [CrossRef] [Green Version]
  47. Li, H.; Seth, A. An RNF11: Smurf2 complex mediates ubiquitination of the AMSH protein. Oncogene 2004, 23, 1801–1808. [Google Scholar] [CrossRef] [Green Version]
  48. McCullough, J.; Clague, M.J.; Urbe, S. AMSH is an endosome-associated ubiquitin isopeptidase. J. Cell Biol. 2004, 166, 487–492. [Google Scholar] [CrossRef] [Green Version]
  49. Agromayor, M.; Martin-Serrano, J. Interaction of AMSH with ESCRT-III and deubiquitination of endosomal cargo. J. Biol. Chem. 2006, 281, 23083–23091. [Google Scholar] [CrossRef] [Green Version]
  50. Ma, Y.M.; Boucrot, E.; Villen, J.; Affar el, B.; Gygi, S.P.; Gottlinger, H.G.; Kirchhausen, T. Targeting of AMSH to endosomes is required for epidermal growth factor receptor degradation. J. Biol. Chem. 2007, 282, 9805–9812. [Google Scholar] [CrossRef] [Green Version]
  51. Meijer, I.M.; van Rotterdam, W.; van Zoelen, E.J.; van Leeuwen, J.E. Recycling of EGFR and ErbB2 is associated with impaired Hrs tyrosine phosphorylation and decreased deubiquitination by AMSH. Cell Signal. 2012, 24, 1981–1988. [Google Scholar] [CrossRef] [PubMed]
  52. McDonell, L.M.; Mirzaa, G.M.; Alcantara, D.; Schwartzentruber, J.; Carter, M.T.; Lee, L.J.; Clericuzio, C.L.; Graham, J.M., Jr.; Morris-Rosendahl, D.J.; Polster, T.; et al. Mutations in STAMBP, encoding a deubiquitinating enzyme, cause microcephaly-capillary malformation syndrome. Nat. Genet. 2013, 45, 556–562. [Google Scholar] [CrossRef] [PubMed] [Green Version]
  53. Iwakami, Y.; Yokoyama, S.; Watanabe, K.; Hayakawa, Y. STAM-binding protein regulates melanoma metastasis through SLUG stabilization. Biochem. Biophys. Res. Commun. 2018, 507, 484–488. [Google Scholar] [CrossRef] [PubMed]
Figure 1. Expression and clinical significance of miR-99a-5p and miR-99a-3p in HNSCC clinical specimens. (A) Expression of miR-99a-5p and miR-99a-3p was significantly reduced in HNSCC clinical specimens and cell lines (FaDu and SAS cells). Data were normalized to the expression of RNU48. (B) Spearman’s rank tests showed positive correlations between expression levels of miR-99a-5p and miR-99a-3p in clinical specimens. (C) Kaplan-Meier survival curve analyses of patients with HNSCC using data from The Cancer Genome Atlas (TCGA) database. Patients were divided into two groups according to miRNA expression, high group and low group (according to median expression). The red line shows the high expression group, and the blue line shows the low expression group.
Cells 08 01535 g001
Figure 2. Functional assays of cell proliferation, migration, and invasion following ectopic expression of miR-99a-5p and miR-99a-3p in HNSCC cell lines (FaDu and SAS cells). (A) Cell proliferation was assessed using XTT assays. Data were collected 72 h after miRNA transfection (* p < 0.0001). (B) Cell migration was assessed with membrane culture system. Data were collected 48 h after seeding the cells into the chambers (* p < 0.0001). (C) Cell invasion was determined 48 h after seeding miRNA-transfected cells into chambers using Matrigel invasion assays (* p < 0.0001).
Cells 08 01535 g002
Figure 3. Clinical significance of miR-99a-3p target genes in TCGA database. Among putative targets of miR-99a-3p in HNSCC cells, high expression of 10 genes (STAMBP, TIMP4, TMEM14C, CANX, SUV420H1, HSP90B1, PDIA3, MTHFD2, BCAT1, and SLC22A15) was significantly associated with poor prognosis in patients with HNSCC. Kaplan-Meier curves of 5-year overall survival for each gene are shown.
Cells 08 01535 g003
Figure 4. Forest plot of multivariate analysis of five genes (STAMBP, TIMP4, TMEM14C, SUV420H1, and CANX), which were independent prognostic factors for overall survival after adjustment for patient age, disease, stage, and pathological grade.
Cells 08 01535 g004
Figure 5. Expression of STAMBP/STAMBP was directly regulated by miR-99a-3p in HNSCC cells. (A) Expression of STAMBP mRNA was significantly reduced by miR-99a-3p transfection into FaDu and SAS cells (72 h after transfection; * p < 0.0001, N.S.: Not significant). Expression of GAPDH was used as an internal control. (B) Expression of STAMBP protein was reduced by miR-99a-3p transfection into HNSCC cells (72 h after transfection). Expression of GAPDH was used as an internal control. (C) TargetScanHuman database analyses predicted one putative miR-99a-3p binding site in the 3′-UTR of STAMBP. (D) Dual luciferase reporter assays showed that luminescence activities were reduced by cotransfection with wild-type (miR-99a-3p binding site) vectors and miR-99a-3p in FaDu and SAS cells. Normalized data were calculated as Renilla/firefly luciferase activity ratios (N.S.: Not significant).
Cells 08 01535 g005
Figure 6. Effects of STAMBP knockdown on cell proliferation, migration, and invasion in HNSCC cells. (A) Expression of STAMBP mRNA was significantly reduced by siRNA transfection into HNSCC cells (* p < 0.0001). Expression of GAPDH was used as an internal control. (B) Expression of STAMBP protein was markedly reduced by siRNA transfection into HNSCC cells. Expression of GAPDH was used as an internal control. (C) Cell proliferation was assessed using XTT assays. Data were collected 72 h after miRNA transfection (* p < 0.0001). (D) Cell migration was assessed with a membrane culture system. Data were collected 48 h after seeding the cells into the chambers (* p < 0.0001). (E) Cell invasion was determined 48 h after seeding miRNA-transfected cells into chambers using Matrigel invasion assays (* p < 0.0001).
Cells 08 01535 g006
Figure 7. Overexpression of STAMBP in HNSCC clinical specimens. (AI) Expression of STAMBP was investigated by immunohistochemical staining of HNSCC clinical specimens. Overexpression of STAMBP was detected in the nuclei and/or cytoplasm of cancer cells. (J) Extremely weak expression of STAMBP in normal mucosa of larynx and pharynx.
Cells 08 01535 g007
Table 1. Clinical features of 22 HNSCC patients.
No.AgeSexLocationTNMStageDifferentiation
166Mhypopharynx22c0IVamoderate
266Mhypopharynx4a2c0IVawell
366Mhypopharynx4b2c0IVbmoderate
476Mhypopharynx4a10IVawell
574Mhypopharynx4a2c0IVapoor
645Mhypopharynx4a2c0IVamoderate
775Mhypopharynx4a2c0IVawell
858Mhypopharynx4a00IVawell
969Mlarynx300IIIwell
1070Mlarynx4a10IVawell-moderate
1184Mlarynx4a00IVamoderate
1250Mlarynx4a2b0IVamoderate
1382Mlarynx4a00IVamoderate
1485Mlarynx32b0IVamoderate
1566Mtongue200IImoderate
1673Mtongue310IIIpoor
1774Mtongue100Iwell
1872Mtongue4a2b0IVamoderate
1983Moral floor210IIIwell
2068Foral floor4a10IVawell
2177Moral floor22b0IVamoderate
2269Moropharynx100Iwell
T: Primary tumor stage, N: Regional lymph nodes stage, M: Distant metastasis stage. All according to the UICC (The Union for International Cancer Control) classification.
Table 2. Candidate target genes regulated by miR-99a-3p.
Entrez Gene
ID
Gene SymbolGene NameTotal SitesFaDu miR-99a-3p
Transfectant FC (log2)
TCGA
OncoLnc
5-Year OS p-Value
10617STAMBPSTAM binding protein1−1.05480.0032
7079TIMP4TIMP metallopeptidase inhibitor 41−2.29760.0003
51522TMEM14Ctransmembrane protein 14C1−3.07400.0112
51111SUV420H1 (KMT5B)suppressor of variegation 4-20 homolog 11−1.02380.0432
821CANXcalnexin1−2.35900.0436
10797MTHFD2methylenetetrahydrofolate dehydrogenase (NADP+ dependent) 2,methenyltetrahydrofolate cyclohydrolase1−1.62980.0124
2923PDIA3protein disulfide isomerase family A, member 31−1.33320.0162
586BCAT1branched chain amino-acid transaminase 1, cytosolic3−2.02360.0296
7184HSP90B1heat shock protein 90kDa beta (Grp94), member 11−2.35490.0305
55356SLC22A15solute carrier family 22, member 151−1.90070.0412
23786BCL2L13BCL2-like 13 (apoptosis facilitator)1−1.26220.0604
29967LRP12low density lipoprotein receptor-related protein 121−1.02580.0897
112752IFT43intraflagellar transport 431−1.45950.0922
23516SLC39A14solute carrier family 39 (zinc transporter), member 141−1.64350.1124
55255WDR41WD repeat domain 411−1.24100.1145
56886UGGT1UDP-glucose glycoprotein glucosyltransferase 11−1.02320.1228
6137RPL13ribosomal protein L131−1.64270.1408
114971PTPMT1protein tyrosine phosphatase, mitochondrial 11−1.20940.1545
27ABL2ABL proto-oncogene 2, non-receptor tyrosine kinase1−1.89560.1549
114818KLHL29kelch-like family member 291−1.47010.1551
2512FTLferritin, light polypeptide1−1.27220.1809
84803AGPAT9 (GPAT3)1-acylglycerol-3-phosphate O-acyltransferase 91−1.89710.2008
23271CAMSAP2calmodulin regulated spectrin-associated protein family, member 21−1.07350.3277
122953JDP2Jun dimerization protein 21−2.25940.3311
219902TMEM136transmembrane protein 1361−1.49560.3455
440026TMEM41Btransmembrane protein 41B1−2.30210.3843
54629FAM63Bfamily with sequence similarity 63, member B1−1.29720.3940
182JAG1jagged 11−1.00820.3971
2121EVCEllis van Creveld syndrome1−1.72330.4006
490ATP2B1ATPase, Ca++ transporting, plasma membrane 11−2.04360.5557
9208LRRFIP1leucine rich repeat (in FLII) interacting protein 11−1.18820.6483
50848F11RF11 receptor1−1.02830.7312
79152FA2Hfatty acid 2-hydroxylase1−1.74580.0877
23049SMG1SMG1 phosphatidylinositol 3-kinase-related kinase1−1.14260.1267
5337PLD1phospholipase D1, phosphatidylcholine-specific1−1.09680.1538
5935RBM3RNA binding motif (RNP1, RRM) protein 31−1.37550.1554
135398C6orf141chromosome 6 open reading frame 1411−1.40220.1594
5251PHEXphosphate regulating endopeptidase homolog, X-linked1−1.08450.1616
201229LYRM9LYR motif containing 91−1.83180.1709
6095RORARAR-related orphan receptor A1−1.66880.1809
85439STON2stonin 22−1.03350.2107
114781BTBD9BTB (POZ) domain containing 91−1.40220.2145
144348ZNF664zinc finger protein 6641−1.12210.2262
27125AFF4AF4/FMR2 family, member 41−1.36480.2620
152007GLIPR2GLI pathogenesis-related 21−1.83770.2882
688KLF5Kruppel-like factor 5 (intestinal)1−1.04610.3321
27250PDCD4programmed cell death 4 (neoplastic transformation inhibitor)1−1.32980.3380
440295GOLGA6L9golgin A6 family-like 92−1.55530.3385
55175KLHL11kelch-like family member 111−1.12300.3808
85015USP45ubiquitin specific peptidase 451−1.00260.3813
27109ATP5SATP synthase, H+ transporting, mitochondrial Fo complex, subunit s (factor B)1−1.04410.3939
10802SEC24ASEC24 family member A1−1.14340.4081
2639GCDHglutaryl-CoA dehydrogenase1−1.29040.4110
843CASP10caspase 10, apoptosis-related cysteine peptidase1−1.16770.4282
8774NAPGN-ethylmaleimide-sensitive factor attachment protein, gamma1−1.18500.4452
54462CCSER2coiled-coil serine-rich protein 21−1.38400.4566
9848MFAP3Lmicrofibrillar-associated protein 3-like1−1.11140.4710
64764CREB3L2cAMP responsive element binding protein 3-like 21−2.29620.4754
334APLP2amyloid beta (A4) precursor-like protein 21−1.37190.5068
5163PDK1pyruvate dehydrogenase kinase, isozyme 11−1.18520.5112
10124ARL4AADP-ribosylation factor-like 4A1−1.40880.5161
145781GCOM1GRINL1A complex locus 11−1.03880.5289
3987LIMS1LIM and senescent cell antigen-like domains 11−1.03460.5454
57498KIDINS220kinase D-interacting substrate, 220kDa1−1.43040.5664
285636C5orf51chromosome 5 open reading frame 511−1.06310.5666
9761MLECmalectin1−1.62010.5725
54477PLEKHA5pleckstrin homology domain containing, family A member 51−1.31450.5846
10221TRIB1tribbles pseudokinase 11−1.72240.5958
54014BRWD1bromodomain and WD repeat domain containing 11−1.06940.6033
390RND3Rho family GTPase 31−1.06810.6139
55823VPS11vacuolar protein sorting 11 homolog (S. cerevisiae)1−1.05690.6269
8444DYRK3dual-specificity tyrosine-(Y)-phosphorylation regulated kinase 31−1.92270.6459
1978EIF4EBP1eukaryotic translation initiation factor 4E binding protein 11−1.28320.6529
8874ARHGEF7Rho guanine nucleotide exchange factor (GEF) 71−1.20690.6717
309ANXA6annexin A61−1.91680.6821
5784PTPN14protein tyrosine phosphatase, non-receptor type 142−1.21440.6888
100534599ISY1-RAB43ISY1-RAB43 readthrough1−2.45560.6928
54431DNAJC10DnaJ (Hsp40) homolog, subfamily C, member 102−1.65060.7051
63874ABHD4abhydrolase domain containing 41−1.68500.7071
196AHRaryl hydrocarbon receptor1−1.12880.7219
63897HEATR6HEAT repeat containing 61−1.07110.7291
10961ERP29endoplasmic reticulum protein 291−1.05780.7355
126626GABPB2GA binding protein transcription factor, beta subunit 22−1.11510.7488
79794C12orf49chromosome 12 open reading frame 491−1.75220.7864
5965RECQLRecQ helicase-like3−1.22030.7885
64651CSRNP1cysteine-serine-rich nuclear protein 11−2.10790.8036
81558FAM117Afamily with sequence similarity 117, member A1−2.04580.8054
7706TRIM25tripartite motif containing 252−1.25220.8360
55339WDR33WD repeat domain 331−1.59400.8369
10097ACTR2ARP2 actin-related protein 2 homolog (yeast)1−1.05370.8586
23348DOCK9dedicator of cytokinesis 91−1.28870.8621
10079ATP9AATPase, class II, type 9A1−2.21170.8625
9497SLC4A7solute carrier family 4, sodium bicarbonate cotransporter, member 71−1.17020.9121
54832VPS13Cvacuolar protein sorting 13 homolog C (S. cerevisiae)2−1.10510.9176
23433RHOQras homolog family member Q1−1.64360.9319
55727BTBD7BTB (POZ) domain containing 71−1.29740.9480
11260XPOTexportin, tRNA1−1.43980.9544
1362CPDcarboxypeptidase D2−1.30360.9645
151887CCDC80coiled-coil domain containing 802−2.19210.9667
116496FAM129Afamily with sequence similarity 129, member A1−1.80990.9903
9709HERPUD1homocysteine-inducible, endoplasmic reticulum stress-inducible, ubiquitin-like domain member 11−3.37370.0854*
284723SLC25A34solute carrier family 25, member 341−1.50510.0757*
83641FAM107Bfamily with sequence similarity 107, member B1−2.21730.0749*
60412EXOC4exocyst complex component 41−1.09570.0691*
6700SPRR2Asmall proline-rich protein 2A1−2.19950.0568*
10365KLF2Kruppel-like factor 21−1.33780.0386*
3572IL6STinterleukin 6 signal transducer1−1.37860.0330*
10551AGR2anterior gradient 21−3.73650.0134*
9663LPIN2lipin 21−2.63320.0033*
155435RBM33RNA binding motif protein 331−1.30820.0029*
54855FAM46Cfamily with sequence similarity 46, member C2−1.01180.0028*
728661SLC35E2Bsolute carrier family 35, member E2B1−1.08110.0004*
23591FAM215Afamily with sequence similarity 215, member A (non-protein coding)1−1.4327N/A
643707GOLGA6L4golgin A6 family-like 42−1.3773N/A
* poor prognosis in patients with low gene expression.
Table 3. Clinical features of 9 HNSCC cases used for immunohistochemical staining.
AgeSexLocationTNMStageDifferentiation
A80Mlarynx32c0IVamoderate
B73Mlarynx300IIIpoor
C77Moral22b0Ivamoderate
D42Foral4a00IVapoor
E51Moral200IIwell
F52Foral4a2c1Ivcwell
G72Mhypopharynx200IImoderate
H64Mhypopharynx22b0IVawell
I70Mhypopharynx22b0Ivawell

