Targeting the Interaction between the SH3 Domain of Grb2 and Gab2

 , , , , , , and
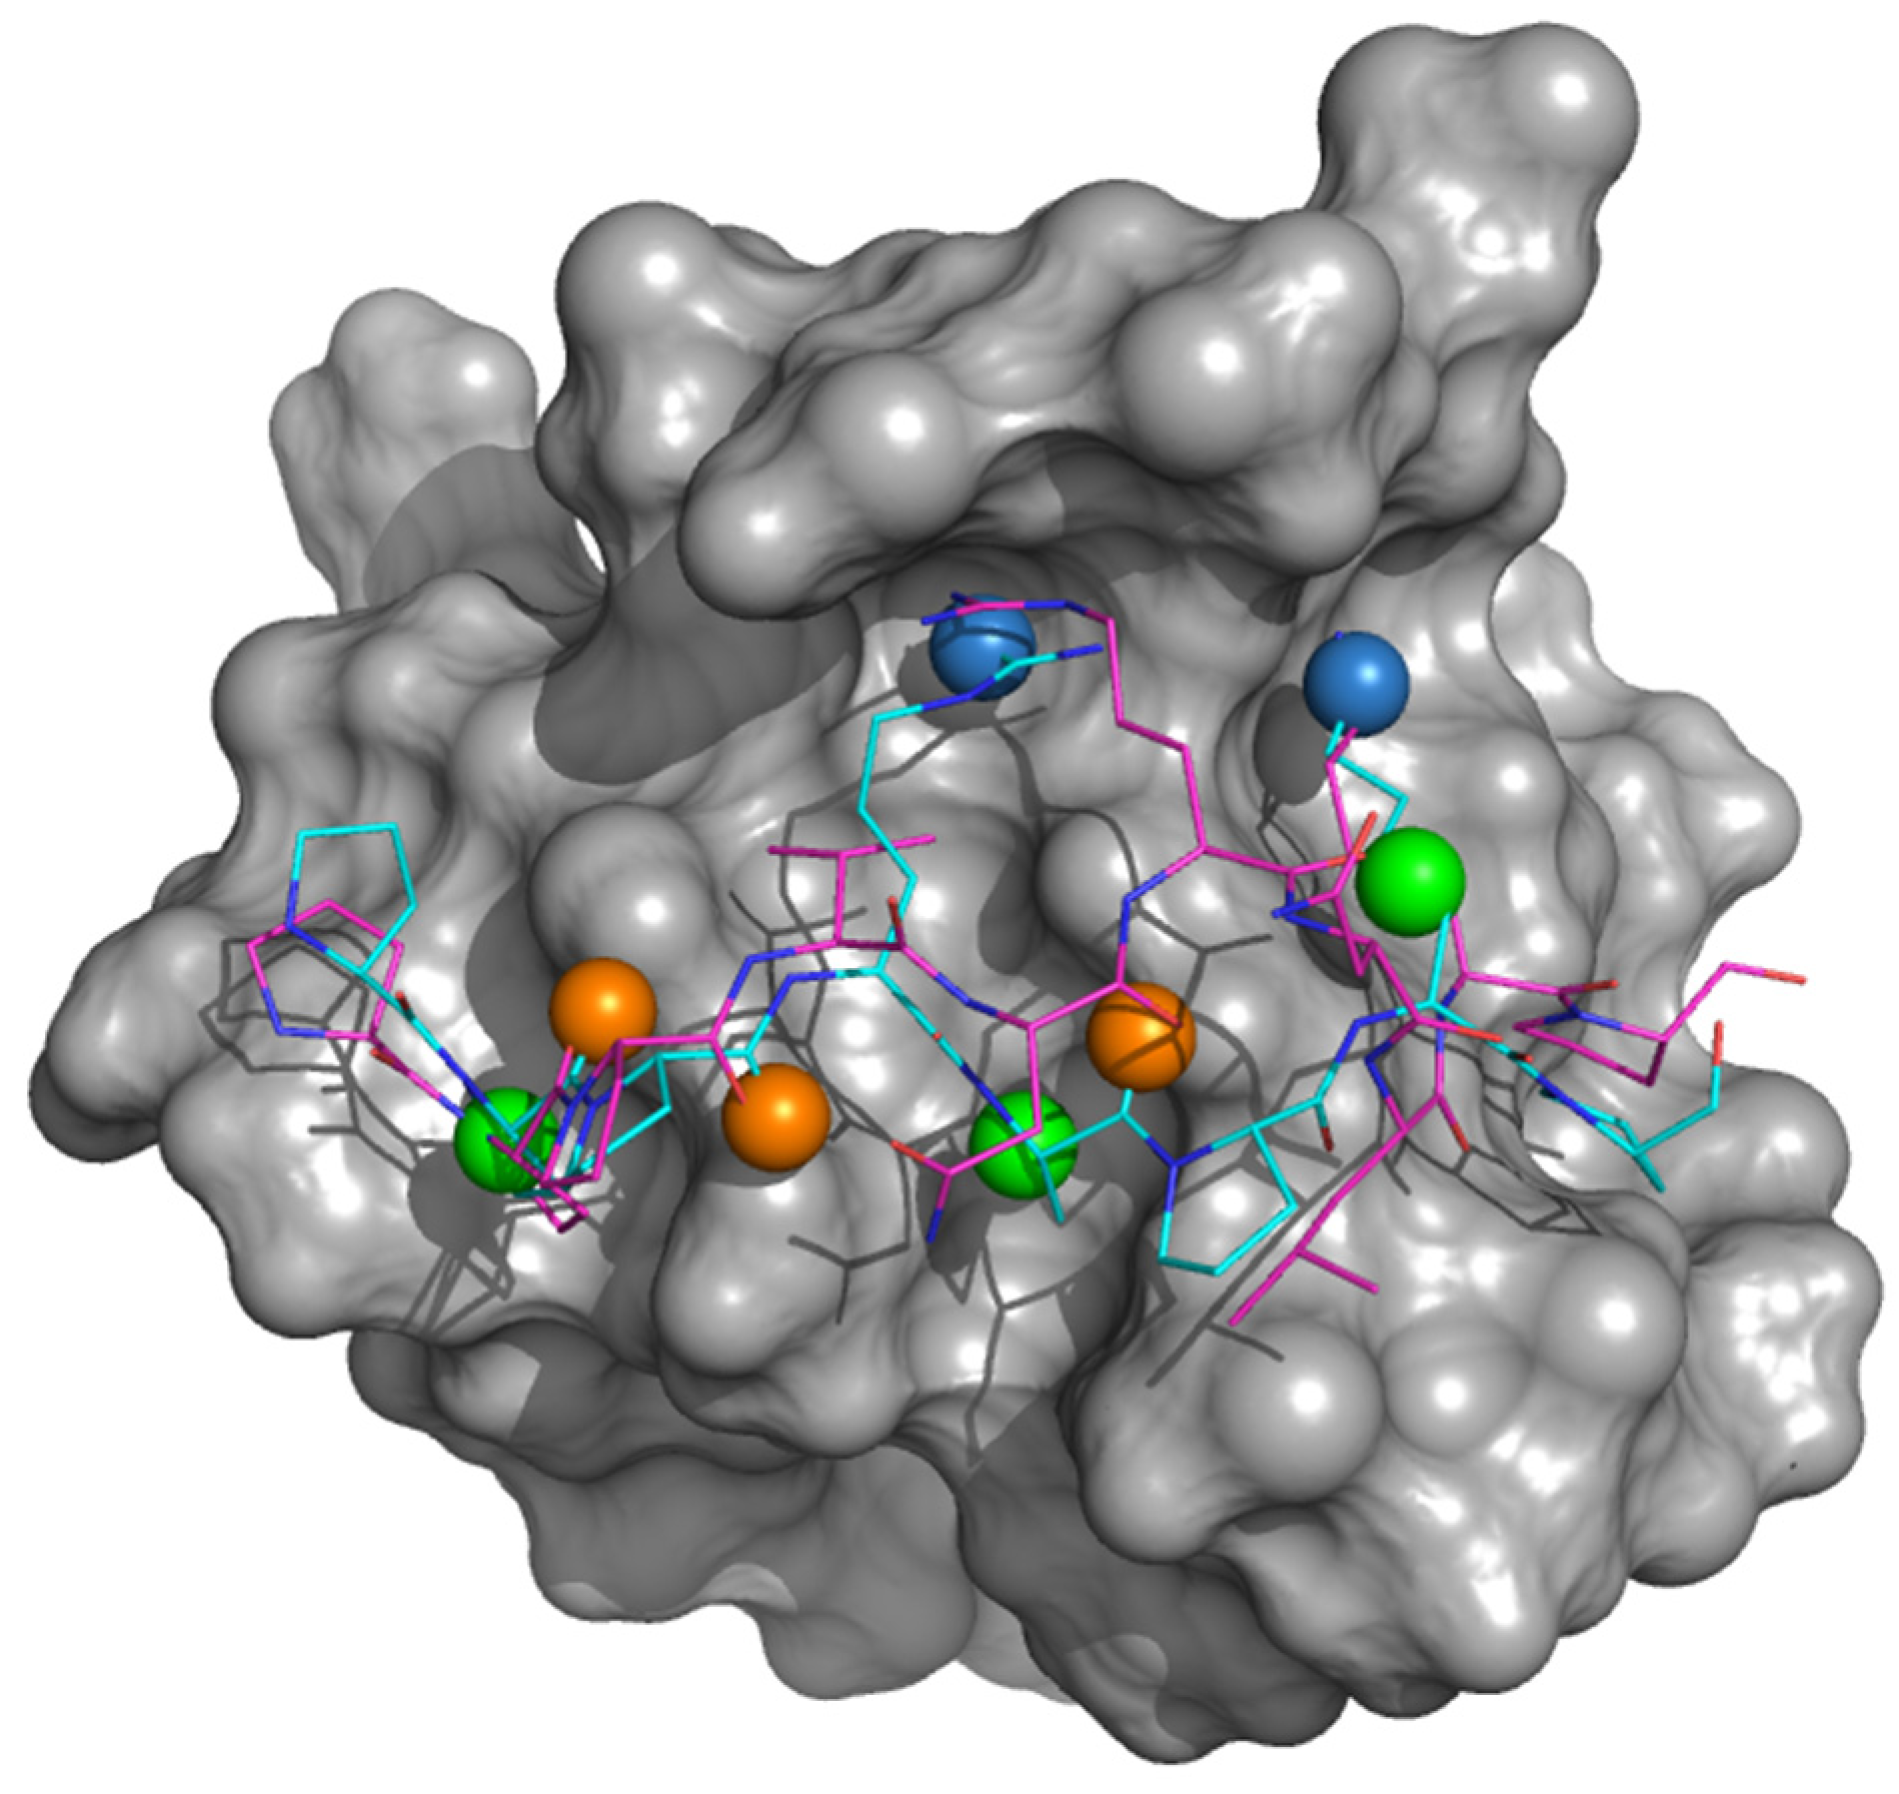
Abstract
:1. Introduction
2. Materials and Methods
2.1. Chemistry
2.2. Chemical Synthesis of N-(4-((3-Chlorobenzyl)oxy)-3-ethoxybenzyl)-2-(4-methoxyphenyl)ethan-1-amine (AN-465-J137-985)
2.3. Molecular Modeling Studies
2.4. Expression and Purification of C-SH3 Grb2
2.5. Kinetic Binding Experiments
2.6. Equilibrium Binding Experiments
2.7. Cell Lines
2.8. Trypan Blue Exclusion Assay
2.9. Propidium Iodide (PI) Staining
2.10. Annexin-V-FITC Staining
2.11. RNA Extraction and Real-Time qRT-PCR Analyses
2.12. Statistical Analysis
3. Results and Discussion
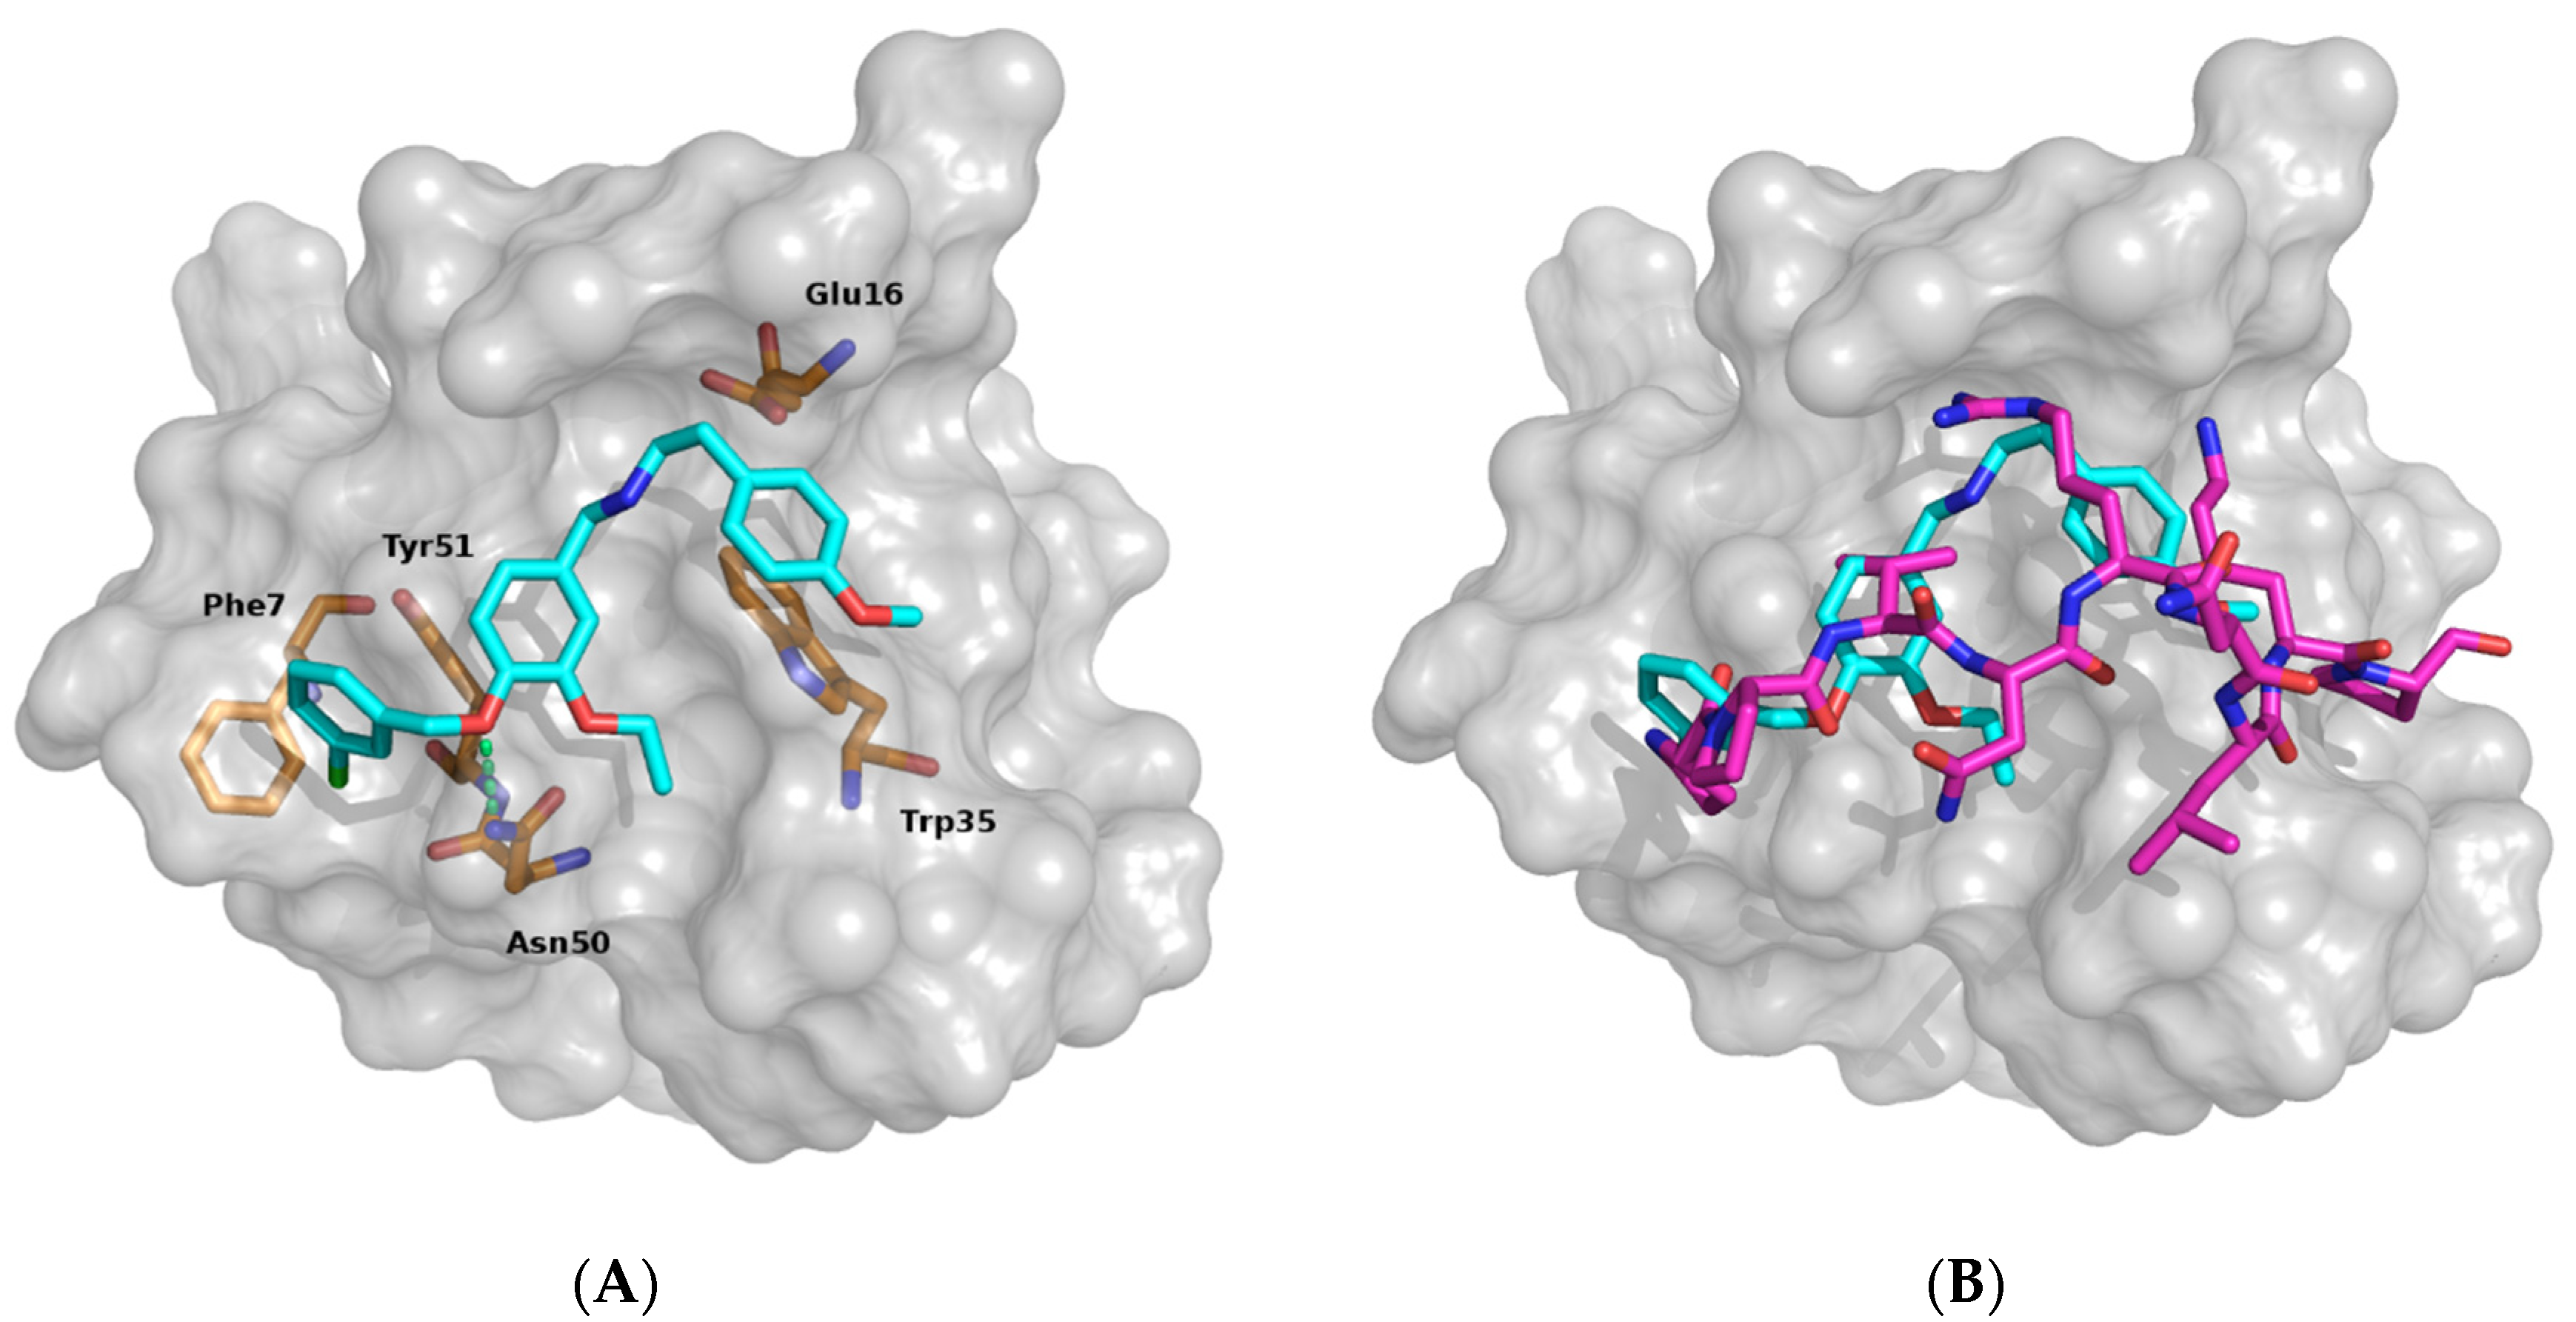
3.1. Identifying Binding Inhibitors by Virtual SCREENING
3.2. Testing the Inhibitor Compounds In Vitro
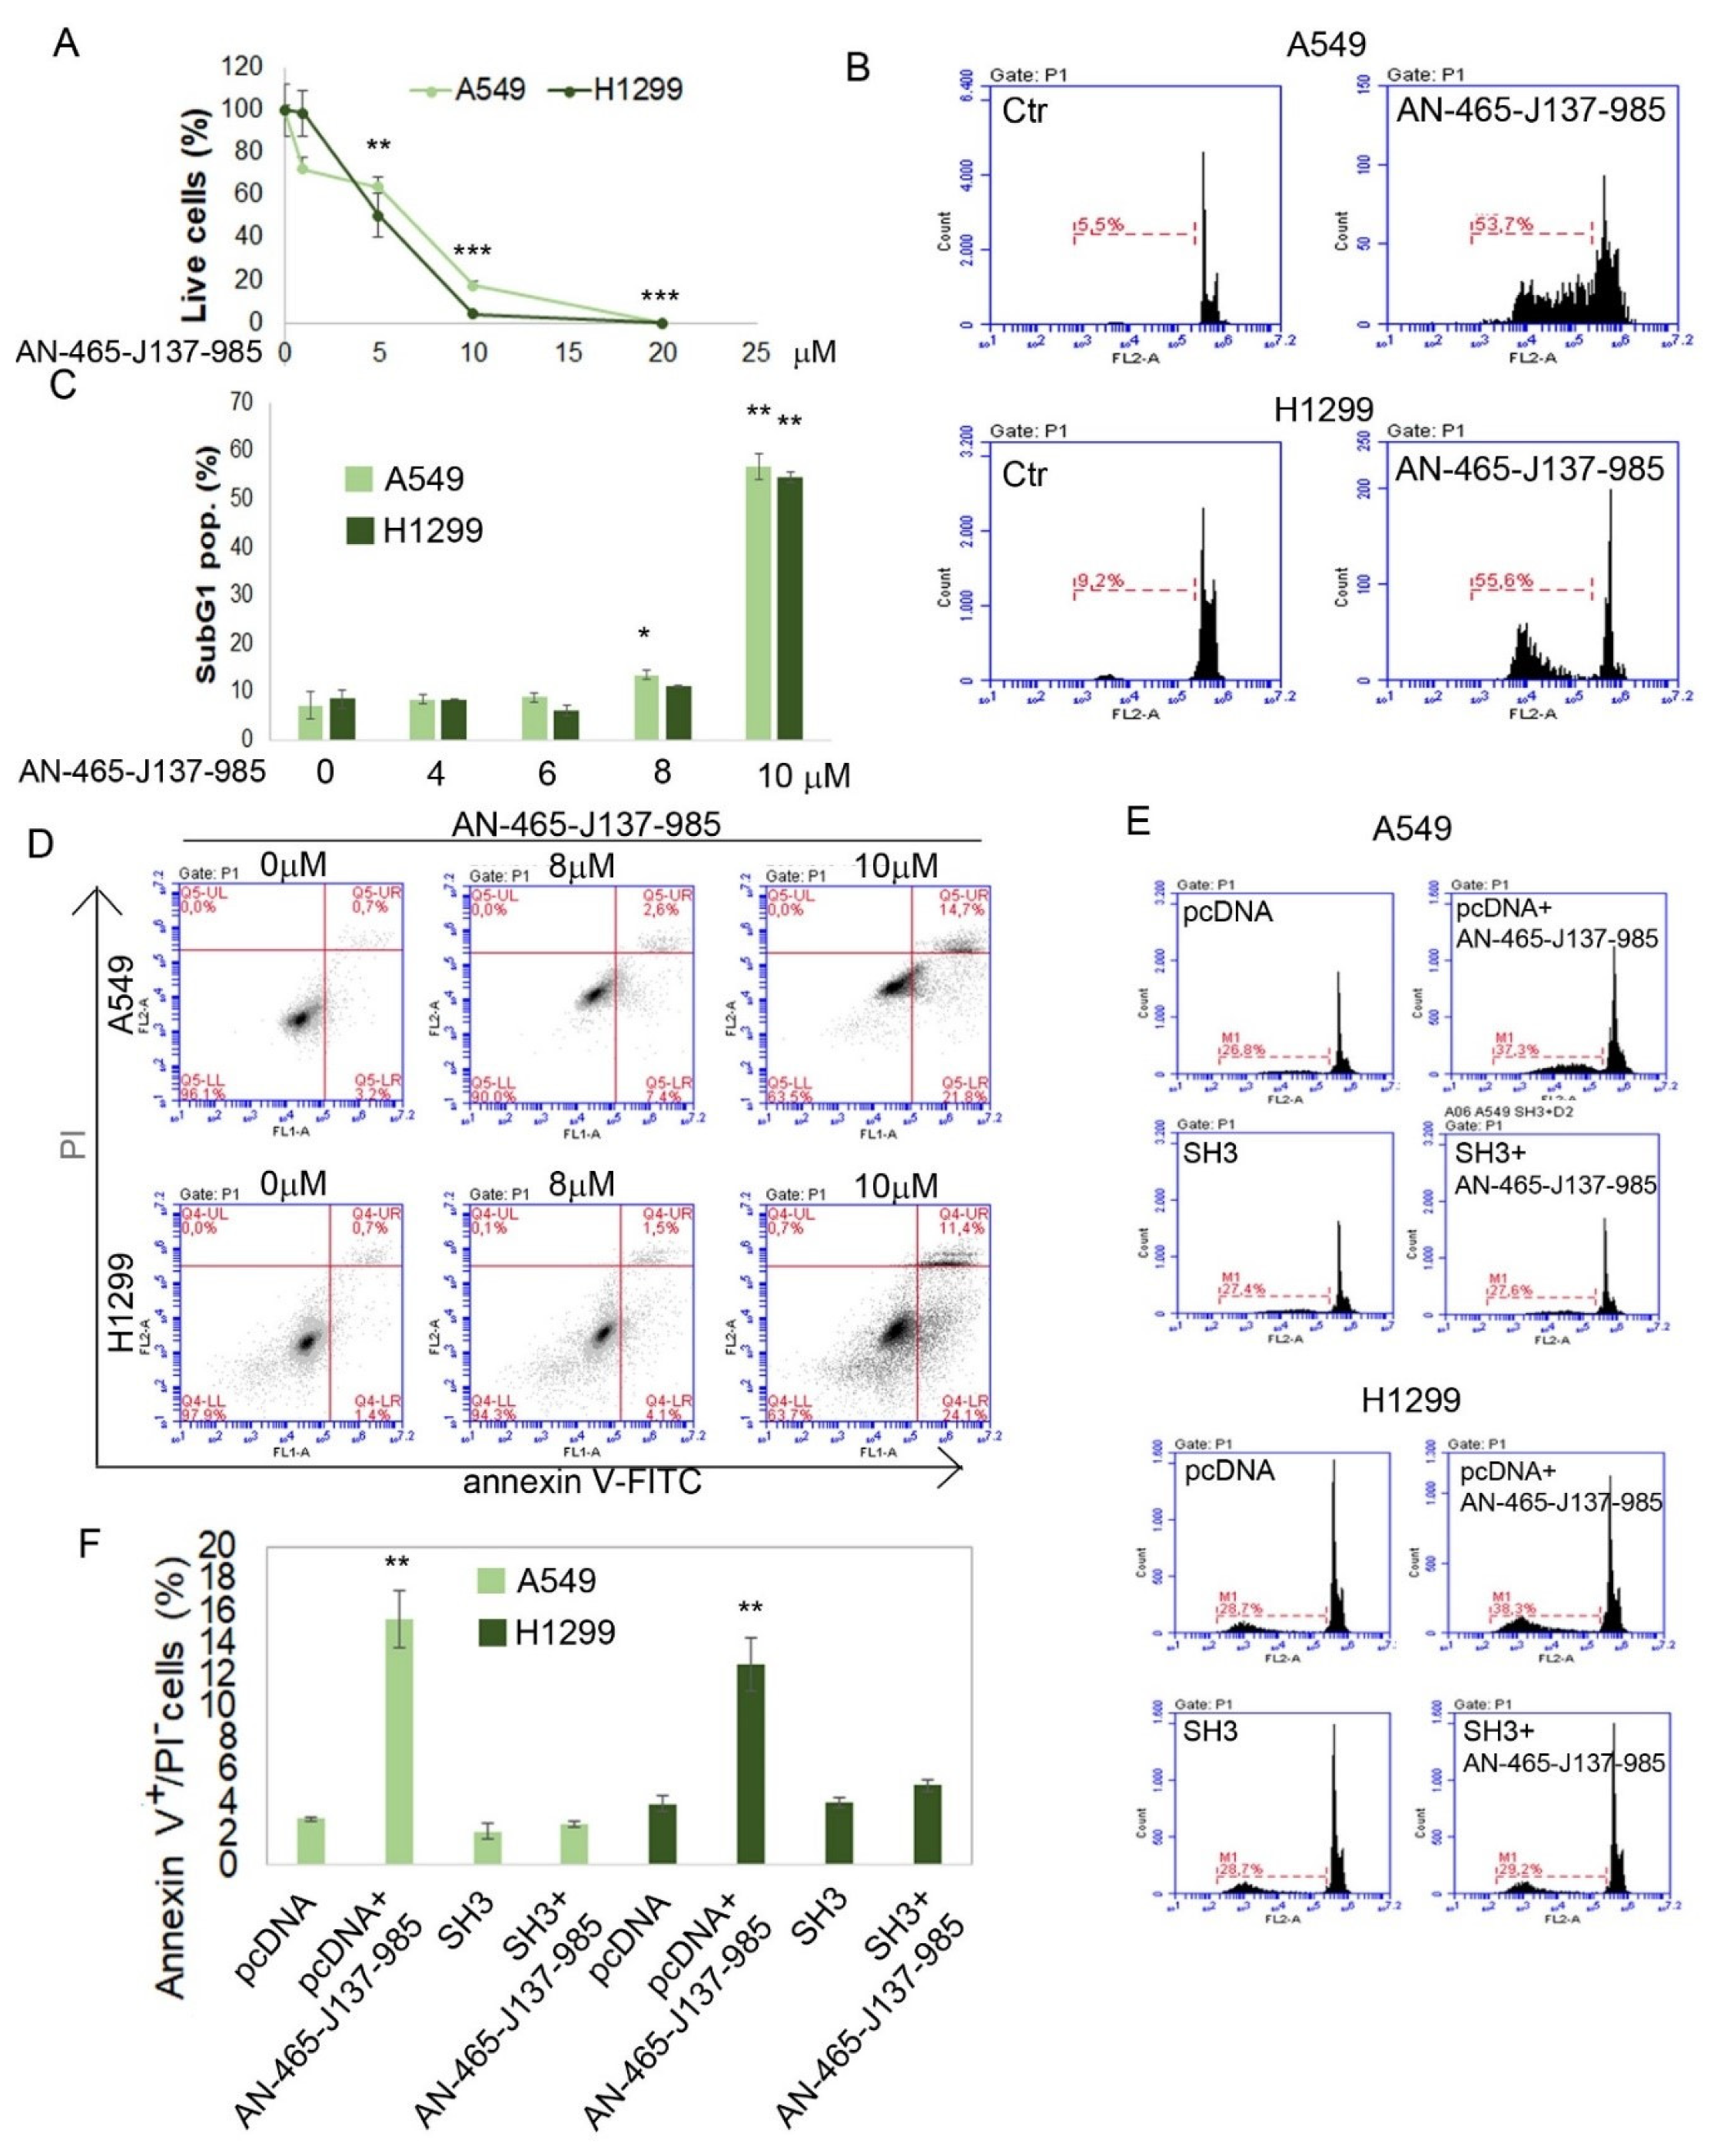
3.3. Validating the Effect of AN-465-J137-985 in Cellula
4. Conclusions
Supplementary Materials
Author Contributions
Funding
Conflicts of Interest
References
- Simister, P.C.; Feller, S.M. Order and disorder in large multi-site docking proteins of the Gab family—Implications for signalling complex formation and inhibitor design strategies. Mol. BioSyst. 2012, 8, 33–46. [Google Scholar] [CrossRef] [PubMed]
- Zhao, C.; Yu, D.H.; Shen, R.; Feng, G.S. Gab2, a new pleckstrin homology domain-containing adapter protein, acts to uncouple signaling from ERK kinase to Elk-1. J. Biol. Chem. 1999, 274, 19649–19654. [Google Scholar] [CrossRef] [PubMed] [Green Version]
- Nishida, K.; Wang, L.; Morii, E.; Park, S.J.; Narimatsu, M.; Itoh, S.; Yamasaki, S.; Fujishima, M.; Ishihara, K.; Hibi, M.; et al. Requirement of Gab2 for mast cell development and KitL/c-Kit signaling. Blood 2002, 99, 1866–1869. [Google Scholar] [CrossRef] [PubMed]
- Adams, S.J.; Aydin, I.T.; Celebi, J.T. GAB2—a scaffolding protein in cancer. Mol. Cancer Res. MCR 2012, 10, 1265–1270. [Google Scholar] [CrossRef] [Green Version]
- Bentires-Alj, M.; Gil, S.G.; Chan, R.; Wang, Z.C.; Wang, Y.; Imanaka, N.; Harris, L.N.; Richardson, A.; Neel, B.G.; Gu, H. A role for the scaffolding adapter GAB2 in breast cancer. Nat. Med. 2006, 12, 114–121. [Google Scholar] [CrossRef]
- Lee, S.H.; Jeong, E.G.; Nam, S.W.; Lee, J.Y.; Yoo, N.J.; Lee, S.H. Increased expression of Gab2, a scaffolding adaptor of the tyrosine kinase signalling, in gastric carcinomas. Pathology 2007, 39, 326–329. [Google Scholar] [CrossRef]
- Xu, X.-L.; Wang, X.; Chen, Z.-L.; Jin, M.; Yang, W.; Zhao, G.-F.; Li, J.-W. Overexpression of Grb2-associated binder 2 in human lung cancer. Int. J. Biol. Sci. 2011, 7, 496–504. [Google Scholar] [CrossRef]
- Mohi, M.G.; Williams, I.R.; Dearolf, C.R.; Chan, G.; Kutok, J.L.; Cohen, S.; Morgan, K.; Boulton, C.; Shigematsu, H.; Keilhack, H.; et al. Prognostic, therapeutic, and mechanistic implications of a mouse model of leukemia evoked by Shp2 (PTPN11) mutations. Cancer Cell 2005, 7, 179–191. [Google Scholar] [CrossRef] [Green Version]
- Gu, S.; Chan, W.W.; Mohi, G.; Rosenbaum, J.; Sayad, A.; Lu, Z.; Virtanen, C.; Li, S.; Neel, B.G.; Van Etten, R.A. Distinct GAB2 signaling pathways are essential for myeloid and lymphoid transformation and leukemogenesis by BCR-ABL1. Blood 2016, 127, 1803–1813. [Google Scholar] [CrossRef] [Green Version]
- Zatkova, A.; Schoch, C.; Speleman, F.; Poppe, B.; Mannhalter, C.; Fonatsch, C.; Wimmer, K. GAB2 is a novel target of 11q amplification in AML/MDS. Genes. Chromosomes Cancer 2006, 45, 798–807. [Google Scholar] [CrossRef]
- Wöhrle, F.U.; Daly, R.J.; Brummer, T. Function, regulation and pathological roles of the Gab/DOS docking proteins. Cell Commun. Signal. CCS 2009, 7, 22. [Google Scholar] [CrossRef] [PubMed] [Green Version]
- Chu, S.; Li, L.; Singh, H.; Bhatia, R. BCR-Tyrosine 177 Plays an Essential Role in Ras and Akt Activation and in Human Hematopoietic Progenitor Transformation in Chronic Myelogenous Leukemia. Cancer Res. 2007, 67, 7045–7053. [Google Scholar] [CrossRef] [PubMed] [Green Version]
- Giubellino, A.; Burke, T.R.; Bottaro, D.P. Grb2 signaling in cell motility and cancer. Expert Opin. Ther. Targets 2008, 12, 1021–1033. [Google Scholar] [CrossRef] [PubMed] [Green Version]
- Sattler, M.; Mohi, M.G.; Pride, Y.B.; Quinnan, L.R.; Malouf, N.A.; Podar, K.; Gesbert, F.; Iwasaki, H.; Li, S.; Van Etten, R.A.; et al. Critical role for Gab2 in transformation by BCR/ABL. Cancer Cell 2002, 1, 479–492. [Google Scholar] [CrossRef] [Green Version]
- Solomaha, E.; Szeto, F.L.; Yousef, M.A.; Palfrey, H.C. Kinetics of Src homology 3 domain association with the proline-rich domain of dynamins: Specificity, occlusion, and the effects of phosphorylation. J. Biol. Chem. 2005, 280, 23147–23156. [Google Scholar] [CrossRef] [Green Version]
- Harkiolaki, M.; Tsirka, T.; Lewitzky, M.; Simister, P.C.; Joshi, D.; Bird, L.E.; Jones, E.Y.; O’Reilly, N.; Feller, S.M. Distinct binding modes of two epitopes in Gab2 that interact with the SH3C domain of Grb2. Struct. Lond. Engl. 1993 2009, 17, 809–822. [Google Scholar] [CrossRef]
- Sastry, G.M.; Adzhigirey, M.; Day, T.; Annabhimoju, R.; Sherman, W.J. Protein and ligand preparation: Parameters, protocols, and influence on virtual screening enrichments. Comput. Aid. Mol. Des. 2013, 27, 221–234. [Google Scholar] [CrossRef]
- Korb, O.; Stützle, T.; Exner, T.E. Empirical scoring functions for advanced protein-ligand docking with PLANTS. J. Chem. Inf. Model. 2009, 49, 84–96. [Google Scholar] [CrossRef] [PubMed]
- Dixon, S.L.; Smondyrev, A.M.; Rao, S.N. PHASE: a novel approach to pharmacophore modeling and 3D database searching. Chem. Biol. Drug Des. 2006, 67, 370–372. [Google Scholar] [CrossRef] [PubMed]
- Lipinski, C.A.; Lombardo, F.; Dominy, B.W.; Feeney, P.J. Experimental and computational approaches to estimate solubility and permeability in drug discovery and development settings. Adv. Drug Deliv. Rev. 2001, 46, 3–26. [Google Scholar] [CrossRef]
- PyMOL Version1.2r1; DeLanoScientificLLC: SanCarlos, CA, USA, 2009; Available online: http://www.pymol.org/ (accessed on 6 November 2020).
- Toto, A.; Bonetti, D.; De Simone, A.; Gianni, S. Understanding the mechanism of binding between Gab2 and the C terminal SH3 domain from Grb2. Oncotarget 2017, 8, 82344–82351. [Google Scholar] [CrossRef] [Green Version]
- Malagrinò, F.; Troilo, F.; Bonetti, D.; Toto, A.; Gianni, S. Mapping the allosteric network within a SH3 domain. Sci. Rep. 2019, 9, 8279. [Google Scholar] [CrossRef]
- Antonini, E.; Brunori, M. Hemoglobin and Myoglobin in Their Reactions with Ligands; North-Holland: Amsterdam, The Netherlands, 1971. [Google Scholar]
- Simister, P.C.; Luccarelli, J.; Thompson, S.; Appella, D.H.; Feller, S.M.; Hamilton, A.D. Novel inhibitors of a Grb2 SH3C domain interaction identified by a virtual screen. Bioorg. Med. Chem. 2013, 21, 4027–4033. [Google Scholar] [CrossRef] [PubMed] [Green Version]


Publisher’s Note: MDPI stays neutral with regard to jurisdictional claims in published maps and institutional affiliations. |
© 2020 by the authors. Licensee MDPI, Basel, Switzerland. This article is an open access article distributed under the terms and conditions of the Creative Commons Attribution (CC BY) license (http://creativecommons.org/licenses/by/4.0/).
Share and Cite
Malagrinò, F.; Coluccia, A.; Bufano, M.; Regina, G.L.; Puxeddu, M.; Toto, A.; Visconti, L.; Paone, A.; Magnifico, M.C.; Troilo, F.; et al. Targeting the Interaction between the SH3 Domain of Grb2 and Gab2. Cells 2020, 9, 2435. https://0-doi-org.brum.beds.ac.uk/10.3390/cells9112435
Malagrinò F, Coluccia A, Bufano M, Regina GL, Puxeddu M, Toto A, Visconti L, Paone A, Magnifico MC, Troilo F, et al. Targeting the Interaction between the SH3 Domain of Grb2 and Gab2. Cells. 2020; 9(11):2435. https://0-doi-org.brum.beds.ac.uk/10.3390/cells9112435
Chicago/Turabian StyleMalagrinò, Francesca, Antonio Coluccia, Marianna Bufano, Giuseppe La Regina, Michela Puxeddu, Angelo Toto, Lorenzo Visconti, Alessio Paone, Maria Chiara Magnifico, Francesca Troilo, and et al. 2020. "Targeting the Interaction between the SH3 Domain of Grb2 and Gab2" Cells 9, no. 11: 2435. https://0-doi-org.brum.beds.ac.uk/10.3390/cells9112435