Transcriptional Structure of Petunia Clock in Leaves and Petals


Genética Molecular, Instituto de Biotecnología Vegetal, Edificio I+D+I, Plaza del Hospital s/n, Universidad Politécnica de Cartagena, 30202 Cartagena, Spain
*
Author to whom correspondence should be addressed.
Genes 2019, 10(11), 860; https://0-doi-org.brum.beds.ac.uk/10.3390/genes10110860
Submission received: 23 September 2019
/
Revised: 25 October 2019
/
Accepted: 28 October 2019
/
Published: 30 October 2019
(This article belongs to the Special Issue Genetic Mechanisms Underpinning Floral Architecture)
Abstract
:The plant circadian clock coordinates environmental signals with internal processes including secondary metabolism, growth, flowering, and volatile emission. Plant tissues are specialized in different functions, and petals conceal the sexual organs while attracting pollinators. Here we analyzed the transcriptional structure of the petunia (Petunia x hybrida) circadian clock in leaves and petals. We recorded the expression of 13 clock genes in petunia under light:dark (LD) and constant darkness (DD). Under light:dark conditions, clock genes reached maximum expression during the light phase in leaves and the dark period in petals. Under free running conditions of constant darkness, maximum expression was delayed, especially in petals. Interestingly, the rhythmic expression pattern of PhLHY persisted in leaves and petals in LD and DD. Gene expression variability differed among leaves and petals, time of day and photoperiod. The transcriptional noise was higher especially in leaves under constant darkness. We found that PhPRR7, PhPRR5, and PhGI paralogs showed changes in gene structure including exon number and deletions of CCT domain of the PRR family. Our results revealed that petunia petals presented a specialized clock.
1. Introduction
Organisms, from bacteria to human beings, are subjected to periodic oscillations in the environment due the planet rotation around its axis. Circadian clocks are a complex set of genes allowing organisms to anticipate and adapt to daily environmental variations. In plants, the circadian clock is a network of interlocked loops comprising transcriptional, translational, and posttranslational coordination [1]. Circadian processes have been studied in plants for a long period of time (see McClung for a historical overview [2]). Most molecular studies have been done in Arabidopsis thaliana. The Arabidopsis core clock is formed by several genes. Two MYB transcription factors CIRCADIAN CLOCK ASSOCIATED 1 (CCA1), LATE ELONGATED HYPOCOTYL (LHY), and the pseudo response regulator TIMING OF CAB EXPRESSION (TOC1) form the so-called core clock. Later studies found other clock components including the PSEUDO-RESPONSE REGULATOR gene family (PRR), out of which PRR3, PRR5, PRR7, and PRR9 are clock genes, and the Evening Complex (EC), which is formed by the EARLY FLOWERING 3 (ELF3), EARLY FLOWERING 4 (ELF4), and LUX ARRHYTMO (LUX) proteins. In addition, other genes playing a key role and considered part of the clock include the protein with blue light reception capacity ZEITLUPE (ZTL) and the single copy gene GIGANTEA (GI). The various models developed are based on mutually repressing genes and a set of activating genes coded by the REVEILLE MYB transcription factors [3]. Every new discovery has added a level of complexity and new interpretation of the circadian clock model [4].
Two aspects emerge from comparative genomics with lower organisms and within higher plants. First the core clock components identified in the picoeukaryote Ostreococcus comprise a MYB gene homolog to LHY and a PRR gene similar to TOC1 [5]. There is an additional blue-light receptor component with histidine kinase activity and circadian clock effects [6]. Therefore, basic clocks may be found with two or maybe three components that function via transcriptional control. A second aspect is that the fine tuning of the different clock modules is based to a large extent on protein–protein interactions. As protein complexes require certain stoichiometries to maintain their function they are target of genetic constraints in terms of gene dosages and are especially sensitive to gene duplications. Duplicated genes follow four paths including gene loss, maintenance of redundancy, subfunctionalization, or neofunctionalization [7]. Plant genomes have been subject to genome duplications and in some cases, followed by non-random elimination of duplicated genes [8,9]. In Brassica, polyploidization events have involved subsequent gene loss but with a preferential retention of circadian clock genes as compared to house-keeping genes, supporting a gene dosage sensitivity model [10].
The genomes of the garden petunia and its ancestors Petunia axillaris and P. integrifolia have been recently sequenced [11]. Petunia forms an early branching in the Solanaceae clade departing from Solanum lycopersicon, S. tuberosum, Nicotiana spp. and Capsicum spp. that have a chromosome number of n = 12. Petunia has n = 7 and this, together with a high activity of transposition, may have shaped a somewhat different genome evolution. Petunia shares a paleohexaplodization specific to the Solanaceae. A comprehensive analysis of the circadian clock genes found in the Petunia genomes shows that there is a set of genes that has remained as single copy. These include the petunia orthologs for PRR9, PRR3, TOC1, and LHY. In contrast, other genes are present in two to four copies, PRR7, PRR5, GI, ELF3, or ELF4 [11]. Altogether these data indicate a possible departure of the circadian clock network from the one known in Arabidopsis, and suggests the evolution of the clock at different levels including gene structure, expression pattern, and genetic functions.
The bulk of work on plant circadian rhythms has been done in Arabidopsis using leaf tissue and seedlings. Like in animals, there is important evidence that the circadian clock expression network differs between different organs. The current view is that the shoot apical meristem may work as a center of coordination [12], and leaves and roots differ in the regulatory network, as a result of differences in light inputs [13,14].
Petal development starts with the activation of the so-called B function genes in both gymnosperms and angiosperms [15]. The initial transcriptional activation is followed at early stages by an autoregulatory positive regulation of the MADS-box genes controlling petal morphogenesis in Antirrhinum, Arabidopsis, and petunia [16,17,18,19,20,21]. Once organ identity is established and right after anthesis, there is a transcriptional reprogramming [22]. Furthermore, in sympetalous flowers with petals forming a tube and a limb, both parts of the flower appear to have different functions and transcriptional control [23,24]. The petal function after anthesis includes concealing the sexual organs and attracting pollinators. The lifespan of a flower is relatively short with most flowers surviving two to five days after anthesis. After anthesis, metabolism and scent emission changes rapidly [25,26]. Flowers enter rapid senescence upon pollination as a result of ethylene release [27,28,29].
Floral scent release depends on petal development in a quantitative way [22], and is circadian regulated in monocots and dicots such as Antirrhinum, Narcissus, rose, or garden petunia [30,31,32,33,34]. Most flowers analyzed emit scent preferentially during the day or during the night. The LHY and ZTL orthologs control scent emission in Petunia, Nicotiana attenuata, and Antirrhinum majus [35,36,37,38]. The Solanaceae Petunia and Nicotiana emit higher quantities during the night, indicating an identity and circadian component controlling this trait [34,39].
In the current work, we have addressed the structure of the petunia circadian clock from three different perspectives: gene structure, transcript abundance, and gene expression variability. The gene structure diverges as PRR paralogs have different intron numbers and PhGI1 and PhGI2 vary in the coding region. The transcriptional structure showed maximum expression during the day in leaves and during the dark in petals. This maximum tended to delay in both tissues under constant darkness conditions. We further identified opposite levels of transcriptional noise at dawn in leaves and dusk in petals. Our results reflect the evolution of the plant circadian clock at the structural and expression level and suggests an organ specific transcriptional structure of the plant circadian clock.
2. Materials and Methods
2.1. Plant Materials and Experiment Design
We used the Petunia hybrida W115 or Mitchell for all the analyses. Plants were grown under greenhouse conditions until further use. Experiments under controlled conditions in growth chambers were performed as described [40], with the following modifications. For the control experiments, plants were adapted to light:dark growth chamber conditions for at least 1 week. Day:night (LD) conditions were matched with thermoperiods of 23 °C:18 °C during the light and dark periods. Zeitgeber time (ZT) was defined as ZT0 for light on and ZT12 for light off. Plants were transferred from LD cycle to a continuous dark cycle (DD) with the same temperature regimes.
Flowers were marked before opening, and samples were taken at day 2–3 after anthesis. We used the petal limbs for all experimental procedures. We used young leaves with a length of 1.5–2.5 cm for all the experiments. Sampling of petal limbs and leaves was made every 3 h, starting at ZT0 and tissues were immediately frozen in liquid nitrogen. In the case of DD experiment, sampling also started at ZT0, during the first 24 h under continuous dark.
2.2. Phylogeny, Bioinformatics, and Data Analysis
Previous studies showed that most genes of Petunia W115 can be assigned to Petunia axillaris [11]. We used clock genes sequences from Arabidopsis thaliana (https://www.arabidopsis.org/) to identify P. axillaris orthologs by blast in Sol Genomics Network (https://solgenomics.net/). Protein sequences from Petunia and other species were obtained from several databases including Sol Genomics Network (https://solgenomics.net/, Solanaceae), Snapdragon Genome Database (http://bioinfo.sibs.ac.cn/Am/, Antirrhinum majus) [41], Phytozome (https://phytozome.jgi.doe.gov/pz/portal.html) and GenBank (https://0-www-ncbi-nlm-nih-gov.brum.beds.ac.uk/genbank/) (Tables S1 and S2 for protein accessions and details). We used the corresponding predicted proteins to identify the intron-exon boundaries using Genewise [42]. The corresponding exon-intron boundaries were plotted using the exon-intron graphic maker (http://wormweb.org/exonintron). Protein alignment was performed with CLUSTALX [43]. Phylogenetic analysis was performed with MEGA X [44] using neighbor-joining method (NJ), JTT (Jones, Taylor and Thornton, [45]) as model of amino acid substitution and 500 bootstrap replicates. Phylogenetic tree of PSEUDO-RESPONSE REGULATORS (PRR) proteins was conducted by using the highly conserved domain pseudo-receiver (PR) [46] whereas phylogenetic tree of GIGANTEA (GI) proteins was performed by using full length proteins. Trees were visualized and annotated with “ggtree” [47] using R (R version 3.5.1), as well as the multiple sequence alignment. Protein domains were predicted using the web-based tool PROSITE [48], schematic proteins were plotted with the R package “drawProteins” [49].
Detection of rhythmic gene expression was performed using the non-parametric statistical algorithm “RAIN” [50]. We analyzed leaves and petals, under two light conditions, 12 h light/12 h dark (LD) and constant darkness (DD). To determine if the gene expression pattern of certain gene differed between tissues (leaves and petals) or light conditions (light:dark and constant darkness), we used an harmonic ANOVA (HANOVA) and to detect noise changes we used a scale test (HarmScaleTest) implemented in the R package “DODR” [51]. The HANOVA detects changes in amplitude and phases and HarmScaleTest uses a F-Test for variances to determine if the biological noise levels differed or not in two time series. We plotted the graphics with “ggplot2” [52].
2.3. Gene Expression Analysis by qPCR
RNA was extracted from three biological replicates per time point of leaves and petals (flower tubes were excluded) using acid phenol [53]. Concentrations were measured using NanoDrop (Thermo-Fisher). Equal amounts of total RNA were used to obtain cDNA using Maxima kits (Thermo-Fisher).
PCR analysis was performed as described before [54], the following protocol was used for 40 cycles: 95 °C for 5 s, 60 °C for 20 s and 72 °C for 15 s (Clontech SYBR Green Master Mix and Mx3000P qPCR Systems, Agilent Technologies). Primers for circadian clock genes were designed using pcrEfficiency [55] (Table S3) and the following protocol was used for 40 cycles: 95 °C for 5 s, 60 °C for 20 s (55 °C for PhGI1 and PhGI2) and 72 °C for 15 s. Samples were run in duplicate. Primer combinations were tested with genomic DNA from Mitchell and we found that all of them gave a single copy DNA on agarose gels. The endpoint PCR was further verified by melting point analysis where all primer combinations gave a single peak of melting (Figure S1). Normalized expression was calculated as described [56] and ACTIN (PhACT) was the internal control gene, a stable gene in circadian studies in petunia leaves and petals [37].
We determined the mean normalized expression. For each gene, tissue, and light condition, normalized expression was calculated as described previously [56], then the expression level for each time point was divided by the average expression across the time-course [57]. In addition, to analyze the gene expression variability, we calculated the coefficient of variation (CV) of every gene per time point, tissue and light:dark conditions. We also plotted the normalized expression of every biological replicate.
3. Results
3.1. The Duplicated PRR7, PRR5, and GI Diverge in Intron Number and Coding Sequence
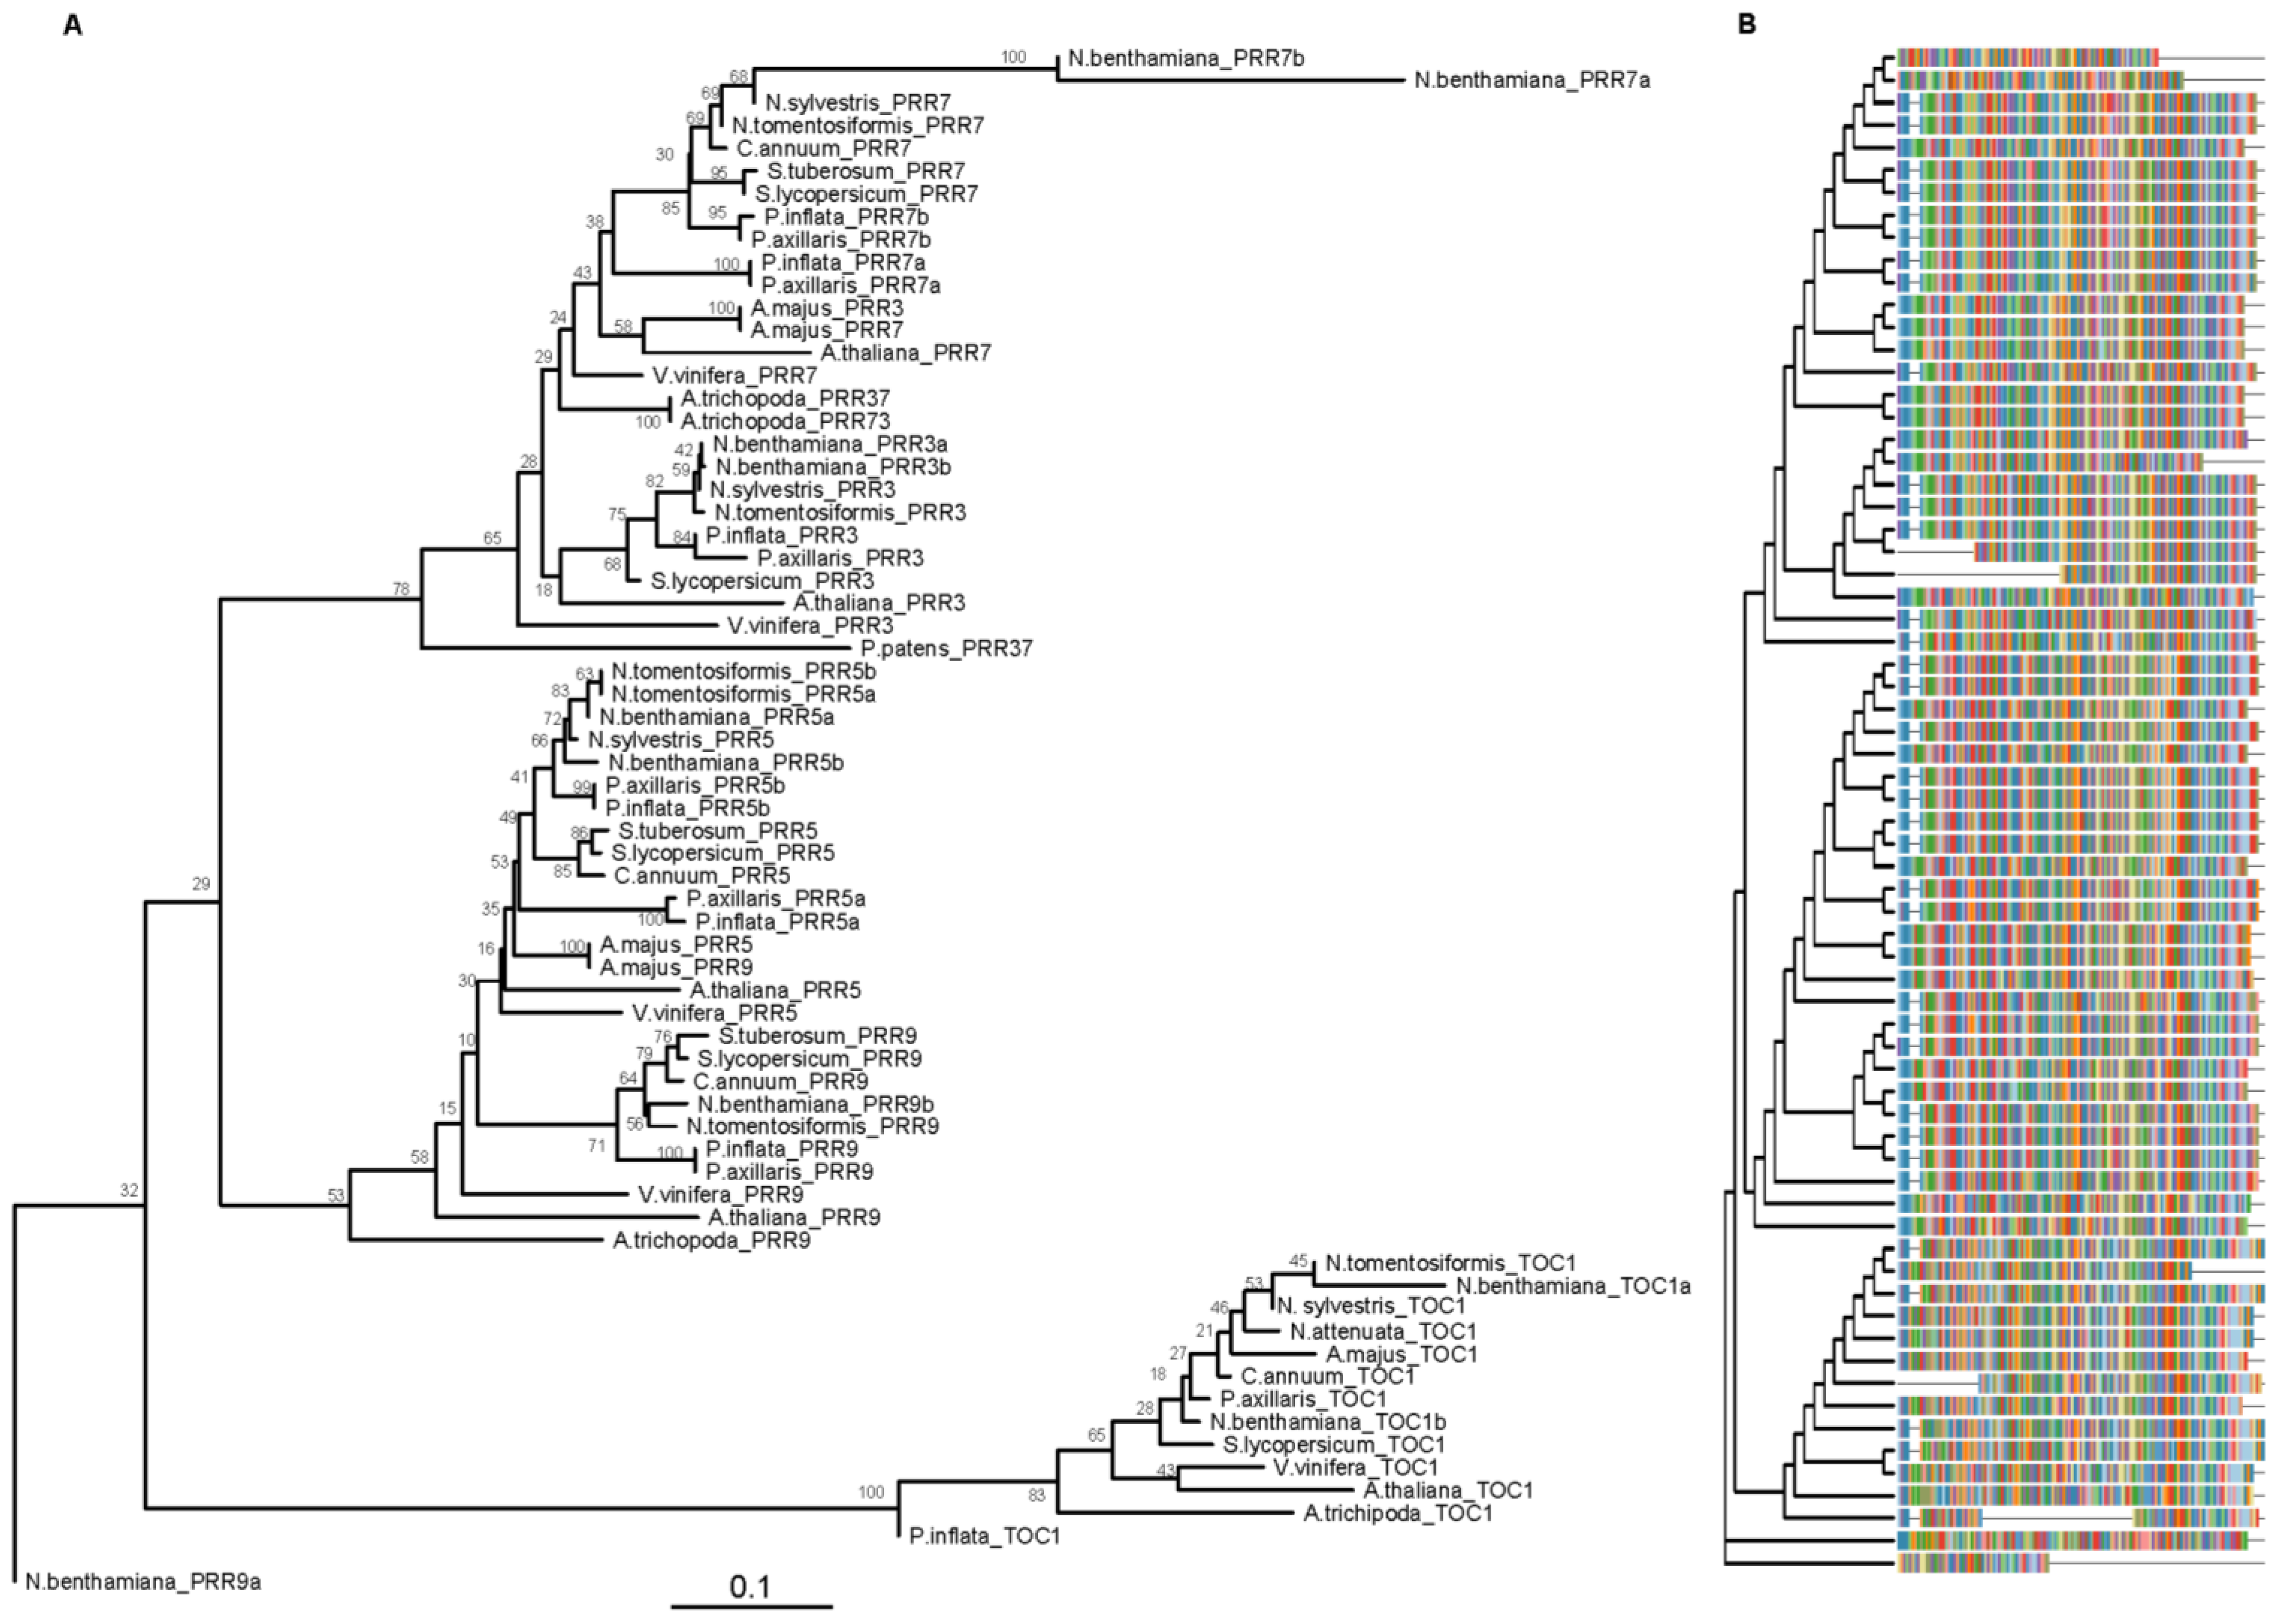
We used the laboratory line Petunia hybrida W115, also known as Mitchell, which contains the circadian clock genes corresponding to P. axillaris [11] for a detailed analysis of the structure of the PRR and GI paralogs. Several genes forming the morning and evening loops of the circadian clock in petunia have undergone gene duplication. The genome of petunia has seven PRR genes as PRR7 and PRR5 are duplicated both in P. axillaris and P. integrifolia while Arabidopsis has the canonical set of five genes, PRR1 or TOC1, PRR3, PRR5, PRR7, and PRR9 involved in circadian regulation [11]. We reconstructed a phylogenetic tree of PRR genes, by using the conserved domain pseudo-receiver (PR), of Solanaceae and Arabidopsis (Table S1) in order to deduce the evolutionary relationships of the duplicated genes. As found previously for other Angiosperms, the PRR genes of Solanaceae form three major clades: the TOC1/PRR1 clade, the PRR7/3 clade, and the PRR9/5 clade (Figure 1) [58]. The PRR5a genes of P. axillaris, P. integrifolia are closer to the Arabidopsis AtPRR5 while the rest of the PRR genes of Solanaceae, including the PRR5b, form an additional subclade. This topology indicates that the PRRa paralogs may be an ancestral form and the PRRb may have been formed later and retained, in some cases as single copy genes. The PRR7 genes also showed a similar topology where PaxiNPRR7a and PinfS6PRR7a are closer to the Arabidopsis gene than the single copy genes of the rest of the Solanaceae, and the PRR7b paralogs. This topology is also seen in petunia PRR9, PRR3, and TOC1 that are somewhat between the Arabidopsis gene and the rest of the Solanaceae, according to the early departure of Petunia from the rest of the family [11].
We found that the gene models for PhPRR5a and PhPRR5b differ in the number of exons comprising the coding region as PhPRR5a has seven and PhPRR5b eight exons (Figure S2). The gene model in Arabidopsis comprises six exons in AT5G24470 (AtPRR5), indicating that changes in intron-exon structure has occurred in the evolution of the PRR family. The number of exons also differed between PhPRR7a with eight exons while PhPRR7b had seven exons. The Arabidopsis AT5G02810 AtPRR7 has nine exons out of which eight correspond to coding region, thus coinciding with the phylogenetically closer PhPRR7a.
The PRR family of Arabidopsis has two conserved domains: PR (Pseudo-receiver Domain) and a CCT (CONSTANS, CONSTANS-like, and TIMING OF CAB EXPRESSION 1 (TOC1/PRR1)) [59] (Figure S3A). PRR5, PRR7, and PRR9 have a repression motif which consists of two regions, L(E/D)(L/I)S(L/I)(R/K)R and SXXSAF(S/T)(R/Q)(Y/F), located between the PR and CCT domains. They interact with TOPLESS (TPL) and TOPLESS-RELATED PROTEINS (TPRs) [59,60], creating a transcriptional repression complex. This complex represses the transcription of the core genes CIRCADIAN CLOCK ASSOCIATED 1 (CCA1) and LATE ELONGATED HYPOCOTYL (LHY) [59,61]. We used Arabidopsis as the model, and we compared it with petunia sequences. We found that all the PRR members of P. axillaris and P. inflata shared the PR domain (Figure S3A). The CCT domain was found in all the coding genes except for PaxiNPRR7b, PinfPRR7a, and PinfPRR7b. The presence of the CCT domain in PaxiNPRR7a and absence from the rest of the gene group in petunia was surprising, thus we analyzed other Solanaceae, member of the Convolvulaceae (Cuscuta australis and Ipomea nil) and Plantaginaceae (Antirrhinum majus). We found that the CCT domain was absent from the PRR7 protein in the Solanaceae analyzed (Capsicum annuum, C. baccatum, Nicotiana benthamiana, N. sylvestris, N. tabacum, N. tomentosiformis, Petunia axillaris, P. inflata, Solanum lycopersicum, S. melongena, S. pennellii, S. pimpinellifolium, and S. tuberosum) (Figure S3B). However, the CCT domain was found in the rest of the species analyzed. This indicates an early change in the PRR7 family in Solanaceae with possible implications in clock functioning.
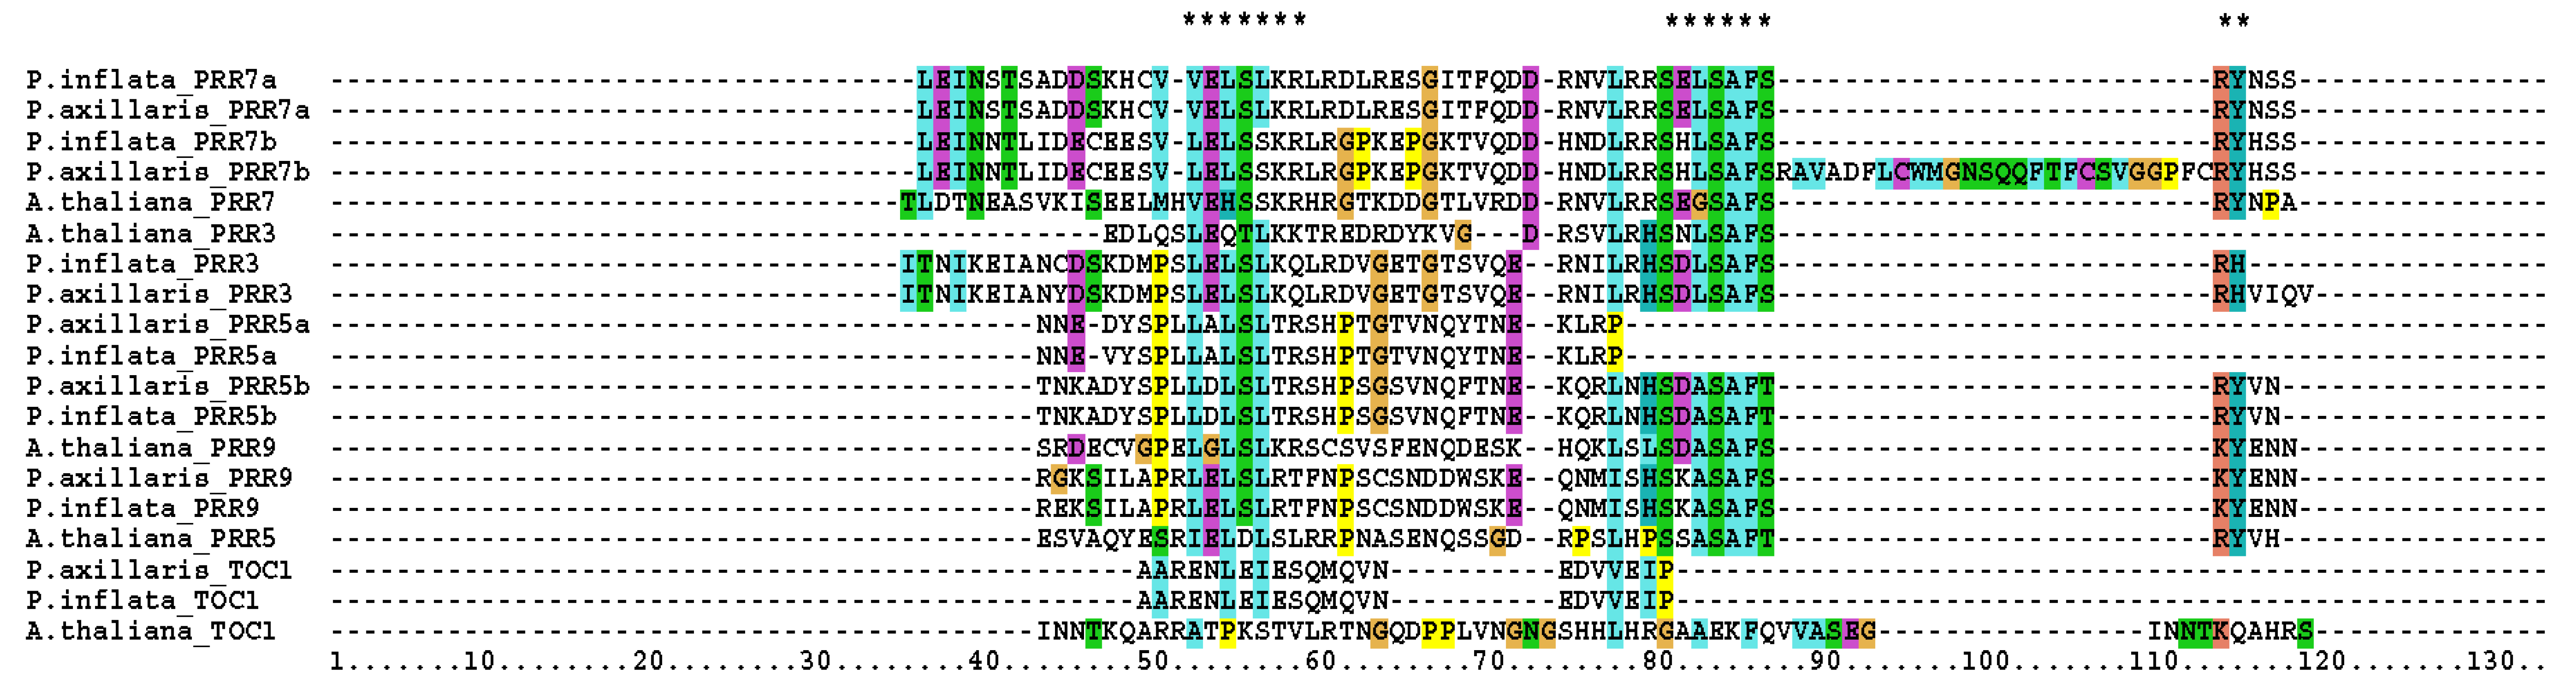
We also identified the repression motif in Petunia axillaris and P. inflata, which shared a high homology with Arabidopsis (Figure 2). These motifs are present in PRR5, PRR7, and PRR9 but absent in PRR3 and TOC1 (Figure 2). We found that the paralog PRR5a of P. axillaris and P.inflata had two major differences. The L(E/D)(L/I)S(L/I)(R/K)R motif present in the PRR9, 7, and 5 was not canonical as the glutamic/aspartic amino acid of the second position had been replaced by an alanine. Furthermore, both PRR5a had lost the SXXSAF(S/T)(R/Q)(Y/F) motif. We compared the PRR5 proteins of several Solanaceae and Arabidopsis and found that all share the aspartic acid in the second position of the first motif and the complete repression motif absent in PaxiNPRR5a and PinfSPRR5a (Figure S4). This indicates that the D->A amino acid substitution and motif deletion are specific to the Petunia linage.
The SXXSAF(S/T)(R/Q)(Y/F) of PaxiNPRR7b was interrupted by a sequence insertion of 26 amino acids. The sequence of both regions varied among paralogs, as SELSAFSRY was found in the PRR7a lineage and SHLSAFSRY in the PRR7b lineage (Figure 2). Altogether, these changes indicate that PRR duplication occurred before Petunia speciation. The absence of the transcriptional repression motif in PRR5a and the interruption of PRR7b in Petunia inflata suggest that these paralogs have lost their repression activity.
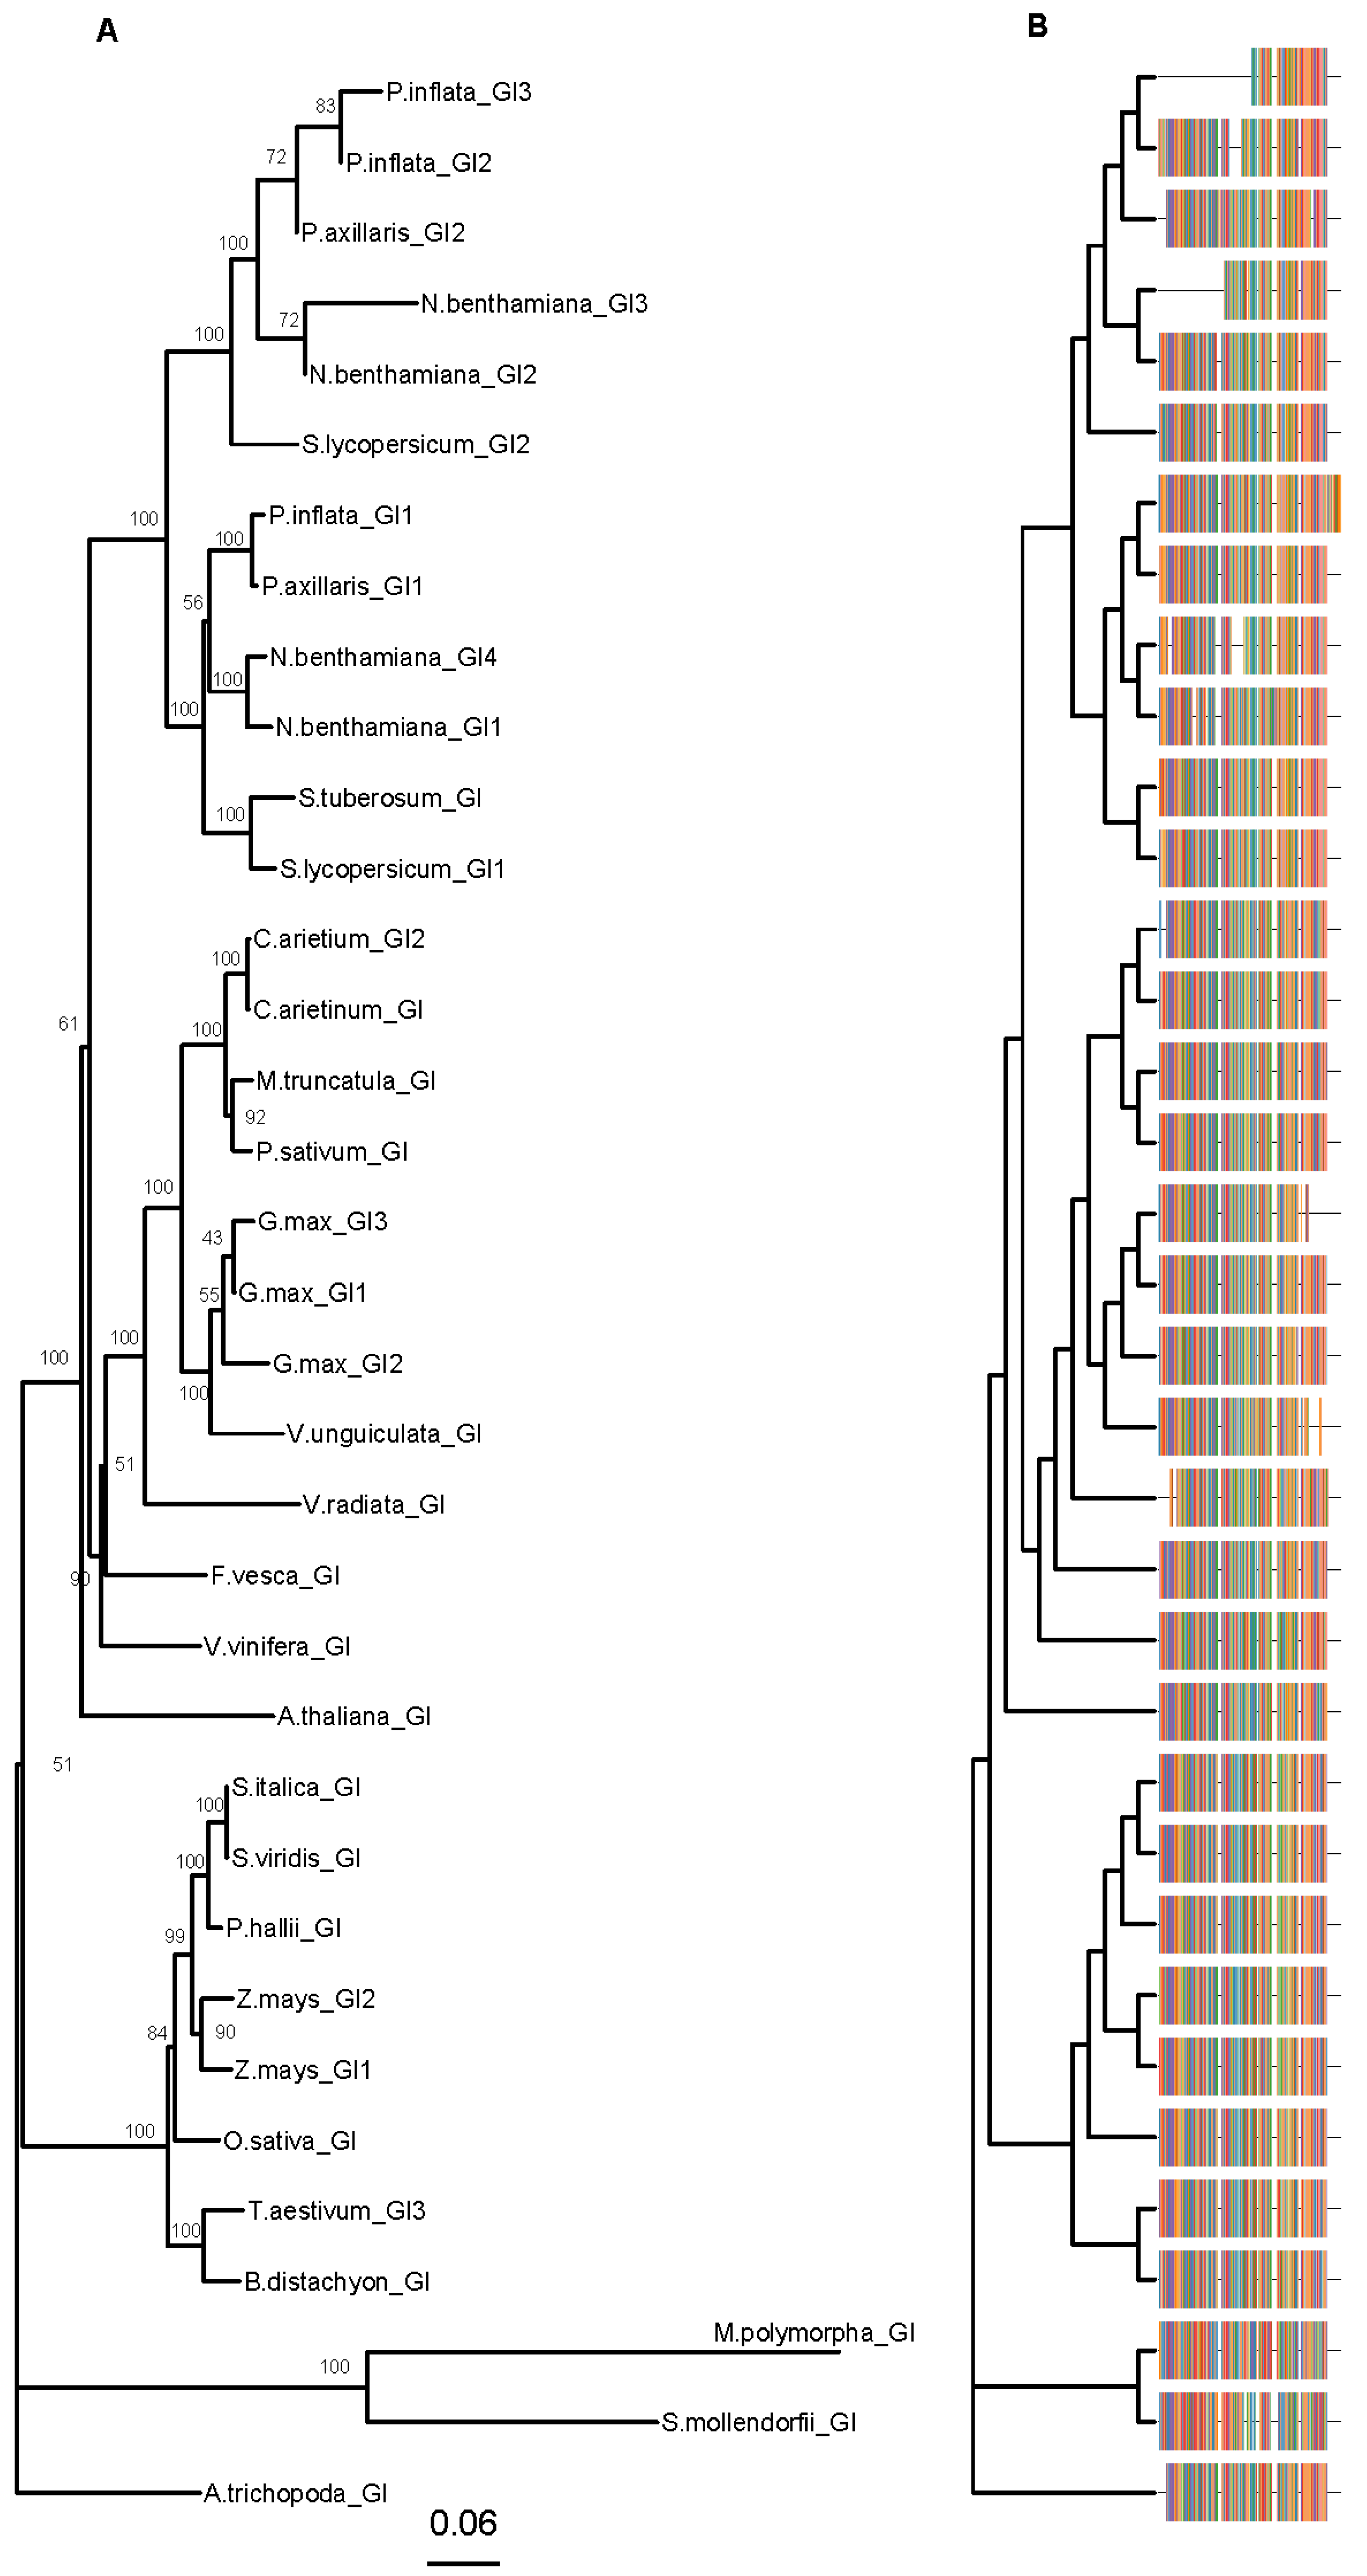
GIGANTEA (GI) plays a role in flowering time but is needed to maintain the period and amplitude of clock genes [62,63]. GI is a single copy gene in the Arabidopsis genome [62] and it is found in one to three copies in the Solanaceae genomes. Petunia axillaris has two copies PaxiNGI1, PaxiNGI2, whereas P. inflata has three copies PinfS6GI1, PinfS6GI2, and PinfS6GI3 [11]. Interestingly, the genes PaxiNGI1 and PaxiNGI2 are present in the genome of P. hybrida Mitchell. We will refer to GIGANTEA genes in P. hybrida as PhGI1 and PhGI2. The proteins PinfS6GI1 and PaxiNGI1 share an N-terminus conserved with AtGI that was absent in PaxiNGI2 (Figure 3, Figure S5). Furthermore, PaxiNGI2 showed a 41 amino acid insertion that was not conserved in PinfS6GI2 or other GI genes. The PinfS6GI3 was much shorter than the other paralogs, a feature conserved in Nicotiana benthamiana NbGI3 (Figure 3). The PinfSGI1 had an additional C-terminal fragment of 105 amino acids absent from the rest of the GI genes analyzed (Figure 3, Figure S5).
We can conclude that the structural evolution of core circadian clock genes and associated genes has occurred at via changes in the number of retained paralogs, gene structure, and coding region.
3.2. The Leaf Clock has its Maximum during the Day while the Petal Clock Shifts towards the Night
Several clock models have been described in the last years; one of the most popular plant clocks defines three loops called morning, central, and evening loops. These describe the time of the day when certain genes are preferentially expressed [64]. In Arabidopsis, during the morning CIRCADIAN CLOCK-ASSOCIATED 1 and LATE ELONGATED HYPOCOTYL (CCA1/LHY) repress PSEUDO-RESPONSE REGULATOR members (PRRs), which are sequentially expressed (PRR9, PRR7, PRR5 and finally TIMING OF CAB EXPRESSION 1, TOC1 or PRR1, at dusk) [59]. The PRR family represses CCA1/LHY. CCA1/LHY also inhibits GIGANTEA (GI) and the evening complex (EC) expression during the morning [65]. The EC is comprised by LUX ARRHYTHMO (LUX), EARLY FLOWERING 4 and 3, (ELF4 and ELF3). At dusk, TOC1 represses the evening genes GI, ELF4, and LUX. TOC1 interacts with CCA1 HIKING EXPEDITION (CHE) and mediates the repression of CCA1 [66]. Several activators have been described, including REVEILLE 8 (RVE8) and LIGHT-INDUCIBLE AND CLOCK-REGULATED (LNKs) that positively regulate the transcription of PRR5 and TOC1 or the complex LIGHT-REGULATED WD-TEOSINTE BRANCHED 1-CYCLOIDEA-PCF (LWD-TCP), which activates the transcription of CCA1 [67,68,69]. We established the expression patterns of the different clock genes in leaves and petals. As the genes contained in P. hybrida cv Mitchell correspond to P. axillaris [11], we further describe them as Ph genes. These included the morning loop genes PhPRR9, PhPRR7a, PhPRR7b, PhPRR5a, PhPRR5b, and PhPRR3. The core loop was represented by PhTOC1 and PhLHY. Finally, the evening and clock-associated genes analyzed included PhGI1, PhGI2, PhELF4, PhCHL (the ZEITLUPE ortholog), and PhFKF (FLAVIN-BINDING KELCH REPEAT FBOX1). This analysis was performed in petunia that was acclimated to light:dark conditions of 12 h light and 12 h dark (LD) or continuous dark (DD) conditions.
The non-parametric algorithm RAIN groups gene expression data by their sampling time point e.g., ZT0, ZT3. These groups are assigned to the falling and to the rising part of the oscillation or wave. Then each part, falling and rising, is analyzed by a test against umbrella alternatives [70]. The peak of the umbrella varied, allowing RAIN to test different wave forms. Regardless, if a gene is rhythmically expressed (significant p-value) or not, RAIN provides the time point of a peak, if found. We compared two parameters between leaves and petals under a LD cycle: rhythmicity of expression (oscillation) and time point with maximum expression (phase) (Table 1). Concerning rhythmicity, most genes showed a robust oscillation pattern except PhELF4 and PhCHL in leaves, and PhCHL in petals, that showed a peak but no significant rhythm (Table 1).
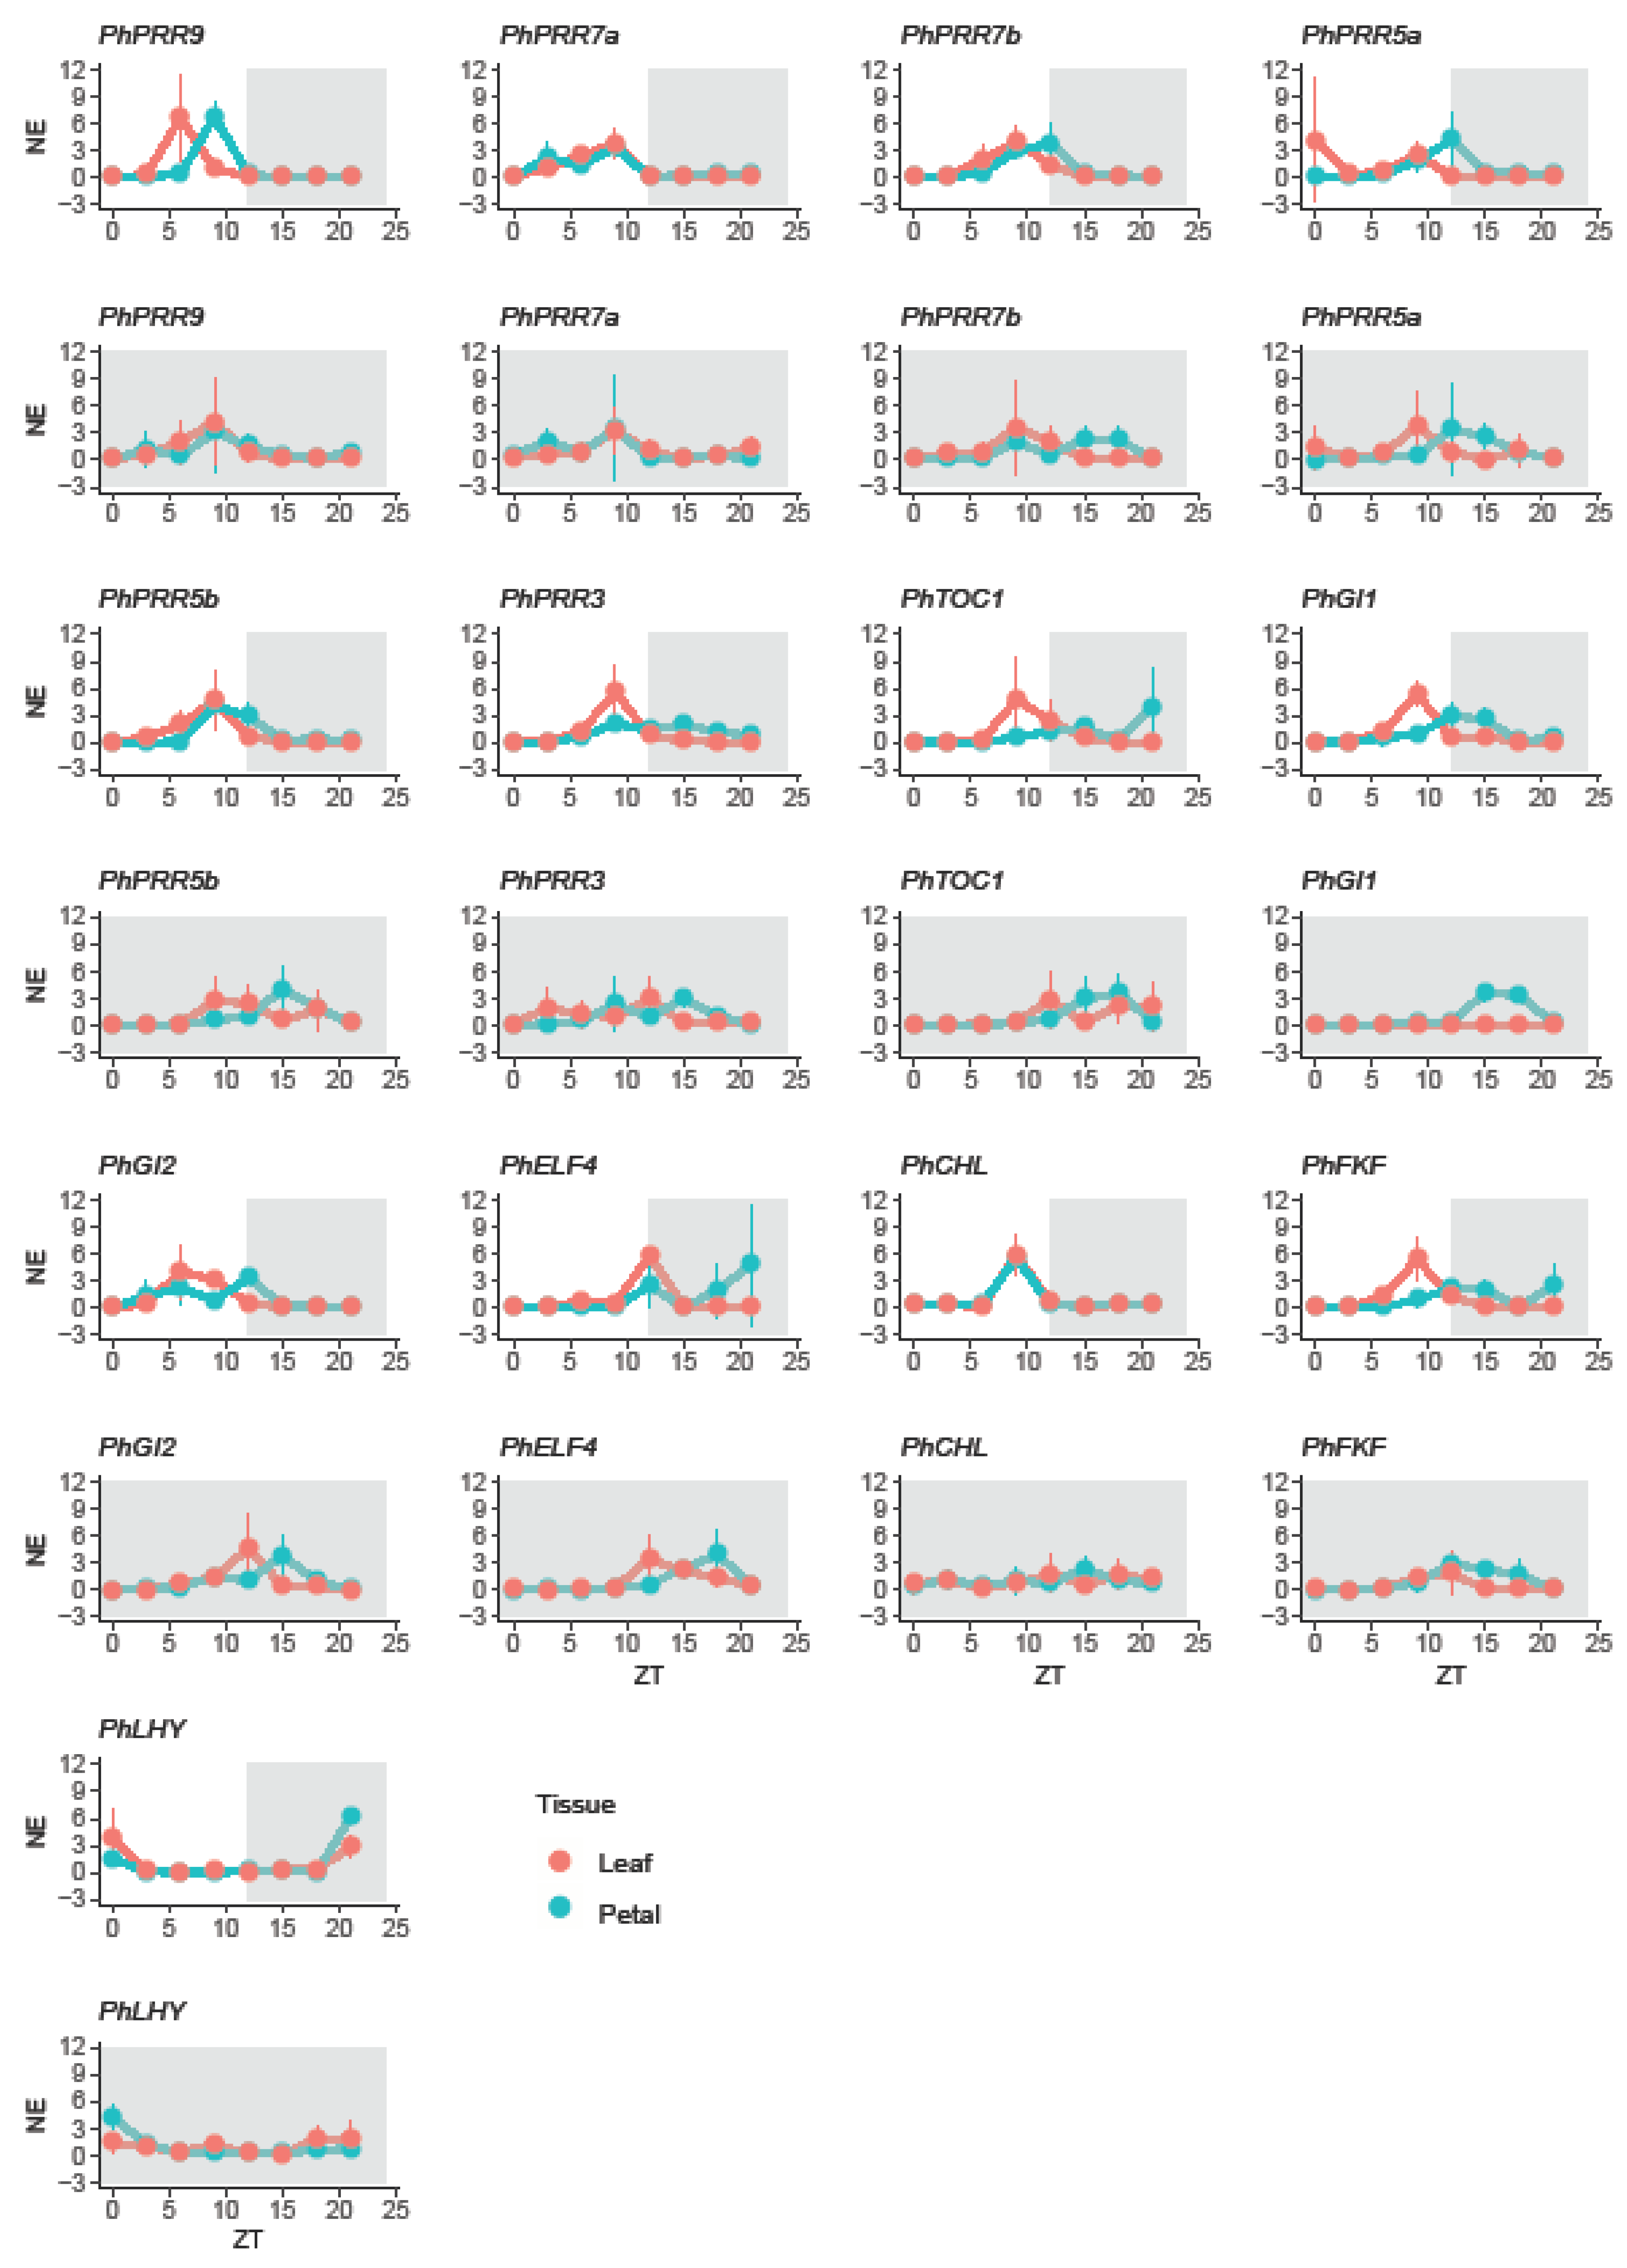
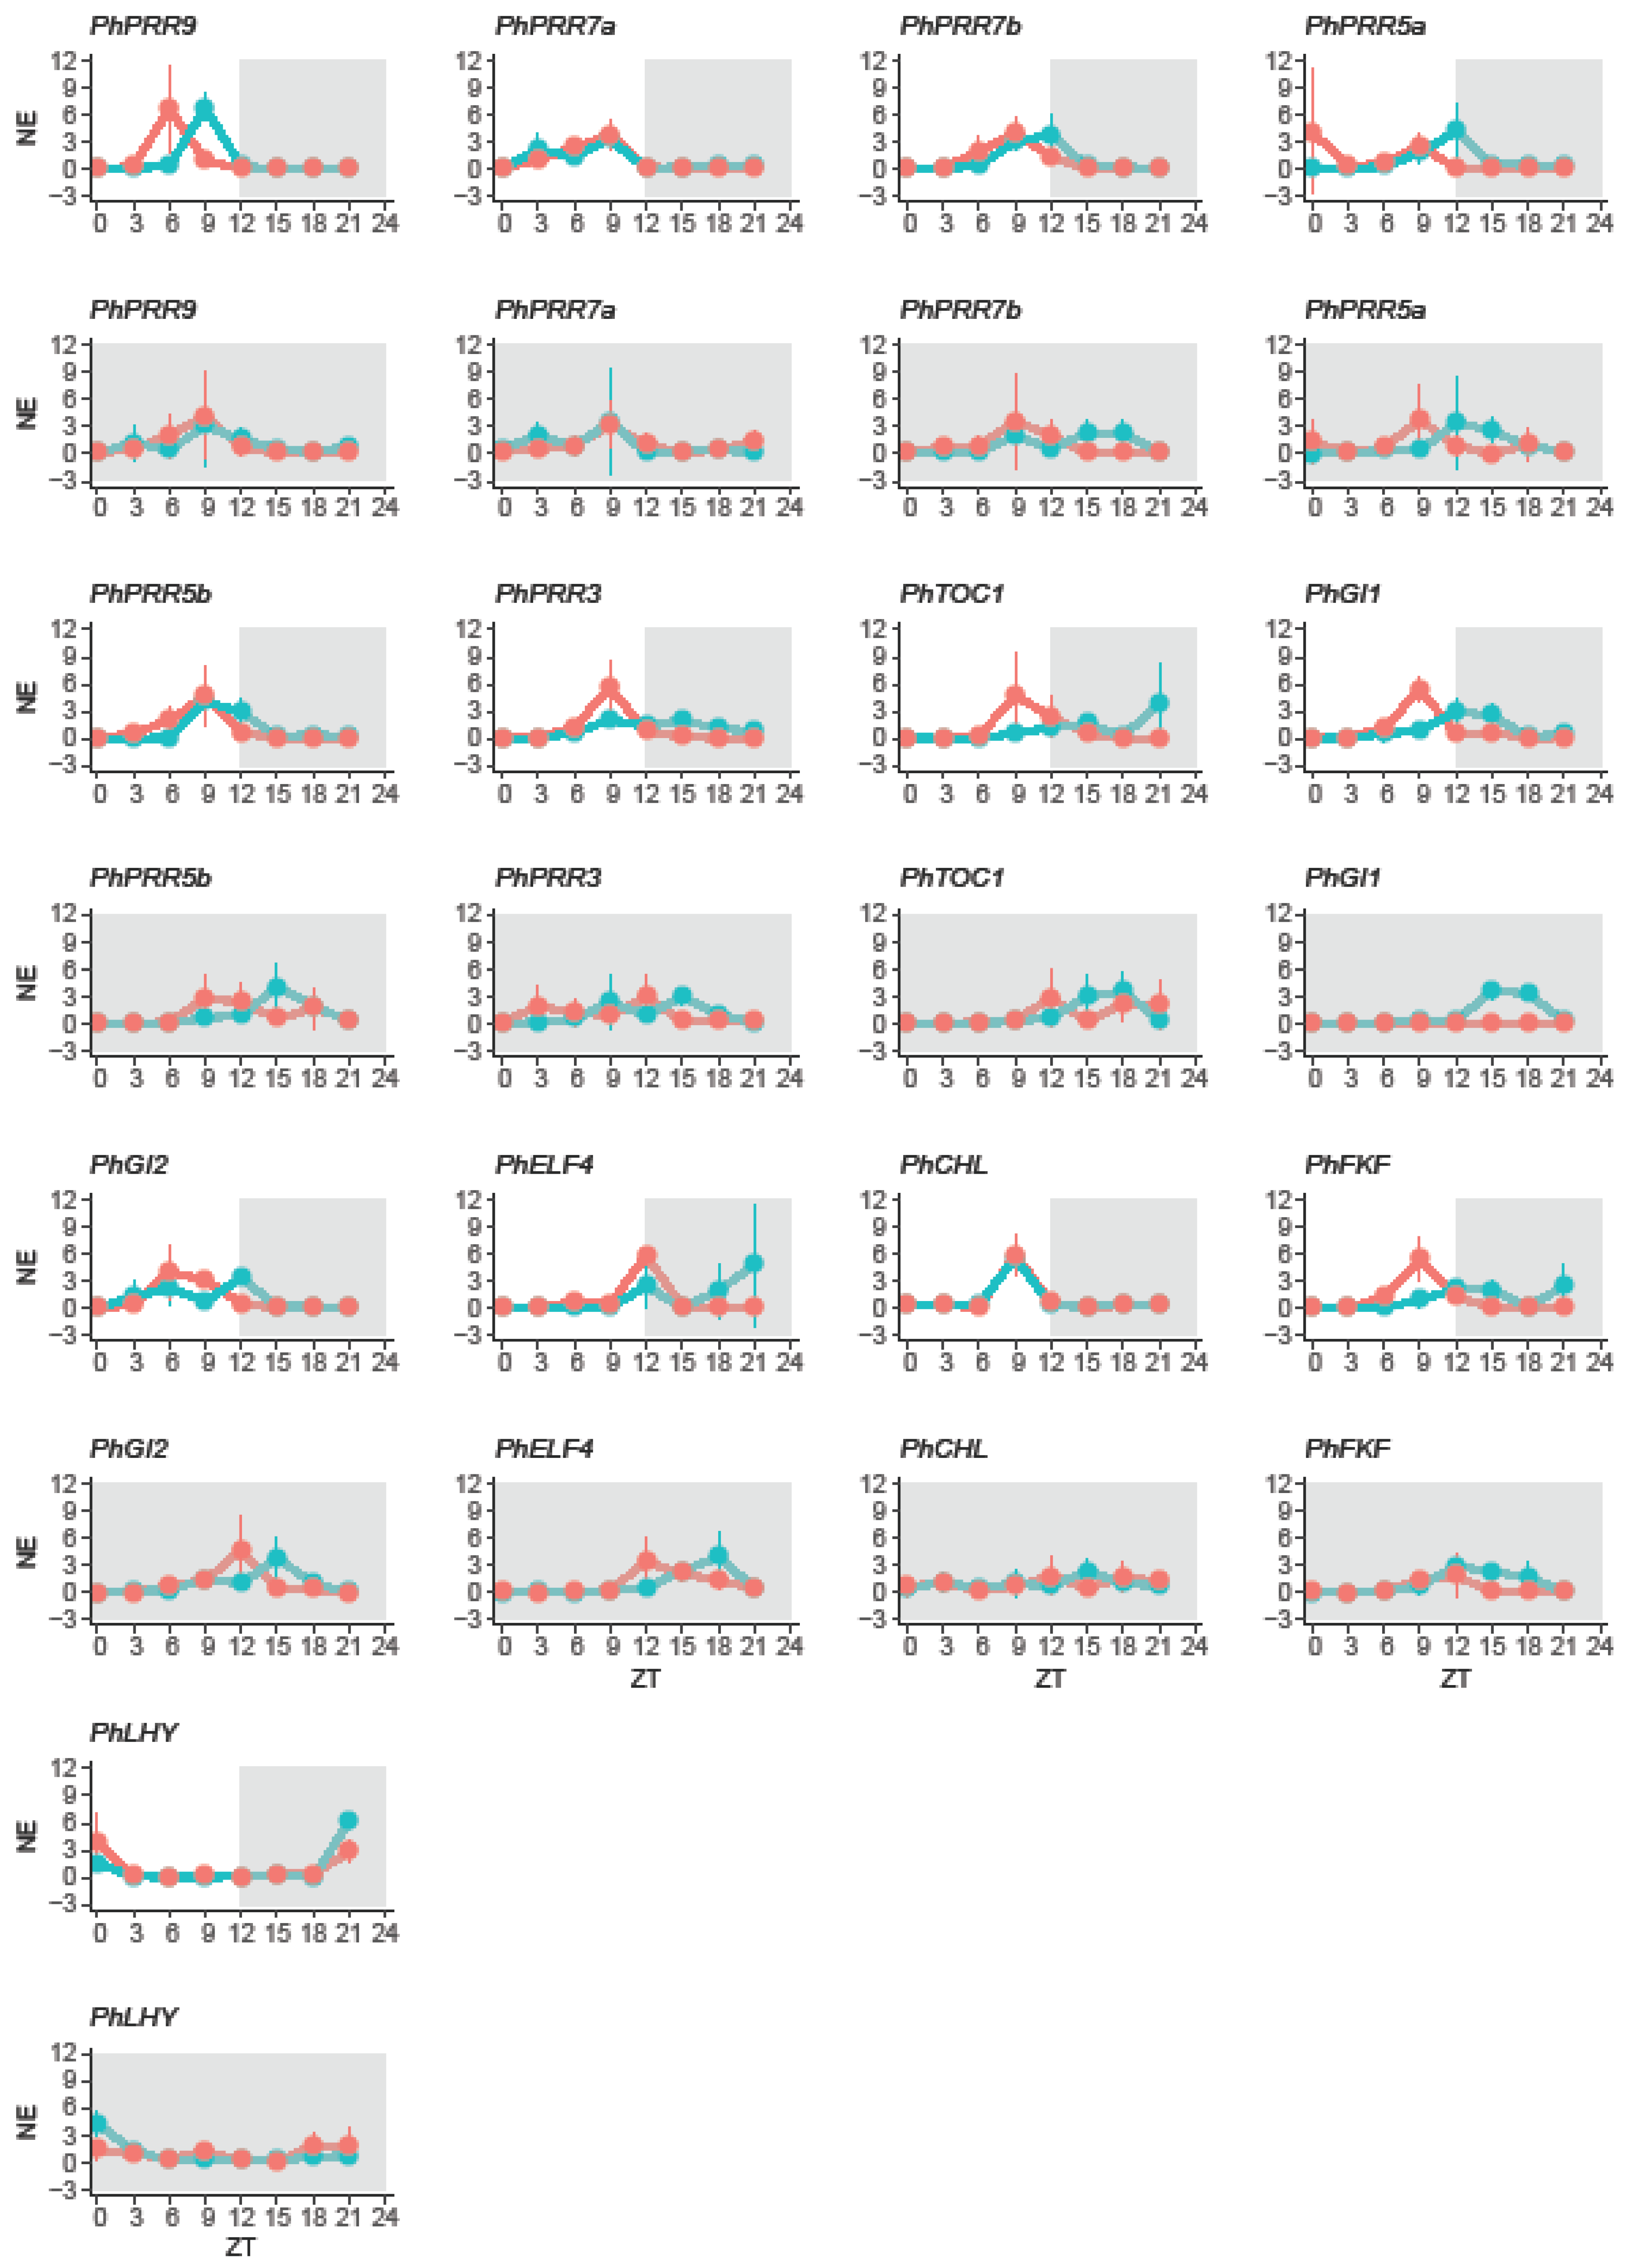
In leaves, most genes had their maximum expression during the light phase, except PhELF4 that reached its maximum level at ZT12. Petunia clock genes peaked at early morning (PhLHY, at ZT0), midday (PhPRR9 and PhGI2, at ZT6), and before dusk (PhPRR3, PhPRR5a, PhPRR5b, PhPRR7a, PhPRR7b, PhTOC1, PhCHL, PhGI1, and PhFKF, at ZT9) (Table 1). In contrast in petals, whereas the clock genes PhPRR5b, PhPRR7a, PhPRR7b, PhCHL, PhELF4, and PhLHY peaked at the same time as observed in leaves, the remaining genes delayed their expression. PhPRR9 peaked at ZT9 meanwhile PhPRR5a, PhPRR3, PhTOC1, PhGI1, PhGI2, and PhFKF shifted their expression maximum to the dark period. These genes peaked at ZT12 (PhPRR5a, PhGI1, PhGI2 and PhELF4) and ZT15 (PhPRR3, PhTOC1, and PhFKF) (Table 1).
3.3. Continuous Darkness Shifted the Expression Patterns of Clock Genes
In order to study the entrainment of the petunia circadian clock to the light:dark cycle, petunia plants were transferred from 12 h light:dark (LD) conditions to continuous darkness (DD). We found that PhPRR7b and PhPRR7a lost their robust oscillation (p > 0.05) in leaves and petals, respectively; and as described under a LD cycle, PhCHL did not oscillate significantly (p > 0.05). In addition, we observed that DD tended to shift the expression patterns of some genes (Table 1,).
In leaves, we divided the clock genes into three groups. The first group included PhPRR5a, PhPRR7a, PhPRR7b, PhFKF, and PhLHY, which maintained their time of maximum expression. The second group included PhCHL, advanced by 9 h. Finally, the last group comprised PhPRR3, PhPRR5b, PhPRR9, PhGI1, and PhELF4 delayed by 3 h, PhGI2 by 6 h, and PhTOC1 by 15 h (Figure 4, Table 1).
The effect of continuous darkness on petunia petals differed from leaves. Only two genes, PhPRR3 and PhLHY kept their peak or time with maximum expression. PhPRR7a and PhFKF showed an advanced pattern, peaking 3 h early. Finally, the maximum expression was delayed 3 h for PhPRR5a, PhTOC1, PhGI1, PhGI2, 6 h for PhPRR5b, PhPRR9, PhCHL, and PhELF4 and 9 h PhPRR7b (Figure 4, Table 1).
Altogether, PhLHY showed a rhythmic oscillation, peaking at early morning regardless of light conditions and tissue. On the other hand, PhCHL did not show a rhythmic expression in leaves or petals under light:dark or constant darkness. Besides, we observed that continuous darkness had a different effect on clock genes in leaves and petals, as PhPRR7b, PhPRR5a, or PhPRR3 that showed an organ specific change in phase in response to constant darkness (Table 1).
3.4. Rhythmicity and Photoperiod Sensitivity are Tissue Specific
An important paradigm in the analysis of circadian clock gene expression is the effect of continuous darkness on the genes thought to have a circadian control [71]. We performed an analysis to detect changes in amplitude and phase, in two time series by using Harmonic ANOVA [51]. First, we analyzed differences between tissues by comparing daily gene expression in leaf and petals under light:dark (LD) and under constant darkness (DD). Second, in order to identify the effect on light conditions, we compared LD and DD cycles for leaves and for petals (Table 2). We found that PhPRR5a, PhPRR7a, PhPRR9, and PhLHY showed a robust expression pattern regardless of the tissue or photoperiod (p < 0.05). In contrast, under light:dark conditions, PhGI1, PhPRR3, and PhTOC1 had higher amplitude and were delayed in petals compared to leaves (Table 2). PhFKF showed higher amplitude in leaves and was delayed in petals (Table 2). When we compared leaves and petals at LD versus DD, PhTOC1, PhCHL, and PhGI2 in leaves, and PhPRR7b, PhPRR5b, PhCHL, PhGI1, and PhGI2 in petals, showed a different expression pattern. Interestingly, all these genes were delayed under constant darkness, but differed in their highest amplitude. In leaves, PhTOC1 displayed the highest amplitude in LD whereas PhGI2 and PhCHL, in DD. In petals, PhPRR7b and PhGI1 amplitude was higher under a light:dark cycle and PhPRR5b, PhGI2, and PhCHL showed their maximum amplitude in DD (Table 2).
These results indicate that there are two sets of genes with changes in rhythmicity, both in phase and amplitude, in leaves and petals and a group of stable genes comprising PhPRR5a, PhPRR7a, PhPRR9, and PhLHY. Furthermore, the effect of photoperiod appeared to be organ-specific for those genes that showed significant changes. From all the different genes analyzed, PhPRR7b appeared to be specifically affected by DD in petals, indicating a modified control in this organ.
3.5. Transcriptional Noise is Gene and Tissue Specific
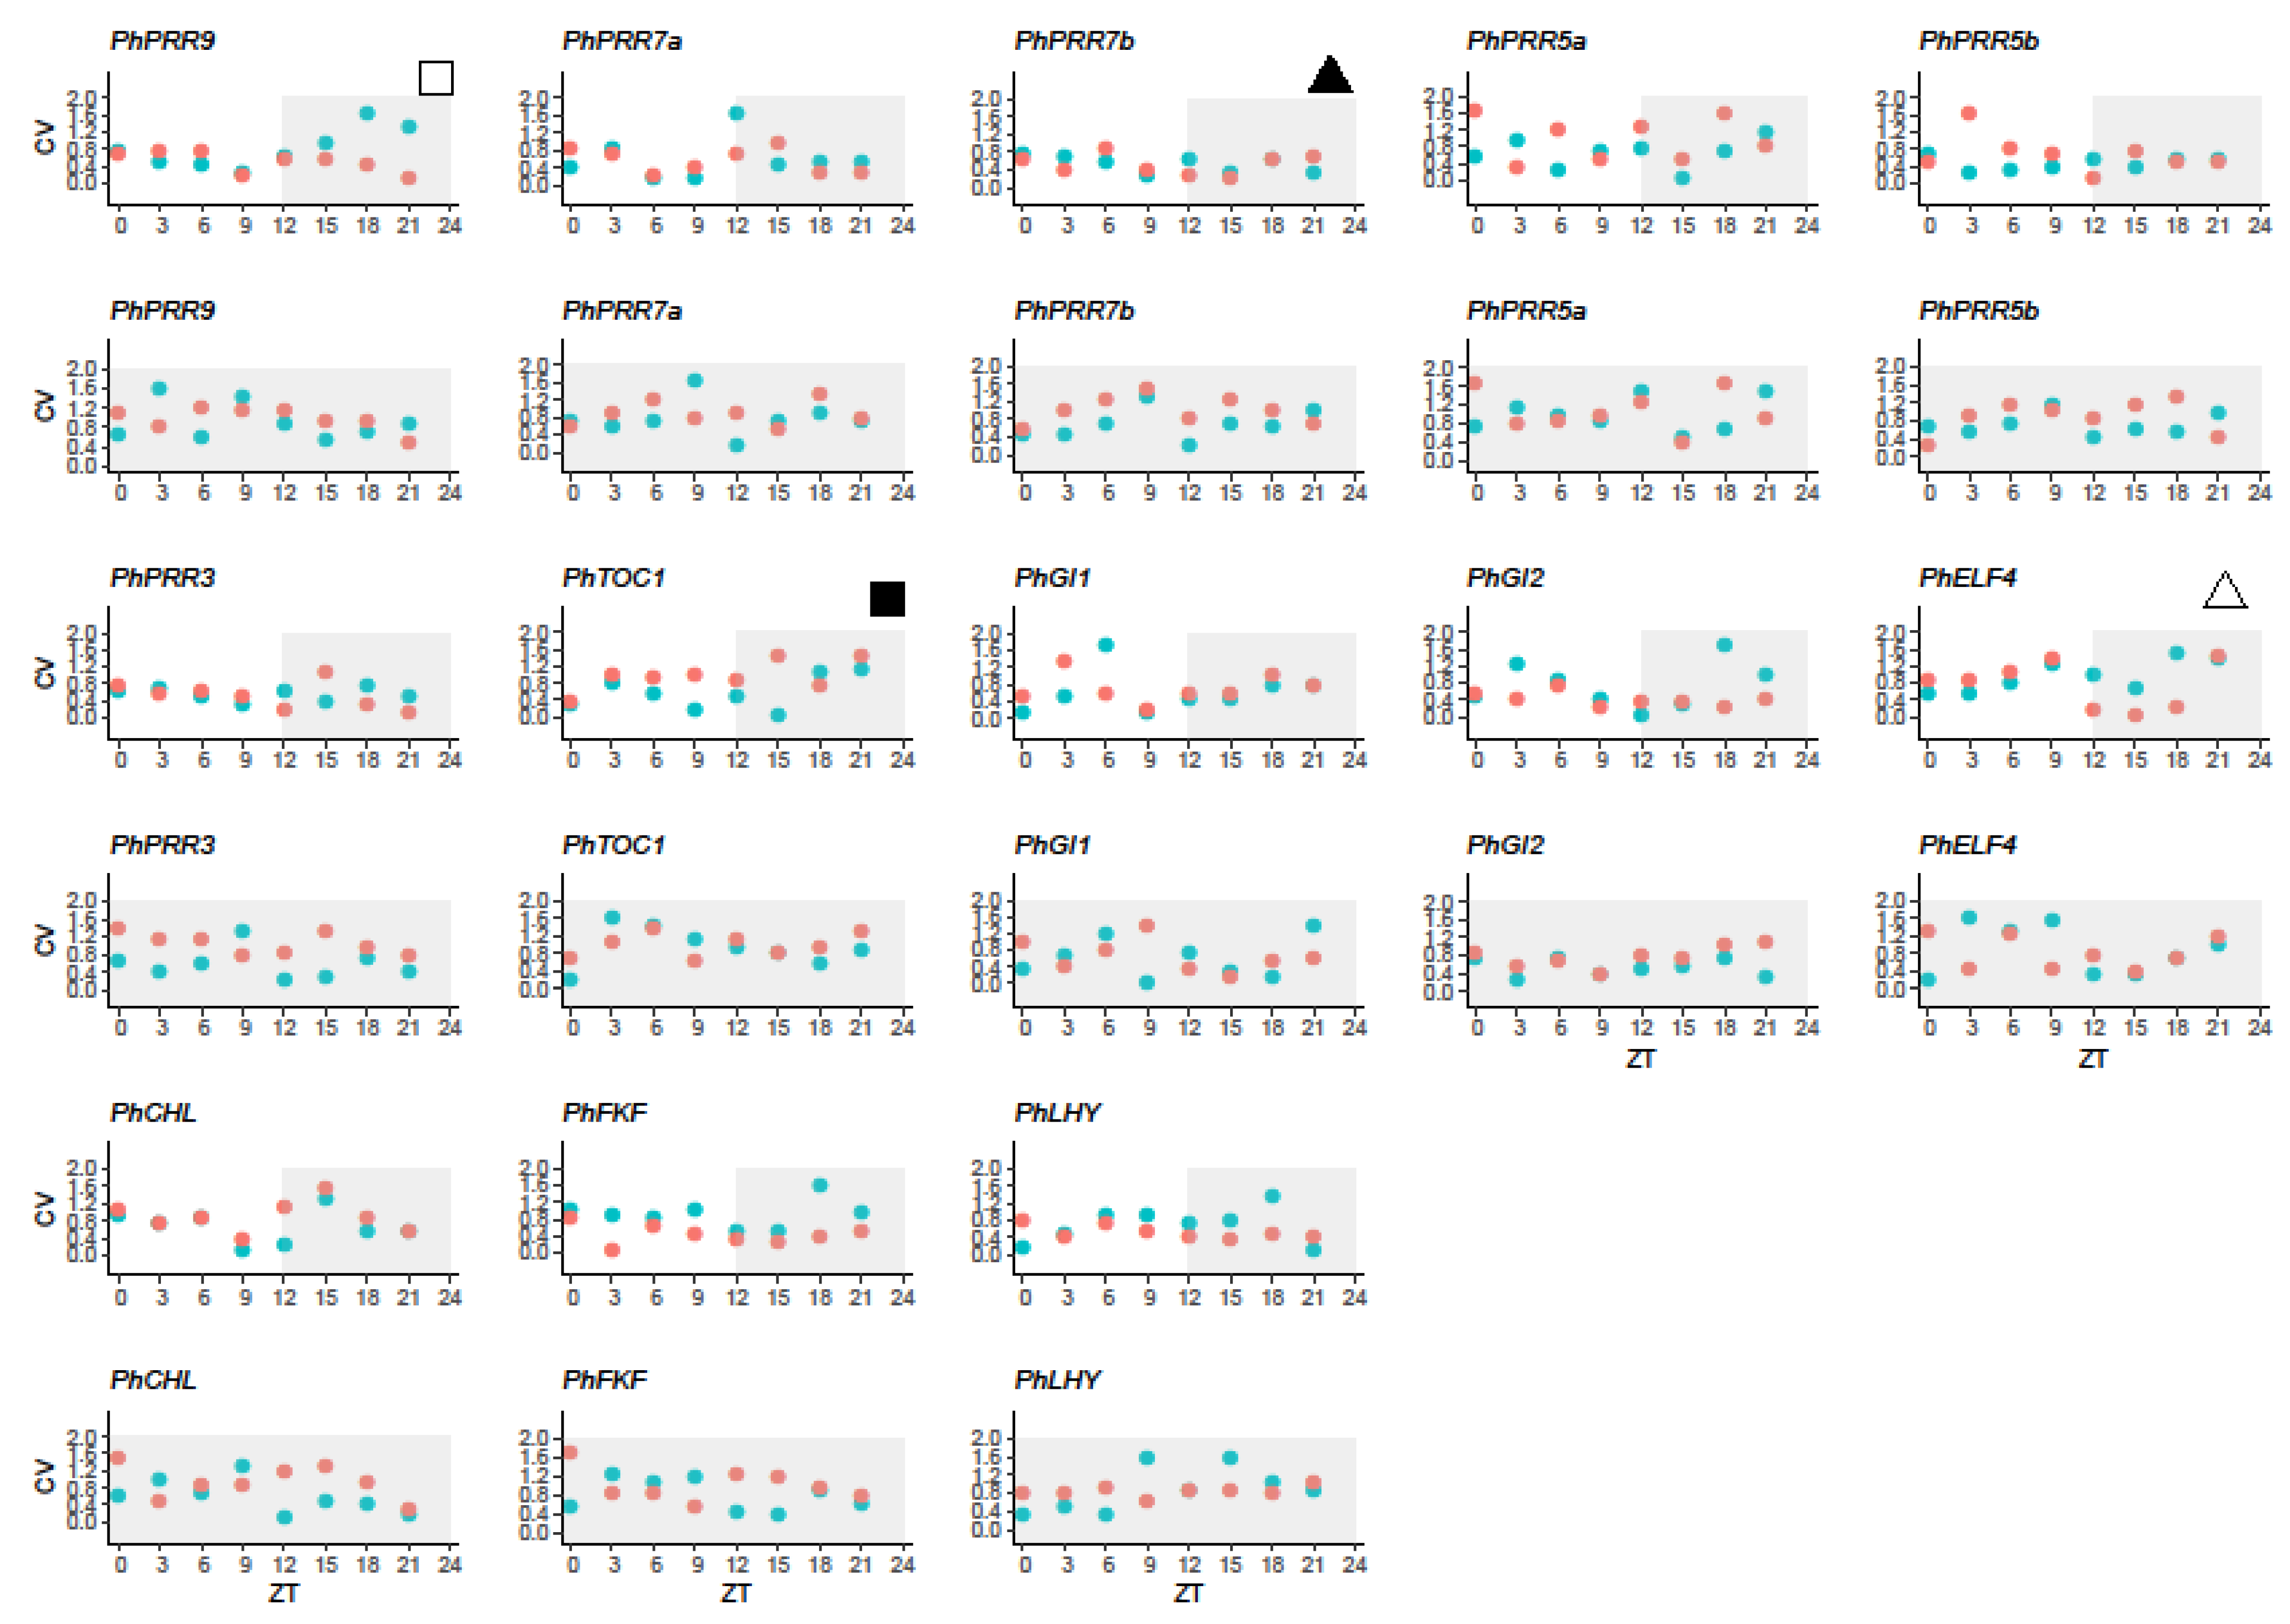
Although gene expression quantities were determined for the same set of mRNA extractions, the degree of significance in terms of gene expression levels was not always as expected based on average expressions. We asked if the variability of gene expression depended on tissue, time, and/or light conditions. When we analyzed the variability under a light:dark cycle (LD) we found that the clock genes PhPRR7b and PhPRR3 showed the lowest variation in leaves and petals whereas PhELF4 was a highly variable gene in both tissues. The stability of remaining genes varied among tissues, such as PhPRR9 or PhTOC1, showing lower transcriptional noise in leaves than petals. In addition, we observed that the lowest and the highest variability for all analyzed genes varied along the day, suggesting that transcriptional noise may be time-dependent (Figure 5, Figure S6).
When plants were transferred to constant darkness (DD), we found that the variability of clock genes tended to increase, except for PhLHY in leaves and PhGI2 in petals that were the most stable genes. Interestingly, the increase in CV was higher in leaves (Figure 5, Figure S6). The genes PhPRR7a, PhPRR7b, PhPRR3, and PhFKF showed the highest variability under constant darkness. In petals, the transcriptional noise of PhPRR5a and PhTOC1 increased under a DD cycle (Figure 5). As previously mentioned, under a light:dark cycle, the coefficient of variation changed depending on the time point. The highest and lowest noise for leaves coincided with early and late day respectively, while in petals transcriptional noise was low in the subjective night and higher noise was found at subjective time ZT9.
We used a scale test (HarmScaleTest) implemented in the DODR package [51] in order to detect significant changes in noise when petunia was transferred to constant darkness (Table 3). The CV was in general higher under constant darkness, suggesting that the transcriptional noise tended to increase in DD. The exceptions were PhGI1 and PhELF4 in leaves and PhCHL, PhFKF, PhGI1, and PhGI2 in petals, displaying slightly higher CV under a LD cycle. We confirmed that the effect was tissue dependent, as changes in CV were significant (p < 0.05) in leaves for PhPRR7b, PhFKF, and PhGI1 and in petals, for PhPRR7a, PhPRR3, and PhELF4 (Table 3). The only gene affected in leaves and petals was PhCHL, but it also displayed opposite trends of increased CV (Table 3). This indicates that an endogenous component governs transcriptional noise of the clock genes, which also differs in leaves and petals.
4. Discussion
4.1. The Petunia Clock Genes Show Structural Evolutionary Changes
The evolution of the plant circadian clock is considered an important driver of adaptation in a variety of plants including tomato, Opuntia ficus-indica, or barley [40,72,73,74]. The plant clock is an important coordinator of primary and secondary metabolism in plants. It defines the timing of floral scent emission and floral blend in a variety of plants including Antirrhinum majus, Nicotiana attenuatta, or Petunia [35,36,37,38]. The plant circadian clock appears to have a specific transcriptional structure in different tissues such as leaves, pods, seeds, or roots [13,14,75,76]. As the transcriptional structure of the clock in petals is currently unknown, we used Petunia hybrida to perform a detailed analysis. We characterized the structural changes in PhPRR5a, PhPRR5b, PhPRR7a, PhPRR7b, PhGI1, and PhGI2 and the transcriptional structure of the petunia circadian clock and associated genes in petals and leaves, using standard growth and continuous darkness.
The complete genome paleohexaploidization of petunia, found in the Solanaceae group [11] is reflected in the retaining of several clock genes as duplications that are found as single copy genes in Arabidopsis and other species. These include PhPRR5a, PhPRR5b, PhPRR7a, PhPRR7b, PhGI1, and PhGI2. Other genes that are found as single copy include PhLHY, PhPRR9, PhPRR3, PhTOC1, PhFKF, and PhCHL the ortholog of ZTL. Interestingly, genes found as single copy in petunia such as PhTOC1, PhPRR9, and PhPRR3 are found as single copy in most Solanaceae except for Nicotiana benthamiana that appears to have two copies of each gene (Figure 1). Two of the petunia paralogs of AtPRR7, PhPRR7a, PinfS6PRR7a and the ones corresponding to AtPRR5 PhPRR5a, and PinfS6PRR5a cluster between Arabidopsis and the rest of the Solanaceae genes. In contrast the single copy genes TOC1, PRR3, and PRR9 are found as a subclade for all the Solanaceae together including Petunia. This indicates that there has been a loss of PRR5 and PRR7 paralogs in the Solanaceae that have a single copy gene, while Petunia has retained the older copy closer to the Arabidopsis, Vitis vinifera, and Amborella trichopoda genes. The additional changes observed in the number of exons indicate a specific evolution of one paralog. Indeed, AtPRR5 has six exons whereas AtPRR7 presents nine exons (NP_568446.2 and AT5G02810, consulted in NCIB and TAIR database) while PhPRR5a and PhPRR7b present seven exons whereas PhPRR5b and PhPRR7a have eight exons, indicating possible sub or neofunctionalization of these paralogs (see below).
We found two domains, PR and CCT in all analyzed TOC1, PRR3, PRR5, and PRR9 sequences. In contrast, the CCT domain was absent in most PRR7 paralogs in Capsicum spp., Petunia spp., Solanum spp. and Nicotiana spp. Interestingly, we only found the CCT domain in PhPRR7a, which shared more similarities in the amino acids sequence with AtPRR7. The lack of CCT domains in Solanaceae but not in the related Convolvulaceae family suggests that this event occurred in the early history of Solanaceae. In addition, this alteration, which has been described in PRR orthologs in crops such as rice and soybean, can modify growth and flowering time [77,78]. This may result in a specific clock in the Solanaceae family.
The current hypothesis about the transcriptional structure of the plant circadian clock includes a three component repressilator structure [64]. The PRR9, 7, and 5 genes function as transcriptional repressors in Arabidopsis [59]. The interaction between PRR9, 7, and 5 with TOPLESS occurs via two motifs. We found that the repression motifs were lost in the PhPRR5a and PinfS6PRR5a but was present in the rest of the paralogs of the PRR9, 5, and 3 genes. In addition, in P. axillaris PRR7b repression motif was interrupted by a sequence of 26 amino acids. This may result in the loss of gene repression activity of PRR5a and PRR7b [79]. Our results thus indicate that one of the repressilator loops in Petunia is maintained by one of the paralogs, while the second one PRR5a and PRR7b missing the repression domain may have undergone neofunctionalization.
The gene GI appeared in land plants and is absent in mosses or picoalgae [80]. In the Solanaceae we found two to three copies, and in Petunia hybrida, there are significant differences in the coding region between PhGI1 and PhGI2 suggesting a diversification of functions. Furthermore, the amino acid differences between P. axillaris and P. inflata indicate species specific changes in this master regulator that may be related to the differing environmental niches where both species grow.
We used the predicted protein sequences to infer the domain structure of GIGANTEA. Although a previous study describes that GI encodes a protein with six transmembrane domains [63], the biochemical functions of GI are not understood. In yeast, two hybrid experiments performed with the Arabidopsis GI protein show that the N-terminal domain interacts with FKF1 [81], while the complete protein shows interactions with the CYCLING DOF FACTOR6 and DELLA protein [82,83]. As the differences in protein structure found between PhGI1 and PhGI2 do not match well known domains we cannot understand their functional differences. Nevertheless, the PinfS6GI3 does lack the N terminus required for interactions with FKF1 and ZTL in Arabidopsis.
4.2. Daily Expression of Petunia Clock Genes is Tissue Specific
The current transcriptional model of the plant circadian clock is largely based on the expression of genes in the Arabidopsis hypocotyls and leaves [84]. It includes the morning, midday or core, and the evening loops. During the morning, the genes CCA1 and LHY repress the evening genes GI and TOC1 and activate PRR9 and PRR7. At the same time, TOC1 acts repressing GI and PRR9 but activating CCA1/LHY. On the other hand, GI stabilizes ZTL that is a TOC1 repressor [85].
Previous studies have revealed that the circadian clock is tissue-specific [14,75,76]. Differential expression of clock genes has been reported in several tissues including seeds, roots, leaves, stems, and flowers at several developmental stages in different plant species such as bamboo [86], radish [87], or daisy [88].
Changes in gene expression of timing, quantity, and rhythm may hint at possible subfunctionalization or neofunctionalization of duplicated clock genes. We found that gene expression patterns of PhPRR5 and PhGI paralogs differed in petals and leaves respectively, under a light:dark cycle. PhPRR5b and PhGI2 displayed an advanced phase, peaking before PhPRR5a and PhGI1. Under DD, PhPRR5b was delayed 3 h in leaves. In petals, PhPRR7a advanced 6 h while PhPRR7b delayed 9 h. Given the differences in protein structure observed between PhPRR5a, PhPRR5b, PhPRR7a, and PhPRR7b, and the drastic changes in expression pattern we can conclude that these paralogs have undergone important changes in biological function. As changes are tissue specific, it appears that the coordination of the clock in petals differs from the canonical expression in leaves.
4.3. Leaves and Petals have Different Clock Coordination
The current hypothesis is that several independent inputs such as light, temperature, or sugar act as signals helping the plant clock to remain stable. One of the signals considered differing between tissues is light [89]. In the present work we explored oscillations in gene expression in leaves and petals that do not differ in their exposure to light or temperature. We used the RAIN algorithm, a non-parametric method which also provided measures of phase [50]. We also performed an HANOVA test comparing tissues and light conditions. The core clock genes LHY and TOC1 are found in basal picoeukaryotes, mosses, Marchantia polymorpha, and all higher plants [5,80,90]. We found that PhLHY and PhPRR9 did not show any statistical differences regardless the tissue or light cycle. In contrast, PhTOC1 expression pattern differed between leaves and petals in LD, i.e., standard growing conditions. This indicates a basal change in the clock coordination between both tissues. This scenario may be further supported by the significant changes found for PhFKF, PhPRR3, PhGI1, and PhGI2 between tissues. Finally, PhGI1, a gene found only in flowering plants showed significant changes between tissues and photoperiods indicating that it may play a role in the coordination between development and environmental signals. An initial hypothesis proposed different clock structures in leaves and roots of Arabidopsis based on the light reception by the organs [14]. However work performed in cowpea shows that aerial organs exposed to light such as leaves, pods, or developing seeds show different transcriptional clock structures [76]. Our results indeed indicate a differential coordination of the leaf and petal clock that may be the result of the establishment of the petal identity by the floral organ identity genes.
4.4. Photoperiod Sensitivity is Organ-Specific
The effect of day length on biological clocks has been widely studied. For example, floral transition is controlled by CONSTANS (CO) and FLOWERING LOCUS T (FT) genes which are regulated by the circadian clock, including ELF3, ELF4, GI, LHY, PRRs, and ZTL genes [91,92,93]. These genes are capable to integrate environmental cues, mainly day length, but also temperature. Clock genes are therefore sensitive to ambient changes resulting in an adaptive advantage [85]. The present study revealed that a constant dark regime induced phase-shift even in the first 24 h. Most analyzed genes tended to delay their maximum expression, especially in leaves. Only PhLHY did not change its expression and displayed a robust oscillation in leaves and petals. Other genes, PhPRR7a and PhELF4 (in leaves), did not retain their rhythmicity, suggesting that the integration of environmental cues and phototransduction varies depending on the tissue. This is consistent with previous studies, that have reported the effect of light on organ-specific circadian clocks and photoperiodic sensitivity [14,94].
Constant dark also had an effect on oscillations, which in general tended to decrease in most analyzed genes in leaves and petals. Similar results have been reported in other plant species: LHY/CCA1, ELF4, GI, and TOC1 gene expression dampens under constant light or constant dark conditions in Arabidopsis [35,63,95,96]. Loss of circadian rhythmicity could be key and be involved in responses to environmental changes, such as seasonal dormancy during winter in Japanese cedar or chestnut [97,98].
4.5. Transcriptional Noise is Tissue-Specific and Depends on Photoperiod
One of the main features of the transcriptional structure of circadian clocks is the capacity to integrate noisy environmental signals and internal transcriptional variation [99]. The robustness of circadian oscillation is related to the number of mRNA molecules, interactions, and complex formation, and it is stabilized by the entrainment to the light:dark cycle [100].
In the present work we used a set of biological samples to analyze 13 genes under two light conditions and two tissues. We found that for the same set of samples some genes showed very high noise at a given time of the day, while others were very stable (Figure 5). We also found that molecular noise differed in leaves and petals and it was influenced by the time of the day. While in leaves highest stability appeared at the beginning of the subjective day, petals displayed the lowest stability. This was also noticeable when plants were transferred to continuous darkness. Interestingly, the time point with the highest transcriptional noise shifted both in leaves and petals. The lowest stability advanced in petals, and delayed in leaves. Furthermore, the increased transcriptional robustness early in the day in leaves, and in the late day-early night in petals, coincide with the major functional changes in both tissues, initiation of photosynthesis, and scent emission. As noise increases thereafter in both tissues, it could be that funneling transcriptional noise into robustness at certain times of the day may have biological implications to achieve consistent outputs. However, the molecular function, if any, is not understood as this is the first report of this phenomenon.
Taken together the differential transcriptional structure and response to light, we conclude that the circadian clock in leaves and petals show substantial differences, that may reflect the underlying function in controlling photosynthesis and secondary metabolism in both tissues. The functional differences between leaves and petals may rely in part on a circadian clock reprogramming during flower development.
Supplementary Materials
The following are available online at https://0-www-mdpi-com.brum.beds.ac.uk/2073-4425/10/11/860/s1, Figure S1: Metl or dissociation curve analysis of petunia genes, Figure S2: Exon-intron structure of Petunia axillaris (PaxiN) PRR5 and PRR7 genes, Figure S3: Domain structure of PSEUDO-RESPONSE REGULATORS (PRRs) , Figure S4: Local alignment of repression motifs of PRR5, Figure S5: Local alignment of GIGANTEA (GIs) proteins, Figure S6: Normalized expression (NE) for the biological replicates, Table S1: PSEUDO-RESPONSE REGULATORS (PRRs) protein accessions used in the phylogenetic reconstruction and for the annotation of protein sequences, Table S2: GIGANTEA (GI) protein accessions used in the phylogenetic reconstruction, Table S3: Primers used for qPCR,
Author Contributions
Conceptualization, M.I.T., J.W. and M.E.-C.; Data curation, M.I.T.; Formal analysis, M.I.T., M.C.-A. and M.E.-C.; Funding acquisition, J.W. and M.E.-C.; Investigation, M.I.T., M.C.-A. and M.E.-C.; Methodology, M.I.T., J.W. and M.E.-C.; Project administration, J.W. and M.E.-C.; Supervision, M.E.-C.; Validation, M.I.T.; Visualization, M.I.T. and J.W.; Writing—original draft, M.I.T., J.W. and M.E.-C.; Writing—review and editing, M.I.T., M.C.-A., J.W. and M.E.-C.
Funding
This work was developed under projects Fundación Séneca 19398/PI/14, MICINN-FEDER BFU-2013-45148-R and BFU-2017-88300-C2-1-R.
Conflicts of Interest
The authors declare no conflict of interest.
References
- Harmer, S.L. The Circadian System in Higher Plants. Ann. Rev. Plant Biol. 2009, 60, 357–377. [Google Scholar] [CrossRef] [Green Version]
- McClung, C.R. Plant circadian rhythms. Plant Cell 2006, 18, 792–803. [Google Scholar] [CrossRef]
- Hsu, P.Y.; Devisetty, U.K.; Harmer, S.L. Accurate timekeeping is controlled by a cycling activator in Arabidopsis. eLife 2013, 2, e00473. [Google Scholar] [CrossRef]
- Hernando, C.E.; Romanowski, A.; Yanovsky, M.J. Transcriptional and post-transcriptional control of the plant circadian gene regulatory network. Biochim. Biophys. Acta Gene Regul. Mech. 2017, 1860, 84–94. [Google Scholar] [CrossRef]
- Corellou, F.; Schwartz, C.; Motta, J.P.; Djouani-Tahri, E.; Sanchez, F.; Bouget, F.Y. Clocks in the Green Lineage: Comparative Functional Analysis of the Circadian Architecture of the Picoeukaryote Ostreococcus. Plant Cell 2009, 21, 3436–3449. [Google Scholar] [CrossRef]
- Djouani-Tahri, E.B.; Christie, J.M.; Sanchez-Ferandin, S.; Sanchez, F.; Bouget, F.Y.; Corellou, F. A eukaryotic LOV-histidine kinase with circadian clock function in the picoalga Ostreococcus. Plant J. 2011, 65, 578–588. [Google Scholar] [CrossRef]
- Airoldi, C.A.; Davies, B. Gene Duplication and the Evolution of Plant MADS-box Transcription Factors. J. Genet. Gen. 2012, 39, 157–165. [Google Scholar] [CrossRef]
- Wendel, J.F.; Jackson, S.A.; Meyers, B.C.; Wing, R.A. Evolution of plant genome architecture. Genome Biol. 2016, 17, 37. [Google Scholar] [CrossRef]
- Adams, K.L.; Wendel, J.F. Polyploidy and genome evolution in plants. Curr. Opin. Plant Biol. 2005, 8, 135–141. [Google Scholar] [CrossRef]
- Lou, P.; Wu, J.; Cheng, F.; Cressman, L.G.; Wang, X.; McClung, C.R. Preferential Retention of Circadian Clock Genes during Diploidization following Whole Genome Triplication in Brassica Rapa. Plant Cell 2012, 24, 2415–2426. [Google Scholar] [CrossRef]
- Bombarely, A.; Moser, M.; Amrad, A.; Bao, M.; Bapaume, L.; Barry, C.S.; Bliek, M.; Boersma, M.R.; Maaike, B.; Lorenzo, B.; et al. Insight into the evolution of the Solanaceae from the parental genomes of Petunia hybrida. Nat. Plants 2016, 2, 1–9. [Google Scholar] [CrossRef]
- Takahashi, N.; Hirata, Y.; Aihara, K.; Mas, P. A Hierarchical Multi-Oscillator Network Orchestrates the Arabidopsis Circadian System. Cell 2015, 163, 148–159. [Google Scholar] [CrossRef]
- James, A.B.; Monreal, J.A.; Nimmo, G.A.; Kelly, C.L.; Herzyk, P.; Jenkins, G.I.; Nimmo, H.G. The Circadian Clock in Arabidopsis Roots Is a Simplified Slave Version of the Clock in Shoots. Science 2008, 322, 1832–1835. [Google Scholar] [CrossRef]
- Bordage, S.; Sullivan, S.; Laird, J.; Millar, A.J.; Nimmo, H.G. Organ specificity in the plant circadian system is explained by different light inputs to the shoot and root clocks. New Phytol. 2016, 212, 136–149. [Google Scholar] [CrossRef]
- Theissen, G.; Becker, A. Gymnosperm orthologues of class B floral homeotic genes and their impact on understanding flower origin. Crit. Rev. Plant Sci. 2004, 23, 129–148. [Google Scholar] [CrossRef]
- Schwarz-Sommer, Z.; Hue, I.; Huijser, P.; Flor, P.J.; Hansen, R.; Tetens, F.; Lönnig, W.E.; Saedler, H.; Sommer, H. Characterization of the Antirrhinum floral homeotic MADS-box gene deficiens: Evidence for DNA binding and autoregulation of its persistent expression throughout flower development. EMBO J. 1992, 11, 251–263. [Google Scholar] [CrossRef]
- Goto, K.; Meyerowitz, E.M. Function and Regulation of the Arabidopsis Floral Homeotic Gene Pistillata. Genes Dev. 1994, 8, 1548–1560. [Google Scholar] [CrossRef]
- Jack, T.; Fox, G.L.; Meyerowitz, E.M. Arabidopsis homeotic gene APETALA3 ectopic expression: Transcriptional and posttranscriptional regulation determine floral organ identity. Cell 1994, 76, 703–716. [Google Scholar] [CrossRef]
- Vandenbussche, M.; Zethof, J.; Royaert, S.; Weterings, K.; Gerats, T. The duplicated B-class heterodimer model: Whorl-specific effects and complex genetic interactions in Petunia hybrida flower development. Plant Cell 2004, 16, 741–754. [Google Scholar] [CrossRef]
- Samach, A.; Kohalmi, S.E.; Motte, P.; Datla, R.; Haughn, G.W. Divergence of function and regulation of class B floral organ identity genes. Plant Cell 1997, 9, 559–570. [Google Scholar]
- Zachgo, S.; Silva, E.D.; Motte, P.; Trobner, W.; Saedler, H.; Schwarz-Sommer, Z. Functional analysis of the Antirrhinum floral homeotic deficiens gene in vivo and in vitro by using a temperature-sensitive mutant. Development 1995, 121, 2861–2875. [Google Scholar]
- Manchado-Rojo, M.; Delgado-Benarroch, L.; Roca, M.J.; Weiss, J.; Egea-Cortines, M. Quantitative levels of Deficiens and Globosa during late petal development show a complex transcriptional network topology of B function. Plant J. 2012, 72, 294–307. [Google Scholar] [CrossRef]
- Delgado-Benarroch, L.; Weiss, J.; Egea-Cortines, M. Floral organ size control. Plant Signal. Behav. 2009, 4, 814–817. [Google Scholar] [CrossRef] [Green Version]
- Manchado-Rojo, M.; Weiss, J.; Egea-Cortines, M. Validation of Aintegumenta as a gene to modify floral size in ornamental plants. Plant Biotechnol. J. 2014, 12, 1053–1065. [Google Scholar] [CrossRef]
- Muhlemann, J.K.; Maeda, H.; Chang, C.Y.; Miguel, P.S.; Baxter, I.; Cooper, B.; Perera, M.A.; Nikolau, B.J.; Vitek, O.; Morgan, J.A.; et al. Developmental Changes in the Metabolic Network of Snapdragon Flowers. PLoS ONE 2012, 7, e40381. [Google Scholar] [CrossRef]
- Weiss, J.; Mühlemann, J.K.; Ruiz-Hernández, V.; Dudareva, N.; Egea-Cortines, M. Phenotypic Space and Variation of Floral Scent Profiles during Late Flower Development in Antirrhinum. Front. Plant Sci. 2016, 7, 1–12. [Google Scholar] [CrossRef]
- Shaw, J.-F.; Chen, H.-H.; Tsai, M.-F.; Kuo, C.-I.; Huang, L.-C. Extended flower longevity of Petunia hybrida plants transformed with boers, a mutated ERS gene of Brassica oleracea. Mol. Breed. 2002, 9, 211–216. [Google Scholar] [CrossRef]
- Van Doorn, W.G.; Woltering, E.J. Physiology and molecular biology of petal senescence. J. Exp. Bot. 2008, 59, 453–480. [Google Scholar] [CrossRef] [Green Version]
- Liu, J.; Li, J.; Wang, H.; Fu, Z.; Liu, J.; Yu, Y. Identification and expression analysis of ERF transcription factor genes in Petunia during flower senescence and in response to hormone treatments. J. Exp. Bot. 2011, 62, 825–840. [Google Scholar] [CrossRef]
- Verdonk, J.C.; Ric de Vos, C.H.; Verhoeven, H.A.; Haring, M.A.; van Tunen, A.J.; Schuurink, R.C. Regulation of floral scent production in Petunia revealed by targeted metabolomics. Phytochemistry 2003, 62, 997–1008. [Google Scholar] [CrossRef]
- Ruíz-Ramón, F.; Águila, D.J.; Egea-Cortines, M.; Weiss, J. Optimization of fragrance extraction: Daytime and flower age affect scent emission in simple and double narcissi. Ind. Crops Prod. 2014, 52, 671–678. [Google Scholar] [CrossRef]
- Helsper, J.P.F.G.; Davies, J.A.; Bouwmeester, H.J.; Krol, A.F.; Kampen, M.H.V.; van Kampen, M.H. Circadian rhythmicity in emission of volatile compounds by flowers of Rosa hybrida L. cv. Honesty. Planta 1998, 207, 88–95. [Google Scholar] [CrossRef]
- Kolosova, N.; Gorenstein, N.; Kish, C.M.; Dudareva, N. Regulation of Circadian Methyl Benzoate Emission in Diurnally and Nocturnally Emitting Plants. Plant Cell 2001, 13, 2333–2347. [Google Scholar] [CrossRef] [PubMed] [Green Version]
- Hoballah, M.E.; Stuurman, J.; Turlings, T.C.J.; Guerin, P.M.; Connétable, S.; Kuhlemeier, C.; Connetable, S.; Kuhlemeier, C. The composition and timing of flower odour emission by wild Petunia axillaris coincide with the antennal perception and nocturnal activity of the pollinator Manduca sexta. Planta 2005, 222, 141–150. [Google Scholar] [CrossRef]
- Fenske, M.P.; Hewett Hazelton, K.D.; Hempton, A.K.; Shim, J.S.; Yamamoto, B.M.; Riffell, J.A.; Imaizumi, T. Circadian clock gene LATE ELONGATED HYPOCOTYL directly regulates the timing of floral scent emission in Petunia. Proc. Natl. Acad. Sci. USA 2015, 112, 9775–9780. [Google Scholar] [CrossRef]
- Yon, F.; Joo, Y.; Cort, L.; Rothe, E.; Baldwin, I.T.; Kim, S.; Kim, S. Silencing Nicotiana attenuata LHY and ZTL alters circadian rhythms in flowers. New Phytol. 2015, 209, 1058–1066. [Google Scholar] [CrossRef]
- Terry, M.I.; Pérez-Sanz, F.; Díaz-Galián, M.V.; Pérez de los Cobos, F.; Navarro, P.J.; Egea-Cortines, M.; Weiss, J. The Petunia Chanel Gene is a Zeitlupe Ortholog Coordinating Growth and Scent Profiles. Cells 2019, 8, 343. [Google Scholar] [CrossRef]
- Terry, M.I.; Pérez-Sanz, F.; Navarro, P.J.; Weiss, J.; Egea-Cortines, M. The Snapdragon Late Elongated Hypocotyl Plays A Dual Role in Activating Floral Growth and Scent Emission. Cells 2019, 8, 920. [Google Scholar] [CrossRef]
- Raguso, R.A.; Levin, R.A.; Foose, S.E.; Holmberg, M.W.; McDade, L.A. Fragrance chemistry, nocturnal rhythms and pollination “syndromes” in Nicotiana. Phytochemistry 2003, 63, 265–284. [Google Scholar] [CrossRef]
- Mallona, I.; Egea-Cortines, M.; Weiss, J. Conserved and divergent rhythms of CAM-related and core clock gene expression in the cactus Opuntia ficus-indica. Plant Physiol. 2011, 156, 1978–1989. [Google Scholar] [CrossRef]
- Li, M.; Zhang, D.; Gao, Q.; Luo, Y.; Zhang, H.; Ma, B.; Chen, C.; Whibley, A.; Zhang, Y.; Cao, Y.; et al. Genome structure and evolution of Antirrhinum majus L. Nat. Plants 2019, 5, 174. [Google Scholar] [CrossRef] [PubMed]
- Birney, E.; Clamp, M.; Durbin, R. GeneWise and Genomewise. Genome Res. 2004, 14, 988–995. [Google Scholar] [CrossRef] [PubMed] [Green Version]
- Larkin, M.A.; Blackshields, G.; Brown, N.P.; Chenna, R.; McGettigan, P.A.; McWilliam, H.; Valentin, F.; Wallace, I.M.; Wilm, A.; Lopez, R.; et al. Clustal W and clustal X v2.0. Bioinformatics 2007, 23, 2947–2948. [Google Scholar] [CrossRef]
- Kumar, S.; Stecher, G.; Li, M.; Knyaz, C.; Tamura, K. Mega X: Molecular Evolutionary Genetics Analysis across Computing Platforms. Mol. Biol. Evol. 2018, 35, 1547–1549. [Google Scholar] [CrossRef] [PubMed]
- Jones, D.T.; Taylor, W.R.; Thornton, J.M. The rapid generation of mutation data matrices from protein sequences. Bioinformatics 1992, 8, 275–282. [Google Scholar] [CrossRef]
- Makino, S.; Kiba, T.; Imamura, A.; Hanaki, N.; Nakamura, A.; Suzuki, T.; Taniguchi, M.; Ueguchi, C.; Sugiyama, T.; Mizuno, T. Genes Encoding Pseudo-Response Regulators: Insight into His-to-Asp Phosphorelay and Circadian Rhythm in Arabidopsis thaliana. Plant Cell Physiol. 2000, 41, 791–803. [Google Scholar] [CrossRef]
- Yu, G.; Smith, D.K.; Zhu, H.; Guan, Y.; Lam, T.T.-Y. ggtree: An r package for visualization and annotation of phylogenetic trees with their covariates and other associated data. Methods Ecol. Evol. 2017, 8, 28–36. [Google Scholar] [CrossRef]
- Hulo, N.; Bairoch, A.; Bulliard, V.; Cerutti, L.; De Castro, E.; Langendijk-Genevaux, P.S.; Pagni, M.; Sigrist, C.J.A. The Prosite Database. Nucl. Acids Res. 2006, 34, D227–D230. [Google Scholar] [CrossRef]
- Brennan, P. DrawProteins: A Bioconductor/R package for reproducible and programmatic generation of protein schematics. F1000Res 2018, 7, 1–15. [Google Scholar] [CrossRef]
- Thaben, P.F.; Westermark, P.O. Detecting rhythms in time series with RAIN. J. Biol. Rhythms 2014, 29, 391–400. [Google Scholar] [CrossRef]
- Thaben, P.F.; Westermark, P.O. Differential rhythmicity: Detecting altered rhythmicity in biological data. Bioinformatics 2016, 32, 2800–2808. [Google Scholar] [CrossRef] [PubMed]
- Wickman, H. ggplot2—Elegant Graphics for Data Analysis (2nd Edition). J. Stat. Softw. 2017, 77, 3–5. [Google Scholar]
- Box, M.S.; Coustham, V.; Dean, C.; Mylne, J.S. Protocol: A simple phenol-based method for 96-well extraction of high quality RNA from Arabidopsis. Plant Methods 2011, 7, 7. [Google Scholar] [CrossRef] [PubMed]
- Mallona, I.; Lischewsky, S.; Weiss, J.; Hause, B.; Egea-Cortines, M.; Mallona, I.; Lischewsky, S.; Weiss, J.; Hause, B.; Egea-Cortines, M.; et al. Validation of reference genes for quantitative real-time PCR during leaf and flower development in Petunia hybrida. BMC Plant Biol. 2010, 10, 4. [Google Scholar] [CrossRef] [PubMed]
- Mallona, I.; Weiss, J.; Egea-Cortines, M. pcrEfficiency: A Web tool for PCR amplification efficiency prediction. BMC Bioinf. 2011, 12, 404. [Google Scholar] [CrossRef]
- Simon, P. Q-Gene: Processing quantitative real-time RT-PCR data. Bioinformatics 2003, 19, 1439–1440. [Google Scholar] [CrossRef]
- Cortijo, S.; Aydin, Z.; Ahnert, S.; Locke, J.C. Widespread inter-individual gene expression variability in Arabidopsis thaliana. Mol. Syst. Biol. 2019, 15, e8591. [Google Scholar] [CrossRef]
- Uemura, M.; Takata, N.; Saito, S.; Saito, C.T.; Uemura, M. Phylogenetic footprint of the plant clock system in angiosperms: Evolutionary processes of Pseudo-Response Regulators. BMC Evolut. Biol. 2010, 10, 126. [Google Scholar]
- Nakamichi, N.; Kiba, T.; Henriques, R.; Mizuno, T.; Chua, N.-H.; Sakakibara, H. Pseudo-response regulators 9, 7, and 5 are transcriptional repressors in the Arabidopsis circadian clock. Plant cell 2010, 22, 594–605. [Google Scholar] [CrossRef]
- Causier, B.; Ashworth, M.; Guo, W.; Davies, B. The Topless Interactome: A Framework for Gene Repression in Arabidopsis. Plant Physiol. 2012, 158, 423–438. [Google Scholar] [CrossRef]
- Wang, L.; Kim, J.; Somers, D.E. Transcriptional corepressor topless complexes with pseudoresponse regulator proteins and histone deacetylases to regulate circadian transcription. Proc. Natl. Acad. Sci. USA 2013, 110, 761–766. [Google Scholar] [CrossRef] [PubMed]
- Fowler, S.; Lee, K.; Onouchi, H.; Samach, A.; Richardson, K.; Morris, B.; Coupland, G.; Putterill, J. Gigantea: A circadian clock-controlled gene that regulates photoperiodic flowering in Arabidopsis and encodes a protein with several possible membrane-spanning domains. EMBO J. 1999, 18, 4679–4688. [Google Scholar] [CrossRef] [PubMed]
- Park, D.H.; Somers, D.E.; Kim, Y.S.; Choy, Y.H.; Lim, H.K.; Soh, M.S.; Kim, H.J.; Kay, S.A.; Nam, H.G. Control of Circadian Rhythms and Photoperiodic Flowering by the Arabidopsis Gigantea Gene. Science 1999, 285, 1579–1582. [Google Scholar] [CrossRef] [PubMed]
- Pokhilko, A.; Fernández, A.P.; Edwards, K.D.; Southern, M.M.; Halliday, K.J.; Millar, A.J. The clock gene circuit in Arabidopsis includes a repressilator with additional feedback loops. Mol. Syst. Biol. 2012, 8, 574. [Google Scholar] [CrossRef]
- Lu, S.X.; Webb, C.J.; Knowles, S.M.; Kim, S.H.J.; Wang, Z.; Tobin, E.M. CCA1 and ELF3 Interact in the Control of Hypocotyl Length and Flowering Time in Arabidopsis. Plant Physiol. 2012, 158, 1079–1088. [Google Scholar] [CrossRef]
- Pruneda-Paz, J.L.; Breton, G.; Para, A.; Kay, S.A. A Functional Genomics Approach Reveals CHE as a Component of the Arabidopsis Circadian Clock. Science 2009, 323, 1481–1485. [Google Scholar] [CrossRef]
- Wu, J.-F.; Tsai, H.-L.; Joanito, I.; Wu, Y.-C.; Chang, C.-W.; Li, Y.-H.; Wang, Y.; Hong, J.C.; Chu, J.-W.; Hsu, C.-P.; et al. LWD–TCP complex activates the morning gene CCA1 in Arabidopsis. Nat. Commun. 2016, 7, 1–10. [Google Scholar] [CrossRef]
- Xie, Q.; Wang, P.; Liu, X.; Yuan, L.; Wang, L.; Zhang, C.; Li, Y.; Xing, H.; Zhi, L.; Yue, Z.; et al. LNK1 and LNK2 Are Transcriptional Coactivators in the Arabidopsis Circadian Oscillator. Plant Cell 2014, 26, 2843–2857. [Google Scholar] [CrossRef]
- Nohales, M.A.; Kay, S.A. Molecular mechanisms at the core of the plant circadian oscillator. Nat. Struct. Mol. Biol. 2016, 23, 1061–1069. [Google Scholar] [CrossRef]
- Mack, G.A.; Wolfe, D.A. K-Sample Rank Tests for Umbrella Alternatives. J. Am. Stat. Assoc. 1981, 76, 175–181. [Google Scholar]
- Somers, D.E.; Devlin, P.F.; Kay, S.A. Phytochromes and Cryptochromes in the Entrainment of the Arabidopsis Circadian Clock. Science 1998, 282, 1488–1490. [Google Scholar] [CrossRef] [PubMed]
- Zakhrabekova, S.; Gough, S.P.; Braumann, I.; Müller, A.H.; Lundqvist, J.; Ahmann, K.; Dockter, C.; Matyszczak, I.; Kurowska, M.; Druka, A.; et al. Induced mutations in circadian clock regulator Mat-a facilitated short-season adaptation and range extension in cultivated barley. PNAS 2012, 109, 4326–4331. [Google Scholar] [CrossRef] [PubMed]
- Müller, N.A.; Wijnen, C.L.; Srinivasan, A.; Ryngajllo, M.; Ofner, I.; Lin, T.; Ranjan, A.; West, D.; Maloof, J.N.; Sinha, N.R.; et al. Domestication selected for deceleration of the circadian clock in cultivated tomato. Nat. Genet. 2016, 48, 89–93. [Google Scholar] [CrossRef] [PubMed]
- Müller, N.A.; Zhang, L.; Koornneef, M.; Jiménez-Gómez, J.M. Mutations in EID1 and LNK2 caused light-conditional clock deceleration during tomato domestication Proc. Natl. Acad. Sci. 2018, 7135–7140. [Google Scholar] [CrossRef] [PubMed]
- Thain, S.C.; Murtas, G.; Lynn, J.R.; McGrath, R.B.; Millar, A.J. The circadian clock that controls gene expression in Arabidopsis is tissue specific. Plant Physiol. 2002, 130, 102–110. [Google Scholar] [CrossRef]
- Weiss, J.; Terry, M.; Martos-Fuentes, M.; Letourneux, L.; Ruiz-Hernández, V.; Fernández, J.A.; Egea-Cortines, M. Diel pattern of circadian clock and storage protein gene expression in leaves and during seed filling in cowpea (Vigna unguiculata). BMC Plant Biol. 2018, 18, 33–53. [Google Scholar] [CrossRef]
- Lenser, T.; Theißen, G. Molecular mechanisms involved in convergent crop domestication. Trends Plant Sci. 2013, 18, 704–714. [Google Scholar] [CrossRef]
- Li, M.-W.; Liu, W.; Lam, H.-M.; Gendron, J.M. Characterization of Two Growth Period QTLs Reveals Modification of PRR3 Genes During Soybean Domestication. Plant Cell Physiol. 2019, 60, 407–420. [Google Scholar] [CrossRef]
- Toda, Y.; Kudo, T.; Kinoshita, T.; Nakamichi, N. Evolutionary Insight into the Clock-Associated PRR5 Transcriptional Network of Flowering Plants. Sci. Rep. 2019, 9, 1–14. [Google Scholar] [CrossRef]
- Linde, A.-M.; Eklund, D.M.; Kubota, A.; Pederson, E.R.A.; Holm, K.; Gyllenstrand, N.; Nishihama, R.; Cronberg, N.; Muranaka, T.; Oyama, T.; et al. Early evolution of the land plant circadian clock. New Phytol. 2017, 216, 576–590. [Google Scholar] [CrossRef] [Green Version]
- Sawa, M.; Nusinow, D.A.; Kay, S.A.; Imaizumi, T. FKF1 and gigantea complex formation is required for day-length measurement in Arabidopsis. Science 2007, 318, 261–265. [Google Scholar] [CrossRef] [PubMed]
- Krahmer, J.; Goralogia, G.S.; Kubota, A.; Zardilis, A.; Johnson, R.S.; Song, Y.H.; MacCoss, M.J.; Bihan, T.L.; Halliday, K.J.; Imaizumi, T.; et al. Time-resolved interaction proteomics of the gigantea protein under diurnal cycles in Arabidopsis. FEBS Lett. 2019, 593, 319–338. [Google Scholar] [CrossRef] [PubMed]
- Nohales, M.A.; Kay, S.A. GIGANTEA gates gibberellin signaling through stabilization of the DELLA proteins in Arabidopsis. PNAS 2019, 201913532. [Google Scholar] [CrossRef] [PubMed]
- Staiger, D.; Shin, J.; Johansson, M.; Davis, S.J. The circadian clock goes genomic. Genome Biol. 2013, 14, 208. [Google Scholar] [CrossRef]
- Pokhilko, A.; Hodge, S.K.; Stratford, K.; Knox, K.; Edwards, K.D.; Thomson, A.W.; Mizuno, T.; Millar, A.J. Data assimilation constrains new connections and components in a complex, eukaryotic circadian clock model. Mol. Syst. Biol. 2010, 6, 1–10. [Google Scholar] [CrossRef]
- Dutta, S.; Biswas, P.; Chakraborty, S.; Mitra, D.; Pal, A.; Das, M. Identification, characterization and gene expression analyses of important flowering genes related to photoperiodic pathway in bamboo. BMC Genom. 2018, 19, 1–19. [Google Scholar] [CrossRef] [Green Version]
- Wang, J.; Qiu, Y.; Cheng, F.; Chen, X.; Zhang, X.; Wang, H.; Song, J.; Duan, M.; Yang, H.; Li, X. Genome-wide identification, characterization, and evolutionary analysis of flowering genes in radish (Raphanus sativus L.). BMC Genom. 2017, 18, 1–10. [Google Scholar] [CrossRef]
- Fu, J.; Yang, L.; Dai, S. Conservation of Arabidopsis thaliana circadian clock genes in Chrysanthemum lavandulifolium. Plant Physiol. Biochem. 2014, 80, 337–347. [Google Scholar] [CrossRef]
- Endo, M. Tissue-specific circadian clocks in plants. Curr. Opin. Plant Biol. 2016, 29, 44–49. [Google Scholar] [CrossRef] [Green Version]
- Holm, K.; Källman, T.; Gyllenstrand, N.; Hedman, H.; Lagercrantz, U. Does the core circadian clock in the moss Physcomitrella patens (Bryophyta) comprise a single loop? BMC Plant Biol. 2010, 10, 109. [Google Scholar] [CrossRef]
- Samach, A.; Onouchi, H.; Gold, S.E.; Ditta, G.S.; Schwarz-Sommer, Z.; Yanofsky, M.F.; Coupland, G. Distinct Roles of Constans Target Genes in Reproductive Development of Arabidopsis. Science 2000, 288, 1613–1616. [Google Scholar] [CrossRef] [PubMed]
- Suárez-López, P.; Wheatley, K.; Robson, F.; Onouchi, H.; Valverde, F.; Coupland, G. Constans mediates between the circadian clock and the control of flowering in Arabidopsis. Nature 2001, 410, 1116–1120. [Google Scholar] [CrossRef] [PubMed]
- Valverde, F.; Mouradov, A.; Soppe, W.; Ravenscroft, D.; Samach, A.; Coupland, G. Photoreceptor Regulation of Constans Protein in Photoperiodic Flowering. Science 2004, 303, 1003–1006. [Google Scholar] [CrossRef] [PubMed]
- Shimizu, H.; Araki, T.; Endo, M. Photoperiod sensitivity of the Arabidopsis circadian clock is tissue-specific. Plant Signal. Behav. 2015, 10, 5–6. [Google Scholar] [CrossRef] [PubMed]
- Wang, Z.-Y.; Tobin, E.M. Constitutive Expression of the Circadian Clock Associated 1 (CCA1) Gene Disrupts Circadian Rhythms and Suppresses Its Own Expression. Cell 1998, 93, 1207–1217. [Google Scholar] [CrossRef]
- Liew, L.C.; Hecht, V.; Sussmilch, F.C.; Weller, J.L. The Pea Photoperiod Response Gene STERILE NODES Is an Ortholog of LUX ARRHYTHMO. Plant Physiol. 2014, 165, 648–657. [Google Scholar] [CrossRef]
- Nose, M.; Watanabe, A. Clock genes and diurnal transcriptome dynamics in summer and winter in the gymnosperm Japanese cedar (Cryptomeria japonica (L.f.) D.Don). BMC Plant Biol. 2014, 14, 308. [Google Scholar]
- Ramos, A.; Pérez-Solís, E.; Ibáñez, C.; Casado, R.; Collada, C.; Gómez, L.; Aragoncillo, C.; Allona, I. Winter disruption of the circadian clock in chestnut. Proc. Natl. Acad. Sci. USA 2005, 102, 7037–7042. [Google Scholar] [CrossRef] [Green Version]
- Hogenesch, J.B.; Ueda, H.R. Understanding systems-level properties: Timely stories from the study of clocks. Nat. Rev. Genet. 2011, 12, 407–416. [Google Scholar] [CrossRef]
- Gonze, D.; Halloy, J.; Goldbeter, A. Robustness of circadian rhythms with respect to molecular noise. PNAS 2002, 99, 673–678. [Google Scholar] [CrossRef] [Green Version]
Figure 1.
PSEUDO-RESPONSE REGULATORS (PRRs) phylogenetic tree. Pseudo-receiver (PR) amino acid sequences were aligned using CLUSTALX. Phylogenetic analysis was performed using MEGA X and trees were plotted with the library “ggtree” (R version 3.5.1). The phylogenetic tree was estimated using the neighbor-joining algorithm (NJ) JTT (Jones, Taylor and Thornton) as model of amino acid substitution. The tree shows the bootstrap percentage (from 500 replicates) next to branches. The tree was plotted to scale (A). The multiple sequence alignment is showed on the right side (B). This tree contains 69 sequences from 14 species. Species abbreviations: A.majus (Antirrhinum majus), A.thaliana (Arabidopsis thaliana), A.trichopoda (Amborella trichopoda), C.annuum (Capsicum annuum), N.attenuata (Nicotiana attenuata), N.benthamiana (Nicotiana benthamiana), N.sylvestris (Nicotiana sylvestris), N.tomentosiformis (Nicotiana tomentosiformis), P.axillaris (Petunia axillaris), P.inflata (Petunia inflata), P.patens (Physcomitrella patens), S.lycopersicum (Solanum lycopersicum), S.tuberosum (Solanum tuberosum) and V.vinifera (Vitis vinifera). Accessions are listed in Table S1.

Figure 2.
Repression motifs of PSEUDO-RESPONSE REGULATORS (PRRs) local alignment. Arabidopsis thaliana (A.thaliana), Petunia axillaris (P.axillaris), and P. inflata (P.inflata), L(E/D)(L/I)S(L/I)(R/K)R and SXXSAF(S/T)(R/Q)(Y/F) regions are depicted by asterisks (*).
Figure 2.
Repression motifs of PSEUDO-RESPONSE REGULATORS (PRRs) local alignment. Arabidopsis thaliana (A.thaliana), Petunia axillaris (P.axillaris), and P. inflata (P.inflata), L(E/D)(L/I)S(L/I)(R/K)R and SXXSAF(S/T)(R/Q)(Y/F) regions are depicted by asterisks (*).

Figure 3.
GIGANTEA (GIs) phylogenetic tree. Amino acid sequences were aligned using CLUSTALX. Phylogenetic analysis was performed using MEGA X and trees were plotted with the library “ggtree” (R version 3.5.1). The phylogenetic trees were built with the neighbor-joining method (NJ) and JTT (Jones, Taylor and Thornton) as model of amino acid substitution. The tree displays the bootstrap percentage (from 500 replicates) next to branches (A). The multiple sequence alignment is displayed on the right side (B). This tree contains 35 sequences from 25 species. Species abbreviations: A.majus (Antirrhinum majus), A.thaliana (Arabidopsis thaliana), A.trichopoda (Amborella trichopoda), B.distachyon (Brachypodium distachyon), C.arietinum (Cicer arietinum), F.vesca (Fragaria vesca), G.max (Glycine max), M.polymorpha (Marchantia polymorpha), M.truncatula (Medicago truncatula), N.benthamiana (Nicotiana benthamiana), O.sativa (Oryza sativa), P.axillaris (Petunia axillaris), P.hallii (Panicum hallii), P.inflata (Petunia inflata), P.sativum (Pisum sativum), S.italica (Setaria italica), S.lycopersicum (Solanum lycopersicum), S.moellendorffii (Selaginella moellendorffii), S.tuberosum (Solanum tuberosum), S.viridis (Setaria viridis), T.aestivum (Triticum aestivum), S.italica (Setaria italica), V.radiata (Vigna radiata), V.unguiculata (Vigna unguiculata), V.vinifera (Vitis vinifera) and Z.mays (Zea mays). Accessions are listed in Table S2.

Figure 4.
Daily changes in gene expression in petunia. Expression of clock genes in leaves (red) and petals (blue) under a 12 light:dark cycle (LD) and constant darkness (DD). LD cycle is represented by a white and grey area whereas DD cycle is represented by a dark area. Gene expression is represented as mean normalized expression (NE), first every clock gene was normalized to PhACT and then, for each time point the expression was divided by the mean expression level. ZT 0 (zeitgeber time) denoting light on, and ZT12, light off. Results represent mean ± SD (n = 3).


Figure 5.
Variability in clock gene expression in petunia leaves (red) and petals (blue) under a light:dark cycle. Coefficient of variation (CV) was calculated for every clock gene and time point for leaves (red) and petals (blue). ZT 0 (zeitgeber time) indicates light on, ZT12 indicates light off. White area represents the light period and grey area, the dark period. The black triangle denotes a gene with low variation in both tissues and the white triangle, a gene with high variation. The white square indicates a gene with high CV in petals whereas the black square denotes a gene with high variation in leaves.


Table 1.
Rhythmic analysis of transcriptional data. Detection of rhythmicity in petunia clock genes in leaves and petals under a light:dark cycle (LD) and constant darkness (DD). This analysis was performed with a non-parametric method implemented in the Bioconductor package “RAIN”. Significant p-values (p < 0.05) indicate a robust oscillation. Phase denotes the time point with the maximum gene expression or peak.
| Gene | LD | DD | |||||||
|---|---|---|---|---|---|---|---|---|---|
| Leaf | Petal | Leaf | Petal | ||||||
| p-value | Phase | p-value | Phase | p-value | Phase | p-value | p-value | Phase | |
| PhPRR9 | 0.000 | 6 | 0.000 | 9 | 0.001 | 9 | 0.007 | 12 | 0.000 |
| PhPRR7a | 0.000 | 9 | 0.037 | 9 | 0.007 | 9 | 0.094 | 3 | 0.000 |
| PhPRR7b | 0.000 | 9 | 0.000 | 9 | 0.330 | 9 | 0.006 | 18 | 0.000 |
| PhPRR5a | 0.008 | 9 | 0.000 | 12 | 0.001 | 9 | 0.000 | 15 | 0.008 |
| PhPRR5b | 0.000 | 9 | 0.000 | 9 | 0.016 | 12 | 0.000 | 15 | 0.000 |
| PhPRR3 | 0.000 | 9 | 0.000 | 15 | 0.143 | 12 | 0.000 | 15 | 0.000 |
| PhTOC1 | 0.000 | 9 | 0.001 | 15 | 0.017 | 21 | 0.000 | 18 | 0.000 |
| PhGI1 | 0.000 | 9 | 0.007 | 12 | 0.000 | 12 | 0.000 | 18 | 0.000 |
| PhGI2 | 0.000 | 6 | 0.000 | 12 | 0.000 | 12 | 0.000 | 15 | 0.000 |
| PhELF4 | 0.074 | 12 | 0.011 | 12 | 0.000 | 15 | 0.000 | 18 | 0.074 |
| PhCHL | 0.251 | 9 | 0.059 | 9 | 0.380 | 0 | 0.075 | 15 | 0.251 |
| PhFKF | 0.000 | 9 | 0.004 | 15 | 0.001 | 9 | 0.000 | 12 | 0.000 |
| PhLHY | 0.000 | 0 | 0.030 | 0 | 0.005 | 0 | 0.000 | 0 | 0.000 |
Table 2.
Analysis of differential gene expression in petunia leaves and petals under two light conditions: light:dark (LD) and constant darkness (DD). We compared the daily gene expression of both tissues (petal vs. leaf), under light:dark and constant darkness. We also compared every single tissue under two light conditions (LD vs. DD). This analysis uses Harmonic ANOVA (HANOVA) to test differences in amplitude and phase. A p value < 0.05 indicated that the amplitude and/or phase were significantly different between tissues (petal vs. leaf) or between light conditions (LD vs. DD). Amp displays the tissue with the higher amplitude and Phase symbols + and – denotes delayed and advanced, respectively, per tissue or experimental condition.
| Petal vs. Leaf | LD vs. DD | |||||||||||
|---|---|---|---|---|---|---|---|---|---|---|---|---|
| Gene | LD | Amp | Phase | DD | Amp | Phase | Leaf | Amp | Phase | Petal | Amp | Phase |
| PhPRR9 | 0.364 | Leaf | +3 h petal | 0.626 | Leaf | +3 h petal | 0.588 | DD | +3 h DD | 0.459 | DD | +3 h DD |
| PhPRR7a | 0.588 | Leaf | No changes | 0.700 | Leaf | –6 h petal | 0.161 | LD | No changes | 0.988 | LD | –6 h DD |
| PhPRR7b | 0.196 | Leaf | No changes | 0.094 | Leaf | +9 h petal | 0.876 | LD | No changes | 0.035 | LD | +9 h DD |
| PhPRR5a | 0.061 | Petal | +3 h petal | 0.175 | Petal | +6 h petal | 0.464 | LD | No changes | 0.616 | LD | +3 h DD |
| PhPRR5b | 0.223 | Leaf | No changes | 0.169 | Petal | +3 h petal | 0.064 | LD | +3 h DD | 0.004 | DD | +6 h DD |
| PhPRR3 | 0.014 | Petal | +6 h petal | 0.151 | Petal | +3 h petal | 0.330 | LD | +12 h DD | 0.872 | LD | No changes |
| PhTOC1 | 0.012 | Petal | +6 h petal | 0.638 | Petal | –3 h petal | 0.033 | LD | +3 h DD | 0.399 | LD | +3 h DD |
| PhGI1 | 0.019 | Petal | +3 h petal | 0.109 | Petal | +6 h petal | 0.080 | LD | +3 h DD | 0.009 | LD | +6 h DD |
| PhGI2 | 0.291 | Petal | +6 h petal | 0.298 | Petal | +3 h petal | 0.041 | DD | +6 h DD | 0.012 | DD | +3 h DD |
| PhELF4 | 0.049 | Leaf | No changes | 0.131 | Petal | +3 h petal | 0.135 | DD | +3 h DD | 0.739 | DD | +6 h DD |
| PhCHL | 0.981 | Petal | No changes | 0.803 | Leaf | +15 h petal | 0.037 | DD | +3 h DD | 0.042 | DD | +6 h DD |
| PhFKF | 0.003 | Leaf | +6 h petal | 0.437 | Petal | +3 h petal | 0.479 | LD | No changes | 0.318 | DD | –3 h DD |
| PhLHY | 0.675 | Leaf | No changes | 0.205 | Petal | No changes | 0.254 | LD | No changes | 0.137 | DD | No changes |
Table 3.
Detection of changes in noise in petunia clock genes in two tissues, leaves and petals, comparing light:dark (LD) and constant darkness (DD) cycles. This analysis was performed by using the function HarmScaleTest provided by the R package DODR. A p value < 0.05 indicates significant changes between LD and DD, the phase with higher variability is specified in Noise columns.
| Gene | Leaf, LD vs. DD | Noise | Petal, LD vs. DD | Noise |
|---|---|---|---|---|
| PhPRR9 | 0.341 | DD | 0.508 | DD |
| PhPRR7a | 0.228 | DD | 0.002 | DD |
| PhPRR7b | 0.014 | DD | 0.958 | DD |
| PhPRR5a | 0.137 | DD | 0.312 | DD |
| PhPRR5b | 0.839 | DD | 0.805 | DD |
| PhPRR3 | 0.385 | DD | 0.004 | DD |
| PhTOC1 | 0.575 | DD | 0.137 | DD |
| PhGI1 | 0.000 | LD | 0.580 | LD |
| PhGI2 | 0.301 | DD | 0.860 | LD |
| PhELF4 | 0.082 | LD | 0.005 | DD |
| PhCHL | 0.016 | DD | 0.007 | LD |
| PhFKF | 0.013 | DD | 0.124 | LD |
| PhLHY | 0.140 | DD | 0.084 | DD |
© 2019 by the authors. Licensee MDPI, Basel, Switzerland. This article is an open access article distributed under the terms and conditions of the Creative Commons Attribution (CC BY) license (http://creativecommons.org/licenses/by/4.0/).
Share and Cite
MDPI and ACS Style
Terry, M.I.; Carrera-Alesina, M.; Weiss, J.; Egea-Cortines, M. Transcriptional Structure of Petunia Clock in Leaves and Petals. Genes 2019, 10, 860. https://0-doi-org.brum.beds.ac.uk/10.3390/genes10110860
AMA Style
Terry MI, Carrera-Alesina M, Weiss J, Egea-Cortines M. Transcriptional Structure of Petunia Clock in Leaves and Petals. Genes. 2019; 10(11):860. https://0-doi-org.brum.beds.ac.uk/10.3390/genes10110860
Chicago/Turabian StyleTerry, Marta I., Marta Carrera-Alesina, Julia Weiss, and Marcos Egea-Cortines. 2019. "Transcriptional Structure of Petunia Clock in Leaves and Petals" Genes 10, no. 11: 860. https://0-doi-org.brum.beds.ac.uk/10.3390/genes10110860
Note that from the first issue of 2016, this journal uses article numbers instead of page numbers. See further details here.