Article

The Role of the Late Embryogenesis-Abundant (LEA) Protein Family in Development and the Abiotic Stress Response: A Comprehensive Expression Analysis of Potato (Solanum Tuberosum)

1
School of Life Science, Yunnan Normal University, Kunming 650550, China
2
Joint Academy of Potato Science, Yunnan Normal University, Kunming 650550, China
*
Author to whom correspondence should be addressed.
Submission received: 18 January 2019 / Revised: 10 February 2019 / Accepted: 11 February 2019 / Published: 15 February 2019
(This article belongs to the Section Plant Genetics and Genomics)

Abstract

:
Late embryogenesis-abundant (LEA) proteins are a large and highly diverse family believed to function in normal plant growth and development, and in protecting cells from abiotic stress. This study presents a characterisation of 74 Solanum tuberosum LEA (StLEA) proteins belonging to nine groups. StLEA genes have few introns (≤2) and are distributed on all chromosomes, occurring as gene clusters on chromosomes 1, 2, and 10. All four StASR (StLEA7 group) genes were concentrated on chromosome 4, suggesting their evolutionary conservation on one chromosome. Expression profiles of StLEA genes, in different tissues and in response to hormone and stress treatments, indicated that 71 StLEA genes had differential expression levels, of which 68 StLEA genes were differentially expressed in response to hormones and stress exposure in the potato. Continuous high expression of StASR-2, StLEA3-3, StDHN-3, StLEA2-29, and StLEA2-14 in different tissues indicated their contribution to plant development processes. StLEA2-14, StLEA2-31, StLEA3-3, StASR-1, and StDHN-1 were upregulated by six abiotic stresses, showing their tolerance to a wide spectrum of environmental stresses. Expression analysis of 17 selected StLEA genes in response to drought, salt, heavy metal, heat, and cold treatments by quantitative real-time polymerase chain reaction indicated that StLEA proteins may be involved in distinct signalling pathways. Taken together, StLEA3, StDHN, and StASR subgroup genes may be excellent resources for potato defence against environmental stresses. These results provide valuable information and robust candidate genes for future functional analysis aimed at improving the stress tolerance of the potato.

1. Introduction

Late embryogenesis-abundant (LEA) proteins are a type of highly hydrophilic glycine-rich protein with antioxidant, metal ion binding, membrane and protein stabilisation, hydration buffering, and DNA and RNA interaction properties. They play an important role in protecting cells from abiotic stress, and in plant normal growth and development. More importantly, LEA expression is often induced by abiotic stresses such as cold, drought, or high salinity [1,2,3]. LEA proteins are found not only in plant ecosystems ranging from algae to angiosperms, but also in prokaryotes and invertebrates [4,5,6].
In higher plants, many members of the LEA family are present. According to the similarity of amino acid sequences and differences in conserved domains, they can be divided into eight subgroups (LEA1, LEA2, LEA3, LEA4, LEA5, LEA6, dehydrin [DHN], and seed maturation protein [SMP]). Recent studies have shown that abscisic stress ripening (ASR) is also an LEA protein, classified into the LEA7 group [7,8,9]. To date, LEA proteins have been identified in Oryza sativa [10], Hordeum vulgare [11], Arabidopsis thaliana [12], Prunus mume [13], Malus domestica [14], Populus trichocarpa [1], Solanum lycopersicum [15], Pinus tabuliformis [5], Dendrobium officinale [6], and a variety of plants and legumes [4]. The LEA protein was originally discovered during late embryogenesis and later found in roots, stems, and other organs throughout the plant growth phase. They are widely distributed in subcellular compartments, such as the mitochondria, chloroplasts, and cytoplasm. After drought, low temperatures, salt stress, or hormonal treatments, the expression of LEA proteins is upregulated in different development stages and tissues of plants [1,5,16], indicating that plant LEA genes play an important role in the response to abiotic stress. Indeed, overexpression of LEA genes enhances the abiotic tolerance of transgenic lines, such as the cold tolerance of transgenic Arabidopsis thaliana, and the drought- and salt-tolerance of transgenic rice and wheat. However, silencing of the LEA4 subgroup gene in A. thaliana results in sensitivity to water deficit, which may be related to the protective effect of LEA proteins on membrane systems and other biological macromolecules during water deficit [1,12,17,18]. The heterologous expression of Pinus tabuliformis LEA (PtaLEA) in Escherichia coli can also improve cellular salt and heat tolerance [5].
The expression of many LEA proteins is regulated by abscisic acid (ABA), a key hormone in dehydration. During the development of maize embryos, exogenous ABA can upregulate the expression of LEA4 group members [19,20]. CuLEA5, a gene encoding an LEA5 subgroup that plays an important role in fruit ripening in Citrus unshiu, is also induced by ABA, cold, and drought stresses [21,22]. In response to environmental changes, ASR adapts to two different conformations: either an α-helix or a polyproline type II (PII) conformation. Low temperature and low pH increase the PII conformation, NaCl increases PII content and disturbs the α-helix conformation, and poly (ethylene glycol) (PEG) and glycerol stabilise the α-helix conformation. This structural plasticity of ASR is critical for plant stress resistance, facilitating their response to drought and interaction with target proteins [9]. DHN improves the freezing tolerance of E. coli and plants by increasing the thermal hysteresis value of solution systems to inhibit ice crystallisation [23,24]. These results suggest that each LEA protein may have a unique temporal and spatial role in plant development and the response to abiotic stresses, with obvious functional differentiation seen among subgroups, and among different genes of the same subgroup [5].
The potato (Solanum tuberosum L.) is the third largest food crop in the world [25]. Potato production is affected by various environmental stresses, especially because of their shallow roots and poor recovery after water shortages. The potato is very sensitive to water deficit. If drought occurs during its critical growth period, yield and quality will decrease significantly [26,27,28]. Charfeddine et al. [19] identified 29 members of the potato LEA family, and the results confirmed the ability of the five Solanum tuberosum LEA (StLEA) genes of the DHN subfamily to respond to salt and drought stress. With the updating of protein domain databases, such as the potato genome, Pfam, and the Conserved Domain Database (CDD), more members of the LEA family have been annotated successively. Due to the obvious functional differentiation among different protein subgroups, functional, evolutionary analyses, and analysis of the distribution of chromosomes of different LEA subgroups, are necessary to study their application to potato stress resistance. In this study, 74 members of the StLEA family were identified; their structure, evolutionary relationships, and chromosome locations were analysed, and their expression patterns in different tissues during development and stress tolerance were investigated to deepen understanding of the functions of the StLEA family and their applications in potato genetic improvement.

2. Materials and Methods

2.1. Identification of Late Embryogenesis-Abundant (LEA) Genes in Potato Genomes

Using Pfam ID PF03760 (LEA-1), PF03168 (LEA-2), PF03242 (LEA-3), PF02987 (LEA-4), PF00477 (LEA-5), PF10714 (LEA-6), PF02496 (ASR, LEA-7), PF00257 (DHN), and PF04927 (SMP), the LEA amino acid sequence of the potato was searched and downloaded in the Solanum tuberosum v4.03 database of Phytozome v12.1, and in the Spud DB database (http://solanaceae.plantbiology.msu.edu/) using the keyword “late embryogenesis abundant“. The obtained amino acid sequences were aligned using CD-Search tool (expected value <0.05) in Conserved Domains database (CDD) (https://0-www-ncbi-nlm-nih-gov.brum.beds.ac.uk/cdd/), and repeated and non-LEA domain sequences were eliminated manually. The physical and chemical properties of StLEA amino acid sequences were analysed using the ProtParam online tool (https://web.expasy.org/protparam/).

2.2. Distribution of LEA Genes on Potato Chromosomes

StLEA were mapped on potato chromosomes according to the positional information of the StLEA genes in the Spud DB database, and displayed using MapInspect software (http://mapinspect.apponic.com/). The segmental duplicated and tandem repeated genes were determined by MEGA X [29]. ClustalW alignment comparisons of all StLEA genes with a threshold similarity >75%, and analysis of their genomic locations and tandem duplications, were restricted to a distance range of 100 kb [30].

2.3. Structural Characterisation of Potato LEA

Gene structure was obtained through alignment of each StLEA gene coding sequence (CDS) to the genomic DNA sequences, and displayed using the Gene Structure Display Server (GSDS) 2.0 online software (http://gsds.cbi.pku.edu.cn/). The Multiple Expectation Maximisation for Motif elicitation (MEME) tool (http://meme-suite.org/index.html) was used to identify conserved domains and motifs of each subgroup of StLEA proteins.

2.4. Phylogenetic Analysis of Solanum Tuberosum LEA (StLEA)

Multiple sequence alignments of StLEA proteins were performed using ClustalW ALGN within MEGA X [29]; these were then subjected to phylogenetic tree construction using PHYLOGENY (neighbour-joining method; Poisson correction model; 1000 bootstrap tests).

2.5. Expression Profile Analysis of Potato LEA Genes

The RNA sequencing (RNA-Seq) data used for generating gene expression levels were downloaded from the Spud DB database. These data were sequenced from the heterozygous diploid (RH89-039-16 (RH)) and the doubled monoploid potato (Group Phureja clone DM1-3 (DM)). The sequenced tissues included leaves, stems, roots, stolons, young tubers, mature tubers, tuber sprouts, petiole, apices, and flowers, as well as those that received the following treatments: ABA, indole-3-acetic acid (IAA), gibberellin A3 (GA3), 6-benzylaminopurine (BAP), and abiotic stresses such as water stress, mannitol, NaCl, heat (35 °C), primary wounding, and secondary wounding [31]. Gene expression profiling was performed using Origin Lab 2018 (OriginLab Corporation, Northampton, MA, USA). All fragments per kilobase of transcript per million fragments sequenced (FPKM) values were plused with 0.00001. In the 3D heat map, the fold change (FC) of gene differential expression was calculated by log2 (FPKMTreatment/FPKMControl) and displayed according to colour; expression was transformed by square root and displayed according to column height.

2.6. Quantitative Real-Time Polymerase Chain Reaction Analysis of StLEA Proteins

Hydroponic potato tissue cultured seedlings (tetraploid variety Cooperation-88) were transplanted to perlite medium. Plants were initially irrigated with Hoagland’s nutrient solution and cultured for 15 days. The medium was leached with one-quarter Hoagland’s solution three times. Then, the seedlings were each treated with 150 mmol L−1 NaCl, 5 mmol L−1 ZnSO4, and 20% PEG6000 at 4 °C and 35 °C for 24 h. High expression level LEA genes, including StLEA1-3, StLEA2-1, StLEA2-14, StLEA2-17, StLEA2-21, StLEA2-25, StLEA2-31, StLEA2-40, StLEA3-3, StLEA6-1, StASR-1, StASR-2, StASR-3, StASR-4, StDHN-1, StDHN-2, and StDHN-3, were collected for quantitative real-time polymerase chain reaction (qRT-PCR) analysis, and templated by cDNA of the aforementioned root and leaf samples. Three independent biological duplicates were performed in this study. All primer sequences used are listed in Supplementary Table S1. The relative expression levels of StLEA genes were analysed using the 2−ΔCt method [32] with the reference gene StEF1α [33].

3. Results

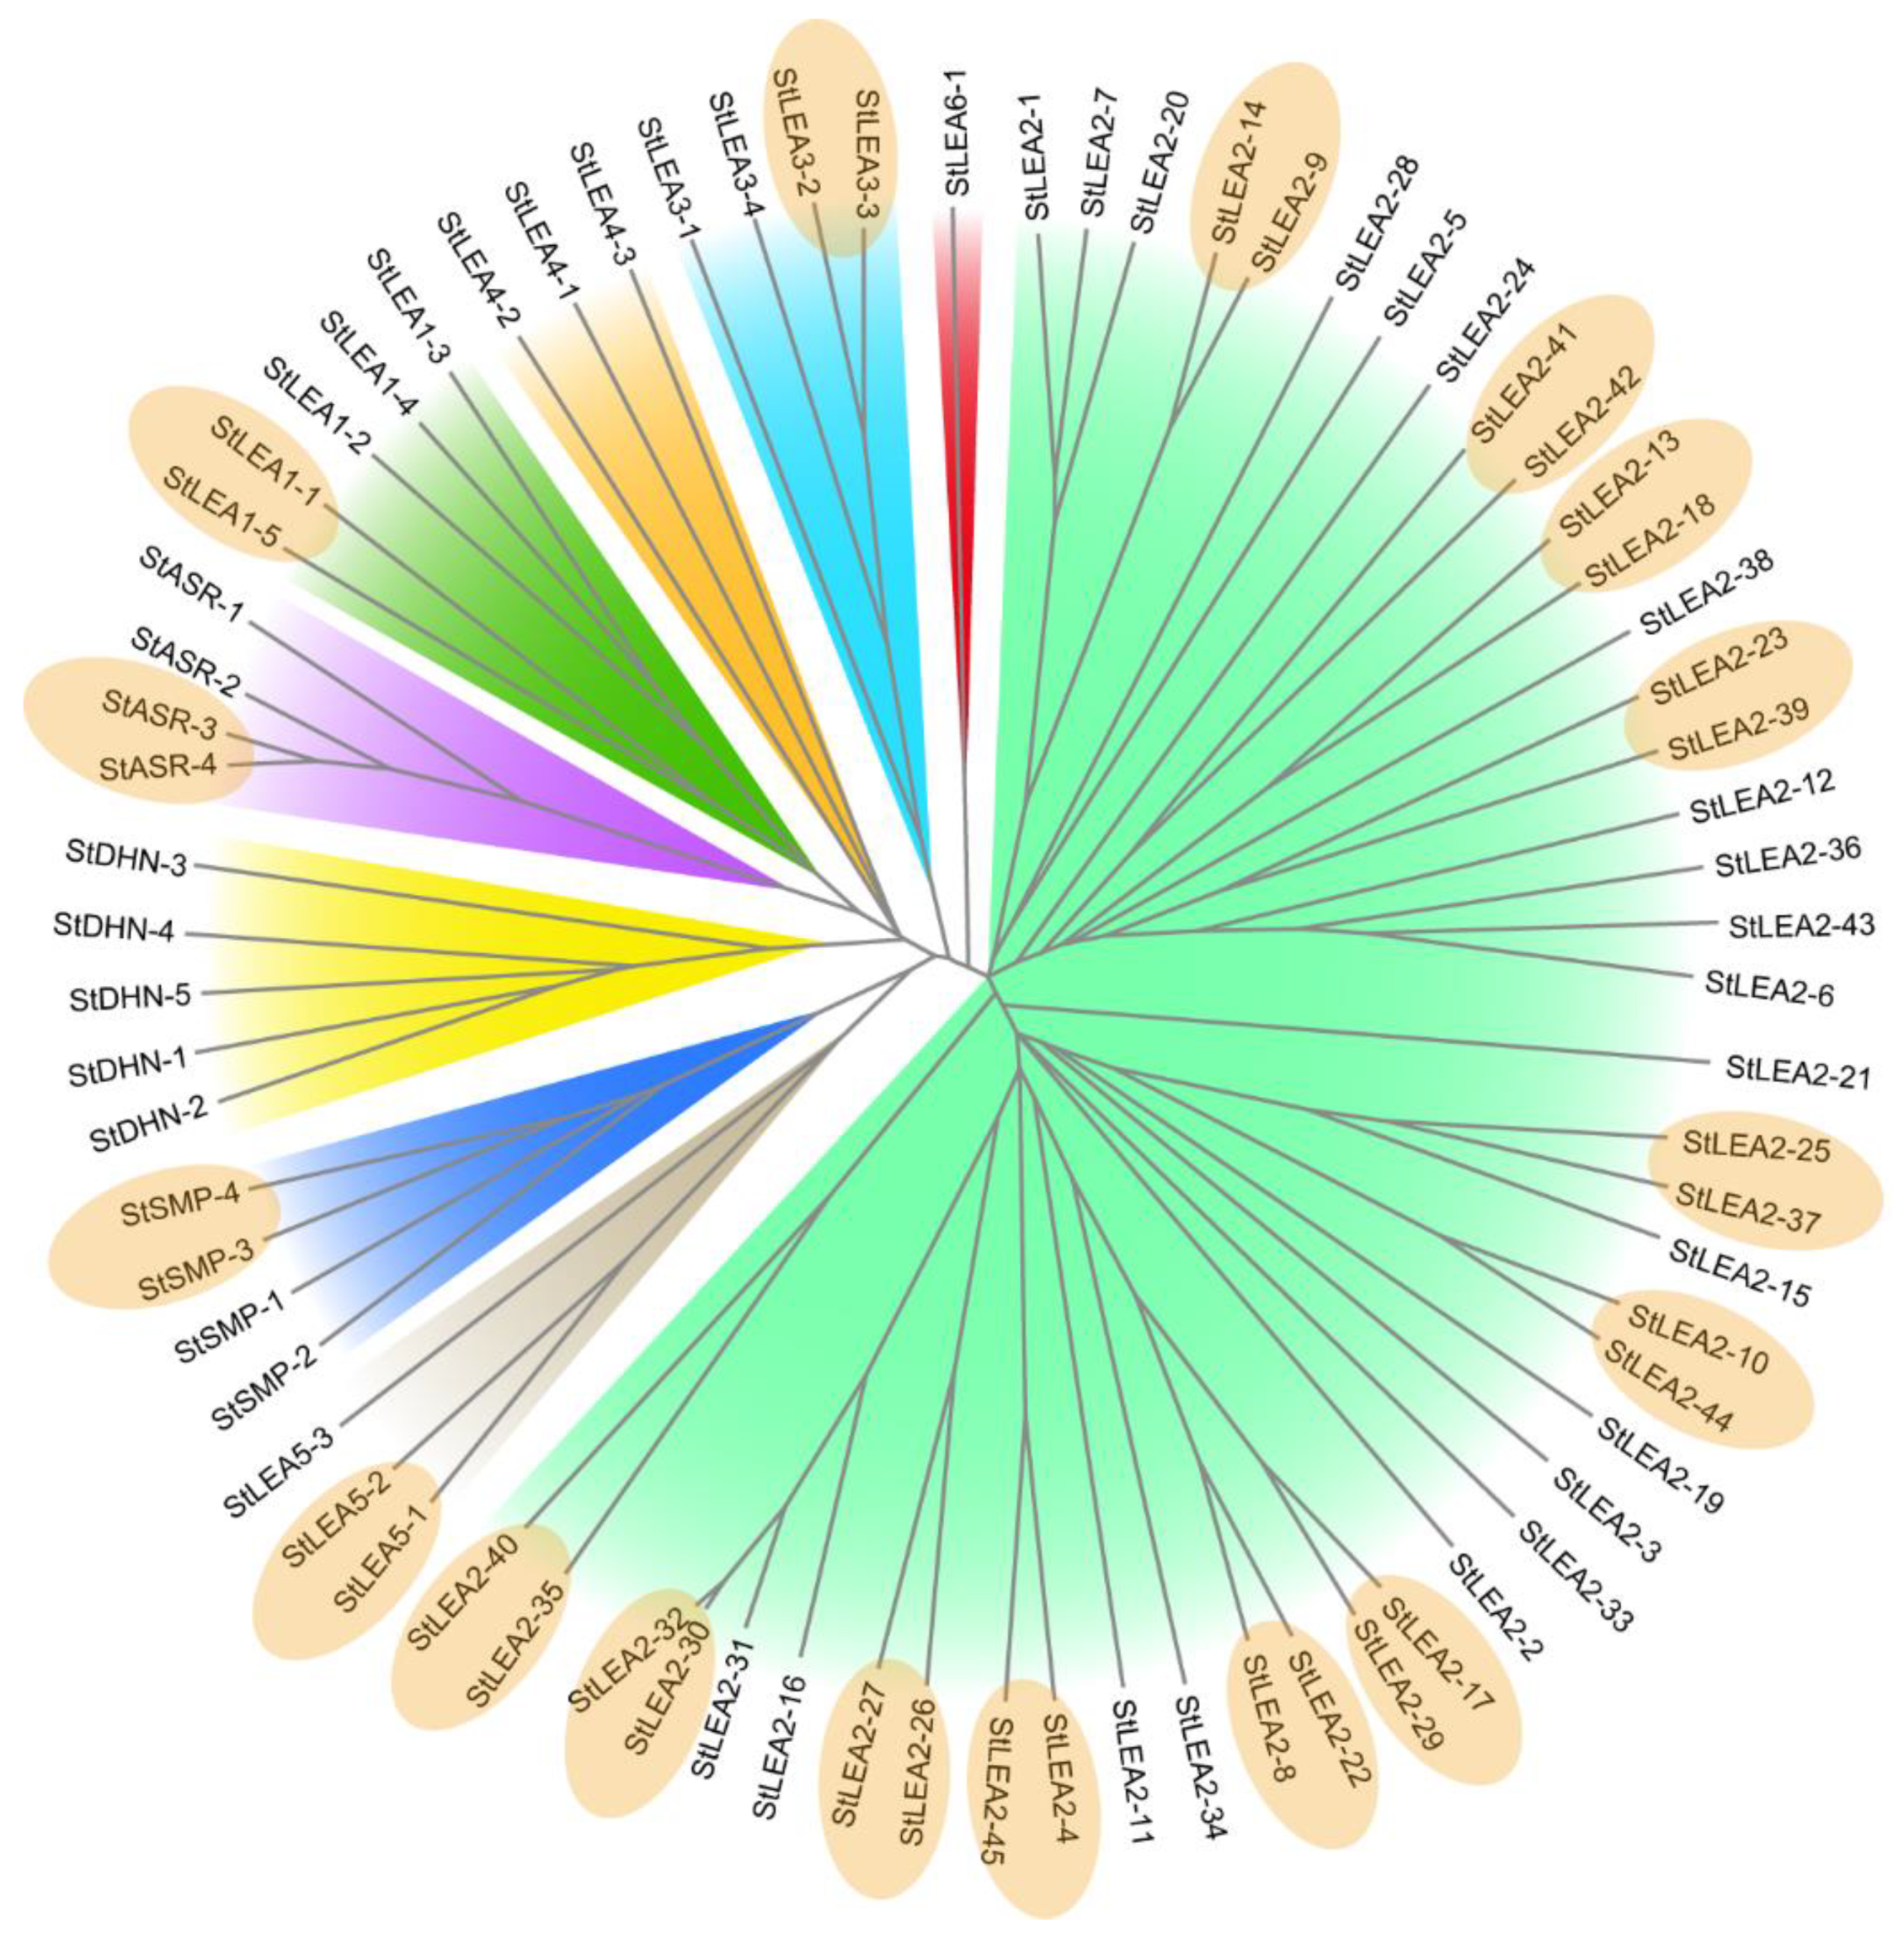
3.1. Genome-Wide Identification and Phylogenetic Analysis of Potato LEA Genes

A total of 74 StLEA genes were identified from the potato genome, based on keywords and a Pfam ID search of potato genome databases, identification of Arabidopsis LEA amino acid homologous sequence alignment, and a Pfam domain search of the CDD database. These 74 genes were divided into nine groups (groups LEA1LEA6, ASR, DHN, and SMP) (Table 1) based on conserved domains and a sequence similarity phylogenetic analysis. The largest group was StLEA2, which contained 45 members, while the smallest group was StLEA6, with only one member. Groups StLEA1 and StDHN each contained five genes, groups StLEA3, StSMP, and StASR each contained four genes, and groups StLEA4 and StLEA5 each contained three genes.
The physical and chemical parameters of most StLEA proteins in the same group were similar according to an analysis using the ProtParam online tool. The 74 StLEA-encoded amino acids ranged from 80–501; molecular weights ranged from 8.5 kDa (StDHN-4) to 53.3 kDa (StLEA4-2), with an average of 22.5 kDa. Only seven proteins had molecular weights >30 kDa (StASR-1, StLEA2-9, StLEA2-14, StLEA2-35, StLEA2-40, StLEA4-1, and StLEA4-2). The pI values ranged from 4.47 (StSMP-1) to 10.42 (StLEA2-41), with an average of 8.33. Of all StLEA proteins, 73.0% had a pI > 7.0, with the LEA3 group having the largest pI (9.60) and th SMP group having the smallest pI (5.14). A grand average of hydropathicity (GRAVY) index analysis showed that most of the StLEA proteins were hydrophilic. Of these, 10 proteins with a GRAVY index >0 belonged to group LEA2. The most stable protein was StDNH-1, which had a stability index of 15.36, while LEA2-23 had the highest stability index (118.43).
A phylogenetic analysis (Figure 1) showed that groups StLEA2 and StLEA6 were contained in a large branch and were more closely evolutionarily related. The other seven subgroups were contained in another branch and may have a common origin. There were 17 sister gene pairs in the evolutionary tree, with a bootstrap support value >90%. There was one pair in each group for StLEA1, StLEA3, StLEA5, StSMP, and StASR, while there were 12 pairs in 45 members of StLEA2. The high sequence similarity between sister pairs indicated that these genes may have evolved through genome replication events and could have similar functions.

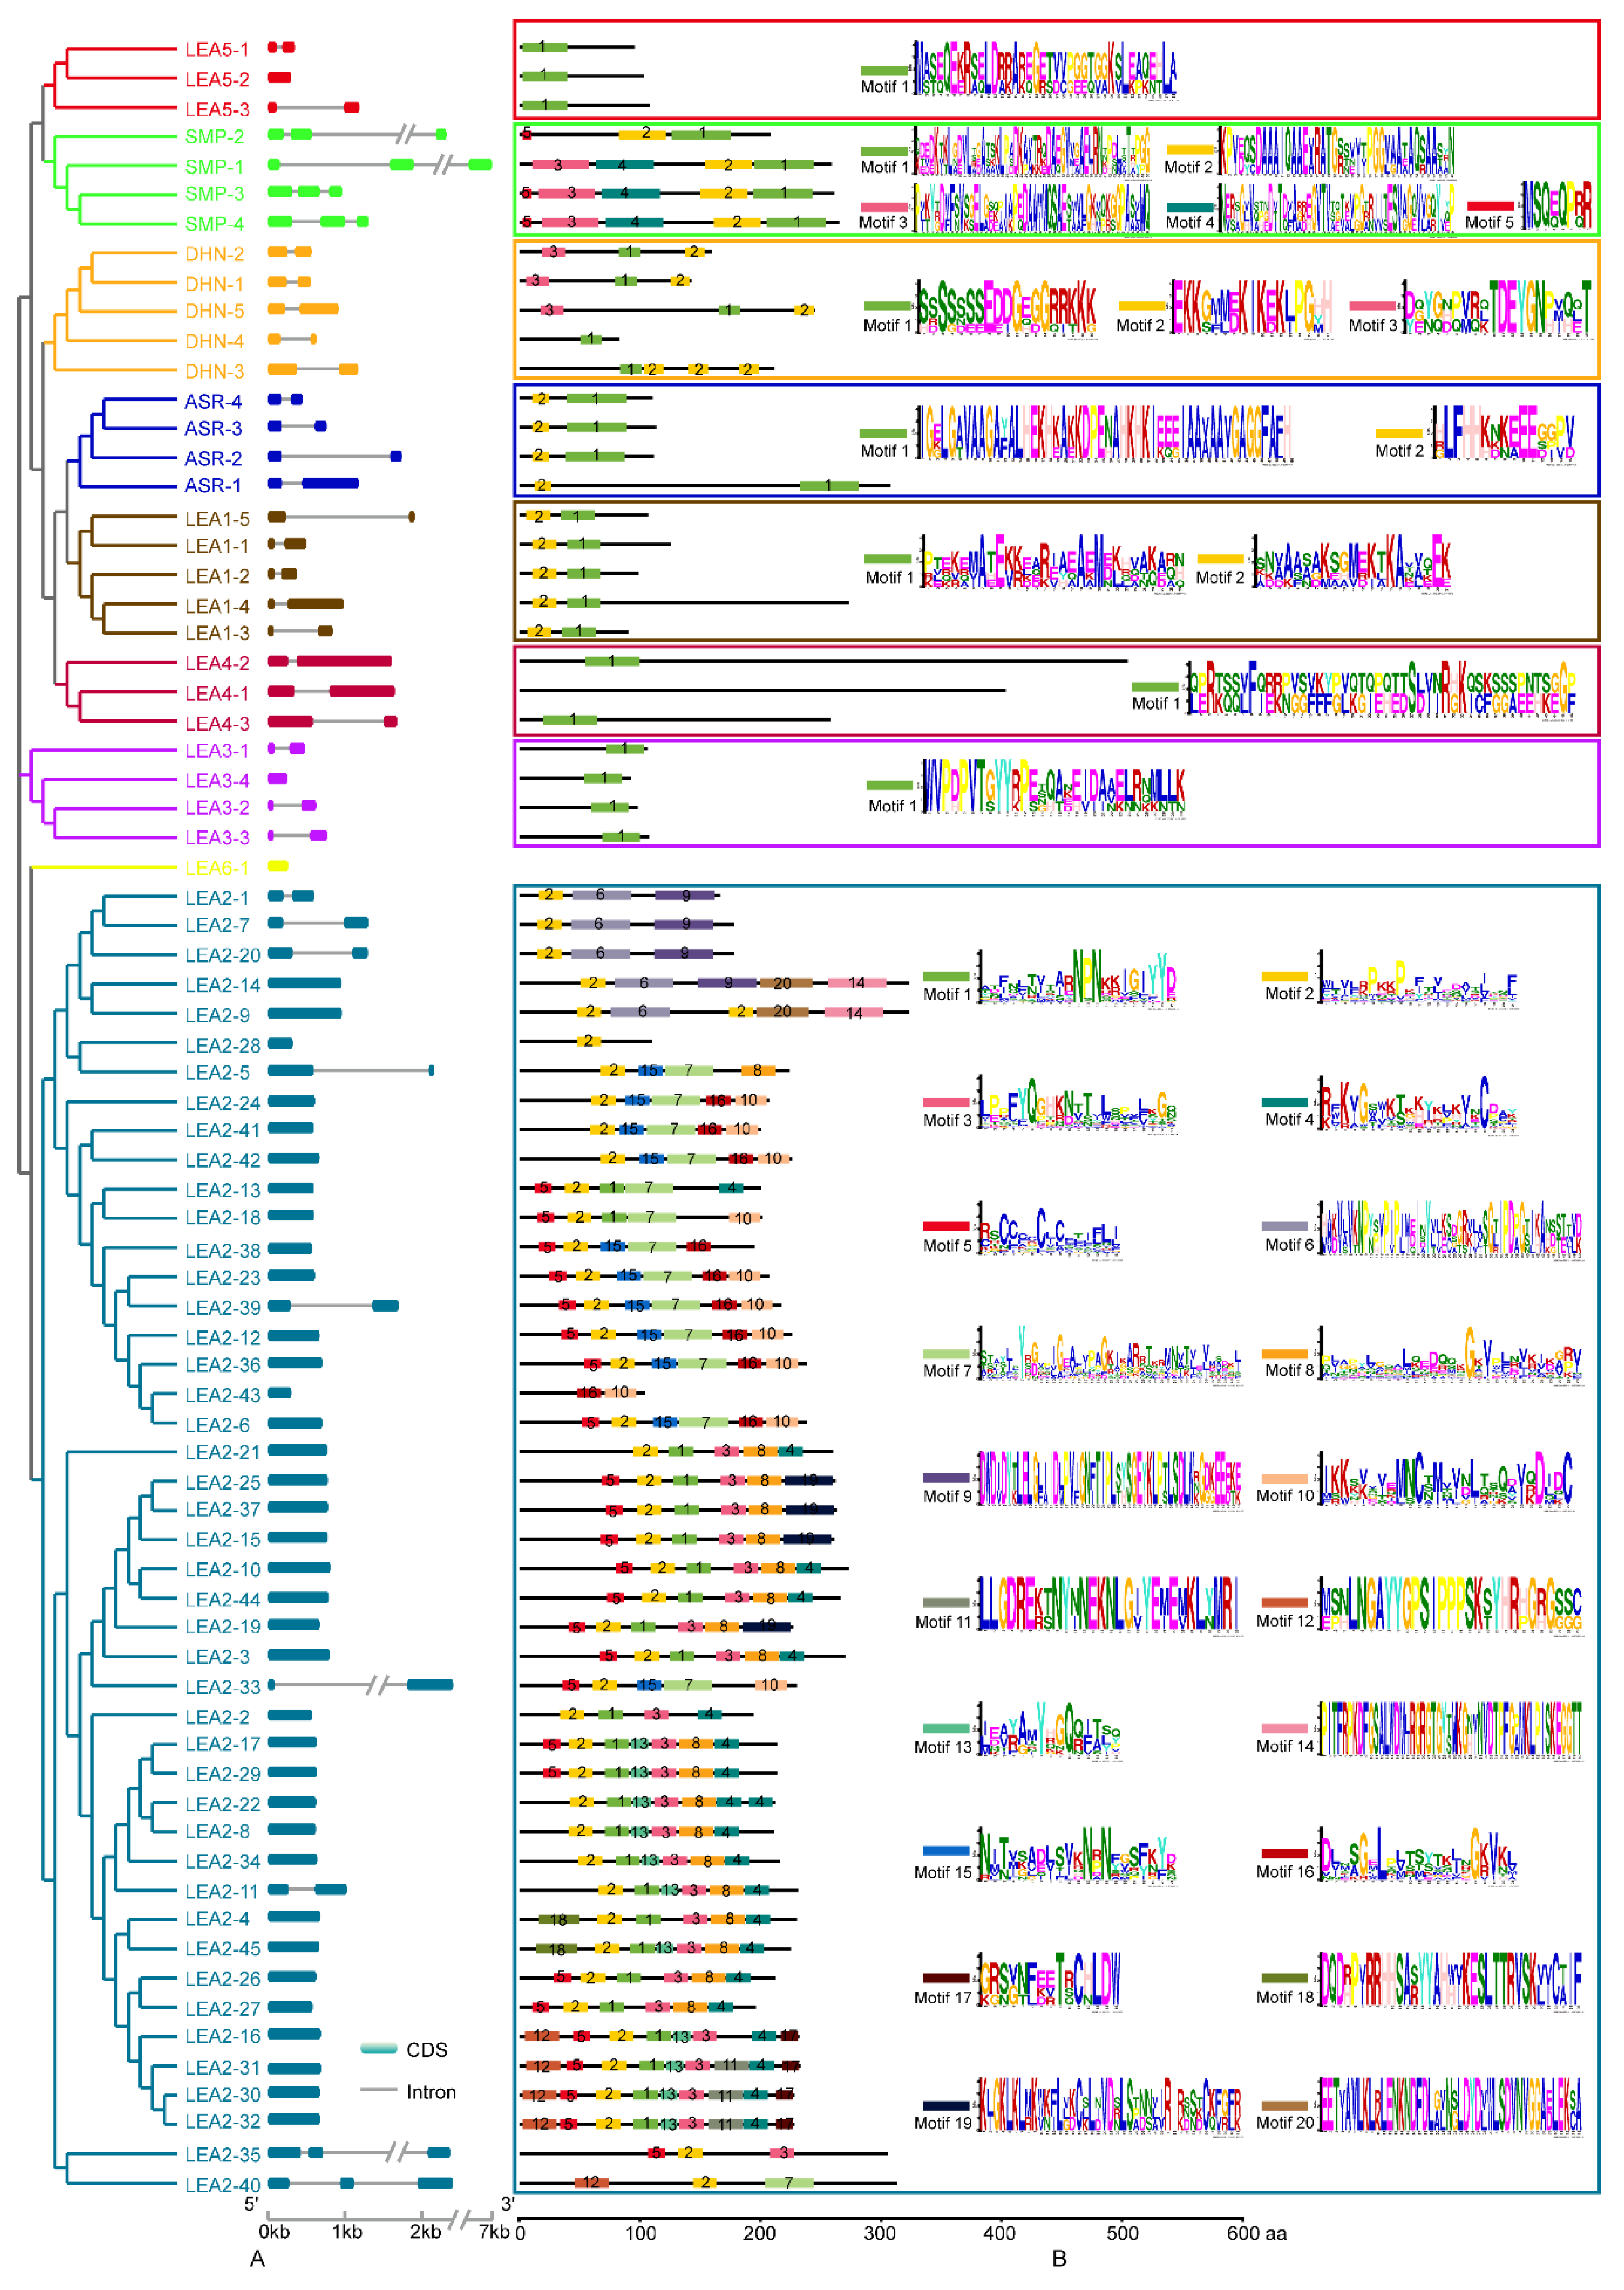
3.2. Structural Characterisation of Potato LEA

The StLEA gene contained few introns, and 39 contained no introns. Only six of the 35 intron-containing LEA proteins contained two introns. The StLEA6 group contained only one intron-free gene, while subgroups StLEA1, StLEA4, StASR, and StDHN contained one intron, which was located in the same clade in the phylogenetic tree (Figure 2A). SMP contained two introns, LEA3 and LEA5 each had one intron-free gene, and the others were single-intron genes. Among the 45 genes of group LEA2, 36 were intron-free, 7 were single-intron genes, and 2 were dual-intron genes (Figure 2A). Two of the seventeen sister gene pairs contained exon-intron gain/loss variations (StLEA5-1/StLEA5-2, StLEA2-23/StLEA2-39).
Because of the low similarity of the 74 StLEA gene sequences, the MEME online tool was used to analyse the motif structure of each subgroup (Figure 2B). The results showed that except for LEA6, there were conservative motifs specific to each subgroup. Subgroups LEA3, LEA4, and LEA5 each had 1 conserved motif, subgroups LEA1 and ASR had 1 motif, subgroup DHN had 3 motifs, subgroup SMP had 5 motifs, and subgroup LEA2 had 25 motifs. The motifs were conserved in each subgroup. Indeed, all members of LEA2 contained motif 2, all subfamily members of SMP contained motifs 1 and 2, and the DHN subfamily contained the K-segment EKGMMEKIKEKLPGHH, which is rich in lysine residues. These results show that the composition of structural motifs was different among different LEA subgroups, but similar within the same subgroup. Moreover, the motifs encoding LEA domains were relatively conserved, indicating that the functions of StLEA proteins are intergroup specific.

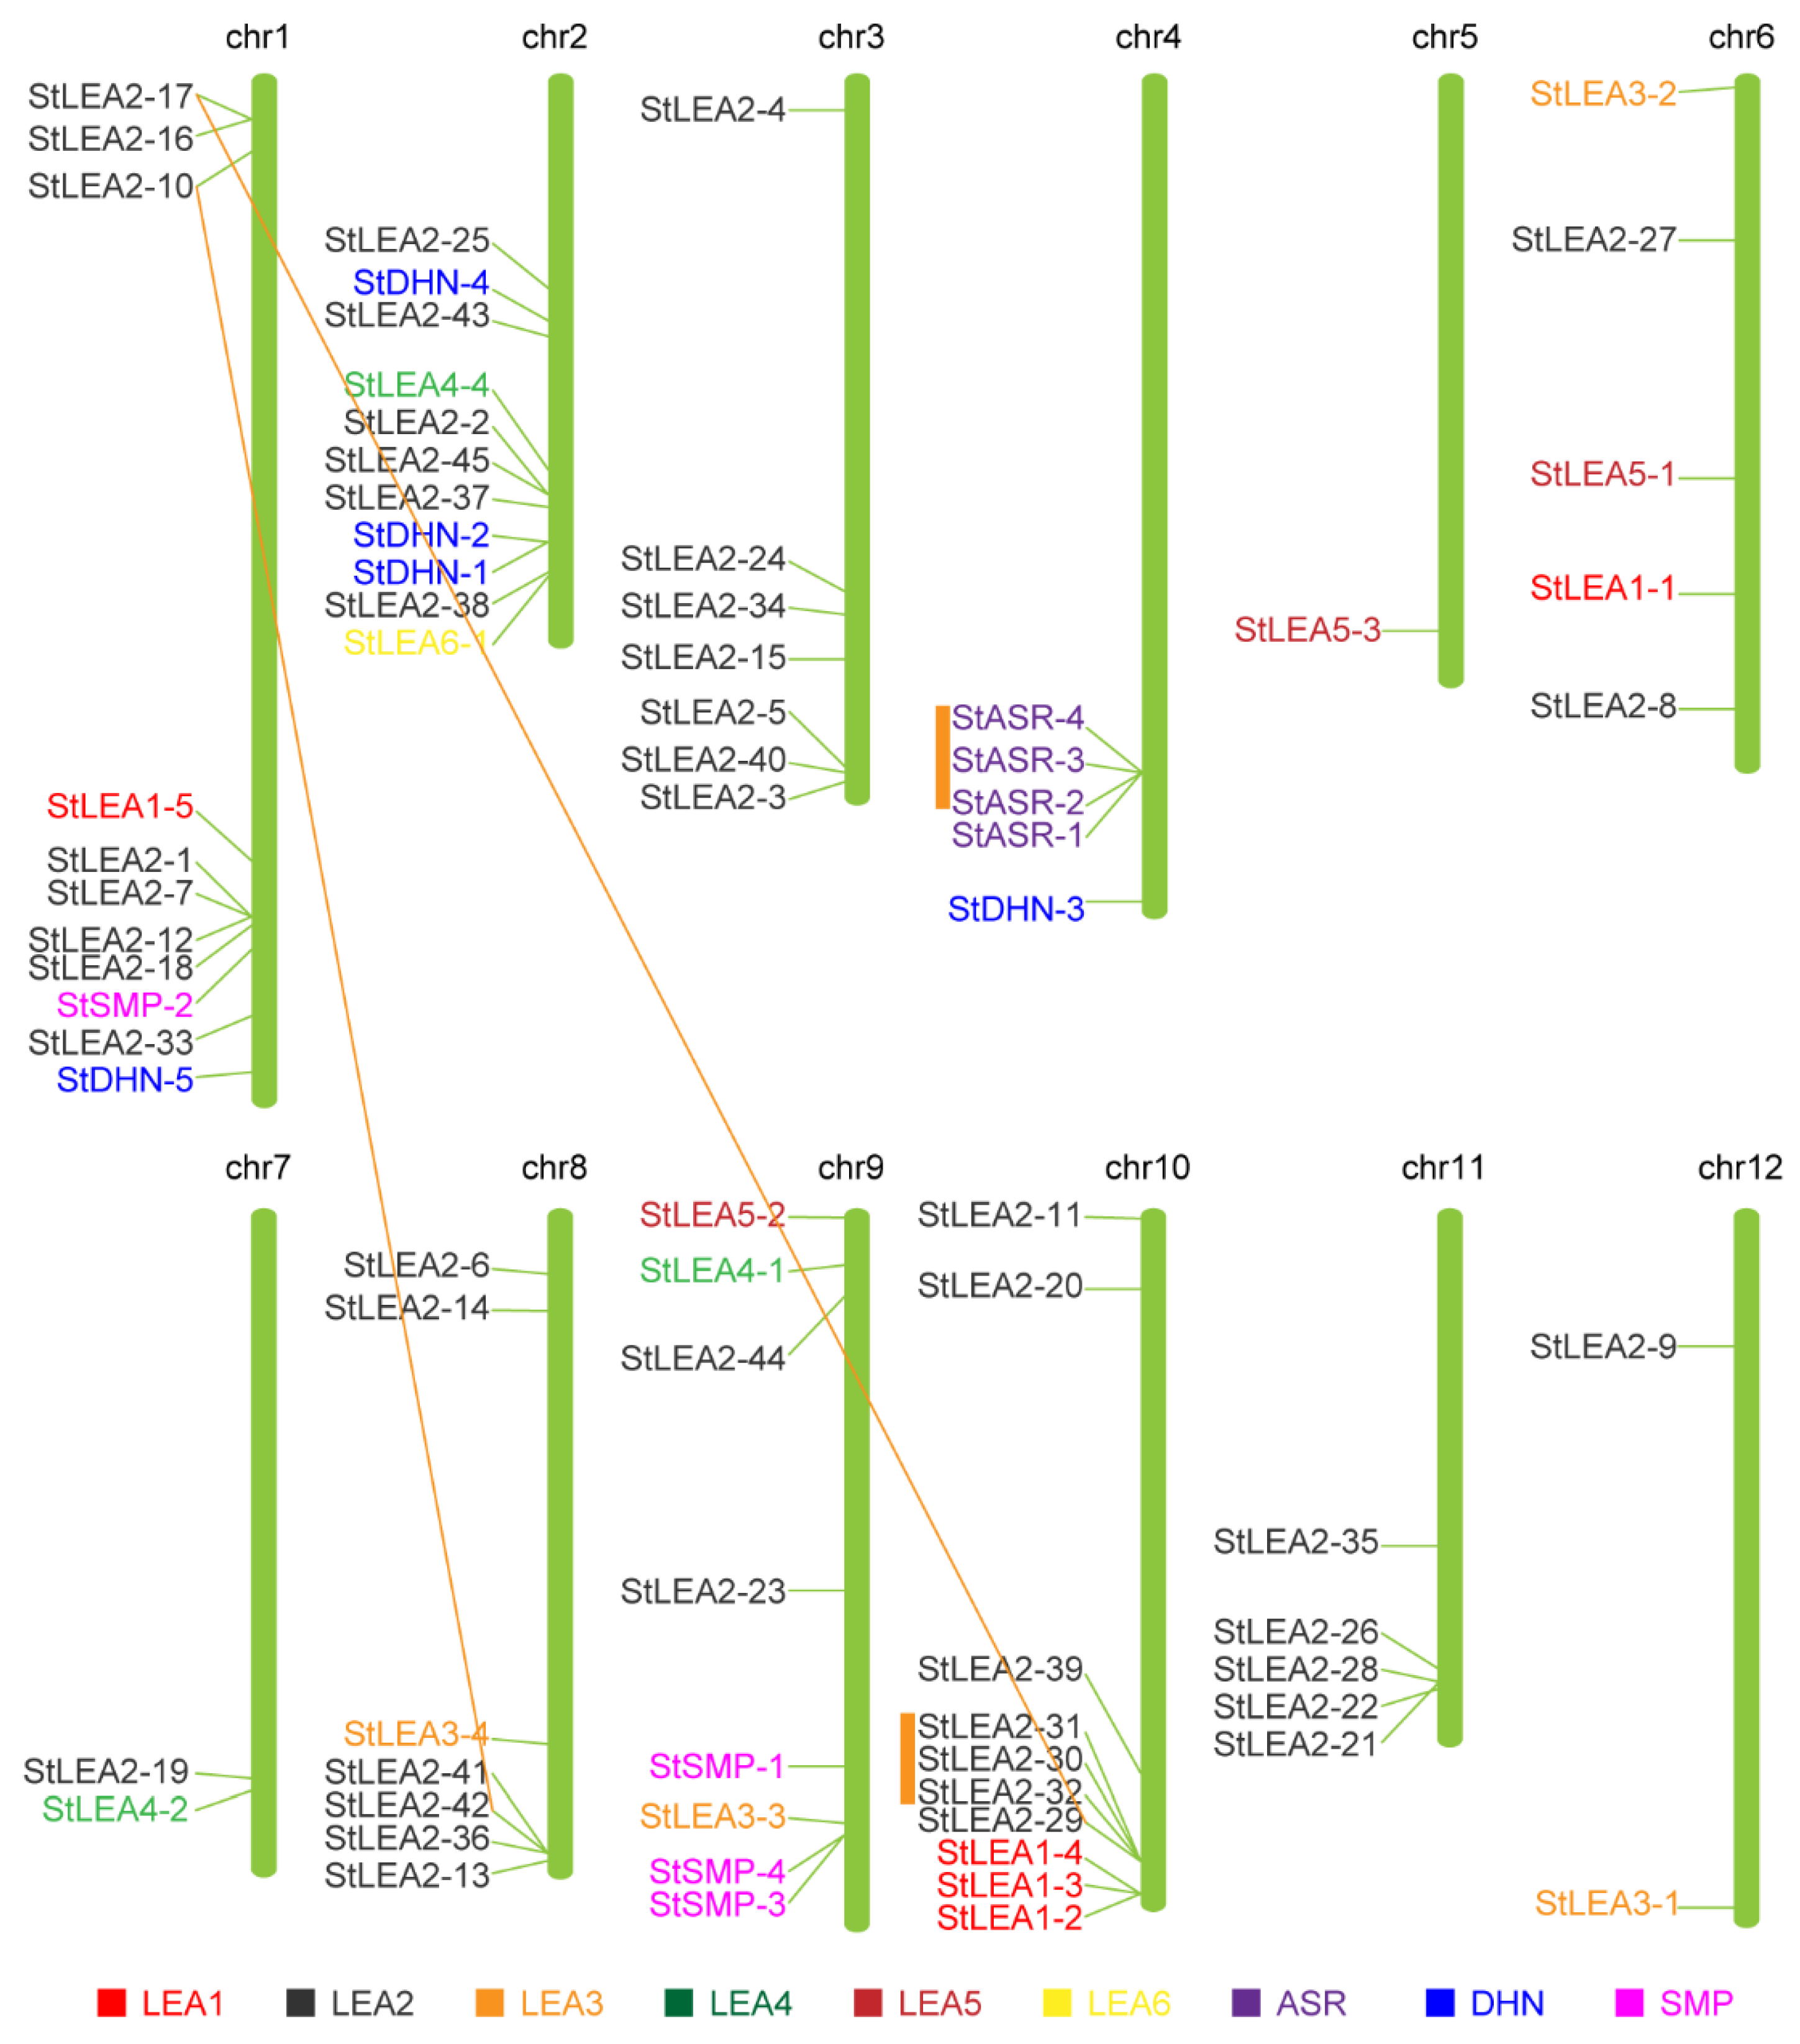
3.3. Chromosomal Location and Duplication of Potato LEA Genes

Using MapInspect software to analyse genomic position data, 74 StLEA genes were distributed on 12 chromosomes, and gene clusters were distributed among specific chromosomal regions (Figure 3); 54 genes were located near the ends of different chromosomes, including chromosomes 1, 2, 3, 4, 8, 9, 10, and 11. According to the chromosomal distribution of the StLEA gene, the StLEA gene was most densely distributed on chromosomes 1 and 2. Each of these chromosomes contained 11 StLEA genes, accounting for 15% of the total number of StLEA genes, and 10 StLEA genes on chromosome 10. Only one StLEA gene was distributed on chromosome 5. The four genes of the ASR subgroup were concentrated in a small region of chromosome 4, indicating that they might have a tendency to replicate with conserved evolution within one chromosome. The 45 genes of the LEA2 subfamily were distributed on 10 of 12 chromosomes to maximise their functions. Among the 17 sister gene pairs, StASR-3/StASR-4, StLEA2-41/StLEA2-42, StSMP-3/StSMP-4, and StLEA2-30/StLEA2-32 were located on chromosomes 4, 8, 9, and 10, respectively. In accordance with the criteria of Hanada et al. [34], sister gene pairs belong to the same family, are located within 100 kb, and are separated from each other by less than 10 non-homologous genes belonging to tandem duplicates. Although the StLEA2-17/StLEA2-29 sister pair was located on different chromosomes, according to the length of aligned sequence covers more than 80% of the longer gene and the similarity of the aligned region is >70% [35], they had putative segmental duplication events. The StLEA2-25/StLEA2-37 pair was located on the same chromosome but they were far away from each other.

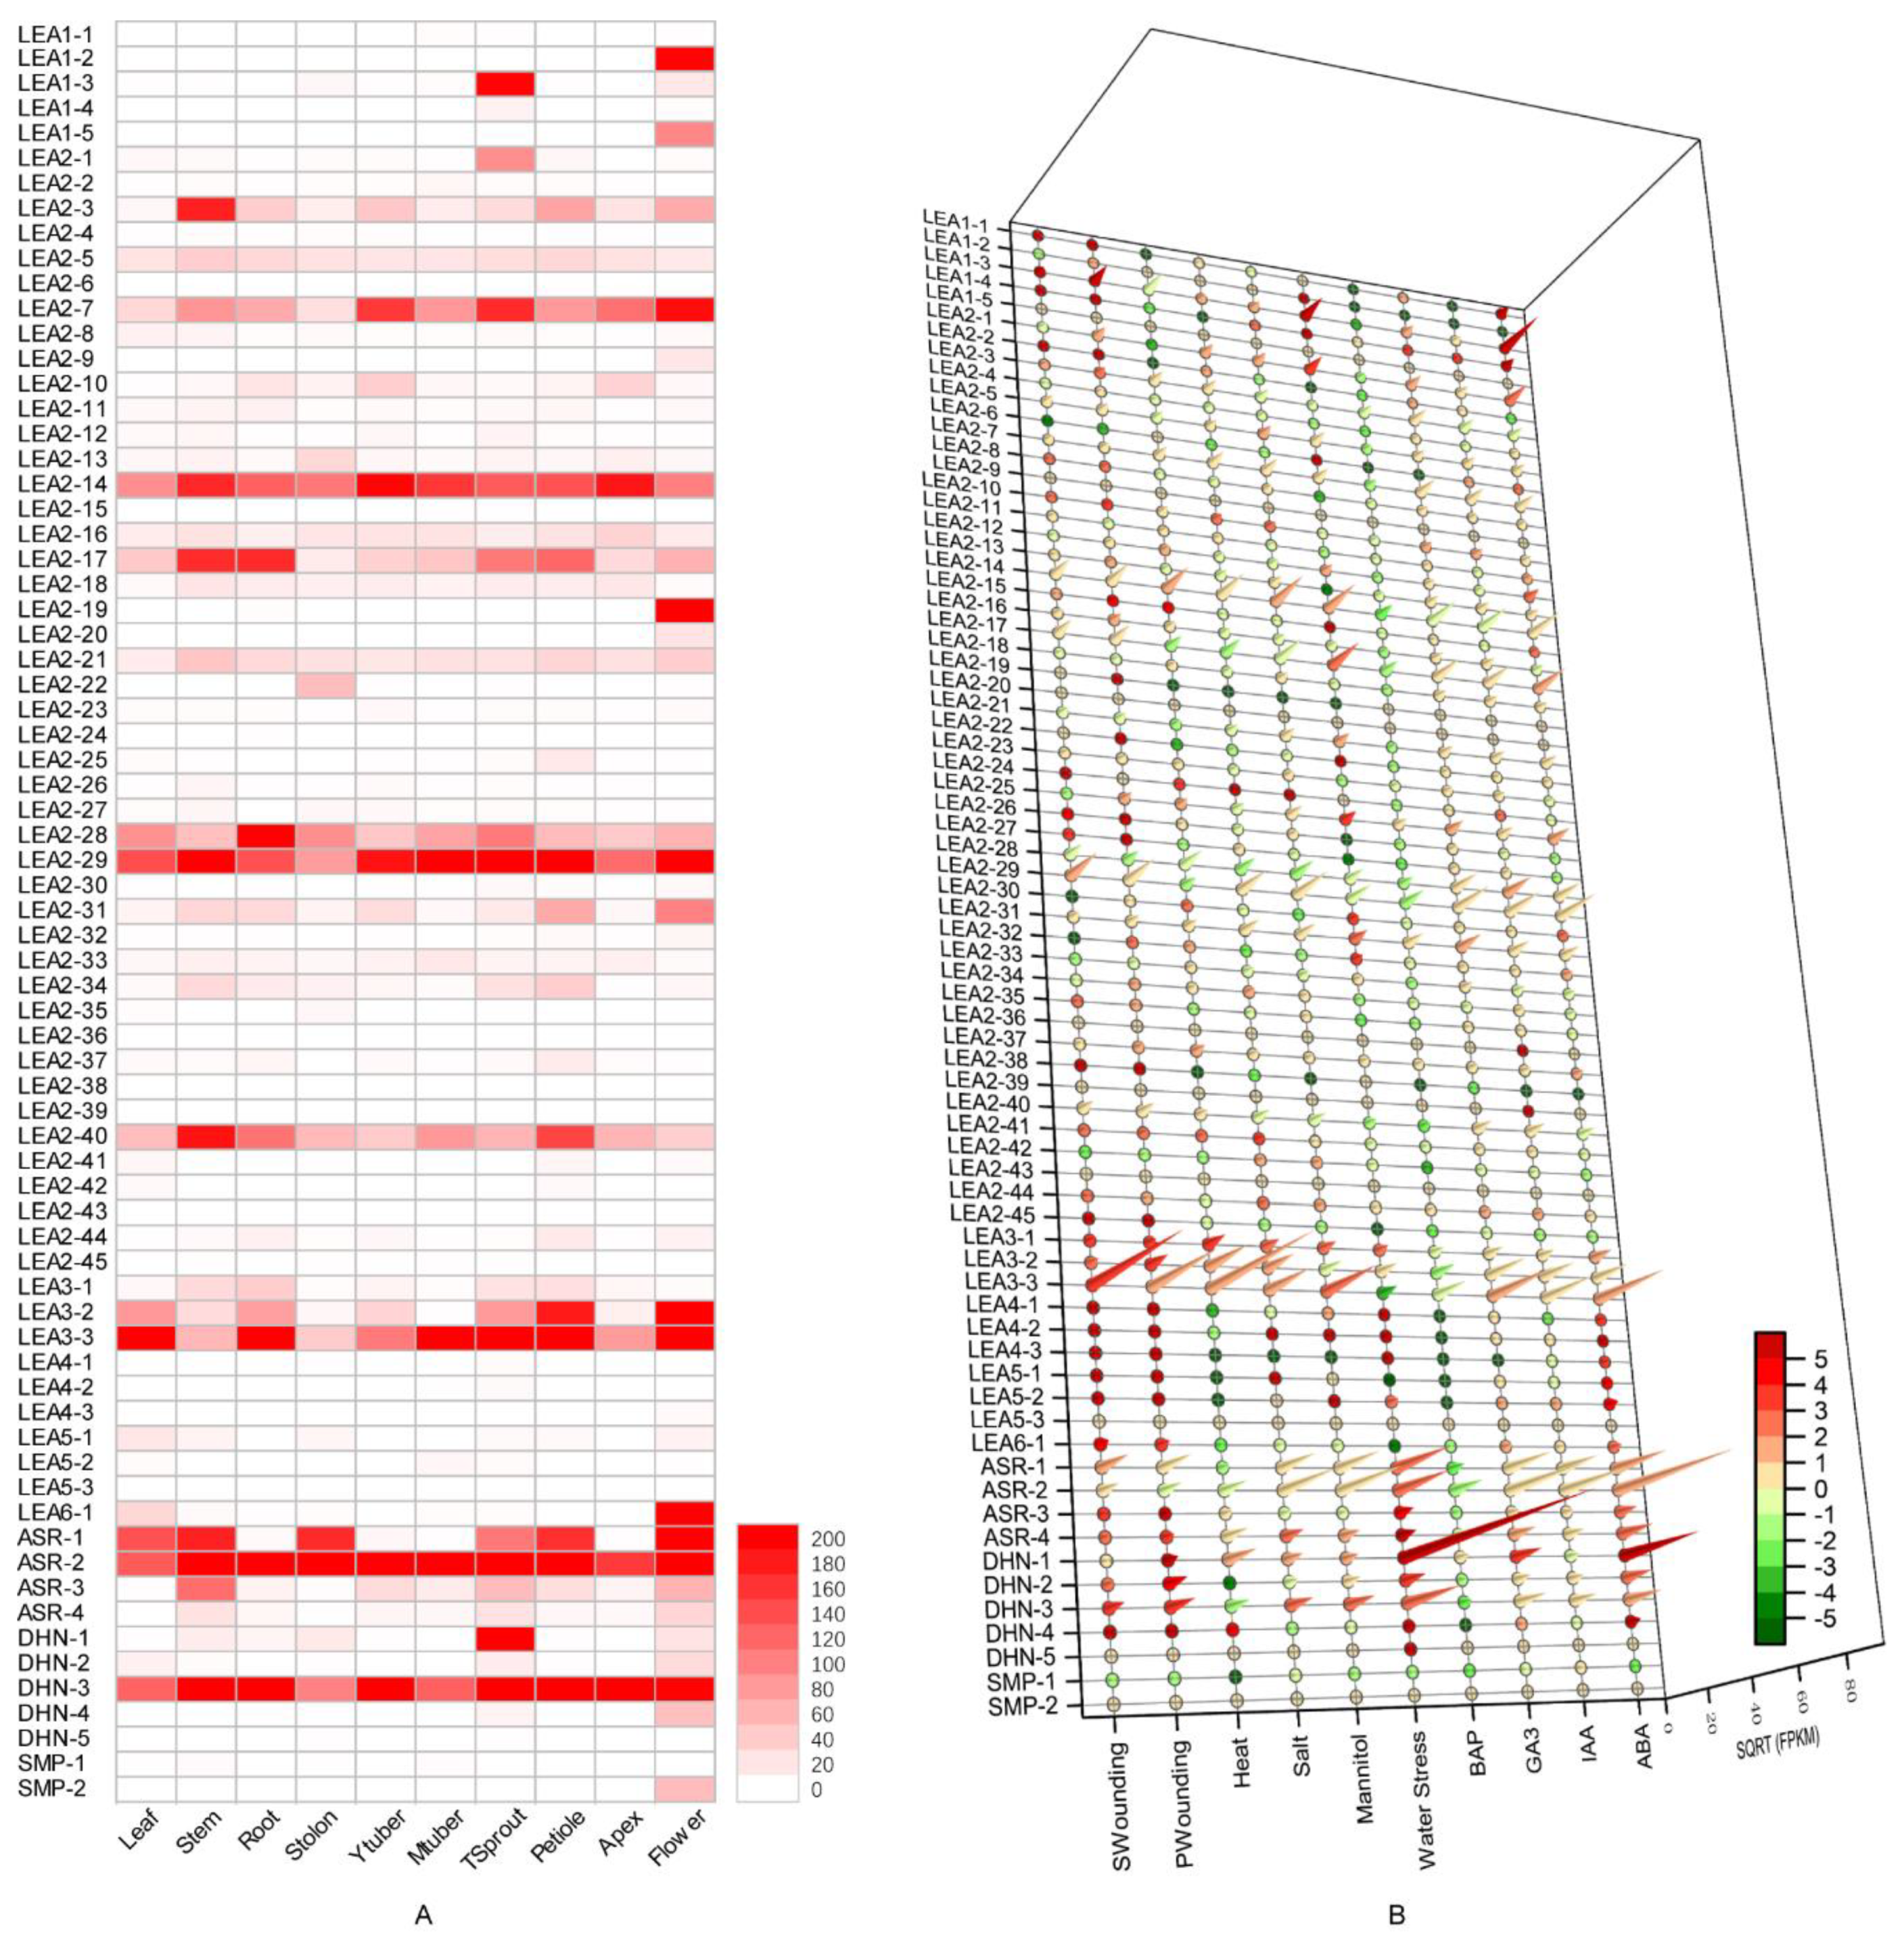
3.4. Expression Profile Analysis of Potato LEA Genes in Different Tissues

Apart from StLEA3-4, StSMP-3, and StSMP-4, the expression levels of the remaining 71 StLEA genes were significantly different, according to RNA-Seq gene expression data from the Spud DB (Figure 4). Among them, StASR-2 showed the highest expression level, and there were up to 3864.83 FPKM in stems. Moreover, the FPKM values for roots, tuber sprouts, petioles, shoot apices, and flowers also exceeded 1000, where these values were significantly higher than those of other StLEA genes in various tissues. StLEA 3-3, StDHN-3, StLEA 2-29, and StLEA 2-14 were also highly expressed in various tissues, indicating that they were involved in the normal growth and development of potatoes. In addition, almost half (35) of the StLEA genes had a low expression level in each tissue, and the FPKM value was <20. All members of the StLEA1 and StSMP subgroups had lower overall expression levels, except in individual tissues.
The expression levels of StLEA genes in different tissues and organs were quite different (Figure 4A). The FPKM variation coefficients of StLEA genes in 10 tissues and organs were between 27.4% and 369.7%, excepting the three StLEA proteins without expression data. Some StLEA genes were highly expressed in certain tissue types. For example, StLEA1-2, StLEA1-5, StLEA2-19, StLEA6-1, StDNH-4, and StSMP-2 were mainly expressed in flowers. There was almost no, or only minimal, expression in other tissues and organs. The FPKM value of StLEA1-2 reached 197.59 in flowers, but no expression was found in the other nine tissues and organs. StLEA1-3, StLEA2-1, and StDHN-1 expression was significantly higher in tuber sprouts than in other tissues. Specifically, the StDHN-1 FPKM level reached 617.82 in tuber sprouts, which was 28.9- and 36.9-fold higher than the second and third highest expression levels in flowers and stolons, respectively. Some genes had higher expression levels in multiple tissues. The FPKM value of StASR-1 was >100 in leaves, stems, stolons, tuber sprouts, petioles, and flowers, whereas it was <10 in the other four tissues.
Of the 17 sister gene pairs included in the phylogenetic tree (Figure 1), genes in a given pair typically had different expression patterns (excepting StSMP-3/StSMP-4, which had no expression data); however, six gene pairs had tandem duplicates or segmental duplications, including StASR-3/StASR-4, StLEA2-41/StLEA2-42, StLEA2-30/StLEA2-32, StLEA2-17/StLEA2-29, and StLEA2-25/StLEA2-37, which had similar expression patterns in different tissues. For example, StLEA2-17 and StLEA2-29 were expressed in various tissues without any apparent preference.

3.5. Effect of Exogenous Hormone Treatment on Potato LEA Expression

Some StLEA proteins can be induced by hormones (Figure 4B). Indeed, 59.5% (44) of the StLEA genes were induced by ABA. Fourteen genes were highly upregulated by ABA treatment, with FPKM values >100. Specifically, the FPKM values of StLEA1-3, StASR-2, and StDHN-1 were >1000. After ABA treatment, StLEA1-3 and StDHN-1 expression was upregulated more than 5-fold, indicating the highest induction level. The induction of StLEA by IAA, GA3, and BAP treatment was not as obvious as that by ABA. The expression of 54 StLEA genes was significantly inhibited by BAP treatment. StDHN-1 was highly induced by GA3, and StLEA1-3 and StASR-2 were induced not only by ABA, but also by IAA and GA3, demonstrating that many StLEA genes are induced by multiple hormones. In addition, ABA, IAA, and GA3 induced the expression of 29 genes, including 1 StLEA1, StLEA4, StLEA5, and StLEA6 subgroup gene, 17 StLEA2 subgroup genes, 3 StLEA3 and StASR subgroup genes, and 2 StDHN subgroup genes. However, the upregulation and FPKM values in these subgroups were much lower than those of StLEA1-3 and StASR-2. Four members of the StASR subgroup were induced by ABA, IAA, and GA3, and inhibited by BAP.

3.6. Expression Profiles of Potato LEA Genes under Abiotic Stresses

The expression pattern of StLEA genes in response to abiotic stresses, such as drought, high temperature, salt, and mechanical damage were obtained by analysing RNA-seq of data in the Spud DB database (Figure 4B). Apart from six genes, including StLEA1-5, StLEA2-9, StLEA2-19, StLEA2-20, StLEA2-39, and StSMP-2, the other StLEA genes were responsive to at least one stress, and the expression patterns were different. The expression levels of the LEA4, LEA5, LEA6 and SMP subgroups were very low under stress conditions. The expression of StLEA2-14, StLEA2-31, StLEA3-3, StASR-1, and StDHN-1 was induced by six stresses, while the expression of StLEA2-28 was inhibited by all stresses.
Thirty-four StLEA genes were induced by drought. Among these, 11 genes were upregulated by drought stress, including StLEA1-3, StLEA2-1, StLEA2-17, StLEA2-31, StASR-14, and StDHN-13. Their FPKM values ranged from 55.04–8636.74, and upregulation (log2FC) ranged from 2.03–12.13-fold. StDHN-1 expression was upregulated by 12.13-fold and the FPKM value reached 8636.74 after exposure to drought stress. The induction of these genes by mannitol-induced drought stress was at a level similar to that induced by drought stress, but the expression level was significantly lower than that induced by drought stress. Among the 11 drought-induced genes, StLEA2-17 and StASR-3 expression was inhibited by mannitol, indicating that mannitol stress could not fully reflect the response of plants to drought. Salt and heat-induced StLEA gene expression was significantly lower than that induced by drought, but StLEA3-13, StDHN-1, StDHN-3, and StASR-4 expression was significantly induced by salt stress (FPKM 58.37–508.653; log2FC 1.06–2.54). Moreover, the expression of StLEA3-13 and StDHN-1 was also induced by heat. Few studies investigating the induction of StLEA by mechanical damage exist. The response of genes to mechanical damage could simulate the response to insect bites. Analysis of StLEA expression patterns by primary and secondary wounding treatments showed that mechanical damage induced upregulation of 44 StLEA genes, with that of StLEA3-3 and StDHN-3 being the most significant. After secondary wounding, the FPKM value of StLEA3-3 was >3000, with a 3.30-fold upregulation (log2FC). The expression and upregulation levels of StLEA2-14, StLEA2-17, StLEA2-29, StLEA3-2, and StASR-1 were also much higher than those of other StLEA genes. Based on the above results, the StLEA3, StDHN, and StASR subgroups would be excellent genetic resources to exploit in order to promote stress resistance in the potato.

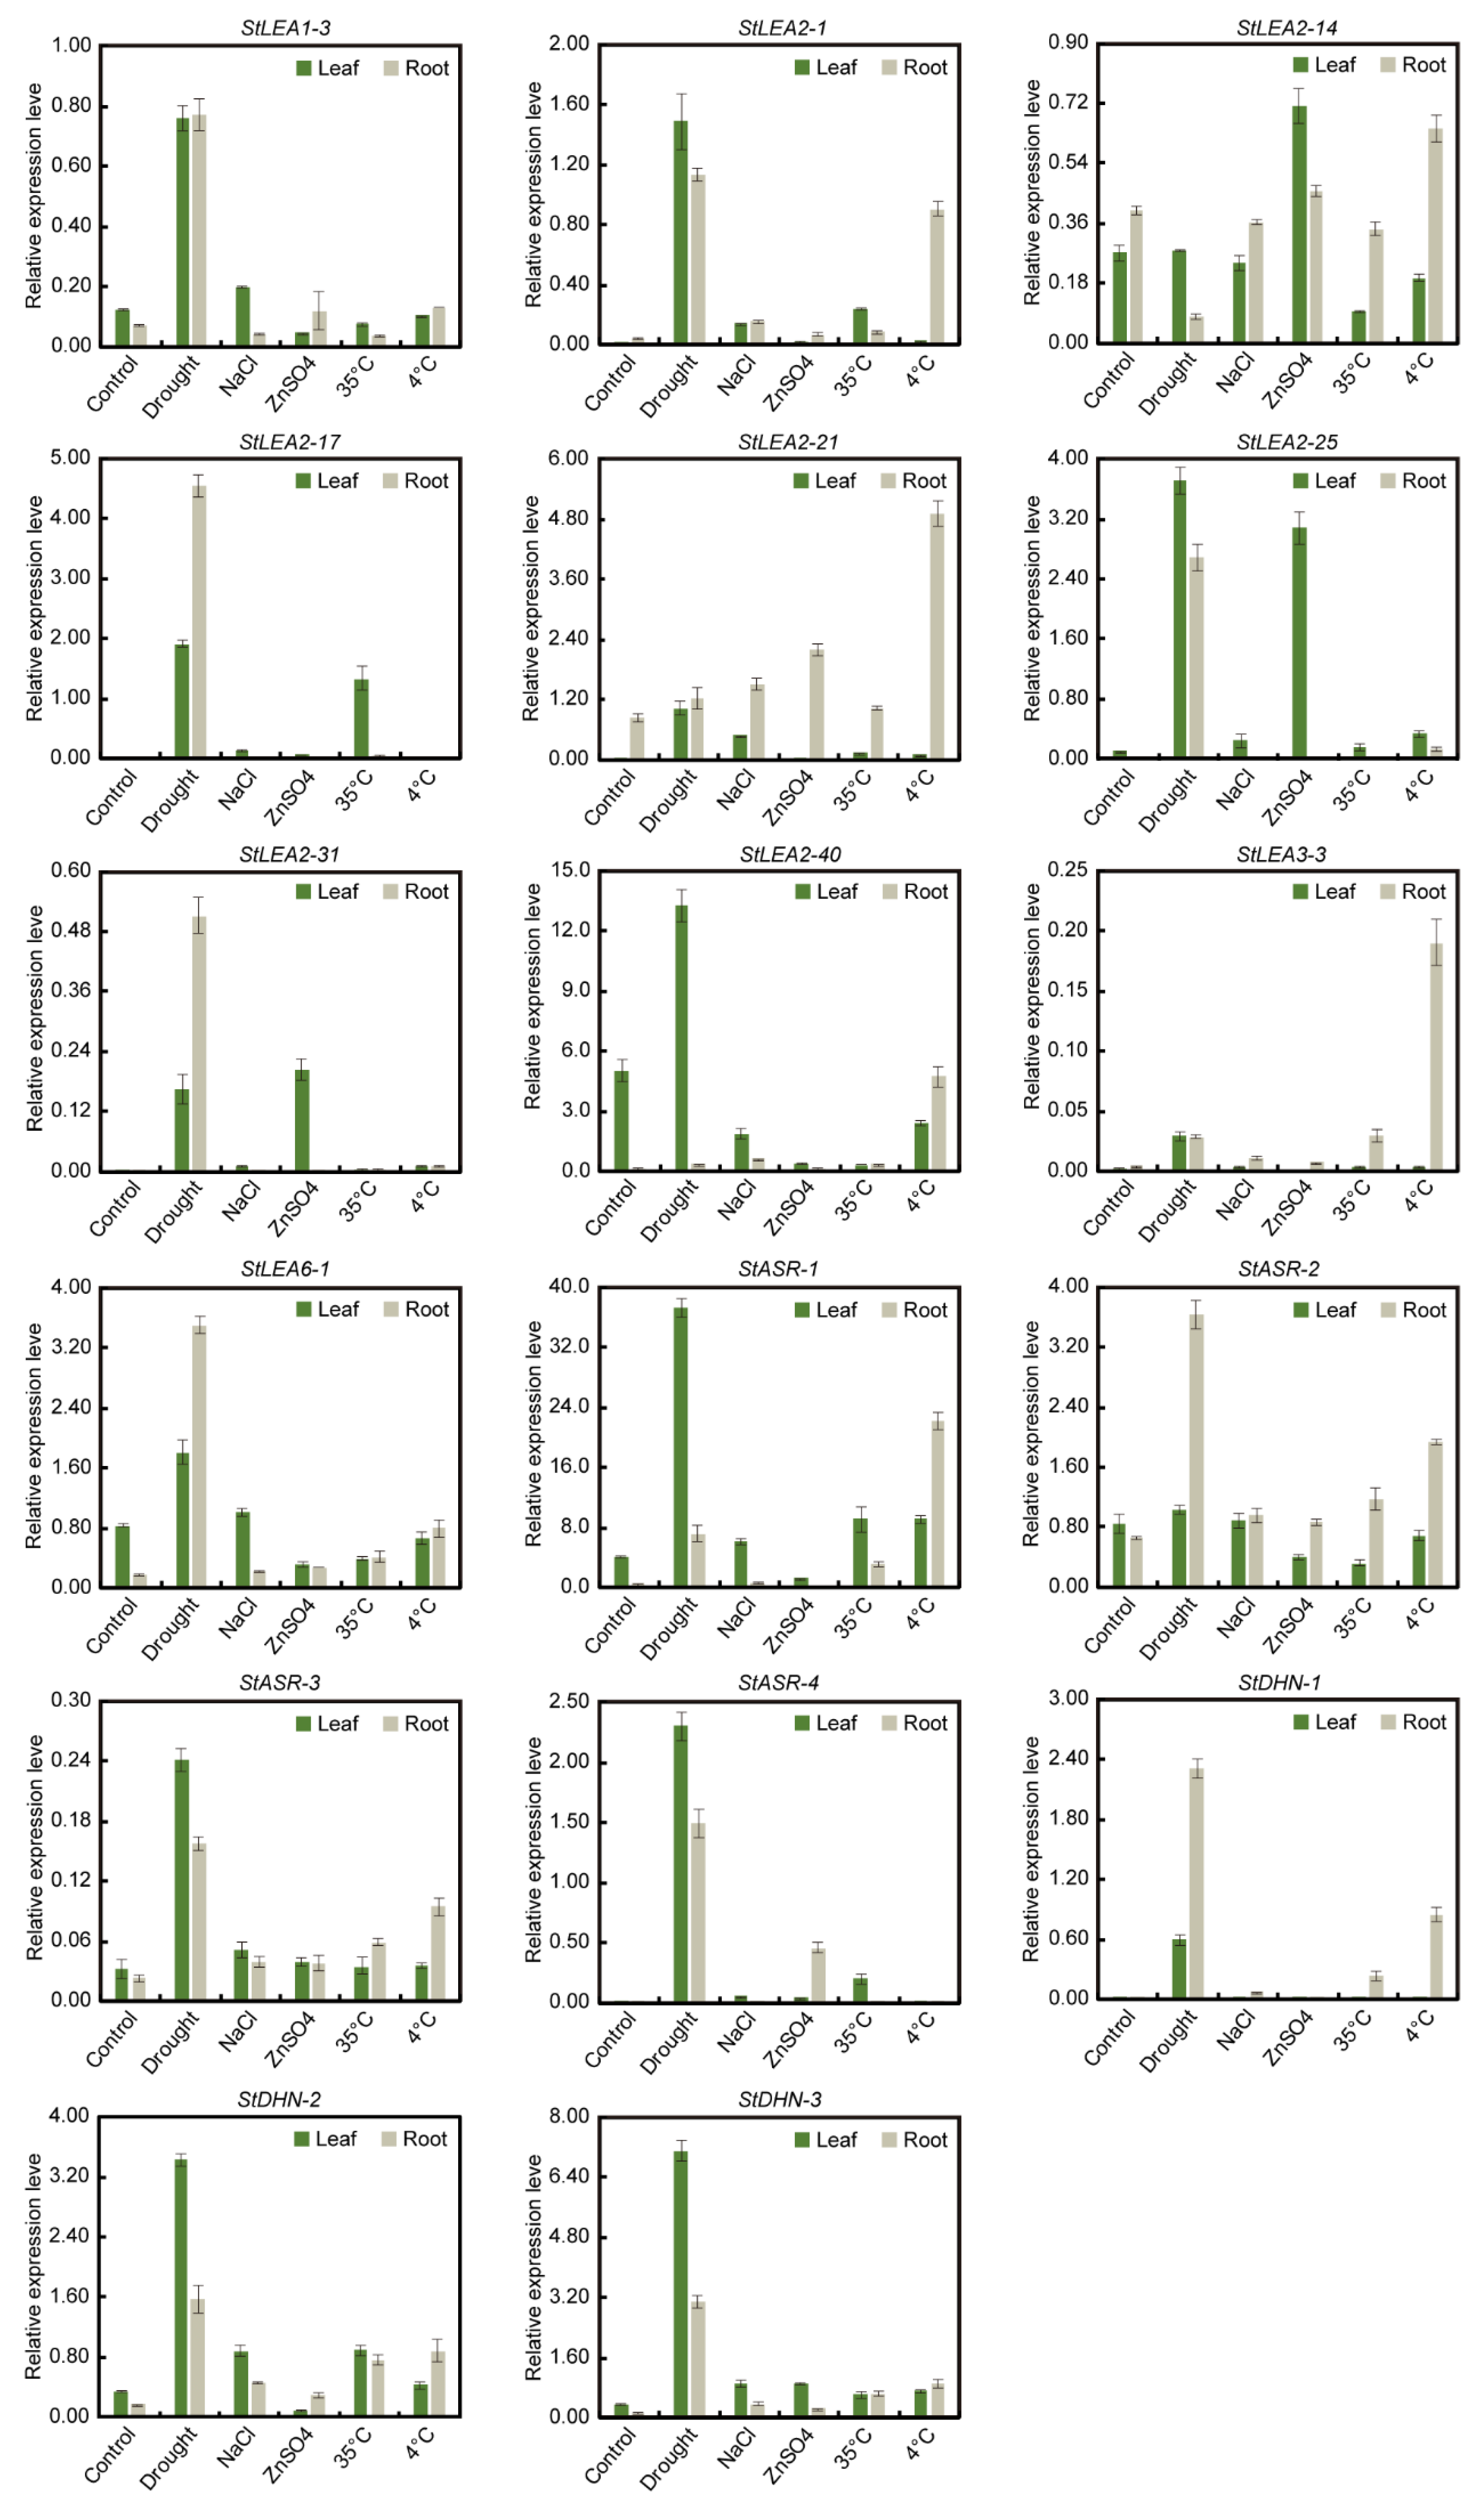
3.7. qRT-PCR Analysis of Potato LEA Genes under Abiotic Stresses

To verify the potential role of StLEA genes in abiotic stress, 17 candidate genes of six subgroups with high expression levels were selected, and their expression in potato roots and leaves after treatment with drought, salt, heavy metals, high temperature, and low temperature was analysed by qRT-PCR.
The results of qRT-PCR showed that the expression of these StLEA genes was induced by different stress treatments (Figure 5). Most significantly, drought stress induced the expression of 16 StLEA genes in leaves and roots, excepting StLEA2-14. The highest expression was of StASR-1 followed by StLEA2-40. After drought induction, the expression of five genes (StLEA2-17, StLEA2-31, StLEA6-1, StDNH-1, and StASR-2) in roots was significantly higher than that in leaves, the expression of three genes (StLEA1-3, StLEA2-21, and StLEA3-3) was similar in roots and leaves, and the other eight genes were more highly expressed in leaves. In response to low temperature, the expression of 15 StLEA genes was upregulated, excepting StLEA2–17 and StASR-4. However, compared with the response to drought, 13 of the 15 LEA genes were significantly upregulated in roots, especially StLEA2-1, StLEA2-21, StLEA3-3, and StDNH-1. The response pattern of LEA to NaCl stress was similar to that to drought stress. Apart from StLEA2-14, the expression of the remaining 16 StLEA genes in leaves and roots was upregulated to varying degrees, but the degree to which they were upregulated was significantly lower than relative to drought-induced expression. The extent to which 17 genes were induced by high temperature was also lower relative to induction by drought. However, the expression of 14 genes, excepting StLEA1-3, StLEA2-14, and StLEA2-40, was also upregulated. The mild upregulation by salt and high temperature stress may be related to insufficient treatment strength. Moreover, the induction of heavy metal stress by StLEA was not as obvious as that of the first four stresses. Apart from StLEA2-14, StLEA2-21, StLEA2-25, StLEA2-31, and StASR-4, the other 12 detected genes were downregulated or minimally different from control levels.
Overall, the expression pattern of most StLEA genes under different stresses measured by qRT-PCR analysis was similar to that shown by RNA-seq of data in the Spud DB database. However, some differences existed. For example, under drought stress, the expression of StLEA2-40, StLEA3-3, and StLEA6-1 of 17 selected StLEA genes in leaves of Cooperation-88 was contrary to that in leaves of RH, which may be related to the plant material and intensity of stress treatment. Most of the StLEA genes were induced by drought, low temperature, salt, and high temperature, and a few were induced by heavy metal exposure. The response of StLEA genes to abiotic stresses differed between leaves and roots.

4. Discussion

4.1. Molecular Characteristics and Evolution of the Potato LEA Gene Family

Potato production is threatened by a variety of environmental stresses due to global climate change, especially drought and high temperature, which is driving the need for a greater understanding of the genes in potatoes that are able to cope with these stresses [36]. The LEA gene plays an important role in the response to abiotic stress in O. sativa, A. thaliana, P. trichocarpa, and other plants [1,4,10,12]. Charfeddine et al. [19] identified 29 potato LEA family members, while more than 50 members of the LEA family have been identified in A. thaliana and P. trichocarpa [1,37], and more than 100 members in Brassica napus and upland cotton [3,38]. In this study, 74 genes of the potato LEA family were identified by genomic analysis, and were divided into nine subgroups. Their common characteristics include that they have small molecular weights, are rich in hydrophilic amino acids, and contain few introns [3,6]. Indeed, no StLEA gene has more than two introns, similar to the trehalose-6-phosphate synthase gene family, which has also been shown to be a stress-response gene family [39]. The small number of introns is a result of genetic evolution, which allows genes to regulate rapidly in response to stress [40].
An analysis of the StLEA protein family revealed that each StLEA group contains conserved motifs that have been identified in other species, including Oryza, Arabidopsis, S. lycopersicum, and P. tabuliformis, [5,10,15,37]. One such motif is a lysine-rich residue K segment contained in the DHN group, indicating that the evolution of the LEA protein was more conserved in plants. However, each group had a uniquely conserved motif. The results of the phylogenetic and expression analyses of StLEA indicated that the function of the LEA protein has group specificity, and members of the same group may have originated from gene expansion within that group [6]. Gene replication plays an important role in the expansion of gene families in a genome. Potato genome sequencing and analysis results have shown that at least two genome replication processes have taken place during the formation of the potato genome [31,41]. Through phylogenetic and chromosomal localisation analysis, 17 sister gene pairs were identified, including four tandem duplicates and two segmental duplications. The StASR family was concentrated on chromosome 4, and all of members were clustered in a small region (Figure 3). These results suggest that the chromosomal location of the StLEA gene may be the result of gene replication patterns, and the expansion of the gene family may mainly depend on independent duplication of individual sequences, followed by tandem duplication and segmental chromosomal duplication events.

4.2. Expression and Function of Potato LEA in Response to Abiotic Stress

Many studies have shown that LEA genes play an important role in abiotic stress, especially in drought resistance [38,42]. According to the expression pattern of StLEA, some StLEA genes (StASR-2, StLEA3-3, StDHN-3, StLEA2-29, and StLEA2-14) were highly expressed in various tissues (Figure 4A), indicating that they were involved in the normal growth and development of the potato. Other genes have higher expression levels in certain tissues, indicating functional differentiation of genes in the StLEA gene family. Moreover, LEA subgroups have evolved different adaptive effects against abiotic stresses, as reported in D. officinale, P. tabuliformis, and upland cotton [3,5,6]. According to the results of an RNA-seq expression analysis, the response of the StLEA4, StLEA5, StLEA6, and StSMP subgroups to various stresses was not obvious. The StLEA3 and StDHN subgroups showed a high response to abiotic stress, with only StLEA1-3 being prominent in the LEA1 subgroup. The StLEA2 subgroup was diverse due to its large number of members. Indeed, StLEA2-14 and StLEA2-37 were induced by all stresses, while StLEA2-28 was inhibited by all stresses. Moreover, some genes were upregulated after various stresses, such as StLEA2-14, StLEA3-3, and StDHN-1 (Figure 4B), whose functions in potato stress tolerance warrant further study. ASR proteins have been independently reported by Caramelo and Iusem [43]. As their structure is similar to LEA proteins, Hunault and Jaspard [7] classified them into the LEA family. It has been reported that the expression of ASR is indeed induced by ABA and water stress (Figure 4B), and its expression level is high during fruit ripening [8]. In this study, the expression of all members of the StASR group was regulated by ABA, and was also induced by IAA and GA3, but inhibited by BAP. It was additionally induced by various abiotic stresses, especially drought, high temperature, and mechanical damage (Figure 4B). The high expression of StASR-2 in various tissues indicates that ASR genes are also involved in growth and development. These results indicate that the ASR group is a valuable genetic resource in stress resistance research.
The expression patterns of 17 candidate genes in potatoes under drought, salt, high temperature, low temperature, and heavy metal stress were analysed by qRT-PCR. The majority of StLEA subgroups were expressed in different tissues in response to these stresses, especially drought and low temperature, followed by salt and high temperature, and a few genes were induced by heavy metal stress (Figure 5). In the tomato, five genes from the LEA1, LEA2, LEA4, and DHN groups were upregulated after drought and salt stress [15], while in rice, LEA1, LEA2, LEA3 and DHN group genes strongly responded to osmotic stress, salt, and ABA exposure [44,45]. In addition, overexpression of LEA1 also increased drought resistance in rice [45]. Similarly, in Brassica juncea, two DHN genes were induced by Zn/Cd, and overexpression increased heavy metal resistance in tobacco [46]. These results indicate that the LEA genes play important roles in plant resistance to various abiotic stresses.
In conclusion, a total of 74 StLEA genes were identified in S. tuberosum and classified into nine groups. Chromosomal location and duplication analysis revealed that 74 StLEA genes were distributed in all S. tuberosum chromosomes with some gene clustering. All StLEA genes contained the LEA motif and had few introns. StLEA genes belonging to the same group exhibit similar gene structures. The knowledge garnered from this study may increase understanding of LEA genes in S. tuberosum in order to lay the foundation for further investigations of the functions of LEA proteins.

Supplementary Materials

The following are available online at https://0-www-mdpi-com.brum.beds.ac.uk/2073-4425/10/2/148/s1, Table S1: Primers for qRT-PCR analysis.

Author Contributions

Conceptualization, Y.C. and M.G.; methodology, Y.C., B.Z., J.Y., Y.Y. and C.K.; software, Y.C. and B.Z.; validation, C.L. (Canhui Li) and M.G.; formal analysis, Y.C., B.Z. and J.Y.; investigation, Y.C., Y.Y., C.K. and C.L. (Chunxia Lei); resources, C.L. (Canhui Li); data curation, Y.C.; writing—original draft preparation, Y.C.; writing—review and editing, Y.C., C.L. (Canhui Li) and M.G.; visualization, Y.C.; supervision, M.G.; project administration, M.G.; funding acquisition, M.G.

Funding

This research was funded by National Natural Science Foundation of China, grant number 31460059 and 31860062.

Acknowledgments

We are thankful for funding from the National Natural Science Foundation of China 31460059 and 31860062.

Conflicts of Interest

The authors declare no conflict of interest. The funders had no role in the design of the study; in the collection, analyses, or interpretation of data; in the writing of the manuscript, or in the decision to publish the results.

References

  1. Lan, T.; Gao, J.; Zeng, Q.Y. Genome-wide analysis of the LEA (late embryogenesis abundant) protein gene family in Populus trichocarpa. Tree Genet. Genomes 2013, 9, 253–264. [Google Scholar] [CrossRef]
  2. Huang, A.; Zhong, X.J.; He, J.; Jin, S.H.; Guo, H.D.; Yu, X.F.; Zhou, Y.J.; Li, X.; Ma, M.D.; Chen, Q.B.; et al. Genome-wide identification, characterization, and stress-responsive expression profiling of genes encoding LEA (late embryogenesis abundant) proteins in Moso bamboo (Phyllostachys edulis). PLoS ONE 2016, 1, e0165953. [Google Scholar] [CrossRef] [PubMed]
  3. Magwanga, R.O.; Lu, P.; Kirungu, J.N.; Lu, H.; Wang, X.; Cai, X.; Zhou, Z.; Zhang, Z.; Salih, H.; Wang, K.; et al. Characterization of the late embryogenesis abundant (LEA) proteins family and their role in drought stress tolerance in upland cotton. BMC Genet. 2018, 19, 6. [Google Scholar] [CrossRef] [PubMed]
  4. Battaglia, M.; Covarrubias, A.A. Late embryogenesis abundant (LEA) proteins in legumes. Front. Plant Sci. 2013, 4, 190. [Google Scholar] [CrossRef]
  5. Gao, J.; Lan, T. Functional characterization of the late embryogenesis abundant (LEA) protein gene family from Pinus tabuliformis (Pinaceae) in Escherichia coli. Sci. Rep. 2016, 6, 19467. [Google Scholar] [CrossRef] [PubMed]
  6. Ling, H.; Zeng, X.; Guo, S. Functional insights into the late embryogenesis abundant (LEA) protein family from Dendrobium officinale (Orchidaceae) using an Escherichia coli system. Sci. Rep. 2016, 6, 39693. [Google Scholar] [CrossRef] [PubMed]
  7. Hunault, G.; Jaspard, E. LEAPdb: A database for the late embryogenesis abundant proteins. BMC Genom. 2010, 11, 221. [Google Scholar] [CrossRef] [PubMed]
  8. González, R.M.; Iusem, N.D. Twenty years of research on Asr, (ABA-stress-ripening) genes and proteins. Planta 2014, 239, 941–949. [Google Scholar] [CrossRef] [PubMed]
  9. Wetzler, D.E.; Wightman, F.F.; Bucci, H.A.; Rinaldi, J.; Caramelo, J.J.; Iusem, N.D.; Ricardi, M.M. Conformational plasticity of the intrinsically disordered protein ASR1 modulates its function as a drought stress-responsive gene. PLoS ONE 2018, 13, e0202808. [Google Scholar] [CrossRef]
  10. Wang, X.S.; Zhu, H.B.; Jin, G.L.; Liu, H.L.; Wu, W.R.; Zhu, J. Genome-scale identification and analysis of LEA genes in rice (Oryza sativa L.). Plant Sci. 2007, 172, 414–420. [Google Scholar] [CrossRef]
  11. Choi, D.W.; Zhu, B.; Close, T.J. The barley (Hordeum vulgare L.) dehydrin multigene family: Sequences, allele types, chromosome assignments, and expression characteristics of 11 Dhn genes of cv Dicktoo. Theor. Appl. Genet. 2007, 98, 1234–1247. [Google Scholar] [CrossRef]
  12. Hundertmark, M.; Hincha, D.K. LEA (Late Embryogenesis Abundant) proteins and their encoding genes in Arabidopsis thaliana. BMC Genom. 2008, 9, 118. [Google Scholar] [CrossRef] [PubMed]
  13. Du, D.; Zhang, Q.; Cheng, T.; Pan, H.; Yang, W.; Sun, L. Genome-wide identification and analysis of late embryogenesis abundant (LEA) genes in Prunus mume. Mol. Biol. Rep. 2013, 40, 1937–1946. [Google Scholar] [CrossRef] [PubMed]
  14. Liang, D.; Xia, H.; Wu, S.; Ma, F.W. Genome-wide identification and expression profiling of dehydrin gene family in Malus domestica. Mol. Biol. Rep. 2012, 39, 10759–10768. [Google Scholar] [CrossRef]
  15. Cao, J.; Li, X. Identification and phylogenetic analysis of late embryogenesis abundant proteins family in tomato (Solanum lycopersicum). Planta 2015, 241, 757–772. [Google Scholar] [CrossRef] [PubMed]
  16. Hatanaka, R.; Gusev, O.; Cornette, R.; Shimura, S.; Kikuta, S.; Okada, J.; Okuda, T. Diversity of the expression profiles of late embryogenesis abundant (LEA) protein encoding genes in the anhydrobiotic midge Polypedilum vanderplanki. Planta 2015, 242, 451–459. [Google Scholar] [CrossRef] [PubMed]
  17. Olvera-Carrillo, Y.; Campos, F.; Reyes, L.; Garciarrubio, A.; Covarrubias, A.A. Functional analysis of the group 4 late embryogenesis abundant proteins reveals their relevance in the adaptive response during water deficit in Arabidopsis. Plant Physiol. 2010, 154, 373–390. [Google Scholar] [CrossRef]
  18. Tolleter, D.; Hincha, D.K.; Macherel, D. A mitochondrial late embryogenesis abundant protein stabilizes model membranes in the dry state. BBA-Mol. Basis Dis. 2010, 1798, 1926–1933. [Google Scholar] [CrossRef] [Green Version]
  19. Charfeddine, S.; Saïdi, M.N.; Charfeddine, M.; Gargouri-Bouzid, R. Genome-wide identification and expression profiling of the late embryogenesis abundant genes in potato with emphasis on dehydrins. Mol. Biol. Rep. 2015, 42, 1163–1174. [Google Scholar] [CrossRef]
  20. Zamora-Briseño, J.A.; de Jiménez, E.S. A LEA 4 protein up-regulated by ABA is involved in drought response in maize roots. Mol. Biol. Rep. 2016, 43, 221–228. [Google Scholar] [CrossRef]
  21. Jeon, O.S.; Kim, C.S.; Lee, S.P.; Kang, S.K.; Kim, C.M.; Kang, B.G.; Hur, Y.; Kim, I.J. Fruit ripening-related expression of a gene encoding group 5 late embryogenesis abundant protein in Citrus. J. Plant Biol. 2006, 49, 403–408. [Google Scholar] [CrossRef]
  22. Kim, I.J.; Lee, J.; Han, J.A.; Kim, C.S.; Hur, Y. Citrus Lea promoter confers fruit-preferential and stress-inducible gene expression in Arabidopsis. Can. J. Plant Sci. 2011, 91, 459–466. [Google Scholar] [CrossRef]
  23. Zhao, Q.; Liu, J.; Xu, X.; Xu, Q.; Gao, W.; Xu, J. PicW orthologs from spruce with differential freezing tolerance expressed in Escherichia coli. Int. J. Biol. Macromol. 2017, 101, 595–602. [Google Scholar] [CrossRef]
  24. Zhang, H.; Shi, Y.; Liu, X.; Wang, R.; Li, J.; Xu, J. Transgenic creeping bentgrass plants expressing a Picea wilsonii dehydrin gene (PicW) demonstrate improved freezing tolerance. Mol. Biol. Rep. 2018, 45, 1627–1635. [Google Scholar] [CrossRef] [PubMed]
  25. De Jong, H. Impact of the potato on society. Am. J. Potato Res. 2016, 93, 415–429. [Google Scholar] [CrossRef]
  26. Iwama, K.; Yamaguchi, J. Abiotic stresses. In Handbook of Potato Production, Improvement and Post-Harvest Management; Gopal, J., Khurana, S.M.P., Eds.; Food Product Press: New York, NY, USA, 2006; pp. 231–278. [Google Scholar]
  27. Cabello, R.; Monneveux, P.; de Mendiburu, F.; Bonierbale, M. Comparison of yield based drought tolerance indices in improved varieties, genetic stocks and landraces of potato (Solanum tuberosum L.). Euphytica 2013, 193, 147–156. [Google Scholar] [CrossRef]
  28. Rykaczewska, K. Impact of heat and drought stresses on size and quality of the potato yield. Plant Soil Environ. 2017, 63, 40–46. [Google Scholar] [CrossRef] [Green Version]
  29. Kumar, S.; Stecher, G.; Li, M.; Knyaz, C.; Tamura, K. MEGA X: Molecular evolutionary genetics analysis across computing platforms. Mol. Biol. Evol. 2018, 35, 1547–1549. [Google Scholar] [CrossRef]
  30. Huang, S.; Gao, Y.; Liu, J.; Peng, X.; Niu, X.; Fei, Z.; Cao, S.; Liu, Y. Genome-wide analysis of WRKY transcription factors in Solanum lycopersicum. Mol. Genet. Genom. 2012, 287, 495–513. [Google Scholar] [CrossRef]
  31. Potato Genome Sequencing Consortium. Genome sequence and analysis of the tuber crop potato. Nature 2011, 475, 189–195. [Google Scholar] [CrossRef] [Green Version]
  32. Schmittgen, T.D.; Livak, K.J. Analyzing real-time PCR data by the comparative CT method. Nat. Protoc. 2008, 3, 1101–1108. [Google Scholar] [CrossRef] [PubMed]
  33. Nicot, N.; Hausman, J.F.; Hoffmann, L.; Evers, D. Housekeeping gene selection for real-time RT-PCR normalization in potato during biotic and abiotic stress. J. Exp. Bot. 2005, 56, 2907–2914. [Google Scholar] [CrossRef] [PubMed] [Green Version]
  34. Hanada, K.; Zou, C.; Lehti-Shiu, M.D.; Shinozaki, K.; Shiu, S.H. Importance of lineage specific expansion of plant tandem duplicates in the adaptive response to environmental stimuli. Plant Physiol. 2008, 148, 993–1003. [Google Scholar] [CrossRef] [PubMed]
  35. Gu, Z.; Cavalcanti, A.; Chen, F.C.; Bouman, P.; Li, W.H. Extent of gene duplication in the genomes of Drosophila, nematode, and yeast. Mol. Biol. Evol. 2002, 19, 256–262. [Google Scholar] [CrossRef] [PubMed]
  36. George, T.S.; Taylor, M.A.; Dodd, I.C.; White, P.J. Climate change and consequences for potato production: A review of tolerance to emerging abiotic stress. Potato Res. 2017, 60, 239–268. [Google Scholar] [CrossRef]
  37. Bies-Ethève, N.; Gaubier-Comella, P.; Debures, A.; Lasserre, E.; Jobet, E.; Raynal, M.; Cooke, R.; Delseny, M. Inventory, evolution and expression profiling diversity of the LEA (late embryogenesis abundant) protein gene family in Arabidopsis thaliana. Plant Mol. Biol. 2008, 67, 107–124. [Google Scholar] [CrossRef] [PubMed]
  38. Liang, Y.; Xiong, Z.; Zheng, J.; Xu, D.; Zhu, Z.; Xiang, J.; Gan, J.; Raboanatahiry, N.; Yin, Y.; Li, M. Genome-wide identification, structural analysis and new insights into late embryogenesis abundant (LEA) gene family formation pattern in Brassica napus. Sci. Rep. 2016, 6, 24265. [Google Scholar] [CrossRef]
  39. Xie, D.W.; Wang, X.N.; Fu, L.S.; Sun, J.; Zheng, W.; Li, Z.F. Identification of the trehalose-6-phosphate synthase gene family in winter wheat and expression analysis under conditions of freezing stress. J. Genet. 2015, 94, 55–65. [Google Scholar] [CrossRef]
  40. Jeffares, D.C.; Penkett, C.J.; Bähler, J. Rapidly regulated genes are intron poor. Trends Genet. 2008, 24, 375–378. [Google Scholar] [CrossRef]
  41. Jue, D.; Sang, X.; Lu, S.; Dong, C.; Zhao, Q.; Chen, H.; Jia, L. Genome-wide identification, phylogenetic and expression analyses of the ubiquitin-conjugating enzyme gene family in maize. PLoS ONE 2015, 10, e0143488. [Google Scholar] [CrossRef]
  42. Shimizu, T.; Kanamori, Y.; Furuki, T.; Kikawada, T.; Okuda, T.; Takahashi, T.; Mihara, H.; Sakurai, M. Desiccation-induced structuralization and glass formation of group 3 late embryogenesis abundant protein model peptides. Biochemistry 2010, 49, 1093–1104. [Google Scholar] [CrossRef] [PubMed]
  43. Caramelo, J.J.; Iusem, N.D. When cells lose water: Lessons from biophysics and molecular biology. Prog. Biophys. Mol. Biol. 2009, 99, 1–6. [Google Scholar] [CrossRef] [PubMed]
  44. Sengupta, S.; Majumder, A.L. Insight into the salt tolerance factors of a wild halophytic rice, Porteresia coarctata: A physiological and proteomic approach. Planta 2009, 229, 911–929. [Google Scholar] [CrossRef] [PubMed]
  45. Yu, J.; Lai, Y.; Wu, X.; Wu, G.; Guo, C. Overexpression of OsEm1 encoding a group I LEA protein confers enhanced drought tolerance in rice. Biochem. Biophys. Res. Commun. 2016, 478, 703–709. [Google Scholar] [CrossRef] [PubMed]
  46. Xu, J.; Zhang, Y.X.; Wei, W.; Han, L.; Guan, Z.Q.; Wang, Z.; Chai, T.Y. BjDHNs confer heavy-metal tolerance in plants. Mol. Biotechnol. 2008, 38, 91–98. [Google Scholar] [CrossRef] [PubMed]
Figure 1. Phylogenetic analysis of potato late embryogenesis-abundant (LEA) proteins. The evolutionary tree of LEA proteins was constructed using MEGA X software [29], with ClustalW alignment, the neighbour-joining method, the bootstrap method, and 1000 repetitions. The LEA1, LEA2, LEA3, LEA4, LEA5, LEA6 ASR, DHN, and seed maturation protein (SMP) subgroups are presented in green, light green, light blue, orange, grey, red, purple, yellow, and blue, respectively. The sister pairs are circled using the same ellipses.
Genes 10 00148 g001
Figure 2. Exon-intron structure and motif distribution of the StLEA genes in the potato. (A), phylogenetic relationship and exon-intron structure, exon-intron are indicated by wide color bar and gray line, respectively. (B), Motif distribution, which was predicted by MEME online tool.
Genes 10 00148 g002
Figure 3. Distribution of Solanum tuberosum LEA (StLEA) gene family members on potato chromosomes. The genes at two ends of orange lines mean the potential partial duplicated gene pairs. The orange bar indicates the tandem repeated genes. StLEA1, StLEA2, StLEA3, StLEA4, StLEA5, StLEA6, StASR, StDHN and StSMP subgroup are presented in red, black, orange, dark green, dark red, yellow, purple, blue and pink.
Genes 10 00148 g003
Figure 4. Expression profiling of StLEA genes in (A) different tissues and (B) under different induction conditions.
Genes 10 00148 g004
Figure 5. Expression profiles of 17 potato LEA genes under various abiotic stresses. Green and light gray green column indicates leaf and root, respectively. Values represent mean ± standard deviation of three replicates.
Genes 10 00148 g005
Table 1. Description of late embryogenesis-abundant (LEA) genes identified from the potato genome.
Spud IDNameAmino Acid NumberMWpIInstability IndexAliphatic IndexGRAVY
PGSC0003DMG400002093LEA1-112313,268.019.44871.54−0.715
PGSC0003DMG400011437LEA1-29610,361.499.2228.338.85−1.161
PGSC0003DMG400011438LEA1-3889261.339.2217.230.34−1.116
PGSC0003DMG400011439LEA1-427126,6288.193.0244.06−0.589
PGSC0003DMG400001819LEA1-510411,515.895.9429.7665.96−0.828
PGSC0003DMG400000066LEA2-116317,950.674.7420.5496.2−0.153
PGSC0003DMG400002090LEA2-219122,310.069.4731.39102.880.103
PGSC0003DMG400002586LEA2-326729,063.0810.2736.2483−0.136
PGSC0003DMG400005073LEA2-422725,846.59.9352.1782.03−0.292
PGSC0003DMG400005685LEA2-522125,174.219.0635.71103.62−0.015
PGSC0003DMG400005783LEA2-623526,022.569.8743.17100.72−0.039
PGSC0003DMG400000067LEA2-717519,281.124.5733.54101.83−0.189
PGSC0003DMG400005898LEA2-820823,404.169.0848.26103.510.089
PGSC0003DMG400006460LEA2-932035,591.615.3426.7189.47−0.463
PGSC0003DMG400008711LEA2-1027029,709.539.7745.4387.63−0.15
PGSC0003DMG400011296LEA2-1122825,291.929.6950.24105.880.133
PGSC0003DMG400000069LEA2-1222324,906.29.6819.7794.71−0.111
PGSC0003DMG400012142LEA2-1319721,631.879.135.7985.530.197
PGSC0003DMG400013715LEA2-1432035,609.514.8324.2396.19−0.41
PGSC0003DMG400015214LEA2-1525829,131.5110.136.09102.33−0.092
PGSC0003DMG400016390LEA2-1622926,053.188.9743.1577.42−0.154
PGSC0003DMG400016420LEA2-1721123,915.699.4440.9688.67−0.132
PGSC0003DMG400000115LEA2-1819821,541.049.6920.03850.171
PGSC0003DMG400018355LEA2-1922425,280.388.7249.7587.95−0.169
PGSC0003DMG400019407LEA2-2017519,541.284.7925.2487.94−0.362
PGSC0003DMG400019632LEA2-2125728,453.3710.1946.6272.18−0.325
PGSC0003DMG400019639LEA2-2220923,687.59.3638.63108.560.115
PGSC0003DMG400020863LEA2-2320422,542.599.5334.85118.430.245
PGSC0003DMG400020886LEA2-2420423,102.859.734.4687.94−0.19
PGSC0003DMG400021454LEA2-2525929,397.6110.0640.4192.12−0.344
PGSC0003DMG400000476LEA2-2620924,030.0110.0540.7298.76−0.191
PGSC0003DMG400024324LEA2-2719322,002.629.8336.55103.52−0.051
PGSC0003DMG400026335LEA2-2810712,026.846.5843.2493.74−0.077
PGSC0003DMG400028151LEA2-2921124,106.869.5952.8491.8−0.153
PGSC0003DMG400028152LEA2-3022526,077.189.2942.6286.18−0.279
PGSC0003DMG400028153LEA2-3123026,121.299.1146.8389−0.219
PGSC0003DMG400028235LEA2-3222526,126.219.343.0486.62−0.318
PGSC0003DMG400029777LEA2-3322724,670.789.4128.14105.150.257
PGSC0003DMG400000583LEA2-3421323,996.849.4131.4590.56−0.098
PGSC0003DMG400032803LEA2-3530234,188.989.1142.4286.46−0.198
PGSC0003DMG400037897LEA2-3623526,782.179.5951.4895.7−0.196
PGSC0003DMG401019715LEA2-3726029,590.689.5746.7791.08−0.217
PGSC0003DMG401021419LEA2-3819221,050.619.5325.77100.050.177
PGSC0003DMG401027691LEA2-3921424,317.339.5540.9292.94−0.204
PGSC0003DMG402002623LEA2-4031034,258.259.7555.9276.03−0.324
PGSC0003DMG400012315LEA2-4119722,684.3310.4252.1690.56−0.23
PGSC0003DMG400012355LEA2-4222325,2749.6833.4187.4−0.217
PGSC0003DMG400042041LEA2-4310111,316.6510.0218.01107.030.242
PGSC0003DMG400002014LEA2-4426329,204.889.9743.8387−0.222
PGSC0003DMG400002082LEA2-4522225,335.229.5141.8991.76−0.106
PGSC0003DMG400004703LEA3-19710,887.169.241.757.22−0.903
PGSC0003DMG400017936LEA3-2899786.039.6645.7366.85−0.473
PGSC0003DMG400031788LEA3-39810,402.739.8951.6773.67−0.351
Sotub08g019440.1.1LEA3-4849575.089.6649.9865−0.554
PGSC0003DMG400002731LEA4-140043,122.455.4626.5651−1.093
PGSC0003DMG400019976LEA4-250153,302.675.3229.557.56−0.816
PGSC0003DMG400029706LEA4-325528,437.988.8439.0347.61−1.112
PGSC0003DMG400006648LEA5-19310,011.845.9155.0840.97−1.446
PGSC0003DMG400008497LEA5-210010,855.849.160.3138.1−1.469
PGSC0003DMG400041241LEA5-310511,740.4710.0768.2168.67−1.017
PGSC0003DMG400024942LEA6-1889221.925.1142.0246.7−1.125
PGSC0003DMG400003530DHN-114014,534.017.0734.8215.36−1.268
PGSC0003DMG400003531DHN-215716,659.067.2321.8636.69−1.214
PGSC0003DMG400009968DHN-320923,673.145.2463.9147.56−1.499
PGSC0003DMG400015495DHN-4808544.275.929.9137.88−1.31
PGSC0003DMG400030949DHN-524325,121.947.3823.9459.92−0.715
PGSC0003DMG400019328SMP-125726,335.964.4740.1680.54−0.251
PGSC0003DMG400022470SMP-220621,737.036.7848.1574.03−0.729
Sotub09g023980.1.1SMP-325926,563.444.741.1574.09−0.353
Sotub09g023990.1.1SMP-426325,839.644.6235.4773.57−0.184
PGSC0003DMG400006661ASR-130633,956.664.9228.9119.87−1.629
PGSC0003DMG400006662ASR-210912,370.746.5740.2254.86−1.294
PGSC0003DMG400006663ASR-311112,481.959.2541.4752.97−1.31
PGSC0003DMG400024093ASR-410812,158.496.6546.3752.59−1.235
Note: MW, Molecular weight (Da); pI, Isoelectric point; GRAVY, Grand average of hydropathicity.

