Article

Selection of Suitable Reference Genes for RT-qPCR Gene Expression Analysis in Siberian Wild Rye (Elymus sibiricus) under Different Experimental Conditions

The State Key Laboratory of Grassland Agro-Ecosystems, Key Laboratory of Grassland Livestock Industry Innovation, Ministry of Agriculture and Rural Affairs, College of Pastoral Agriculture Science and Technology, Lanzhou University, Lanzhou 730020, China
*
Authors to whom correspondence should be addressed.
Submission received: 23 April 2019 / Revised: 5 June 2019 / Accepted: 11 June 2019 / Published: 13 June 2019
(This article belongs to the Section Plant Genetics and Genomics)

Abstract

:
Elymus sibiricus, which is a perennial and self-pollinated grass, is the typical species of the genus Elymus, which plays an important role in forage production and ecological restoration. No reports have, so far, systematically described the selection of optimal reference genes for reverse transcriptase quantitative real-time polymerase chain reaction (RT-qPCR) analysis in E. sibiricus. The goals of this study were to evaluate the expression stability of 13 candidate reference genes in different experimental conditions, and to determine the appropriate reference genes for gene expression analysis in E. sibiricus. Five methods including Delta Ct (ΔCt), BestKeeper, NormFinder, geNorm, and RefFinder were used to assess the expression stability of 13 potential reference genes. The results of the RefFinder analysis showed that TBP2 and HIS3 were the most stable reference genes in different genotypes. TUA2 and PP2A had the most stable expression in different developmental stages. TBP2 and PP2A were suitable reference genes in different tissues. Under salt stress, ACT2 and TBP2 were identified as the most stable reference genes. ACT2 and TUA2 showed the most stability under heat stress. For cold stress, PP2A and ACT2 presented the highest degree of expression stability. DNAJ and U2AF were considered as the most stable reference genes under osmotic stress. The optimal reference genes were selected to investigate the expression pattern of target gene CSLE6 in different conditions. This study provides suitable reference genes for further gene expression analysis using RT-qPCR in E. sibiricus.

1. Introduction

Elymus is the largest genus of the tribe Triticeae with worldwide distribution, including approximately 150 species [1]. E. sibiricus (Siberian wild rye), which is the typical species of the genus Elymus, is a perennial, allotetraploid, and self-pollination grass [2,3]. It is one of the most important forages in Northern China due to its high protein content, strong adaptability, superior cold, and drought tolerance [4]. Meanwhile, E. sibiricus were widely used in artificial grassland and ecological governance in recent years [5]. It is noteworthy that severe seed shattering is the main reason for seed yield losses in E. sibiricus. According to previous reports, the degree of seed shattering in E. sibiricus was related to genotypes [3,6], the development of abscission zone [4], and several key genes involved in plant hormones, lignin biosynthesis, and cell wall-degrading enzymes (e.g., ETR, PAL, and CesA) found by transcriptome sequencing [7]. Currently, the regulatory mechanisms associated with seed shattering in E. sibiricus has not been clearly elucidated. As a result, the analysis of expression patterns of these key genes will contribute to a better understanding of regulatory mechanisms regarding seed shattering in E. sibiricus. The appropriate reference gene is crucial for the gene expression analysis in E. sibiricus.
Reverse transcriptase quantitative real-time polymerase chain reaction (RT-qPCR) is a sensitive, precise, specific, rapid, and repeatable method to investigate and quantify the gene expression level [8,9,10]. However, the application of RT-qPCR are commonly affected by several factors, including the quality of RNA (purity and integrity), the efficiency of cDNA (complementary DNA) synthesis, reaction parameters, and primer specificity [11,12]. Therefore, in order to obtain the accurate normalization of RT-qPCR, it is necessary to screen the suitable reference genes for correcting the above-mentioned experimental errors [13,14].
Currently, transcriptome sequencing has been widely used in plant biological research, which greatly facilitates the understanding of important molecular mechanisms in plants [15,16]. Simultaneously, transcriptome data provide important resources for identification and exploration of reference genes. An optimal reference gene should be expressed at a constant level across various experimental conditions such as different genotypes, developmental stages or tissues, and even different abiotic stress. Hence, housekeeping genes are usually selected as the reference genes without validating their performance since their expression levels were thought to be stable [17,18,19]. Nevertheless, a large number of research studies recently found that the common reference genes like glyceraldehydes-3-phosphate dehydrogenase (GAPDH), β-actin (ACT), and 18S ribosomal RNA (18S rRNA) had significantly different expression levels under different tissues or different experimental treatments [20,21,22,23]. Consequently, it is essential to validate the stability of potential reference genes, which can effectively identify whether candidate reference genes are suitable for current experimental conditions. Using improper reference genes will lead to inappropriate interpretations [24]. It is reported that the expression stability of reference genes showed divergence in different species. For instance, TUB was a suitable reference gene for normalization of RT-qPCR in Sedum alfredii [25] and Jatropha curcas [26], but had the worst expression stability in Rhododendron molle [27] and Camellia sinensis [28]. The reason for this phenomenon may be the difference in the primer design and evaluation method, the distinct experimental conditions, and the diversity of gene function among different species [29]. Therefore, screening the reference genes that possess a high degree of expression stability in specific species is crucial to obtain the accurate results of RT-qPCR. Up to now, many suitable reference genes have been reported from different plants, including Arabidopsis thaliana [30], rice [31], Tibetan hulless barley [32], soybean [21], orchardgrass [33], Seashore paspalum [34], Kentucky bluegrass [35], and Setaria viridis [36]. However, there is no report for the selection of suitable reference genes for RT-qPCR analysis in E. sibiricus.
The objective of this study is to screen suitable reference genes with stable expression under various experimental conditions. Thirteen candidate reference genes including actin2 (ACT2), cyclophilin19 (CYP19), DNAJ heat shock N-terminal domain-containing protein (DNAJ), eukaryotic translation initiation factor 3A (eIF-3A), eukaryotic translation initiation factor 3C (eIF-3C), glyceraldehyde-3-phosphate dehydrogenase (GAPDH), histone 3.3 (HIS3), protein phosphatase 2A (PP2A), TATA-binding protein 2 (TBP2), translation elongation factor 2 (TEF2), tubulin α-2 (TUA2), tubulin β-3 (TUB3), and U2 auxiliary factor (U2AF) were selected from the transcriptome data of E. sibiricus [7].

2. Materials and Methods

2.1. Plant Materials and Growth Conditions

In the present study, six wild E. sibiricus accessions (Table S1) were selected based on a previous screening for agronomic traits in 28 E. sibiricus accessions [37]. The materials seeds were germinated in the petri dish for 30 days, and then transplanted to 10 cm (diameter) flowerpots filling with 40% peat soil, 40% vermiculite, and 20% washed sand. The seedlings were grown in the greenhouse under 12 h of a photoperiod at 28 °C/14 °C day and night temperatures and 30% relative air humidity. Routine management was carried out during the whole process of growth.

2.2. Treatments and Tissue Collection

Six accessions were used to analyze the expression of reference genes, and three clones with consistent growth of each genotype were selected as three biological replicates. A total of 138 samples were collected from different genotypes, developmental stages, organs, and stress treatments (Table 1).
Specially, for gene expression analysis across different genotypes, leaf samples were collected from six different genotypes (ZN, XH, MQ, HZ, LQ, and LT) at 4–6 leaves stages. Leaf samples were collected from genotype ZN at different developmental stages: seedling, tillering, jointing, heading, and flowering. Tissue samples were collected from root, stem, leaf, and inflorescence at the flowering stage. For stress treatment, 4–6 leaf stage plants were removed from the soil and transferred to Hoagland’s solution. For salt treatment, plants were treated by adding 250 mmol/L NaCl to Hoagland’s solution for 0, 12, and 24 h. For osmotic stress, plants were treated by adding 20% PEG6000 to Hoagland’s solution for 0, 12, and 24 h. For heat stress, plants were moved to a growth chamber at 40 °C for 0, 12, and 24 h. For cold stress, plants were moved to another growth chamber at 3 °C for 0, 12, and 24 h. All samples were frozen in liquid nitrogen and stored in a −80 °C refrigerator for later use.

2.3. RNA Extraction

Total RNA was extracted from each tissue using the plant Total RNA Kit (Sangon Biotech, Shanghai, China), according to the manufacturer’s instructions. The concentration and purity of extracted RNA were measured by NanoDrop ND-1000 spectrophotometer (NanoDrop Technologies, Wilmington, DE, USA). Only the RNA absorbing ratio of 1.8–2.0 at OD260 nm/OD280 nm and 2.0–2.6 at OD260 nm/OD230 nm were used for subsequent analysis. In addition, the integrity of RNA was evaluated by 1% agarose gel electrophoresis.

2.4. First-Strand cDNA Synthesis

The cDNA synthesis was performed with the M-MLV cDNA synthesis kit (Sangon Biotech, Shanghai, China), according to the manufacturer’s instructions. First, one microgram RNA was mixed with 1 μL oligonucleotide dT primer (0.5 µg/µL) in a 1.5 mL centrifuge tube, and then RNase free double distilled water was added to a final volume of 12 μL. Second, the reaction mixture was centrifuged for 3 to 5 s. The tube was incubated at 65 °C for 5 min, which was followed by cooling in ice cubes for 30 sec. Then, the mixture was centrifuged for 3–5 s. Third, the 5× Reaction Buffer 4 μL, RNase Inhibitor (40 U/μL) 1 μL, dNTP Mix (10 mmol/L) 2 μL, and M-MuLV RT (200 U/μL) 1 μL were added to the tube. Then the reaction mixture was centrifuged for 3–5 s. The first-strand cDNA was synthesized by incubating at 42 °C for 45 min. Lastly, reverse transcription was terminated by heating the reaction mixture for 10 min at 70 °C. The cDNA sample was stored at −80 °C and diluted 1:20 using RNase free water before RT-qPCR analysis.

2.5. Selection of Candidate Reference Genes and Primer Design

In this study, we selected 13 potential reference genes and one target gene (Table 2). These genes were obtained from our transcriptome database (https://0-www-ncbi-nlm-nih-gov.brum.beds.ac.uk/sra/SRX2617497) [7] by BLAST search using the sequences of reported Arabidopsis and rice reference genes. The 14 genes were named based on their similarity to known nucleotide sequences with the BLAST score value greater than 600 and identity ranging from 89% to 97% [33]. The primers for RT-qPCR were designed via Primer Premier 6.0 using the following parameters: melting temperature (Tm) at 58–62 °C (optimum Tm of 60 °C), PCR product length at 100–300 bp, GC content at 45–55%, and length of primers at 18–25 bp (Table 3).

2.6. RT-qPCR

We conducted RT-qPCR in 96-well blocks with a Bio-Rad CFX96 real-time PCR system (Bio-Rad, Hercules, CA, USA). The final reaction volume was 10 μL, and each reaction mix contained 2xSG Fast qPCR Master Mix (Low Rox) (Sangon Biotech, Shanghai, China) 5 µL, 10 μM Forward Primer 0.2 µL, 10 μM Reverse Primer 0.2 µL, 30 ng/µL cDNA 1 µL, DNF Buffer 1 µL, and ddH2O 2.6 µL. The amplification procedure included a denaturation step at 95 °C for 3 min, which was followed by 40 cycles of 95 °C for 3 s and 60 °C for 30 s. After the cycling process, the melting curves of RT-qPCR amplifications were obtained by raising the temperature from 60 °C to 95 °C. We also selected target gene CSLE6 to assess the expression stability of reference genes. Each RT-qPCR reaction was carried out for the independent sample with three technical replicates.

2.7. Data Analysis

In the present study, the expression stability of candidate reference genes was evaluated with four algorithms: (geNorm v3.5) (https://genorm.cmgg.be/) [38], (NormFinder v0.953) (https://moma.dk/normfinder-software) [39], (BestKeeper v1.0) (https://www.gene-quantification.de/bestkeeper.html) [40], and Delta Ct [41], and then a comprehensive ranking was obtained by the RefFinder program [42]. The raw RT-qPCR data were obtained by the CFX equipment software, and the Cq (cycle quantification) values were used for further analysis. For geNorm and NormFinder methods, raw Cq values were converted into the relative quantities, according to the formula 2−ΔCq (ΔCq = each corresponding Cq value—lowest Cq value) [43]. The expression stability (M) of potential reference genes was calculated by the geNorm algorithm based on the average pairwise variation of each gene with all other control genes [38]. Genes with lower M values reflect more expression stability. To determine the optimal number of reference genes for normalization, the pairwise variations (V) were calculated by geNorm. If the Vn/Vn+1 (n is the number of reference genes) value is below or equal to 0.15, the number of suitable reference genes is equal to n. The degree of variance within and between groups was evaluated via an ANOVA-based model in the NormFinder program, and the gene with the lowest stability value has the most stable expression [39]. For the BestKeeper method, the standard deviation (SD), the coefficient of variation (CV), and correlation coefficient (r) were calculated by Cq values and the more stable reference gene possessed the lower SD value [40]. The Delta Ct algorithm used the standard deviation (SD) to rank the stability of all reference genes, and the reference gene with the lowest SD value showed the most stable performance. The RefFinder is a web-based analysis tool. It can integrate the results from Delta Ct, BestKeeper, NormFinder, and geNorm analysis to generate a comprehensive ranking. The RefFinder program (https://github.com/fulxie/RefFinder) running in my computer works as a local server, and we deployed it to a Php-based server (Apache + PHP) at first. The standard curves were generated by using a series of two-fold diluted cDNA as templates for each primer. The correlation coefficient (R2) and slope were obtained from the linear regression model in Microsoft Excel 2016, and the PCR efficiency (E) was calculated according to the formula: E = (10−1/slope − 1) × 100% [44]. The regression coefficient (R2) should be greater than 0.98 with the amplification efficiency (E) over 90% but less than 110%. To calculate the relative expression level of the target gene, the 2−ΔΔCt method [45] was applied, and the significant difference analysis was conducted by the SPSS statistical software v20.0.

3. Results

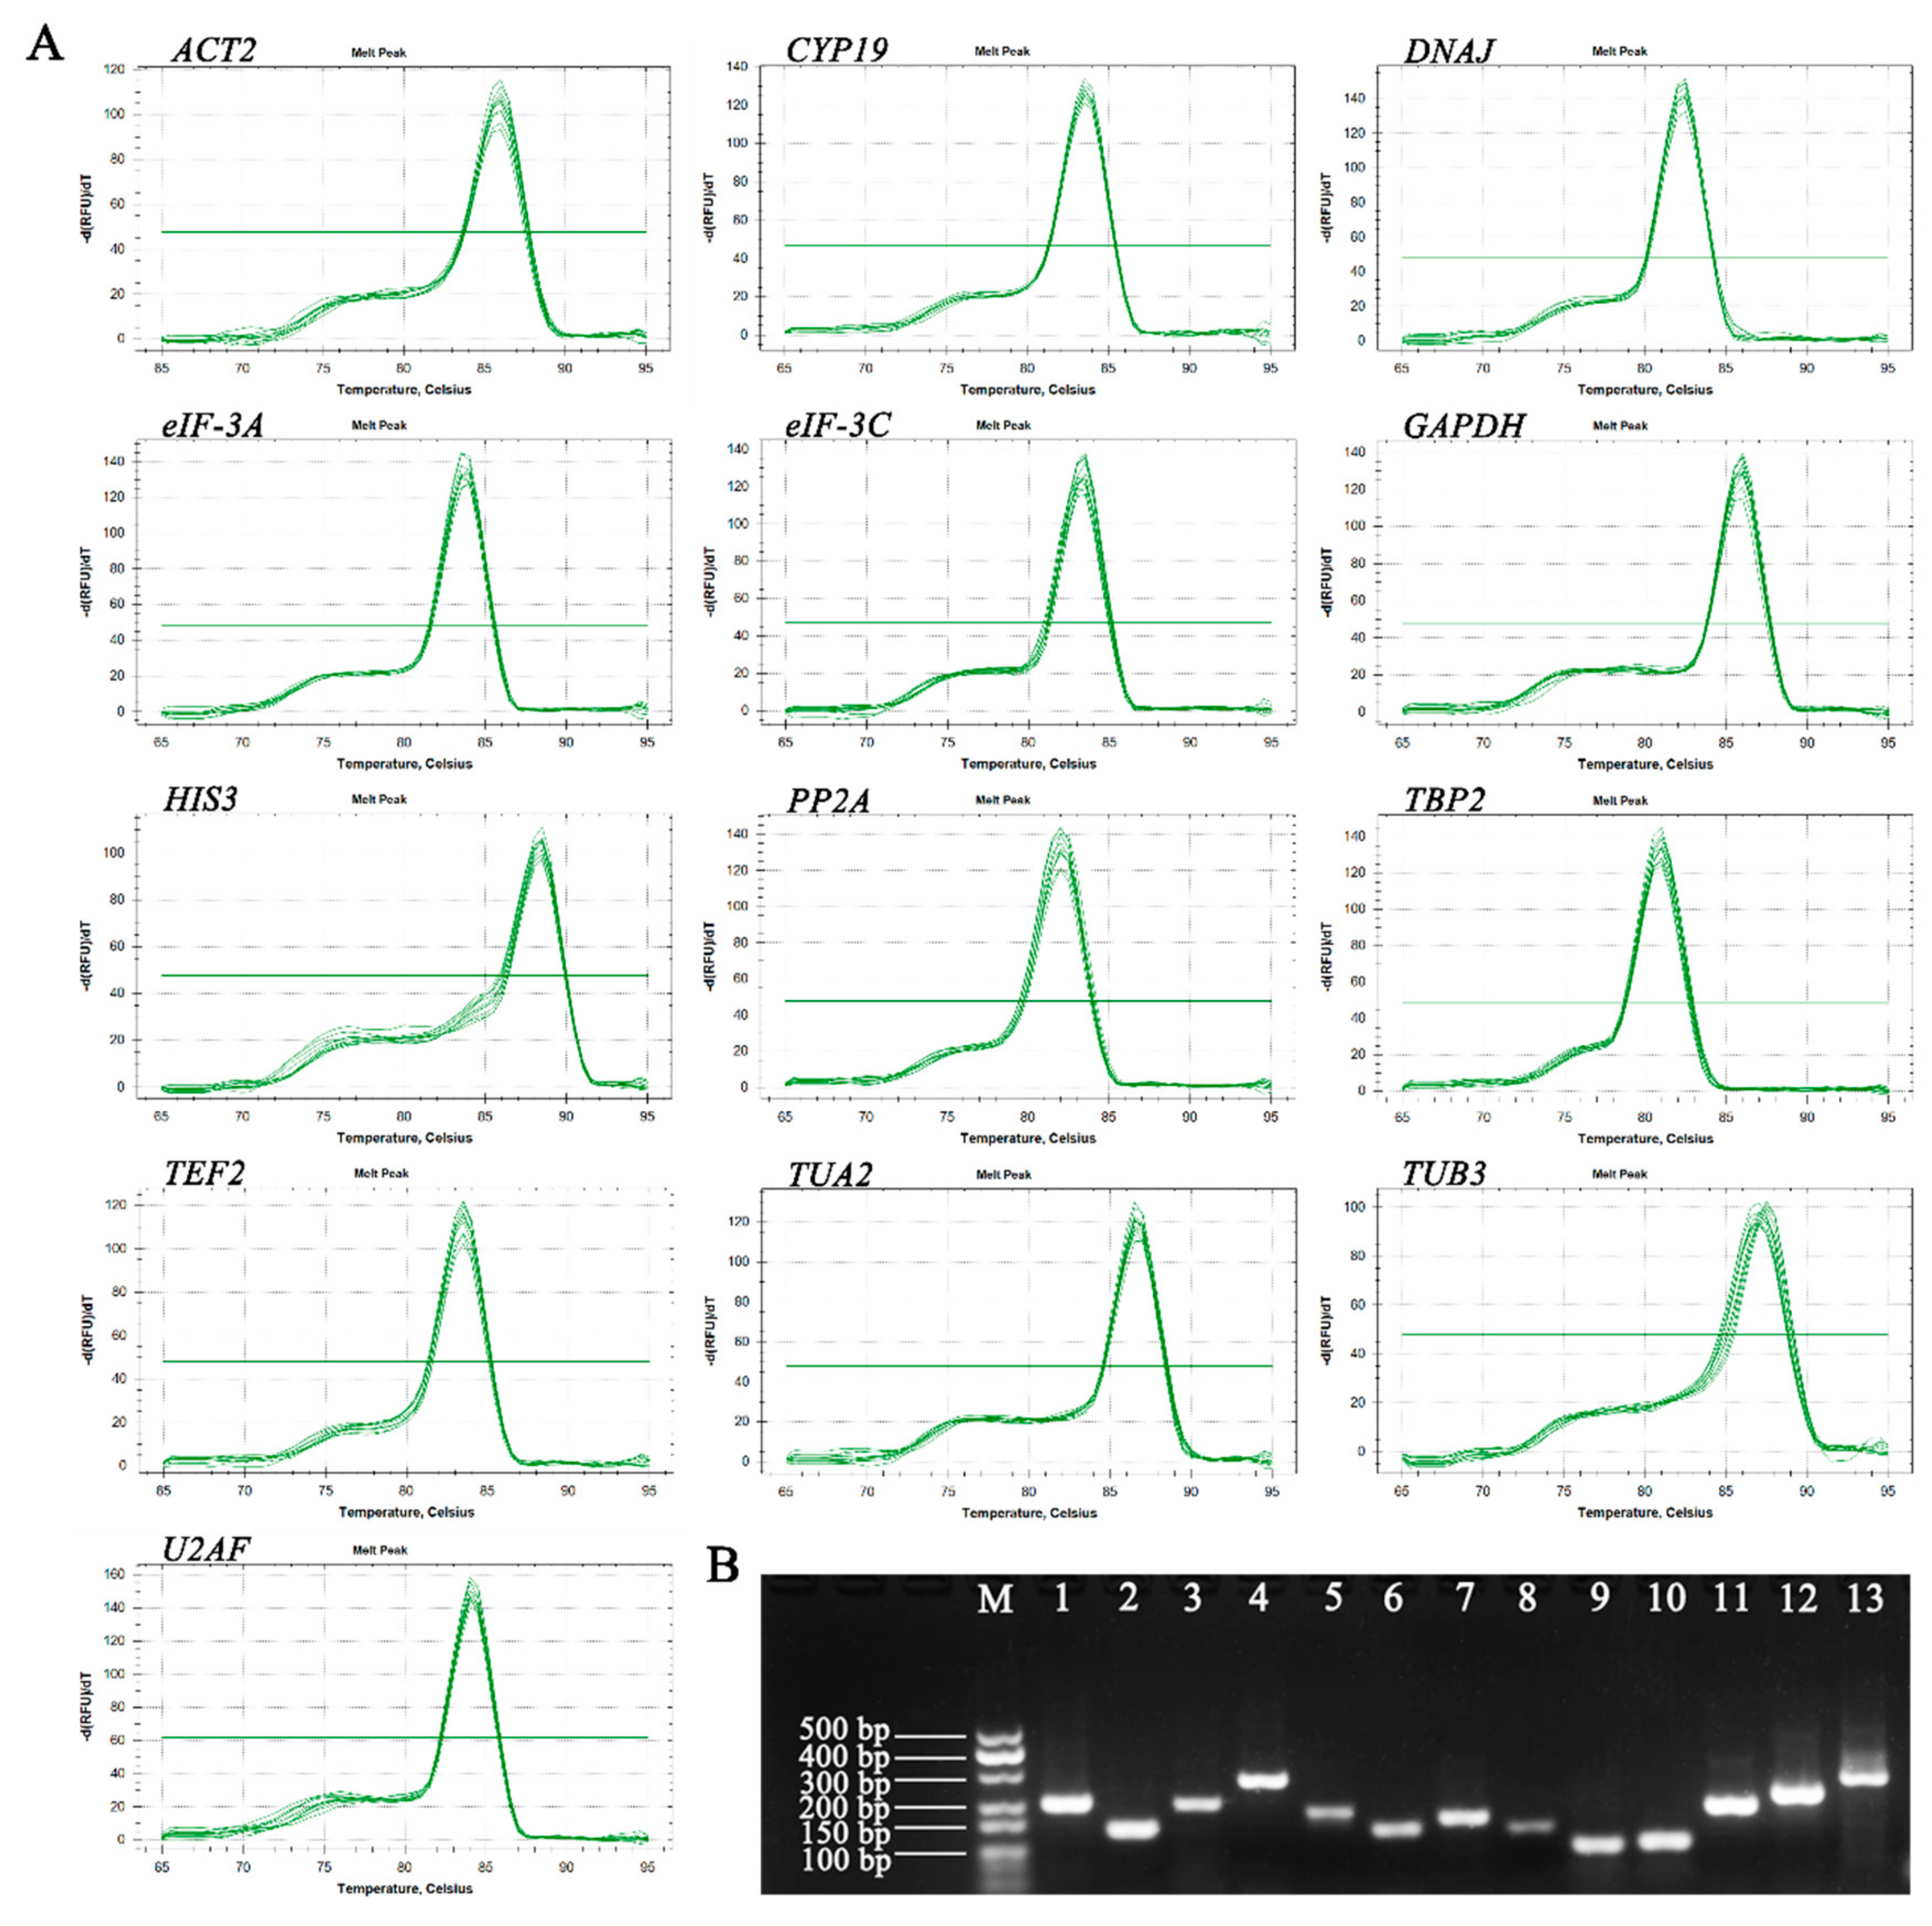
3.1. Verification of Primer Specificity and PCR Amplification Efficiency

In the present study, we selected 13 potential reference genes based on transcriptome data of E. sibiricus to investigate the expression stability under different conditions. Subsequently, specific primers for RT-qPCR were designed according to the sequences of 13 candidate reference genes. In order to check the specificity of all primers, agarose gel electrophoresis (2%) and melting curve analysis of the amplification products were conducted (Figure 1). The results of agarose gel electrophoresis showed that each primer amplified a single product of the expected size. Additionally, a single peak for each primer was observed from the melting curve analysis. These results indicated that all of the primers in this experiment were specific. The amplification efficiency (E) of 14 primers varied from 90.35% (DNAJ) to 101.08% (PP2A), and the regression coefficient (R2) ranged from 0.981 (ACT2) to 0.998 (GAPDH, TUB3 and U2AF).

3.2. Cq Data Collection and Variations in Reference Genes

In order to analyze the expression level of all potential reference genes under different experimental conditions, the Cq values of all samples were obtained by RT-qPCR (Figure 2). The Cq values of 13 candidate reference genes ranged from 19.3 (TUA2 expressed in the stem sample) to 39.44 (eIF-3A expressed in the root sample under osmotic stress for 24 h) among all samples. Furthermore, the top three highly expressed genes were HIS3 (mean Cq = 24.45), TUB3 (mean Cq = 25.32), and TUA2 (mean Cq = 25.49). Three lowly expressed genes were eIF-3A (mean Cq = 31.14), U2AF (mean Cq = 30.12), and eIF-3C (mean Cq = 29.57). The coefficient of variation (CV) of the Cq values reflects the expression stability of the reference gene, and the reference gene with a low CV value represents a high degree of stable expression. Therefore, eIF-3C (CV = 5.40%) possessed the most stable expression due to the lowest CV value, and the GAPDH (CV = 18.87%) with the highest CV value had the most unstable expression.

3.3. Expression Stability Analysis of the Candidate Reference Genes

To determine the most stable reference gene of E. sibiricus, four common algorithms (geNorm, NormFinder, BestKeeper, and Delta Ct) [38,39,40,41] and an integrated analysis tool (RefFinder) [42] were applied to assess the expression stability of all candidate reference genes. Moreover, the top six stable reference genes from the four algorithms were shown in Figure S1.

3.3.1. GeNorm Analysis

The expression stability of 13 potential reference genes in the different genotypes, developmental stages, tissues, and different abiotic stress treatments was evaluated by the geNorm algorithm (Figure 3). According to the threshold of M value recommended by the geNorm program, a candidate gene could be used as a reference gene for expression analysis only when its M value is under 1.5. Our results showed that DNAJ and eIF-3C were the most stable genes with the lowest M value (0.03) in different genotypes, while U2AF was the least stable gene with the highest M value (0.52) (Figure 3A). In different developmental stage samples (Figure 3B), the most stable genes were ACT2 and HIS3 (M = 0.29), while U2AF was the least stable gene (M = 0.99). eIF-3A and PP2A (M = 0.34) showed the most stability while ACT2 (M = 1.47) was identified as the least stable gene in different tissues (Figure 3C). ACT2 and TBP2 (M = 0.44) were the most stable genes under salt stress (Figure 3D), while GAPDH (M = 2.16) was the least stable gene. CYP19 and TUA2 (M = 0.30) had the most stability, whereas GAPDH (M = 1.46) had the worst stability in heat stress samples (Figure 3E). For the cold stress group (Figure 3F), TEF2 and U2AF (M = 0.21) were the most stable genes while eIF-3A (M = 1.59) was the least stable gene. Under osmotic stress (Figure 3G), DNAJ and U2AF (M = 0.38) showed the highest degree of expression stability while GAPDH (M = 1.83) presented the lowest degree of expression stability. Meanwhile, PP2A and TBP2 (M = 0.93) were the most stable genes in all samples and GAPDH (M = 2.00) was the least stable gene. In summary, the most stable gene was different in various experimental sample sets.
In order to obtain the optimal number of reference genes in different conditions, pairwise variation (V) was calculated by the geNorm program (Figure 4). Moreover, 0.15 was used as the threshold value to determine the optimal number of reference genes. For non-stress treatment groups (different genotypes, different developmental stages and different tissues), all pairwise variations except for V12/13 (0.265) of different tissues were lower than 0.15, which demonstrated that one reference gene was sufficient for gene expression analysis. For the stress groups (salt stress, heat stress, cold stress, and osmotic stress), however, it showed different results. The V6/7 (0.137) value from salt stress was lower than 0.15, which indicated that the top six reference genes (ACT2, TBP2, PP2A, TUB3, U2AF, and TEF2) were required for expression analysis. The V2/3 (0.120) value from heat stress samples was lower than 0.15, which suggested that the top two reference genes (CYP19 and TUA2) were sufficient for normalization. The V3/4 (0.144) value from the cold stress group was lower than 0.15, which indicated that the top three genes (TEF2, U2AF, and PP2A) were required for normalization. Nevertheless, the threshold value of 0.15 should not be regarded as a rigorous standard, and higher cut-off values of Vn/Vn+1 were also found in several reports [35,43,46]. A minor variation was found between V2/3 (0.156) and V3/4 (0.153) in samples from osmotic stress, which revealed that two reference genes (DNAJ and U2AF) were sufficient for expression analysis. Similarly, V3/4 (0.223) and V4/5 (0.225) from all samples showed slight variation, which illustrates that the top three genes (PP2A, TBP2, and DNAJ) were needed for normalization.

3.3.2. NormFinder Analysis

The 13 candidate reference genes were ranked based on the expression stability value calculated using the NormFinder program (Figure 5 and Table S2). The most stable gene possessed the highest expression stability value. Accordingly, TBP2 had the highest ranking in different genotypes and different tissues with the stability values of 0.10 and 0.07, respectively. PP2A was the most stable reference gene in different developmental stages, cold stress, and all samples with the stability values of 0.11, 0.23 and 0.29, respectively. As for the salt stress, heat stress, and osmotic stress, ACT2 was identified as the most stably expressed reference genes with the stability values of 0.15, 0.13, and 0.22, respectively. Although the most stable reference genes according to the NormFinder algorithm were different from that of geNorm in most of the experimental sets, the least stable reference genes in all groups were consistent between NormFinder and geNorm. For example, according to the geNorm analysis, DNAJ and CYP19 were the most stable reference genes in different genotypes and heat stress, whereas their stability rankings were ninth and fourth in the NormFinder analysis, respectively. Furthermore, U2AF, ACT2, GAPDH, and eIF-3A had lower expression stability among all experimental groups by using the geNorm and NormFinder program.

3.3.3. BestKeeper Analysis

The BestKeeper program was used to analyze the expression stability of 13 reference genes according to the values of standard deviation (SD), the coefficient of variation (CV), and correlation coefficient (r). The lower SD value of genes represented the higher expression stability (Figure 6 and Table S3). Hence, HIS3 was the most stable reference gene in different genotypes, while it ranked fifth and seventh in geNorm and NormFinder analysis, respectively. DNAJ exhibited the best expression stability in different developmental stages, which ranked third and fifth in geNorm and NormFinder analysis, respectively. In different tissues, TBP2 was the most stable reference gene in both BestKeeper and NormFinder analysis, but it ranked fourth in geNorm analysis. For salt stress, heat stress, cold stress, osmotic stress, and all samples, eIF-3C presented the most stable expression with the lowest SD values, while it had low ranking in geNorm and NormFinder analysis. U2AF, ACT2, GAPDH, and eIF-3A were considered to be the least stable genes in all experimental conditions due to their highest SD values, which was consistent with the results from geNorm and NormFinder analysis.

3.3.4. Delta Ct Analysis

The values of standard deviation (SD) was used as the indicator for evaluating the expression stability of reference genes using the Delta Ct method. A gene with the lowest SD value indicated the most stable reference gene (Figure 7 and Table S4). Accordingly, TBP2, PP2A, ACT2, and DNAJ showed the most stable expression in experimental conditions. Meanwhile, U2AF, ACT2, GAPDH, and eIF-3A were the least stable genes in all sample sets, which was consistent with geNorm, NormFinder, and BestKeeper analysis.

3.3.5. RefFinder Analysis

RefFinder, which is a comprehensive analysis tool for expression stability of reference genes, was used to calculate the synthetic rankings of 13 potential reference genes based on four approaches including geNorm, NormFinder, BestKeeper, and Delta Ct (Figure S2 and Table 4). For different genotypes, TBP2, HIS3, and CYP19 were the top three stable genes according to the RefFinder algorithm analysis. TUA6, PP2A, and HIS3 were considered as the three most stable genes for different developmental stages. In different tissues, TBP2, PP2A, and eIF-3A showed high expression stability. ACT2, TBP2, and PP2A were identified as the most stably expressed reference genes under salt stress. ACT2, TUA2, and CYP19 had the best expression stability under heat stress. PP2A, ACT2, and DNAJ exhibited a high level of expression stability under cold stress. As for osmotic stress, DNAJ, U2AF, and ACT2 were considered as the most stable genes. For all samples, PP2A, TBP2, and DNAJ were the most stable genes. However, U2AF was the least stable reference genes in different genotypes and different developmental stages. ACT2 was identified as the least stable reference genes in different tissues. Under salt stress, heat stress, and osmotic stress and for all samples, GAPDH had the worst expression stability. eIF-3A showed the lowest level of expression stability under cold stress.
The results of the above five methods indicated that the most stable genes differed when different experimental sample sets were compared, which illustrates the significance of suitable reference genes that are specific to each experimental condition. Therefore, the top two stable reference genes and the least reference gene in different experimental conditions were selected for validating the expression stability of reference genes, according to the RefFinder analysis.

3.4. Validation of the Stability of Reference Genes

In order to detect the performance of expression stability among reference genes, we selected two reference genes with a high degree of stability and one unstable gene to analyze the expression patterns of Cellulose synthase-like protein E6 gene (CSLE6) under different experimental conditions (Figure 8). The reference genes were selected for expression normalization in different experimental conditions as follows: TBP2, HIS3, and U2AF for different genotypes, TUA2, PP2A, and U2AF for different developmental stages, TBP2, PP2A, and ACT2 for different tissues, ACT2, TBP2, and GAPDH for salt stress, ACT2, TUA2, and GAPDH for heat stress, PP2A, ACT2, and eIF-3A for cold stress, DNAJ, U2AF, and GAPDH for osmotic stress. Meanwhile, the 2−ΔΔCt method was used to calculate the relative expression level of target gene CSLE6.
As shown in Figure 8, the expression patterns of CSLE6 generated by two stable reference genes were similar. In contrast, the relative expression level of CSLE6 showed abnormal trends when the unstable reference genes were selected for expression normalization. Moreover, there was no significant difference (p < 0.05) in the relative expression level of CSLE6 between two stable reference genes in most of the sample sets, while the expression trend of CSLE6 derived from unstable reference genes was significantly different from that of stable reference genes. For example, the relative expression level of CSLE6 in HZ (Figure 8A) and tillering (Figure 8B) samples were underestimated, and abnormally up-regulated expressions were found in the stem sample (Figure 8C), the root and leaf samples under salt stress at 24 h (Figure 8D), the root sample under heat stress at 12 h (Figure 8E), the leaf sample under cold stress (Figure 8F), and osmotic stress (Figure 8G) at 24 h. Furthermore, the expression pattern analysis of CSLE6 exhibited that CSLE6 had a high expression level in the HZ genotype sample, the tillering sample, and the leaf sample with non-stress treatment. The target gene also had high expression in the leaf sample under salt stress at 24 h, and in the root sample under heat and osmotic stress at 12 h. The expression level of CSLE6 was down-regulated in leaf and root samples under cold stress.

4. Discussion

RT-qPCR is an effective technique for gene expression analysis due to its high accuracy, simplicity, specificity, and sensitivity [8,9,10]. It is reported that inappropriate reference genes will lead to opposite conclusions in gene expression analysis [24]. Consequently, evaluating the expression stability of potential reference genes is necessary to quantify the expression level of target genes, and to analyze the expression pattern of genes of interest [47]. Numerous studies suggested that none of the reference genes maintain the consistent expression stability among various experimental conditions, and it is imperative to carry out reference gene screening under specific experimental conditions [11,29,48,49,50,51]. To our knowledge, there have been no studies regarding the selection of appropriate reference genes in E. sibiricus, and, thus, this study is the first report with respect to the systematic selection and evaluation of reference genes for RT-qPCR normalization in E. sibiricus.
In the present study, 13 candidate reference genes were selected from transcriptome sequencing data to evaluate their expression stability in different experimental conditions [7]. The results showed that all reference gene primers possessed good amplification efficiency (90.35% to 101.08%), regression coefficient (0.981 to 0.998) and Cq values (25 to 30), which illustrates that the RT-qPCR data are suitable for further analysis. Four commonly used methods including geNorm, NormFinder, BestKeeper, and Delta Ct [38,39,40,41] were used to assess the expression stability of 13 candidate reference genes. The results suggested that the least stable reference genes of the same experimental samples were consistent among four algorithms (Table 4), while the most stable reference genes were inconsistent in different conditions (Figure S1 and Table 4). For example, U2AF and ACT2 were unstable reference genes based on four algorithms in non-stress conditions. GAPDH and eIF-3A also had the worst stable performance under stress conditions. Furthermore, DNAJ was the most stable reference gene found by the geNorm algorithm in different genotypes, while it ranked ninth in NormFinder and Delta Ct analysis. The eIF-3C had the highest expression stability by the BestKeeper algorithm in four stress conditions, but it was considered the unstable reference gene in geNorm, NormFinder, and Delta Ct analysis. The heterogeneous result was also found in previous studies, and that may be caused by different algorithms [29,52]. Fortunately, we obtained an integrated evaluation result of potential reference genes by using RefFinder. RefFinder is regarded as a comprehensive analysis tool, which has extensive recognition in determining the optimal reference genes for gene expression analysis [12,21,53,54,55]. Lastly, we adopted the rankings derived from the RefFinder method as the ultimate evaluation results of expression stability of candidate reference genes, and selected suitable reference genes for validating the expression stability based on the results of RefFinder.
Previous studies demonstrated that there are no any reference genes with consistent expression stability among different conditions [11,29,48,49,50,51]. Our results were similar to previous studies. For example, ACT2 exhibited a high degree of expression stability under four stress conditions, whereas ACT2 was the least stable reference gene in different tissues. TUA2 was the most stable reference gene in different developmental stages, but it ranked eleventh under osmotic stress. These results indicated that the importance of selecting appropriate reference genes in different experimental conditions.
The plant cell wall provides a guarantee for plants to adapt to various environmental conditions. Cellulose, which is the main component of cell walls in the plant, is synthesized by cellulose synthases (CesA) [56]. A considerable number of cellulose synthase-like (CSL) genes have similarities with CesA gene [57], and, thus, the CSL gene also plays an important role in cellulose synthesis [58]. Previous research studies indicated that the expressions of cellulose synthesis genes are closely related to the adaptation of plants under different stress conditions [56]. In addition, other studies showed that cellulose synthesis genes were associated with shedding or shattering in leaves, flowers, fruits, and seed [7,59,60]. CSLE6, which is a member of the superfamily of genes referred to as glycosyltransferase 2 (GT2), has the function of synthesizing cellulose in the plant cell wall [61]. However, there are few studies regarding the CSLE6 gene. This gene was identified in Arabidopsis (At1g55850, named AtCSLE1) and rice (LOC_Os09g30130, named OsCSLE6), respectively [57,62]. In the present study, to validate the expression stability of reference genes, we selected CSLE6 as a target gene to investigate the expression pattern of CSLE6 in different conditions. Several previous reports suggested that selecting two or more stable reference genes to calculate the relative expression levels of target genes will generate more reliable results [21,25,26,63]. Hence, we selected two stable reference genes and the least stable reference gene in different conditions for the expression pattern analysis of CSLE6. As shown in Figure 8, CSLE6 exhibited distinct expression levels in different experimental conditions. In different genotypes, the expression level of CSLE6 in the ZN (low seed shattering) genotype was higher than the XH genotype (high seed shattering). This is similar to the OsCel9D [60], which is a seed shattering related gene. This gene indicates that CSLE6 may have similar functions in seed shattering. On the one hand, CSLE6 directly hampers the abscission process in seed shattering by changing the cell wall components, such as cellulose content and pectin content [60]. On the other hand, CSLE6 indirectly reduces the seed shattering by affecting the lignin biosynthesis that is closely related to seed shattering [64,65]. In different developmental stages, the order of expression levels of CSLE6 was tillering > flowering > jointing > seedling > heading. This is different from the previous study of E. sibiricus [7], likely due to different tissues and periods. Plants generate a large number of new leaves and cells during the tillering stage, which may explain that CSLE6 had the highest expression in the tillering stage. For different tissues, the order of expression levels of CSLE6 is leaf > root > stem > inflorescence > tiller bud. This was similar to Arabidopsis [62], which the highest expression was found in the leaf sample. This was followed by the root sample. The leaf samples in this analysis were not young leaves (flowering stage) and the cellulose accounts for a high proportion in the cell wall, where the high expression of CSLE6 may play a role in replacing the homogalacturonan (HGA) in the cell wall [62,66]. Furthermore, previous reports revealed that cellulose synthesis genes usually have high expression in tissues with cell division and expansion, such as root and hypocotyl [64,67]. Under salt stress, the expression of CSLE6 in leaf and root samples showed a trend of decreasing first and then increasing, which is different from that in Arabidopsis [68]. For cold stress, the expression level of CSLE6 was down-regulated in leaf and root samples. Many studies indicated that abiotic stress (e.g., salt stress and cold stress) will reduce the cell expansion and inhibit plant growth [69,70,71]. In addition, the expression levels of a great number of cellulose synthesis genes were reduced by cold stress or salt stress in Arabidopsis [62,67], poplar [72], and cotton [73], while these genes showed increased expression in rice [74]. Hence, the cellulose synthesis genes have distinct expression patterns in different experimental conditions and different species because of the multiple ways in which plants adapt to the environment. More importantly, the above results illustrated that the diverse expression patterns of CSLE6 reflected the adaptation mechanisms for E. sibiricus under a variety of environmental conditions.

5. Conclusions

In summary, the most stable reference genes were different under distinct experimental conditions in this study. To obtain the precise results of gene expression analysis, it is recommended to adopt suitable reference genes in specific experimental conditions. One or more stable reference genes should be selected to investigate the expression pattern of target genes based on the comprehensive evaluation results from RefFinder. The expression pattern of CSLE6 may provide a basis for studying the resistance mechanism in E. sibiricus. Moreover, our study screened several suitable reference genes in specific conditions for E. sibiricus, and offered some guidelines for the selection of reference genes for other plant species.

Supplementary Materials

The following are available online at https://0-www-mdpi-com.brum.beds.ac.uk/2073-4425/10/6/451/s1. Figure S1: The top six most stable reference genes generated by delta Ct, BestKeeper, NormFinder, and geNorm. The purple, yellow, green, pink, and circles each contain the top six most stable reference genes of delta Ct, BestKeeper, NormFinder, and geNorm, respectively. The genes in the overlap area are the ones confirmed as the top six most stable reference genes by more than one algorithm. (A) Different genotypes, (B) different developmental stages, (C) different tissues, (D) salt stress, (E) heat stress, (F) cold stress, (G) osmotic stress, and (H) all samples. Figure S2: Expression stability of 13 candidate reference genes calculated by RefFinder. The lower Geomean value indicates a more stable expression. (A) Different genotypes, (B) different developmental stages, (C) different tissues, (D) salt stress, (E) heat stress, (F) cold stress, (G) osmotic stress, and (H) all samples.

Author Contributions

W.X., Y.W., and J.Z. conceived and designed the experiments. Z.Z., Y.Z., and N.W. collected samples. X.Y., N.W., and Y.Z. performed RNA extraction. J.Z., Z.Z., and X.Y. performed the RT-qPCR experiment. J.Z. and X.Y. analyzed the data with the suggestions from W.X. and Y.W. J.Z. and W.X. prepared the manuscript. W.X. and Y.W. revised the manuscript.

Funding

This research was supported by the Fundamental Research Fund for the Central Universities (LZUJBKY-2019-37), and Chinese National Basic Research Program (2014CB138704).

Acknowledgments

The authors are grateful to the help provided by the program for Changjiang Scholars and Innovative Research Team in University (IRT13019), Chinese National Natural Science Foundation (No. 31302023), and the 111 program (B12002).

Conflicts of Interest

The authors declare no conflict of interest.

References

  1. Xie, W.G.; Zhang, J.C.; Zhao, X.H.; Zhang, J.Q.; Wang, Y.R. Siberian wild rye (Elymus sibiricus L.): Genetic diversity of germplasm determined using DNA fingerprinting and SCoT markers. Biochem. Syst. Ecol. 2015, 60, 186–192. [Google Scholar] [CrossRef]
  2. Zhou, Q.; Luo, D.; Ma, L.C.; Xie, W.G.; Wang, Y.; Wang, Y.R.; Liu, Z.P. Development and cross-species transferability of EST-SSR markers in Siberian wildrye (Elymus sibiricus L.) using Illumina sequencing. Sci. Rep. 2016, 6, 20549. [Google Scholar] [CrossRef] [PubMed]
  3. Zhang, Z.Y.; Zhang, J.C.; Zhao, X.H.; Xie, W.G.; Wang, Y.R. Assessing and broadening genetic diversity of Elymus sibiricus germplasm for the improvement of seed shattering. Molecules 2016, 21, 869. [Google Scholar] [CrossRef] [PubMed]
  4. Zhao, X.H.; Xie, W.G.; Zhang, J.C.; Zhang, Z.Y.; Wang, Y.R. Histological characteristics, cell wall hydrolytic enzymes activity and candidate genes expression associated with seed shattering of Elymus sibiricus accessions. Front. Plant Sci. 2017, 8, 606. [Google Scholar] [CrossRef]
  5. Wang, M.Y.; Hou, L.Y.; Zhu, Y.Q.; Zhang, Q.; Wang, H.; Xia, F.S.; Chen, L.L.; Mao, P.S.; Hannaway, D.B. Siberian wildrye seed yield limited by assimilate source. Field Crops Res. 2018, 218, 18–23. [Google Scholar] [CrossRef]
  6. Xie, W.G.; Zhao, X.H.; Zhang, J.Q.; Wang, Y.R.; Liu, W.X. Assessment of genetic diversity of Siberian wild rye (Elymus sibiricus L.) germplasms with variation of seed shattering and implication for future genetic improvement. Biochem. Syst. Ecol. 2015, 58, 211–218. [Google Scholar] [CrossRef]
  7. Xie, W.G.; Zhang, J.C.; Zhao, X.H.; Zhang, Z.Y.; Wang, Y.R. Transcriptome profiling of Elymus sibiricus, an important forage grass in Qinghai-Tibet plateau, reveals novel insights into candidate genes that potentially connected to seed shattering. BMC Plant Biol. 2017, 17, 78. [Google Scholar] [CrossRef]
  8. Tong, Z.G.; Gao, Z.H.; Wang, F.; Zhou, J.; Zhang, Z. Selection of reliable reference genes for gene expression studies in peach using real-time PCR. BMC Mol. Biol. 2009, 10, 71. [Google Scholar] [CrossRef] [PubMed]
  9. Luo, M.; Gao, Z.; Li, H.; Li, Q.; Zhang, C.X.; Xu, W.P.; Song, S.R.; Ma, C.; Wang, S.P. Selection of reference genes for miRNA qRT-PCR under abiotic stress in grapevine. Sci. Rep. 2018, 8, 4444. [Google Scholar] [CrossRef]
  10. Narancio, R.; John, U.; Mason, J.; Spangenberg, G. Selection of optimal reference genes for quantitative RT-PCR transcript abundance analysis in white clover (Trifolium repens L.). Funct. Plant Biol. 2018, 45, 737–744. [Google Scholar] [CrossRef]
  11. Expósito-Rodríguez, M.; Borges, A.A.; Borges-Pérez, A.; Pérez, J.A. Selection of internal control genes for quantitative real-time RT-PCR studies during tomato development process. BMC Plant Biol. 2008, 8, 131. [Google Scholar] [CrossRef] [PubMed]
  12. Sheshadri, S.; Nishanth, M.; Yamine, V.; Simon, B. Effect of Melatonin on the stability and expression of reference genes in Catharanthus roseus. Sci. Rep. 2018, 8, 2222. [Google Scholar] [CrossRef] [PubMed]
  13. Guénin, S.; Mauriat, M.; Pelloux, J.; Van Wuytswinkel, O.; Bellini, C.; Gutierrez, L. Normalization of qRT-PCR data: The necessity of adopting a systematic, experimental conditions-specific, validation of references. J. Exp. Bot. 2009, 60, 487–493. [Google Scholar] [CrossRef] [PubMed]
  14. Gutierrez, L.; Mauriat, M.; Guénin, S.; Pelloux, J.; Lefebvre, J.F.; Louvet, R.; Rusterucci, C.; Moritz, T.; Guerineau, F.; Bellini, C. The lack of a systematic validation of reference genes: A serious pitfall undervalued in reverse transcription-polymerase chain reaction (RT-PCR) analysis in plants. Plant Biotechnol. J. 2008, 6, 609–618. [Google Scholar] [CrossRef] [PubMed]
  15. Ozsolak, F.; Milos, P.M. RNA sequencing: Advances, challenges and opportunities. Nat. Rev. Genet. 2011, 12, 87. [Google Scholar] [CrossRef] [PubMed]
  16. Jain, M. Next-generation sequencing technologies for gene expression profiling in plants. Brief. Funct. Genom. 2011, 11, 63–70. [Google Scholar] [CrossRef] [PubMed] [Green Version]
  17. Sinha, P.; Saxena, R.K.; Singh, V.K.; Krishnamurthy, L.; Varshney, R.K. Selection and validation of housekeeping genes as reference for gene expression studies in pigeonpea (Cajanus cajan) under heat and salt stress conditions. Front. Plant Sci. 2015, 6, 1071. [Google Scholar] [CrossRef] [PubMed]
  18. Bao, W.; Qu, Y.; Shan, X.; Wan, Y. Screening and validation of housekeeping genes of the root and cotyledon of Cunninghamia lanceolata under abiotic stresses by using quantitative real-time PCR. Int. J. Mol. Sci. 2016, 17, 1198. [Google Scholar] [CrossRef]
  19. Jain, M.; Nijhawan, A.; Tyagi, A.K.; Khurana, J.P. Validation of housekeeping genes as internal control for studying gene expression in rice by quantitative real-time PCR. Biochem. Biophys. Res. Commun. 2006, 345, 646–651. [Google Scholar] [CrossRef]
  20. Glare, E.; Divjak, M.; Bailey, M.; Walters, E. β-Actin and GAPDH housekeeping gene expression in asthmatic airways is variable and not suitable for normalising mRNA levels. Thorax 2002, 57, 765–770. [Google Scholar] [CrossRef]
  21. Gao, M.M.; Liu, Y.P.; Ma, X.; Shuai, Q.; Gai, J.Y.; Li, Y. Evaluation of reference genes for normalization of gene expression using quantitative RT-PCR under aluminum, cadmium, and heat stresses in soybean. PLoS ONE 2017, 12, e0168965. [Google Scholar] [CrossRef]
  22. Thellin, O.; Zorzi, W.; Lakaye, B.; De Borman, B.; Coumans, B.; Hennen, G.; Grisar, T.; Igout, A.; Heinen, E. Housekeeping genes as internal standards: Use and limits. J. Biotechnol. 1999, 75, 291–295. [Google Scholar] [CrossRef]
  23. Zhou, Z.; Cong, P.H.; Tian, Y.; Zhu, Y.M. Using RNA-seq data to select reference genes for normalizing gene expression in apple roots. PLoS ONE 2017, 12, e0185288. [Google Scholar] [CrossRef]
  24. Dheda, K.; Huggett, J.; Chang, J.; Kim, L.; Bustin, S.; Johnson, M.; Rook, G.; Zumla, A. The implications of using an inappropriate reference gene for real-time reverse transcription PCR data normalization. Anal. Biochem. 2005, 344, 141–143. [Google Scholar] [CrossRef] [PubMed]
  25. Sang, J.; Han, X.J.; Liu, M.Y.; Qiao, G.R.; Jiang, J.; Zhuo, R.Y. Selection and validation of reference genes for real-time quantitative PCR in hyperaccumulating ecotype of Sedum alfredii under different heavy metals stresses. PLoS ONE 2013, 8, e82927. [Google Scholar] [CrossRef] [PubMed]
  26. Karuppaiya, P.; Yan, X.X.; Liao, W.; Wu, J.; Chen, F.; Tang, L. Identification and validation of superior reference gene for gene expression normalization via RT-qPCR in staminate and pistillate flowers of Jatropha curcas—A biodiesel plant. PLoS ONE 2017, 12, e0172460. [Google Scholar]
  27. Xiao, Z.; Sun, X.B.; Liu, X.Q.; Li, C.; He, L.S.; Chen, S.P.; Su, J.L. Selection of reliable reference genes for gene expression studies on Rhododendron molle G. Don. Front. Plant Sci. 2016, 7, 1547. [Google Scholar] [CrossRef]
  28. Wu, Z.J.; Tian, C.; Jiang, Q.; Li, X.H.; Zhuang, J. Selection of suitable reference genes for qRT-PCR normalization during leaf development and hormonal stimuli in tea plant (Camellia sinensis). Sci. Rep. 2016, 6, 19748. [Google Scholar] [CrossRef]
  29. Wan, Q.; Chen, S.L.; Shan, Z.H.; Yang, Z.L.; Chen, L.M.; Zhang, C.J.; Yuan, S.L.; Hao, Q.N.; Zhang, X.J.; Qiu, D.Z. Stability evaluation of reference genes for gene expression analysis by RT-qPCR in soybean under different conditions. PLoS ONE 2017, 12, e0189405. [Google Scholar] [CrossRef]
  30. Wang, H.B.; Wang, J.J.; Jiang, J.F.; Chen, S.M.; Guan, Z.Y.; Liao, Y.; Chen, F.D. Reference genes for normalizing transcription in diploid and tetraploid Arabidopsis. Sci. Rep. 2014, 4, 6781. [Google Scholar] [CrossRef] [PubMed]
  31. Pabuayon, I.M.; Yamamoto, N.; Trinidad, J.L.; Longkumer, T.; Raorane, M.L.; Kohli, A. Reference genes for accurate gene expression analyses across different tissues, developmental stages and genotypes in rice for drought tolerance. Rice 2016, 9, 32. [Google Scholar] [CrossRef] [PubMed]
  32. Cai, J.; Li, P.F.; Luo, X.; Chang, T.L.; Li, J.X.; Zhao, Y.W.; Xu, Y. Selection of appropriate reference genes for the detection of rhythmic gene expression via quantitative real-time PCR in Tibetan hulless barley. PLoS ONE 2018, 13, e0190559. [Google Scholar] [CrossRef] [PubMed]
  33. Huang, L.K.; Yan, H.D.; Jiang, X.M.; Zhang, Y.; Zhang, X.Q.; Ji, Y.; Zeng, B.; Xu, B.; Yin, G.H.; Lee, S. Reference gene selection for quantitative real-time reverse-transcriptase PCR in orchardgrass subjected to various abiotic stresses. Gene 2014, 553, 158–165. [Google Scholar] [CrossRef]
  34. Liu, Y.; Liu, J.; Xu, L.; Lai, H.; Chen, Y.; Yang, Z.M.; Huang, B.R. Identification and validation of reference genes for seashore paspalum response to abiotic stresses. Int. J. Mol. Sci. 2017, 18, 1322. [Google Scholar] [CrossRef] [PubMed]
  35. Niu, K.J.; Shi, Y.; Ma, H.L. Selection of candidate reference genes for gene expression analysis in Kentucky Bluegrass (Poa pratensis L.) under abiotic stress. Front. Plant Sci. 2017, 8, 193. [Google Scholar] [CrossRef] [PubMed]
  36. Nguyen, D.Q.; Eamens, A.L.; Grof, C.P. Reference gene identification for reliable normalisation of quantitative RT-PCR data in Setaria viridis. Plant Methods 2018, 14, 24. [Google Scholar] [CrossRef] [PubMed]
  37. Zhao, X.H.; Jiang, X.; Zhao, K.; Zhao, X.H.; Yin, J.; Xie, W.G. Screening of germplasm with low seed shattering rate and evaluation on agronomic traits in Elymus sibiricus L. (Chinese with English abstract). J. Plant Genet. Resour. 2015, 16, 691–699. [Google Scholar]
  38. Vandesompele, J.; De Preter, K.; Pattyn, F.; Poppe, B.; Van Roy, N.; De Paepe, A.; Speleman, F. Accurate normalization of real-time quantitative RT-PCR data by geometric averaging of multiple internal control genes. Genome Biol. 2002, 3, research0034–1. [Google Scholar] [CrossRef] [PubMed]
  39. Andersen, C.L.; Jensen, J.L.; Ørntoft, T.F. Normalization of real-time quantitative reverse transcription-PCR data: A model-based variance estimation approach to identify genes suited for normalization, applied to bladder and colon cancer data sets. Cancer Res. 2004, 64, 5245–5250. [Google Scholar] [CrossRef]
  40. Pfaffl, M.W.; Tichopad, A.; Prgomet, C.; Neuvians, T.P. Determination of stable housekeeping genes, differentially regulated target genes and sample integrity: BestKeeper–Excel-based tool using pair-wise correlations. Biotechnol. Lett. 2004, 26, 509–515. [Google Scholar] [CrossRef] [PubMed]
  41. Silver, N.; Best, S.; Jiang, J.; Thein, S.L. Selection of housekeeping genes for gene expression studies in human reticulocytes using real-time PCR. BMC Mol. Biol. 2006, 7, 33. [Google Scholar] [CrossRef] [PubMed]
  42. Xie, F.L.; Xiao, P.; Chen, D.L.; Xu, L.; Zhang, B.H. miRDeepFinder: A miRNA analysis tool for deep sequencing of plant small RNAs. Plant Mol. Biol. 2012, 80, 75–84. [Google Scholar] [CrossRef] [PubMed]
  43. Chen, Y.; Tan, Z.Q.; Hu, B.Y.; Yang, Z.M.; Xu, B.; Zhuang, L.L.; Huang, B.R. Selection and validation of reference genes for target gene analysis with quantitative RT-PCR in leaves and roots of bermudagrass under four different abiotic stresses. Physiol. Plant. 2015, 155, 138–148. [Google Scholar] [CrossRef] [PubMed]
  44. Radonić, A.; Thulke, S.; Mackay, I.M.; Landt, O.; Siegert, W.; Nitsche, A. Guideline to reference gene selection for quantitative real-time PCR. Biochem. Biophys. Res. Commun. 2004, 313, 856–862. [Google Scholar] [CrossRef] [PubMed]
  45. Livak, K.J.; Schmittgen, T.D. Analysis of relative gene expression data using real-time quantitative PCR and the 2− ΔΔCT method. Methods 2001, 25, 402–408. [Google Scholar] [CrossRef] [PubMed]
  46. Silveira, É.D.; Alves-Ferreira, M.; Guimarães, L.A.; da Silva, F.R.; de Campos Carneiro, V.T. Selection of reference genes for quantitative real-time PCR expression studies in the apomictic and sexual grass Brachiaria brizantha. BMC Plant Biol. 2009, 9, 84. [Google Scholar] [CrossRef]
  47. Udvardi, M.K.; Czechowski, T.; Scheible, W.-R. Eleven golden rules of quantitative RT-PCR. Plant Cell 2008, 20, 1736–1737. [Google Scholar] [CrossRef]
  48. Fei, X.T.; Shi, Q.Q.; Yang, T.X.; Fei, Z.X.; Wei, A.Z. Expression stabilities of ten candidate reference genes for RT-qPCR in Zanthoxylum bungeanum Maxim. Molecules 2018, 23, 802. [Google Scholar] [CrossRef]
  49. Xiang, Q.J.; Li, J.; Qin, P.; He, M.L.; Yu, X.M.; Zhao, K.; Zhang, X.P.; Ma, M.G.; Chen, Q.; Chen, X.Q. Identification and evaluation of reference genes for qRT-PCR studies in Lentinula edodes. PLoS ONE 2018, 13, e0190226. [Google Scholar] [CrossRef]
  50. Dai, F.W.; Zhao, X.T.; Tang, C.M.; Wang, Z.J.; Kuang, Z.S.; Li, Z.Y.; Huang, J.; Luo, G.Q. Identification and validation of reference genes for qRT-PCR analysis in mulberry (Morus alba L.). PLoS ONE 2018, 13, e0194129. [Google Scholar] [CrossRef]
  51. Zheng, T.C.; Chen, Z.L.; Ju, Y.Q.; Zhang, H.; Cai, M.; Pan, H.T.; Zhang, Q.X. Reference gene selection for qRT-PCR analysis of flower development in Lagerstroemia indica and L. speciosa. PLoS ONE 2018, 13, e0195004. [Google Scholar] [CrossRef] [PubMed]
  52. Chen, J.C.; Huang, Z.F.; Huang, H.J.; Wei, S.H.; Liu, Y.; Jiang, C.L.; Zhang, J.; Zhang, C.X. Selection of relatively exact reference genes for gene expression studies in goosegrass (Eleusine indica) under herbicide stress. Sci. Rep. 2017, 7, 46494. [Google Scholar] [CrossRef] [PubMed]
  53. Duan, M.M.; Wang, J.L.; Zhang, X.H.; Yang, H.H.; Wang, H.P.; Qiu, Y.; Song, J.P.; Guo, Y.D.; Li, X.X. Identification of optimal reference genes for expression analysis in Radish (Raphanus sativus L.) and its relatives based on expression stability. Front. Plant Sci. 2017, 8, 1605. [Google Scholar] [CrossRef] [PubMed]
  54. Wang, X.; Ma, X.; Huang, L.K.; Zhang, X.Q. Identification of the valid reference genes for quantitative RT-PCR in annual ryegrass (Lolium multiflorum) under salt stress. Molecules 2015, 20, 4833–4847. [Google Scholar] [CrossRef] [PubMed]
  55. Huang, L.K.; Yan, H.D.; Jiang, X.M.; Zhang, X.Q.; Zhang, Y.W.; Huang, X.; Zhang, Y.; Miao, J.M.; Xu, B.; Frazier, T. Evaluation of candidate reference genes for normalization of quantitative RT-PCR in switchgrass under various abiotic stress conditions. BioEnergy Res. 2014, 7, 1201–1211. [Google Scholar] [CrossRef]
  56. Kesten, C.; Menna, A.; Sanchez-Rodriguez, C. Regulation of cellulose synthesis in response to stress. Curr. Opin. Plant Biol. 2017, 40, 106–113. [Google Scholar] [CrossRef] [PubMed]
  57. Wang, L.Q.; Guo, K.; Li, Y.; Tu, Y.Y.; Hu, H.Z.; Wang, B.R.; Cui, X.C.; Peng, L.C. Expression profiling and integrative analysis of the CESA/CSL superfamily in rice. BMC Plant Biol. 2010, 10, 282. [Google Scholar] [CrossRef] [PubMed]
  58. Hazen, S.P.; Scott-Craig, J.S.; Walton, J.D. Cellulose synthase-like genes of rice. Plant Physiol. 2002, 128, 336–340. [Google Scholar] [CrossRef]
  59. Nakano, T.; Kimbara, J.; Fujisawa, M.; Kitagawa, M.; Ihashi, N.; Maeda, H.; Kasumi, T.; Ito, Y. MACROCALYX and JOINTLESS interact in the transcriptional regulation of tomato fruit abscission zone development. Plant Physiol. 2012, 158, 439–450. [Google Scholar] [CrossRef]
  60. Nunes, A.; Delatorre, C.; Merotto, A., Jr. Gene expression related to seed shattering and the cell wall in cultivated and weedy rice. Plant Biol. 2014, 16, 888–896. [Google Scholar] [CrossRef]
  61. Li, Y.H.; Cheng, X.J.; Fu, Y.Q.; Wu, Q.Q.; Guo, Y.L.; Peng, J.Y.; Zhang, W.; He, B. A genome-wide analysis of the cellulose synthase-like (Csl) gene family in maize (Zea mays). PeerJ Preprints 2018, 6, e27374v1. [Google Scholar]
  62. Hamann, T.; Osborne, E.; Youngs, H.L.; Misson, J.; Nussaume, L.; Somerville, C. Global expression analysis of CESA and CSL genes in Arabidopsis. Cellulose 2004, 11, 279–286. [Google Scholar] [CrossRef]
  63. Wu, J.Y.; Zhang, H.N.; Liu, L.Q.; Li, W.C.; Wei, Y.Z.; Shi, S.Y. Validation of reference genes for RT-qPCR studies of gene expression in preharvest and postharvest longan fruits under different experimental conditions. Front. Plant Sci. 2016, 7, 780. [Google Scholar] [CrossRef] [PubMed]
  64. Caño-Delgado, A.; Penfield, S.; Smith, C.; Catley, M.; Bevan, M. Reduced cellulose synthesis invokes lignification and defense responses in Arabidopsis thaliana. Plant J. 2003, 34, 351–362. [Google Scholar] [CrossRef] [PubMed]
  65. Yoon, J.; Cho, L.-H.; Antt, H.W.; Koh, H.-J.; An, G. KNOX protein OSH15 induces grain shattering by repressing lignin biosynthesis genes. Plant Physiol. 2017, 174, 312–325. [Google Scholar] [CrossRef]
  66. Stolle-Smits, T.; Beekhuizen, J.G.; Kok, M.T.; Pijnenburg, M.; Recourt, K.; Derksen, J.; Voragen, A.G. Changes in cell wall polysaccharides of green bean pods during development. Plant Physiol. 1999, 121, 363–372. [Google Scholar] [CrossRef] [PubMed]
  67. Doblin, M.S.; Kurek, I.; Jacob-Wilk, D.; Delmer, D.P. Cellulose biosynthesis in plants: From genes to rosettes. Plant Cell Physiol. 2002, 43, 1407–1420. [Google Scholar] [CrossRef]
  68. Jithesh, M.; Shukla, P.S.; Kant, P.; Joshi, J.; Critchley, A.T.; Prithiviraj, B. Physiological and transcriptomics analyses reveal that Ascophyllum nodosum extracts induce salinity tolerance in Arabidopsis by regulating the expression of stress responsive genes. J. Plant Growth Regul. 2018, 1–16. [Google Scholar] [CrossRef]
  69. Zhang, J.L.; Shi, H.Z. Physiological and molecular mechanisms of plant salt tolerance. Photosynth. Res. 2013, 115, 1–22. [Google Scholar] [CrossRef]
  70. Zheng, M.; Wang, Y.H.; Liu, K.; Shu, H.M.; Zhou, Z.G. Protein expression changes during cotton fiber elongation in response to low temperature stress. J. Plant Physiol. 2012, 169, 399–409. [Google Scholar] [CrossRef]
  71. Dametto, A.; Sperotto, R.A.; Adamski, J.M.; Blasi, É.A.; Cargnelutti, D.; de Oliveira, L.F.; Ricachenevsky, F.K.; Fregonezi, J.N.; Mariath, J.E.; da Cruz, R.P. Cold tolerance in rice germinating seeds revealed by deep RNAseq analysis of contrasting indica genotypes. Plant Sci. 2015, 238, 1–12. [Google Scholar] [CrossRef] [PubMed]
  72. Ko, J.-H.; Prassinos, C.; Keathley, D.; Han, K.-H. Novel aspects of transcriptional regulation in the winter survival and maintenance mechanism of poplar. Tree Physiol. 2011, 31, 208–225. [Google Scholar] [CrossRef] [PubMed] [Green Version]
  73. Chen, J.; Lv, F.J.; Liu, J.R.; Ma, Y.N.; Wang, Y.H.; Chen, B.L.; Meng, Y.L.; Zhou, Z.G.; Oosterhuis, D.M. Effect of late planting and shading on cellulose synthesis during cotton fiber secondary wall development. PLoS ONE 2014, 9, e105088. [Google Scholar] [CrossRef] [PubMed]
  74. Zhang, F.; Huang, L.Y.; Wang, W.S.; Zhao, X.Q.; Zhu, L.H.; Fu, B.Y.; Li, Z.K. Genome-wide gene expression profiling of introgressed indica rice alleles associated with seedling cold tolerance improvement in a japonica rice background. BMC Genom. 2012, 13, 461. [Google Scholar] [CrossRef] [PubMed]
Figure 1. Primer specificity and amplicon size of 13 candidate reference genes. (A) Melting curves of 13 candidate reference genes exhibiting single peaks. (B) Agarose gel electrophoresis (2%) showing specific amplification products of expected size using Real Time-qPCR. M: 500 bp marker. 1–13: ACT2, CYP19, DNAJ, eIF-3A, eIF-3C, GAPDH, HIS3, PP2A, TBP2, TEF2, TUA2, TUB3, and U2AF.
Genes 10 00451 g001
Figure 2. RT-qPCR Cq values for all candidate reference genes in all E. sibiricus samples. Whisker caps, boxes, lines, and square boxes represent maximum/minimum, 25/75 percentiles, median, and mean, respectively.
Genes 10 00451 g002
Figure 3. Average expression stability values (M) of 13 candidate reference genes under different conditions calculated by geNorm. (A) Different genotypes, (B) different developmental stages, (C) different tissues, (D) salt stress, (E) heat stress, (F) cold stress, (G) osmotic stress, and (H) all samples.
Genes 10 00451 g003
Figure 4. Pairwise variation (V) of 13 candidate reference genes under various experimental conditions calculated by geNorm.
Genes 10 00451 g004
Figure 5. Expression stability of E. sibiricus potential reference genes calculated using NormFinder. (A) Different genotypes, (B) different developmental stages, (C) different tissues, (D) salt stress, (E) heat stress, (F) cold stress, (G) osmotic stress, and (H) all samples. Low to high expression stability is represented over a spectrum from red to blue, respectively.
Genes 10 00451 g005
Figure 6. Expression stability of candidate reference genes calculated by BestKeeper. (A) Different genotypes, (B) different developmental stages, (C) different tissues, (D) salt stress, (E) heat stress, (F) cold stress, (G) osmotic stress, and (H) all samples. Low to high expression stability is represented over a spectrum from red to blue, respectively.
Genes 10 00451 g006
Figure 7. Expression stability for 13 candidate reference genes calculated via Delta Ct. (A) Different genotypes, (B) different developmental stages, (C) different tissues, (D) salt stress, (E) heat stress, (F) cold stress, (G) osmotic stress, and (H) all samples. Low to high expression stability is represented over a spectrum from red to blue, respectively.
Genes 10 00451 g007
Figure 8. The relative expression level of target gene CSLE6 in various experimental conditions. The most two stable reference genes and the most unstable reference genes in different conditions were selected for expression normalization. (A) Different genotypes, (B) different developmental stages, (C) different tissues, (D) salt stress, (E) heat stress, (F) cold stress, and (G) osmotic stress. Different letters in the same sample represent a significant difference among three reference genes at the 0.05 level. Error bars indicate standard deviation.
Genes 10 00451 g008
Table 1. Experimental sets in the present study.
Sample SetsTissue TypeSampling DatesGermplasmBiological ReplicatesTotal Number of Samples
Different genotypesLeaf4–6 leaves stageZN, XH, MQ, HZ, LQ, LT318
Different developmental stagesLeafSeedling, Tillering, Jointing, Heading, FloweringZN315
Different tissuesRoot, Stem, Leaf, Tiller bud, InflorescenceFlowering stageZN315
Salt stress (250 mmol/L NaCl)Leaf, Root4–6 leaves stage, 0, 12, 24 HAT 1ZN318
Cold stress (3 °C)Leaf, Root4–6 leaves stage, 0, 12, 24 HATZN318
Heat stress (40 °C)Leaf, Root4–6 leaves stage, 0, 12, 24 HATZN318
Osmotic stress (20% PEG6000)Leaf, Root4–6 leaves stage, 0, 12, 24 HATZN318
ControlLeaf, Root4–6 leaves stage, 0, 12, 24 HATZN318
Abbreviation:1 HAT, hours after treatment.
Table 2. Description of 13 reference genes and one target gene.
GeneGene DescriptionArabidopsis Homolog LocusAmino Acid Identity with E. sibiricus (%)Rice TIRG IdentifierAmino Acid Identity with E. sibiricus (%)
ACT2Actin2At5g0981098.41LOC_Os11g0639098.94
CYP19Cyclophilin 19At2g2996075.12LOC_Os06g4948082.73
DNAJDNAJ heat shock N-terminal domain-containing proteinAt1g7670066.67LOC_Os08g4111086.04
eIF-3AEukaryotic translation initiation factor 3AAt4g1142062.36LOC_Os01g0307079.39
eIF-3CEukaryotic translation initiation factor 3CAt3g5615062.18LOC_Os07g0323082.43
GAPDHGlyceraldehyde-3-phosphate dehydrogenaseAt3g0412074.93LOC_Os08g0329092.12
HIS3Histone 3.3At4g4003082.93LOC_Os06g04030100.00
PP2AProtein phosphatase 2AAt1g1332074.28LOC_Os09g0751078.36
TBP2TATA binding protein 2At1g5552064.50LOC_Os03g4541059.65
TEF2Translation elongation factor 2At1g5607091.10LOC_Os02g3203094.90
TUA2Tubulin α-2At4g1496096.67LOC_Os11g1422097.56
TUB3Tubulin β-3At1g7578089.04LOC_Os06g4600090.13
U2AFU2 auxiliary factorAt5g4282074.48LOC_Os09g3148269.97
CSLE6Cellulose synthase-like protein E6At1g5585047.92LOC_Os09g3013076.64
Table 3. Details of primers and amplicons for 14 genes.
Candidate Reference GenePrimer Sequence F/R (5′–3′)Tm (°C)Amplicon Length/BpEfficiency (%)R2
ACT2F: CCACGAGACGACCTACAATTCCATC60.020698.460.981
R: CTCCGATCCAGACACTGTACTTCCT
CYP19F: GGTGGTGAATCAATCTACGGCACAA60.414193.730.996
R: GCTCGTGGTTACAGTGGTGATGAAG
DNAJF: GCAATGGCGTCAATGGCTTCAC59.620990.350.992
R: GCATCACTAAGTCTGGACACCTCAG
eIF-3AF: GAATCAGGCACAAGCACTGGAAGA59.928495.40.984
R: ACAACCTACGGAACTCGGTGGAT
eIF-3CF: GAATCATAAGGCTGCTGCGAAGGT60.018392.840.990
R: AACGGTGGTGGTCCTCTATTGTCA
GAPDHF: GTTACTGTCTTCGGCGTCAGGAAC60.213797.050.998
R: ACCTTCTTGGCACCACCCTTCA
HIS3F: CTACAACTGGAGGAGTGAAGAAGCC59.616498.850.993
R: GAAGCGGAGGTCAGTCTTGAAGTC
PP2AF: GTGATAATGAGGCTGAAGTGCGGAT60.0140101.080.990
R: GCGAACATGCTGAGACGAATCTGA
TBP2F: CGGATGAGGCAGCCAAAGATTGT59.610398.650.993
R: TGTTCTCGAAGGCAGTGTATGTCTC
TEF2F: AGAAGTCCTGCCGTACCGTTATGA60.110798.970.995
R: GCCATCATCAATAGCCTCAGCCAAT
TUA2F: TGGTGATGTTGTGCCGAAGGATG59.8195100.60.996
R: ACGACACTGGTGGAGTTGGAGAT
TUB3F: GTGCAGAACAAGAACTCGTCCTACT59.523399.970.998
R: TCGGTGAACTCCATCTCGTCCAT
U2AFF: ATCGCTGCTCTCGCATCCATAAC59.728198.50.998
R: TGCTGCTGCCTGATCTTCCTCT
Target gene
CSLE6F: AAGGATGGTGGAATGGACAGAGGAT60.014998.370.994
R: CTTGGACTCGTCTTCGTCGCTTAC
Table 4. Stability ranking of 13 candidate reference genes calculated by Delta Ct, BestKeeper, NormFinder, GeNorm, and RefFinder.
MethodRanking Order (Better—Good—Average)
12345678910111213
Different genotypes
Delta CtTBP2HIS3eIF-3ACYP19PP2AACT2TUA2TEF2DNAJeIF-3CTUB3GAPDHU2AF
BestKeeperHIS3ACT2CYP19DNAJeIF-3CTUA2TBP2TEF2TUB3eIF-3APP2AGAPDHU2AF
NormFinderTBP2eIF-3ATUA2PP2ACYP19TEF2HIS3ACT2DNAJeIF-3CTUB3GAPDHU2AF
GeNormDNAJ | eIF-3CCYP19ACT2HIS3TBP2TUA2eIF-3APP2ATEF2TUB3GAPDHU2AF
RefFinderTBP2HIS3CYP19DNAJACT2eIF-3AeIF-3CTUA2PP2ATEF2TUB3GAPDHU2AF
Different developmental stages
Delta CtPP2ATUA2HIS3DNAJTUB3CYP19eIF-3CACT2GAPDHTEF2TBP2eIF-3AU2AF
BestKeeperDNAJTUA2HIS3ACT2CYP19eIF-3CPP2ATUB3GAPDHTBP2TEF2eIF-3AU2AF
NormFinderPP2ATUA2TUB3HIS3DNAJCYP19eIF-3CACT2GAPDHTEF2TBP2eIF-3AU2AF
GeNormACT2 | HIS3DNAJTUA2PP2ACYP19eIF-3CTUB3GAPDHTBP2TEF2eIF-3AU2AF
RefFinderTUA2PP2AHIS3DNAJACT2TUB3CYP19eIF-3CGAPDHTBP2TEF2eIF-3AU2AF
Different tissues
Delta CtPP2ATBP2eIF-3ACYP19TEF2DNAJHIS3GAPDHeIF-3CTUA2U2AFTUB3ACT2
BestKeeperTBP2DNAJPP2AeIF-3CeIF-3ACYP19HIS3TEF2GAPDHTUA2U2AFTUB3ACT2
NormFinderTBP2CYP19PP2AeIF-3ATEF2DNAJeIF-3CHIS3GAPDHTUA2U2AFTUB3ACT2
GeNormeIF-3A | PP2ACYP19TBP2TEF2DNAJHIS3eIF-3CGAPDHTUA2U2AFTUB3ACT2
RefFinderTBP2PP2AeIF-3ACYP19DNAJTEF2eIF-3CHIS3GAPDHTUA2U2AFTUB3ACT2
Salt stress
Delta CtACT2PP2ATBP2TUA2HIS3TUB3U2AFCYP19TEF2DNAJeIF-3AeIF-3CGAPDH
BestKeepereIF-3CDNAJU2AFTUB3TEF2PP2ATBP2ACT2TUA2HIS3CYP19eIF-3AGAPDH
NormFinderACT2PP2ATBP2TUA2HIS3CYP19TUB3TEF2U2AFDNAJeIF-3AeIF-3CGAPDH
GeNormACT2 | TBP2PP2ATUB3U2AFTEF2DNAJTUA2HIS3CYP19eIF-3AeIF-3CGAPDH
RefFinderACT2TBP2PP2ATUB3U2AFTUA2DNAJeIF-3CTEF2HIS3CYP19eIF-3AGAPDH
Heat stress
Delta CtACT2TUA2PP2ACYP19DNAJTBP2TUB3U2AFHIS3TEF2eIF-3AeIF-3CGAPDH
BestKeepereIF-3CTEF2U2AFTUB3TBP2PP2ADNAJACT2TUA2CYP19HIS3eIF-3AGAPDH
NormFinderACT2TUA2PP2ACYP19DNAJTBP2TUB3HIS3U2AFTEF2eIF-3AeIF-3CGAPDH
GeNormCYP19 | TUA2ACT2DNAJPP2ATBP2TUB3U2AFTEF2HIS3eIF-3CeIF-3AGAPDH
RefFinderACT2TUA2CYP19PP2ADNAJTBP2TUB3eIF-3CU2AFTEF2HIS3eIF-3AGAPDH
Cold stress
Delta CtPP2AACT2DNAJTBP2TEF2TUA2CYP19HIS3U2AFTUB3eIF-3CGAPDHeIF-3A
BestKeepereIF-3CTUB3TBP2DNAJACT2TUA2TEF2U2AFPP2ACYP19HIS3GAPDHeIF-3A
NormFinderPP2AACT2DNAJHIS3TEF2TBP2CYP19U2AFTUA2TUB3eIF-3CGAPDHeIF-3A
GeNormTEF2 | U2AFPP2ADNAJTBP2ACT2TUA2CYP19HIS3TUB3eIF-3CGAPDHeIF-3A
RefFinderPP2AACT2DNAJTEF2TBP2U2AFeIF-3CTUB3TUA2HIS3CYP19GAPDHeIF-3A
Osmotic stress
Delta CtDNAJPP2AACT2TUB3CYP19U2AFTBP2HIS3TEF2TUA2eIF-3CeIF-3AGAPDH
BestKeepereIF-3CTEF2U2AFDNAJTUB3TBP2PP2AACT2HIS3CYP19TUA2eIF-3AGAPDH
NormFinderACT2CYP19HIS3PP2ATUB3DNAJTBP2TUA2U2AFTEF2eIF-3CeIF-3AGAPDH
GeNormDNAJ | U2AFTEF2TUB3TBP2PP2AACT2CYP19HIS3TUA2eIF-3CeIF-3AGAPDH
RefFinderDNAJU2AFACT2PP2ATUB3TEF2CYP19eIF-3CTBP2HIS3TUA2eIF-3AGAPDH
All samples
Delta CtPP2ATBP2CYP19TEF2DNAJHIS3TUA2TUB3ACT2U2AFeIF-3CeIF-3AGAPDH
BestKeepereIF-3CDNAJU2AFTBP2TUB3TEF2PP2AACT2CYP19TUA2HIS3eIF-3AGAPDH
NormFinderPP2ACYP19TBP2HIS3TEF2TUA2DNAJTUB3ACT2U2AFeIF-3CeIF-3AGAPDH
GeNormPP2A | TBP2DNAJTEF2TUB3CYP19TUA2HIS3ACT2U2AFeIF-3CeIF-3AGAPDH
RefFinderPP2ATBP2DNAJCYP19TEF2eIF-3CTUB3HIS3TUA2U2AFACT2eIF-3AGAPDH
Gene nameACT2CYP19DNAJeIF-3AeIF-3CGAPDHHIS3PP2ATBP2TEF2TUA2TUB3U2AF
Number of times the best gene appears91516021181202

