The First Complete Mitochondrial Genome of the Flathead Cociella crocodilus (Scorpaeniformes: Platycephalidae) and the Phylogenetic Relationships within Scorpaeniformes Based on Whole Mitogenomes

Abstract
:1. Introduction
2. Methods
2.1. Sampling and DNA Extraction
2.2. Polymerase Chain Reaction Amplification and Sequencing
2.3. Sequence Analysis
2.4. Phylogenetic Analysis
3. Results and Discussion
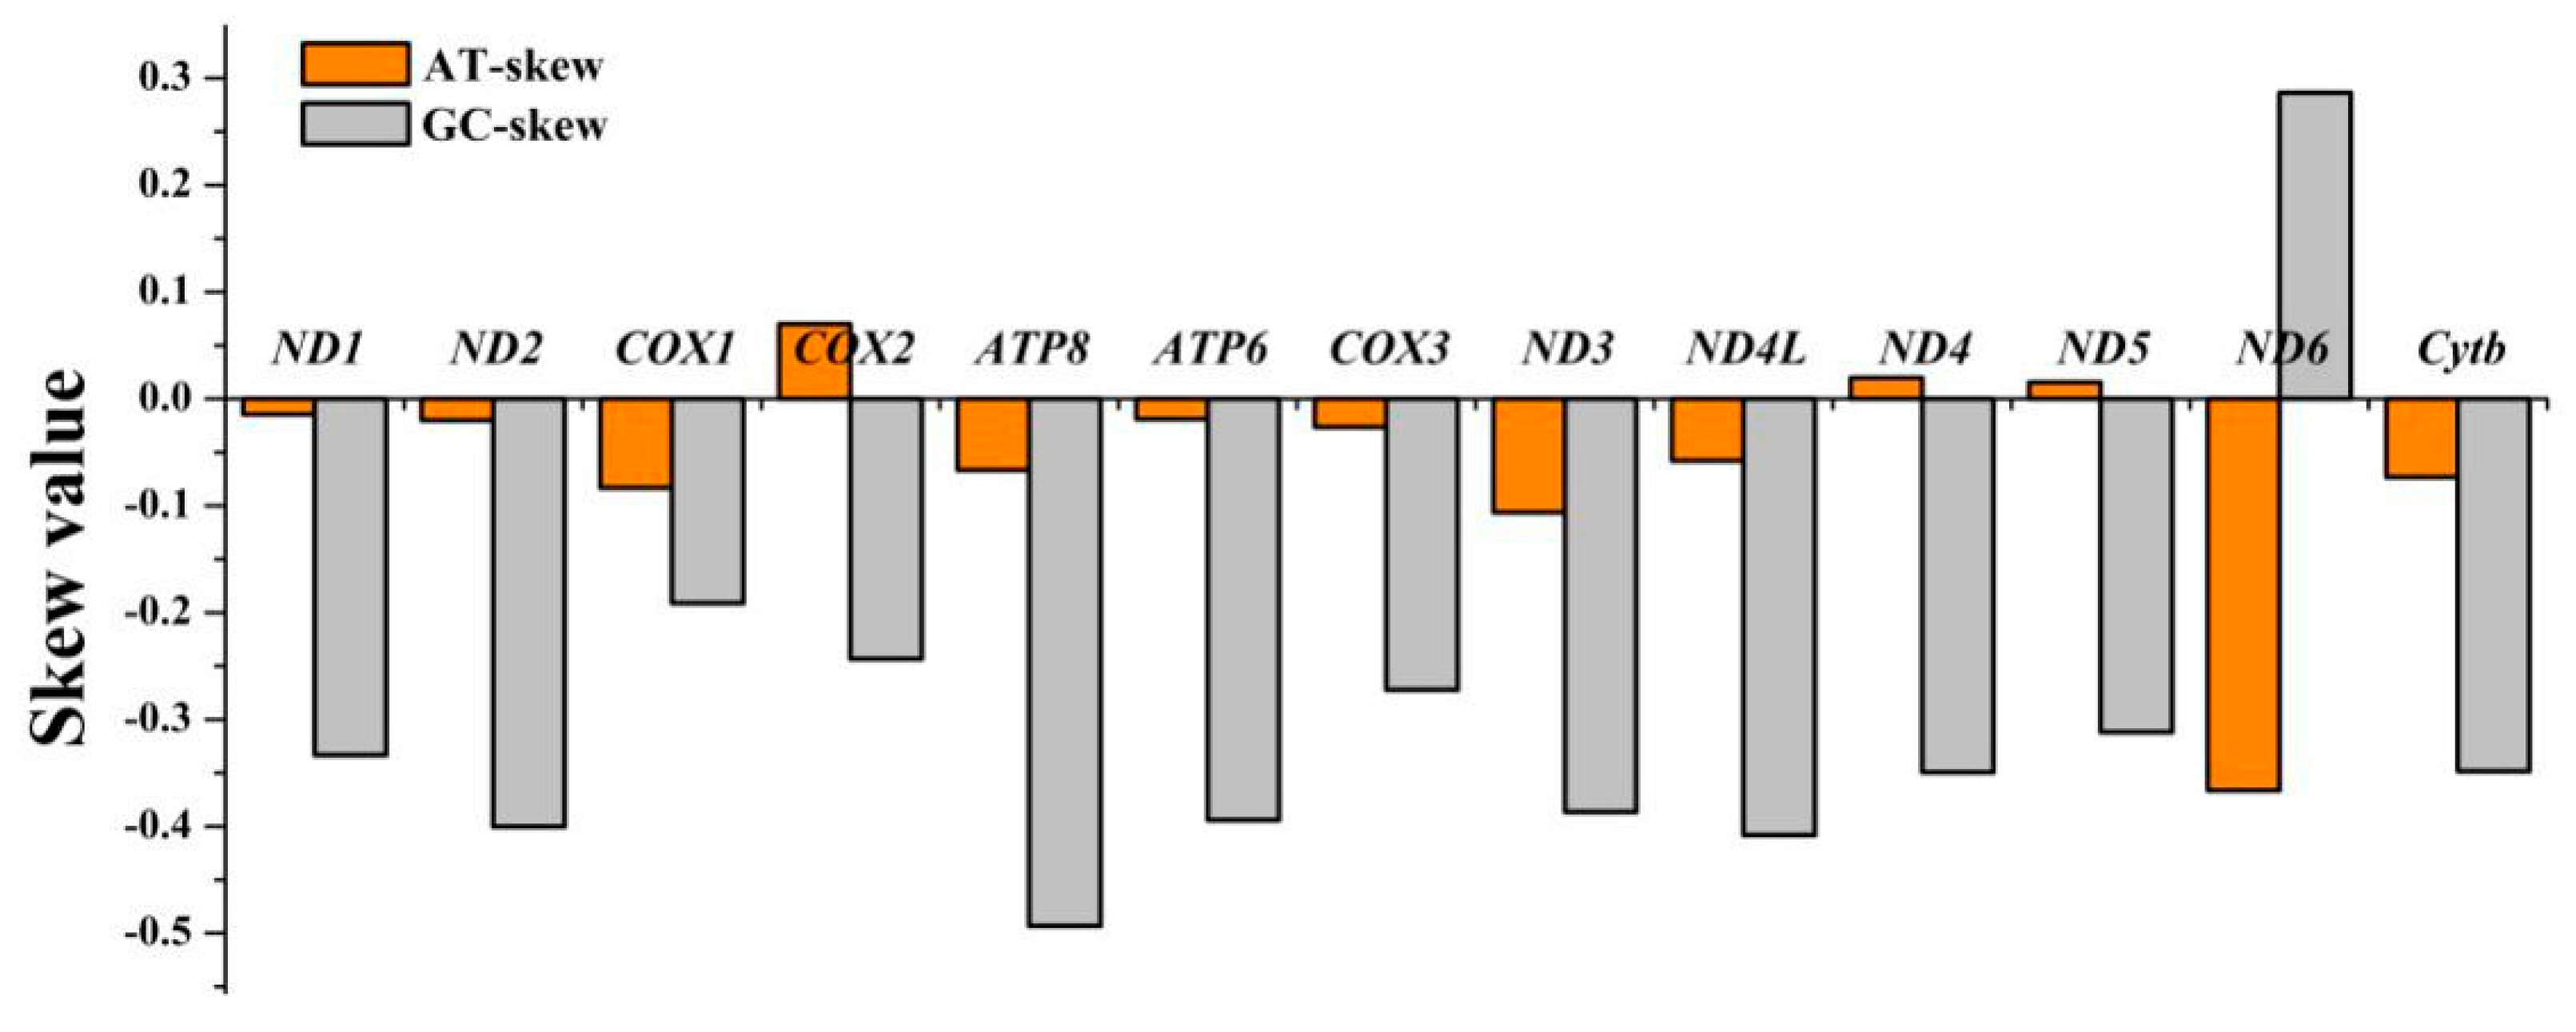
3.1. Mitogenome Organization, Structure and Skewness
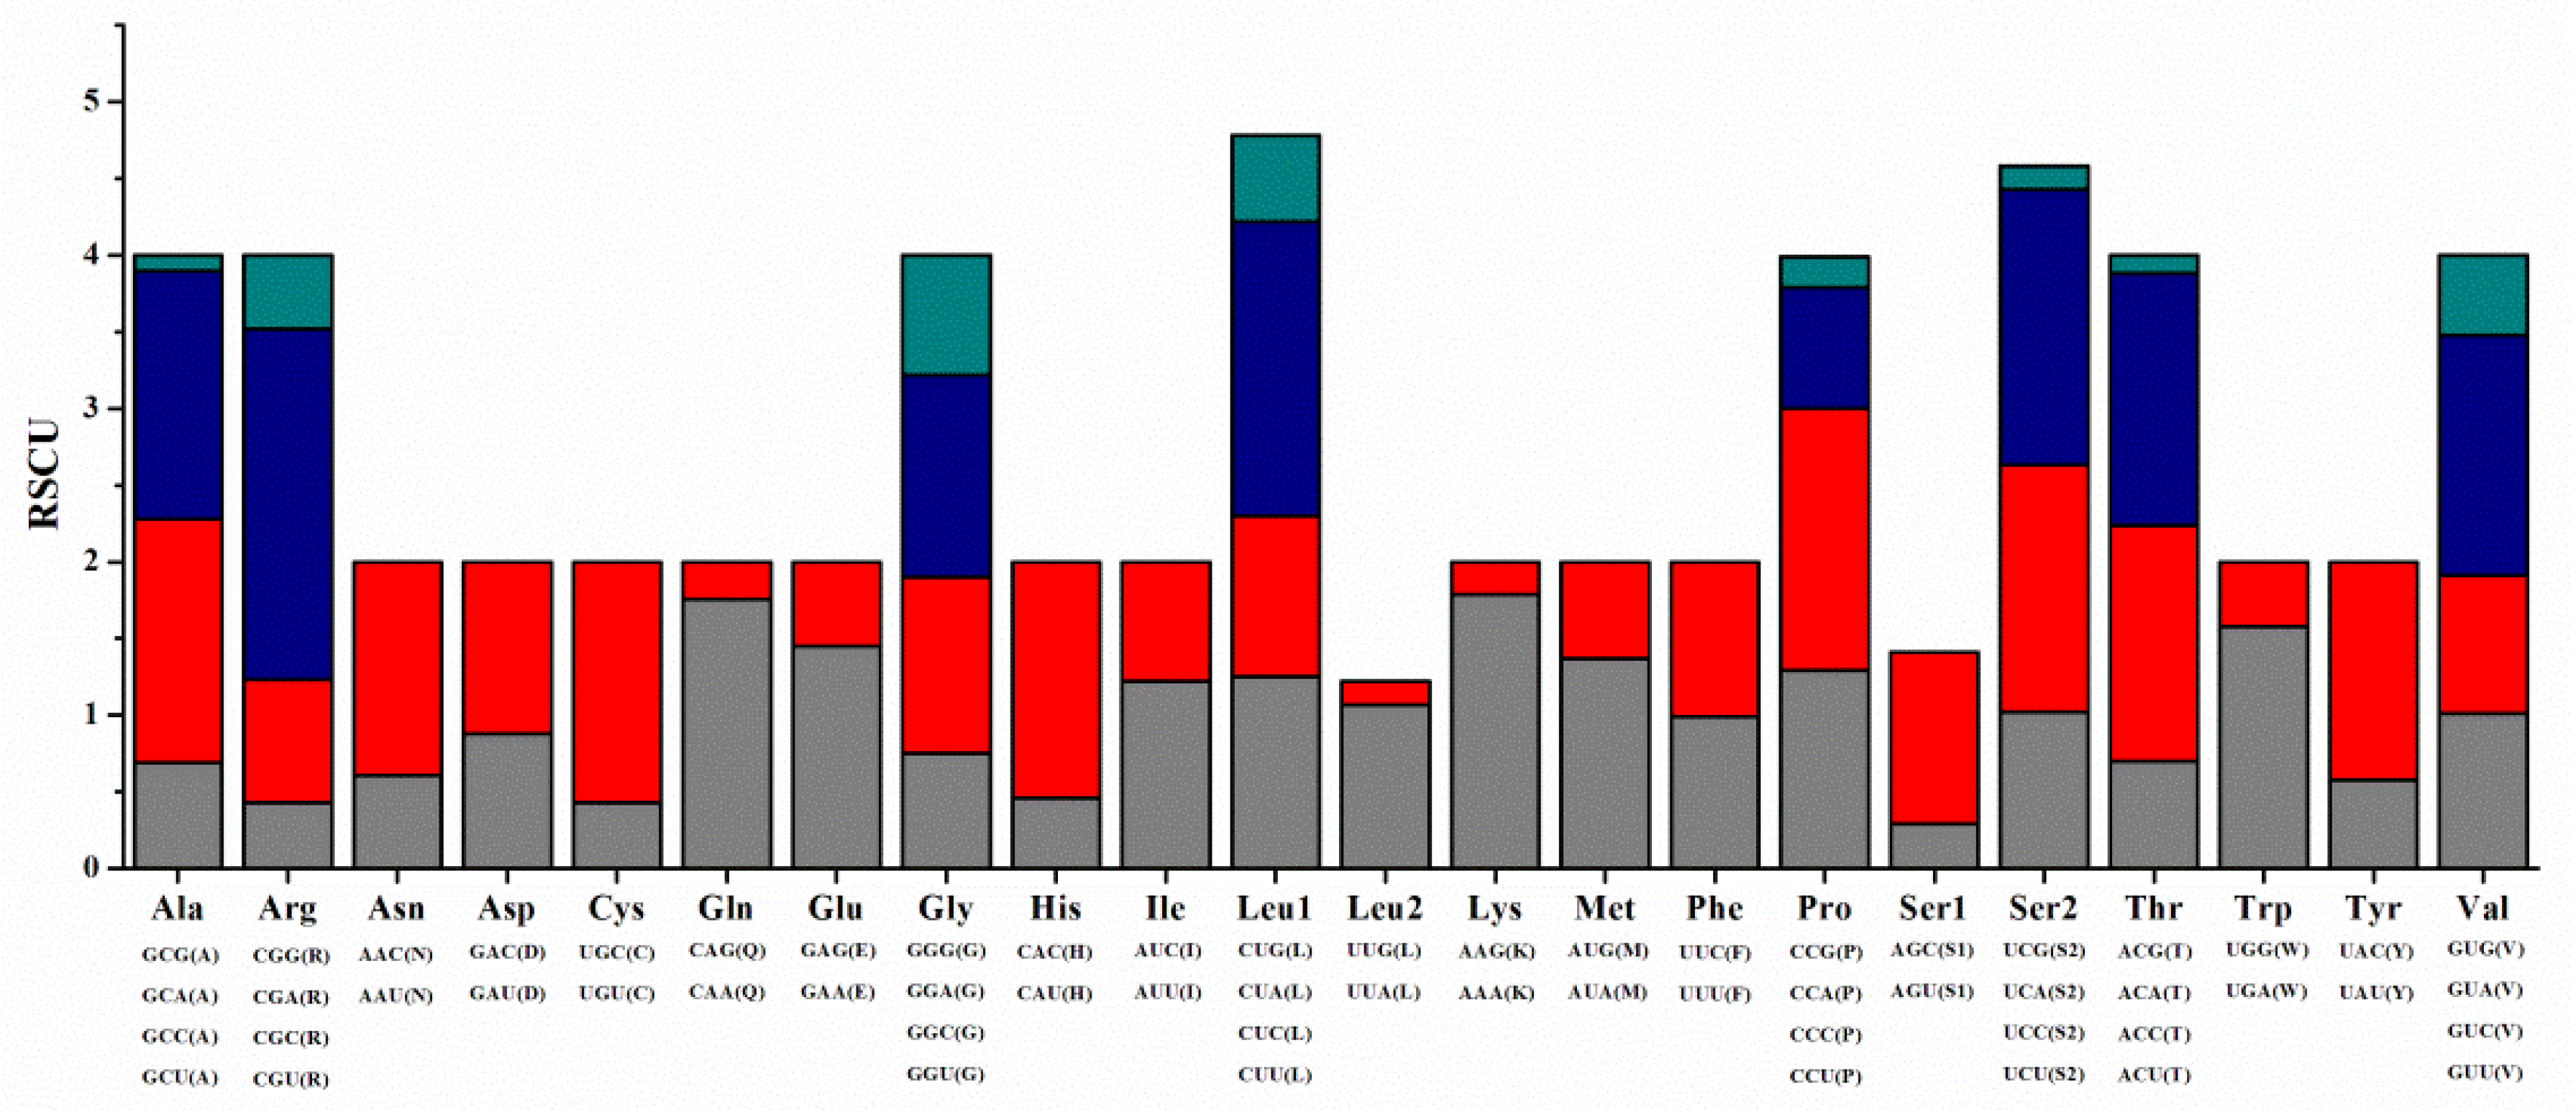
3.2. Protein-Coding Genes
3.3. Transfer RNA Genes and Ribosomal RNA Genes
3.4. Noncoding Regions
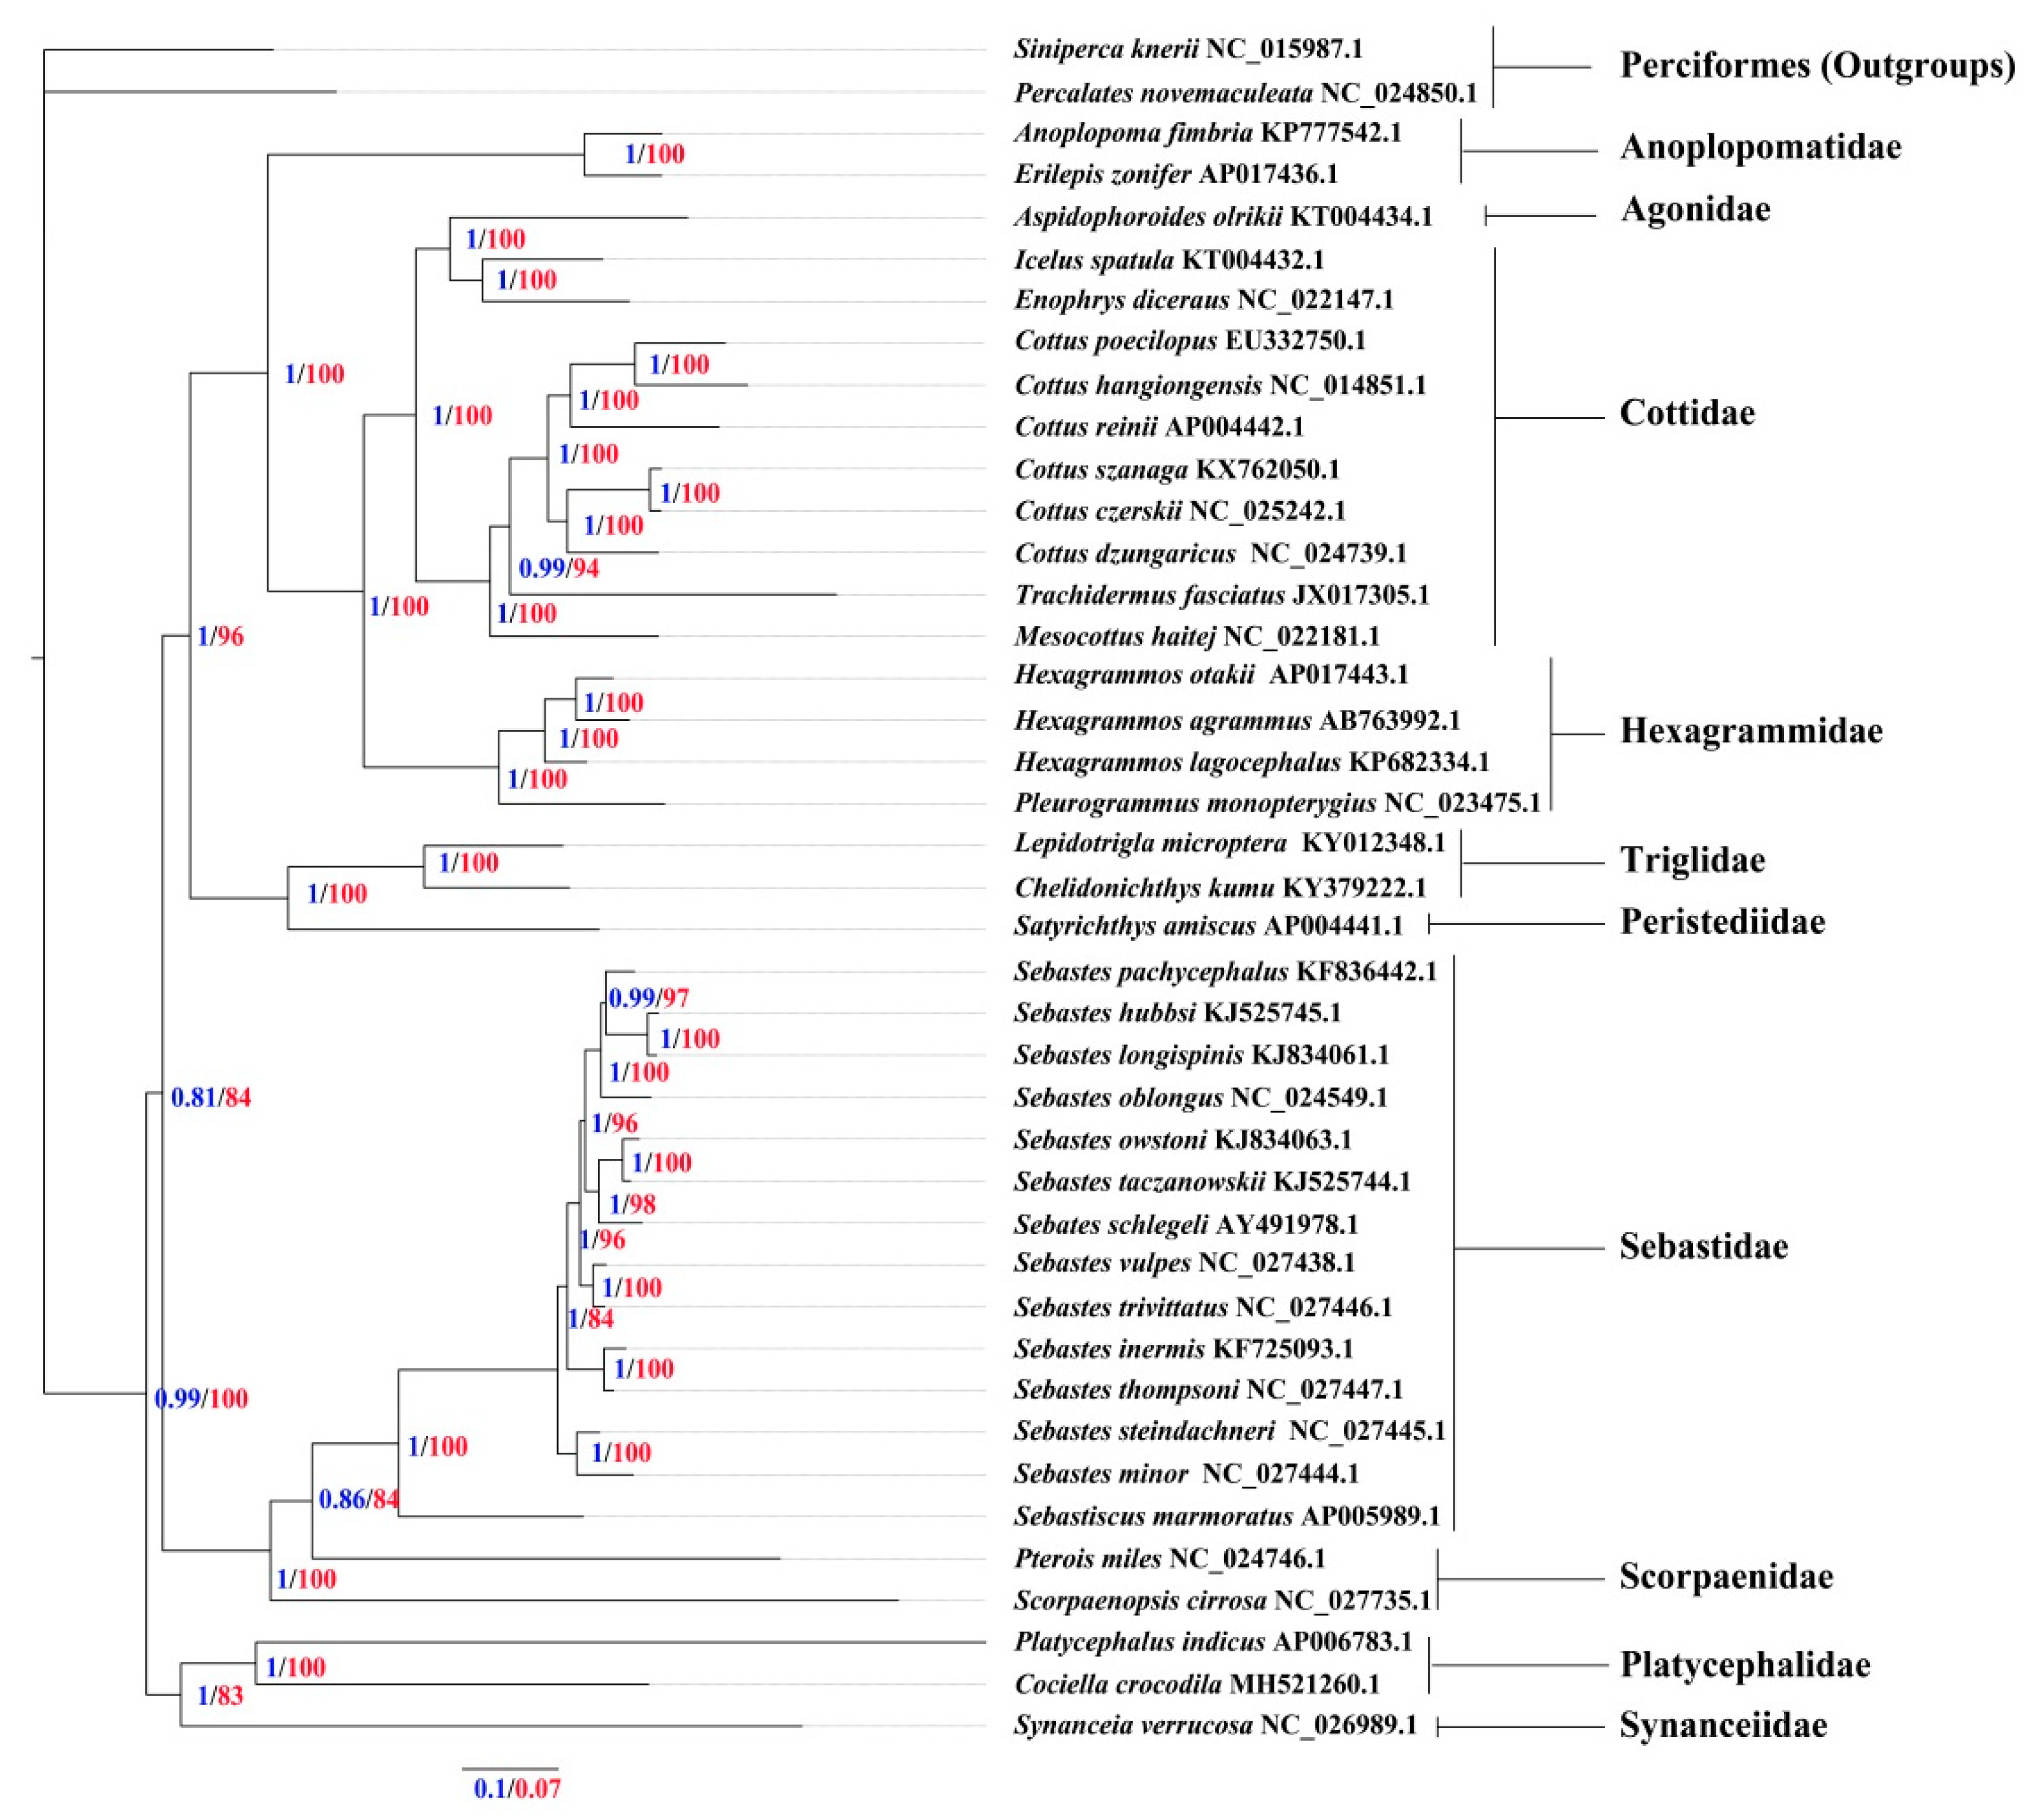
3.5. Phylogenetic Relationships
Supplementary Materials
Author Contributions
Funding
Conflicts of Interest
References
- Keenan, C.P. Phylogeny of Australian species of flatheads (Teleostei, Platycephalidae) as determined by allozyme electrophoresis. J. Fish Biol. 2010, 39, 237–249. [Google Scholar] [CrossRef]
- Dulčić, J.; Pallaoro, A.; Dragičević, B.; Stagličić-Radica, N. First record of dwarf flathead Elates ransonnetii (Platycephalidae) in the Adriatic Sea. Cybium 2010, 34, 222–223. [Google Scholar]
- Imamura, H. Phylogeny of the family platycephalidae and related taxa (Pisces: Scorpaeniformes). Species Divers. 1996, 1, 123–233. [Google Scholar] [CrossRef]
- Sriramachandra Murty, V.; Manikyam, Y. Taxonomic Revision of the Flatheads (Platycephalidae: Pisces) of India; Zoological Survey of India: Kolkata, India, 2007. [Google Scholar]
- Imamura, H.; Sakashita, M. Redescription of a rare flathead, Onigocia grandisquama (Regan, 1908) (Scorpaeniformes: Platycephalidae). Ichthyol. Res. 1997, 44, 119–124. [Google Scholar] [CrossRef]
- Boore, J.L. Animal mitochondrial genomes. Nucleic Acids Res. 1999, 27, 1767–1780. [Google Scholar] [CrossRef] [Green Version]
- Cameron, S.L. Insect mitochondrial genomics: Implications for evolution and phylogeny. Annu. Rev. Entomol. 2014, 59, 95–117. [Google Scholar] [CrossRef]
- Simon, C.; Buckley, T.R.; Frati, F.; Stewart, J.B.; Beckenbach, A.T. Incorporating molecular evolution into phylogenetic analysis, and a new compilation of conserved polymerase chain reaction primers for animal mitochondrial DNA. Annu. Rev. Ecol. Evol. Syst. 2006, 37, 545–579. [Google Scholar] [CrossRef]
- Miya, M.; Kawaguchi, A.; Nishida, M. Mitogenomic exploration of higher teleostean phylogenies: A case study for moderate-scale evolutionary genomics with 38 newly determined complete mitochondrial DNA sequences. Mol. Biol. Evol. 2001, 18, 1993–2009. [Google Scholar] [CrossRef]
- Boore, J.L.; Lavrov, D.V.; Brown, W.M. Gene translocation links insects and crustaceans. Nature 1998, 392, 667–668. [Google Scholar] [CrossRef]
- Dowton, M.; Castro, L.R.; Austin, A.D. Mitochondrial gene rearrangements as phylogenetic characters in the invertebrates: The examination of genome ‘morphology’. Invertebr. Syst. 2002, 16, 345–356. [Google Scholar] [CrossRef]
- Cui, L.; Dong, Y.; Liu, F.; Gao, X.; Zhang, H.; Li, L.; Cen, J.; Lu, S. The first two complete mitochondrial genomes for the family Triglidae and implications for the higher phylogeny of Scorpaeniformes. Sci. Rep. 2017, 7, 1553. [Google Scholar] [CrossRef] [PubMed] [Green Version]
- Betancur, R.R.; Broughton, R.E.; Wiley, E.O.; Carpenter, K.; Ortí, G. The tree of life and a new classification of bony fishes. PLoS Curr. 2013, 5, 1001550. [Google Scholar] [CrossRef] [PubMed]
- Rabosky, D.L.; Chang, J.; Title, P.O.; Cowman, P.F.; Sallan, L.; Friedman, M.; Kaschner, K.; Garilao, C.; Near, T.J.; Coll, M.; et al. An inverse latitudinal gradient in speciation rate for marine fishes. Nature 2018, 559, 392–395. [Google Scholar] [CrossRef] [PubMed]
- Betancur, R.R.; Wiley, E.O.; Arratia, G.; Acero, A.; Bailly, N.; Miya, M.; Lecointre, G.; Ortí, G. Phylogenetic classification of bony fishes. BMC Evol. Biol. 2017, 17, 162. [Google Scholar] [CrossRef] [PubMed]
- Swindell, S.R.; Plasterer, T.N. SEQMAN. Contig assembly. Methods Mol Biol. 1997, 70, 75–89. [Google Scholar] [CrossRef] [PubMed]
- Lowe, T.M.; Eddy, S.R. tRNAscan-SE: A program for improved detection of transfer RNA genes in genomic sequence. Nucleic Acids Res. 1997, 25, 955–964. [Google Scholar] [CrossRef] [PubMed]
- Mathews, D.H. Using the RNAstructure software package to predict conserved RNA structures. Curr. Protoc. Bioinform. 2014, 46, 12.14.11–12.14.22. [Google Scholar] [CrossRef]
- Wyman, S.K.; Jansen, R.K.; Boore, J.L. Automatic annotation of organellar genomes with DOGMA. Bioinformatics 2004, 20, 3252–3255. [Google Scholar] [CrossRef] [Green Version]
- Tamura, K.; Stecher, G.; Peterson, D.; Filipski, A.; Kumar, S. MEGA6: Molecular evolutionary genetics analysis version 6.0. Mol. Biol. Evol. 2013, 30, 2725–2729. [Google Scholar] [CrossRef]
- Benson, G. Tandem repeats finder: A program to analyze DNA sequences. Nucleic Acids Res. 1999, 27, 573–580. [Google Scholar] [CrossRef]
- Perna, N.T.; Kocher, T.D. Patterns of nucleotide composition at fourfold degenerate sites of animal mitochondrial genomes. J. Mol. Evol. 1995, 41, 353–358. [Google Scholar] [CrossRef] [PubMed]
- Chen, D.X.; Chu, W.Y.; Liu, X.L.; Nong, X.X.; Li, Y.L.; Du, S.J.; Zhang, J.S. Phylogenetic studies of three sinipercid fishes (Perciformes: Sinipercidae) based on complete mitochondrial DNA sequences. Mitochondrial Dna 2012, 23, 70. [Google Scholar] [CrossRef] [PubMed]
- Lavoué, S.; Nakayama, K.; Jerry, D.R.; Yamanoue, Y.; Yagishita, N.; Suzuki, N.; Nishida, M.; Miya, M. Mitogenomic phylogeny of the Percichthyidae and Centrarchiformes (Percomorphaceae): Comparison with recent nuclear gene-based studies and simultaneous analysis. Gene 2014, 549, 46–57. [Google Scholar] [CrossRef] [PubMed]
- Lam-Tung, N.; Schmidt, H.A.; Arndt, V.H.; Bui Quang, M. IQ-TREE: A fast and effective stochastic algorithm for estimating maximum-likelihood phylogenies. Mol. Biol. Evol. 2015, 32, 268–274. [Google Scholar]
- Ronquist, F.; Teslenko, M.; Mark, P.V.D.; Ayres, D.L.; Darling, A.; Höhna, S.; Larget, B.; Liu, L.; Suchard, M.A.; Huelsenbeck, J.P. MrBayes 3.2: Efficient bayesian phylogenetic inference and model choice across a large model space. Syst. Biol. 2012, 61, 539–542. [Google Scholar] [CrossRef] [PubMed]
- Thompson, J.D.; Gibson, T.J.; Higgins, D.G. Multiple sequence alignment using ClustalW and ClustalX. Curr. Protoc. Bioinform. 2002. [Google Scholar] [CrossRef] [PubMed]
- MrModeltest, V2, program distributed by the author; Nylander, J.A.A., Evolutionary Biology Centre at Uppsala University; Science Open; Berlin. 2004.
- Asakawa, S.; Kumazawa, Y.; Araki, T.; Himeno, H.; Miura, K.; Watanabe, K. Strand-specific nucleotide composition bias in echinoderm and vertebrate mitochondrial genomes. J. Mol. Evol. 1991, 32, 511–520. [Google Scholar] [CrossRef]
- Miya, M.; Takeshima, H.; Endo, H.; Ishiguro, N.B.; Inoue, J.G.; Mukai, T.; Shirai, S.M. Major patterns of higher teleostean phylogenies: A new perspective based on 100 complete mitochondrial DNA sequences. Mol. Phylogenetics Evol. 2003, 26, 121–138. [Google Scholar] [CrossRef]
- Hwang, D.S.; Byeon, H.K.; Lee, J.S. Complete mitochondrial genome of the freshwater sculpin Cottus hangiongensis (Scorpaeniformes, Cottidae). Mitochondrial Dna 2013, 24, 490–491. [Google Scholar] [CrossRef]
- Shi, X.; Peng, T.; Lin, R.; Huang, D.; Wang, J. Characterization of the complete mitochondrial genome sequence of the globose head whiptail Cetonurus globiceps (Gadiformes: Macrouridae) and its phylogenetic analysis. PloS ONE 2016, 11, e0153666. [Google Scholar] [CrossRef]
- Roques, S.; Fox, C.J.; Villasana, M.I.; Rico, C. The complete mitochondrial genome of the whiting, Merlangius merlangus and the haddock, Melanogrammus aeglefinus: A detailed genomic comparison among closely related species of the Gadidae family. Gene 2006, 383, 12–23. [Google Scholar] [CrossRef] [PubMed]
- Ojala, D.; Montoya, J.; Attardi, G. tRNA punctuation model of RNA processing in human mitochondrial. Nature 1981, 290, 470–474. [Google Scholar] [CrossRef] [PubMed]
- Lavrov, D.V.; Brown, W.M.; Boore, J.L. A novel type of RNA editing occurs in the mitochondrial tRNAs of the centipede Lithobius forficatus. Proc. Natl. Acad. Sci. USA 2000, 97, 13738–13742. [Google Scholar] [CrossRef] [PubMed]
- Niu, S.; Liu, Y.; Qin, C.; Wang, X.; Wu, R. The complete mitochondrial genome and phylogenetic analysis of (Perciformes, Moronidae). Mitochondrial Dna 2015, 69, 1–3. [Google Scholar] [CrossRef] [PubMed]
- Chou, C.E.; Wang, F.Y.; Chang, S.K.; Chang, H.W. Complete mitogenome of three flyingfishes Cheilopogon unicolor, Cheilopogon arcticeps and Cheilopogon atrisignis (Teleostei: Exocoetidae). Mitochondrial Dna Part B Resour. 2016, 1, 134–135. [Google Scholar] [CrossRef]
- Li, Y.; Lu, J.; Wang, Z. Complete mitochondrial genome of Lasiopodomys mandarinus mandarinus (Arvicolinae, Rodentia). Mitochondrial Dna A Dna Mapp. Seq. Anal. 2016, 27, 1459–1460. [Google Scholar] [CrossRef] [PubMed]
- Zhang, D.X.; Hewitt, G.M. Insect mitochondrial control region: A review of its structure, evolution and usefulness in evolutionary studies. Biochem. Syst. Ecol. 1997, 25, 99–120. [Google Scholar] [CrossRef]
- Fernã, N.-S.P.; Enriquez, J.A.; Montoya, J. Replication and transcription of mammalian mitochondrial DNA. Exp. Physiol. 2010, 88, 41–56. [Google Scholar] [CrossRef]
- Lee, W.J.; Conroy, J.; Howell, W.H.; Kocher, T.D. Structure and evolution of teleost mitochondrial control regions. J. Mol. Evol. 1995, 41, 54–66. [Google Scholar] [CrossRef]
- Li, A.; Munehara, H. Complete mitochondrial genome of the Antlered sculpin Enophrys diceraus (Scorpaeniformes, Cottidae). Mitochondrial Dna 2013, 26, 125–126. [Google Scholar] [CrossRef]
- Xu, T.J.; Cheng, Y.Z.; Liu, X.Z.; Shi, G.; Wang, R.X. The complete mitochondrial genome of the marbled rockfish Sebastiscus marmoratus (Scorpaeniformes, Scorpaenidae): Genome characterization and phylogenetic considerations. Mol. Biol. 2011, 45, 392–403. [Google Scholar] [CrossRef]
- Wang, Q.; Wang, J.; Luo, J.; Chen, G. The complete mitochondrial genome of the Synanceia verrucosa (Scorpaeniformes: Synanceiidae). Mitochondrial Dna A Dna Mapp. Seq. Anal. 2016, 27, 4234–4235. [Google Scholar] [CrossRef] [PubMed]


| Family | Species | Accession Number | Size (bp) | Whole Genome Composition | PCGs | |||||||
|---|---|---|---|---|---|---|---|---|---|---|---|---|
| A% | G% | T% | C% | A + T% | AT skew | GC skew | AT skew | GC skew | ||||
| Anoplopomatidae | Erilepis zonifer | AP017436.1 | 16,500 | 26.70 | 17.79 | 29.03 | 26.48 | 53.18 | 0.0041 | −0.2400 | −0.0965 | −0.2715 |
| Anoplopomatidae | Anoplopoma fimbria | KP777542.1 | 16,507 | 26.07 | 18.34 | 29.58 | 26.01 | 52.08 | 0.0010 | −0.2346 | −0.0994 | −0.2701 |
| Agonidae | Aspidophoroides olrikii | KT004434.1 | 17,200 | 27.30 | 16.90 | 27.28 | 28.49 | 55.80 | −0.0214 | −0.2350 | −0.1153 | −0.2662 |
| Cottidae | Icelus spatula | KT004432.1 | 16,384 | 26.43 | 17.43 | 30.04 | 26.03 | 52.46 | 0.0078 | −0.2656 | −0.0987 | −0.2935 |
| Cottidae | Trachidermus fasciatus | JX017305.1 | 16,536 | 26.33 | 18.13 | 30.07 | 25.47 | 51.80 | 0.0167 | −0.2478 | −0.0815 | −0.2750 |
| Cottidae | Cottus poecilopus | EU332750.1 | 16,560 | 25.69 | 18.18 | 30.39 | 25.74 | 51.43 | −0.0011 | −0.2513 | −0.1040 | −0.2822 |
| Cottidae | Cottus hangiongensis | NC_014851.1 | 16,598 | 25.48 | 18.22 | 30.40 | 25.87 | 51.36 | −0.0075 | −0.2506 | −0.1135 | −0.2840 |
| Cottidae | Enophrys diceraus | NC_022147.1 | 16,976 | 27.53 | 16.65 | 28.64 | 27.19 | 54.71 | 0.0062 | −0.2648 | −0.0869 | −0.2987 |
| Cottidae | Cottus reinii | AP004442.1 | 16,561 | 26.30 | 17.63 | 30.28 | 25.78 | 52.09 | 0.0100 | −0.2640 | −0.0919 | −0.2999 |
| Cottidae | Mesocottus haitej | NC_022181.1 | 16,527 | 26.64 | 17.35 | 29.88 | 26.12 | 52.76 | 0.0099 | −0.2653 | −0.0853 | −0.2995 |
| Cottidae | Cottus szanaga | KX762050.1 | 16,518 | 26.51 | 17.39 | 29.94 | 26.16 | 52.67 | 0.0067 | −0.2650 | −0.0853 | −0.3000 |
| Cottidae | Cottus czerskii | NC_025242.1 | 16,534 | 26.40 | 17.47 | 30.07 | 26.07 | 52.47 | 0.0063 | −0.2651 | −0.0850 | −0.3130 |
| Cottidae | Cottus dzungaricus | NC_024739.1 | 16,527 | 26.93 | 17.07 | 29.70 | 26.30 | 53.23 | 0.0119 | −0.2701 | −0.0822 | −0.3135 |
| Hexagrammidae | Pleurogrammus monopterygius | NC_023475.1 | 16,575 | 27.05 | 17.15 | 28.68 | 27.12 | 54.17 | −0.0012 | −0.2517 | −0.0956 | −0.2913 |
| Hexagrammidae | Hexagrammos lagocephalus | KP682334.1 | 16,505 | 26.98 | 17.26 | 29.48 | 26.29 | 53.27 | 0.0130 | −0.2615 | −0.0836 | −0.3002 |
| Hexagrammidae | Hexagrammos otakii | AP017443.1 | 16,513 | 26.90 | 17.33 | 29.87 | 25.90 | 52.80 | 0.0189 | −0.2656 | −0.0727 | −0.3067 |
| Hexagrammidae | Hexagrammos agrammus | AB763992.1 | 16,514 | 26.88 | 17.23 | 29.72 | 26.15 | 53.03 | 0.0137 | −0.2659 | −0.0839 | −0.3009 |
| Peristediidae | Satyrichthys amiscus | AP004441.1 | 16,526 | 27.06 | 17.00 | 28.56 | 27.38 | 54.44 | −0.0058 | −0.2537 | −0.1030 | −0.2883 |
| Platycephalidae | Platycephalus indicus | AP006783.1 | 16,542 | 27.32 | 16.99 | 30.12 | 25.57 | 52.88 | 0.0332 | −0.2787 | −0.0537 | −0.3143 |
| Platycephalidae | Cociella crocodila | MH521260.1 | 17,314 | 29.14 | 15.91 | 27.76 | 27.19 | 56.33 | 0.0348 | −0.2713 | −0.0375 | −0.2911 |
| Scorpaenidae | Pterois miles | NC_024746.1 | 16,497 | 27.40 | 18.26 | 28.74 | 25.60 | 53.00 | 0.0340 | −0.2229 | −0.0509 | −0.2420 |
| Scorpaenidae | Scorpaenopsis cirrosa | NC_027735.1 | 16,966 | 27.91 | 17.71 | 28.02 | 26.35 | 54.27 | 0.0288 | −0.2254 | −0.0601 | −0.2448 |
| Sebastidae | Sebastes oblongus | NC_024549.1 | 16,396 | 27.91 | 16.96 | 28.72 | 26.41 | 54.32 | 0.0276 | −0.2574 | −0.0595 | −0.2842 |
| Sebastidae | Sebastes thompsoni | NC_027447.1 | 16,405 | 27.98 | 17.04 | 28.21 | 26.77 | 54.75 | 0.0222 | −0.2468 | −0.0677 | −0.2781 |
| Sebastidae | Sebastes minor | NC_027444.1 | 16,408 | 27.79 | 17.33 | 27.63 | 27.25 | 55.04 | 0.0099 | −0.2292 | −0.0815 | −0.2609 |
| Sebastidae | Sebastes trivittatus | NC_027446.1 | 16,409 | 27.86 | 17.09 | 28.37 | 26.67 | 54.54 | 0.0218 | −0.2480 | −0.0690 | −0.2789 |
| Sebastidae | Sebastes taczanowskii | KJ525744.1 | 16,452 | 27.71 | 17.29 | 28.53 | 26.47 | 54.18 | 0.0229 | −0.2452 | −0.0709 | −0.2748 |
| Sebastidae | Sebastes owstoni | KJ834063.1 | 16,465 | 27.71 | 17.30 | 28.41 | 26.57 | 54.28 | 0.0210 | −0.2430 | −0.0748 | −0.2723 |
| Sebastidae | Sebates schlegeli | AY491978.1 | 16,525 | 27.47 | 17.45 | 28.74 | 26.34 | 53.80 | 0.0210 | −0.2444 | −0.0680 | −0.2742 |
| Sebastidae | Sebastiscus marmoratus | AP005989.1 | 17,301 | 28.69 | 16.51 | 28.14 | 26.67 | 55.36 | 0.0364 | −0.2605 | −0.0592 | −0.2855 |
| Sebastidae | Sebastes pachycephalus | KF836442.1 | 16,415 | 27.77 | 17.24 | 28.66 | 26.33 | 54.10 | 0.0266 | −0.2488 | −0.0635 | −0.2786 |
| Sebastidae | Sebastes longispinis | KJ834061.1 | 16,445 | 27.91 | 17.12 | 28.31 | 26.66 | 54.57 | 0.0230 | −0.2462 | −0.0699 | −0.2713 |
| Sebastidae | Sebastes steindachneri | NC_027445.1 | 16,450 | 27.36 | 17.54 | 28.01 | 27.09 | 54.46 | 0.0049 | −0.2298 | −0.0873 | −0.2587 |
| Sebastidae | Sebastes hubbsi | KJ525745.1 | 16,453 | 27.86 | 17.20 | 28.28 | 26.66 | 54.52 | 0.0221 | −0.2436 | −0.0671 | −0.2714 |
| Sebastidae | Sebastes vulpes | NC_027438.1 | 16,462 | 27.71 | 17.14 | 28.61 | 26.55 | 54.25 | 0.0214 | −0.2506 | −0.0706 | −0.2808 |
| Sebastidae | Sebastes inermis | KF725093.1 | 16,504 | 27.77 | 17.13 | 28.34 | 26.76 | 54.53 | 0.0186 | −0.2466 | −0.0714 | −0.2735 |
| Synanceiidae | Synanceia verrucosa | NC_026989.1 | 16,506 | 31.01 | 15.06 | 25.60 | 28.34 | 59.35 | 0.0451 | −0.2593 | −0.0286 | −0.2883 |
| Triglidae | Chelidonichthys kumu | KY379222.1 | 16,495 | 26.63 | 17.04 | 31.13 | 25.20 | 51.83 | 0.0277 | −0.2925 | −0.0640 | −0.3351 |
| Triglidae | Lepidotrigla microptera | KY012348.1 | 16,610 | 26.53 | 17.15 | 31.28 | 25.05 | 51.58 | 0.0286 | −0.2918 | −0.0666 | −0.3326 |
| Feature | Strand * | Position | Spacer (+)/Overlap (−) | Start/Stop codon |
|---|---|---|---|---|
| tRNA-Phe (F) | H | 1–67 | 0 | |
| 12S rRNA | H | 68–1088 | 0 | |
| tRNA-Val (V) | H | 1089–1160 | −2 | |
| 16S rRNA | H | 1161–2873 | 79 | |
| tRNA-Leu (L1) | H | 2872–2947 | 3 | |
| nad1 | H | 3027–4001 | −1 | ATG/TAA |
| tRNA-Ile (I) | H | 4005–4074 | 23 | |
| tRNA-Gln (Q) | L | 4074–4144 | 1 | |
| tRNA-Met (M) | H | 4168–4237 | 6 | |
| nad2 | H | 4239–5288 | 0 | ATG/TAA |
| tRNA-Trp (W) | H | 5295–5366 | 1 | |
| tRNA-Ala (A) | L | 5367–5435 | 30 | |
| tRNA-Asn (N) | L | 5437–5509 | 0 | |
| tRNA-Cys (C) | L | 5540–5607 | 1 | |
| tRNA-Tyr (Y) | L | 5608–5675 | 0 | |
| cox1 | H | 5677–7227 | 3 | GTG/TAA |
| tRNA-Ser (S1) | L | 7228–7298 | 5 | |
| tRNA-Asp (D) | H | 7302–7374 | 0 | |
| cox2 | H | 7380–8070 | 1 | ATG/T |
| tRNA-Lys (K) | H | 8071–8145 | −10 | |
| atp 8 | H | 8147–8311 | −1 | ATG/TAA |
| atp 6 | H | 8302–8985 | −1 | ATG/TAA |
| cox3 | H | 8985–9770 | 0 | ATG/TAA |
| tRNA-Gly (G) | H | 9770–9841 | −2 | |
| nad3 | H | 9842–10,192 | 0 | ATG/TAG |
| tRNA-Arg (R) | H | 10,191–10,259 | −7 | |
| nad4l | H | 10,260–10,556 | 0 | ATG/TAA |
| nad4 | H | 10,550–11,930 | −7 | ATG/T |
| tRNA-His (H) | H | 11,931–11,999 | 0 | |
| tRNA-Ser (S1) | H | 12,002–12,069 | 2 | |
| tRNA-Leu (L1) | H | 12,074–12,146 | 4 | |
| nad5 | H | 12,147–13,985 | 0 | ATG/TAA |
| nad6 | L | 13,982–14,503 | −4 | ATG/TAG |
| tRNAGlu (E) | L | 14,505–14,573 | 1 | |
| cytb | H | 14,576–15,725 | 2 | ATG/T |
| tRNA-Thr (T) | H | 15,726–15,797 | 0 | |
| tRNA-Pro (P) | L | 15,797–15,867 | −1 | |
| Control region | H | 15,868–17,314 | 0 |
© 2019 by the authors. Licensee MDPI, Basel, Switzerland. This article is an open access article distributed under the terms and conditions of the Creative Commons Attribution (CC BY) license (http://creativecommons.org/licenses/by/4.0/).
Share and Cite
Cui, L.; Cao, R.; Dong, Y.; Gao, X.; Cen, J.; Lu, S. The First Complete Mitochondrial Genome of the Flathead Cociella crocodilus (Scorpaeniformes: Platycephalidae) and the Phylogenetic Relationships within Scorpaeniformes Based on Whole Mitogenomes. Genes 2019, 10, 533. https://0-doi-org.brum.beds.ac.uk/10.3390/genes10070533
Cui L, Cao R, Dong Y, Gao X, Cen J, Lu S. The First Complete Mitochondrial Genome of the Flathead Cociella crocodilus (Scorpaeniformes: Platycephalidae) and the Phylogenetic Relationships within Scorpaeniformes Based on Whole Mitogenomes. Genes. 2019; 10(7):533. https://0-doi-org.brum.beds.ac.uk/10.3390/genes10070533
Chicago/Turabian StyleCui, Lei, Rongbo Cao, Yuelei Dong, Xingchen Gao, Jingyi Cen, and Songhui Lu. 2019. "The First Complete Mitochondrial Genome of the Flathead Cociella crocodilus (Scorpaeniformes: Platycephalidae) and the Phylogenetic Relationships within Scorpaeniformes Based on Whole Mitogenomes" Genes 10, no. 7: 533. https://0-doi-org.brum.beds.ac.uk/10.3390/genes10070533