Genome-Wide Identification and Expression Profiles of Late Embryogenesis-Abundant (LEA) Genes during Grain Maturation in Wheat (Triticum aestivum L.)

 ,
,
Abstract
:1. Introduction
2. Materials and Methods
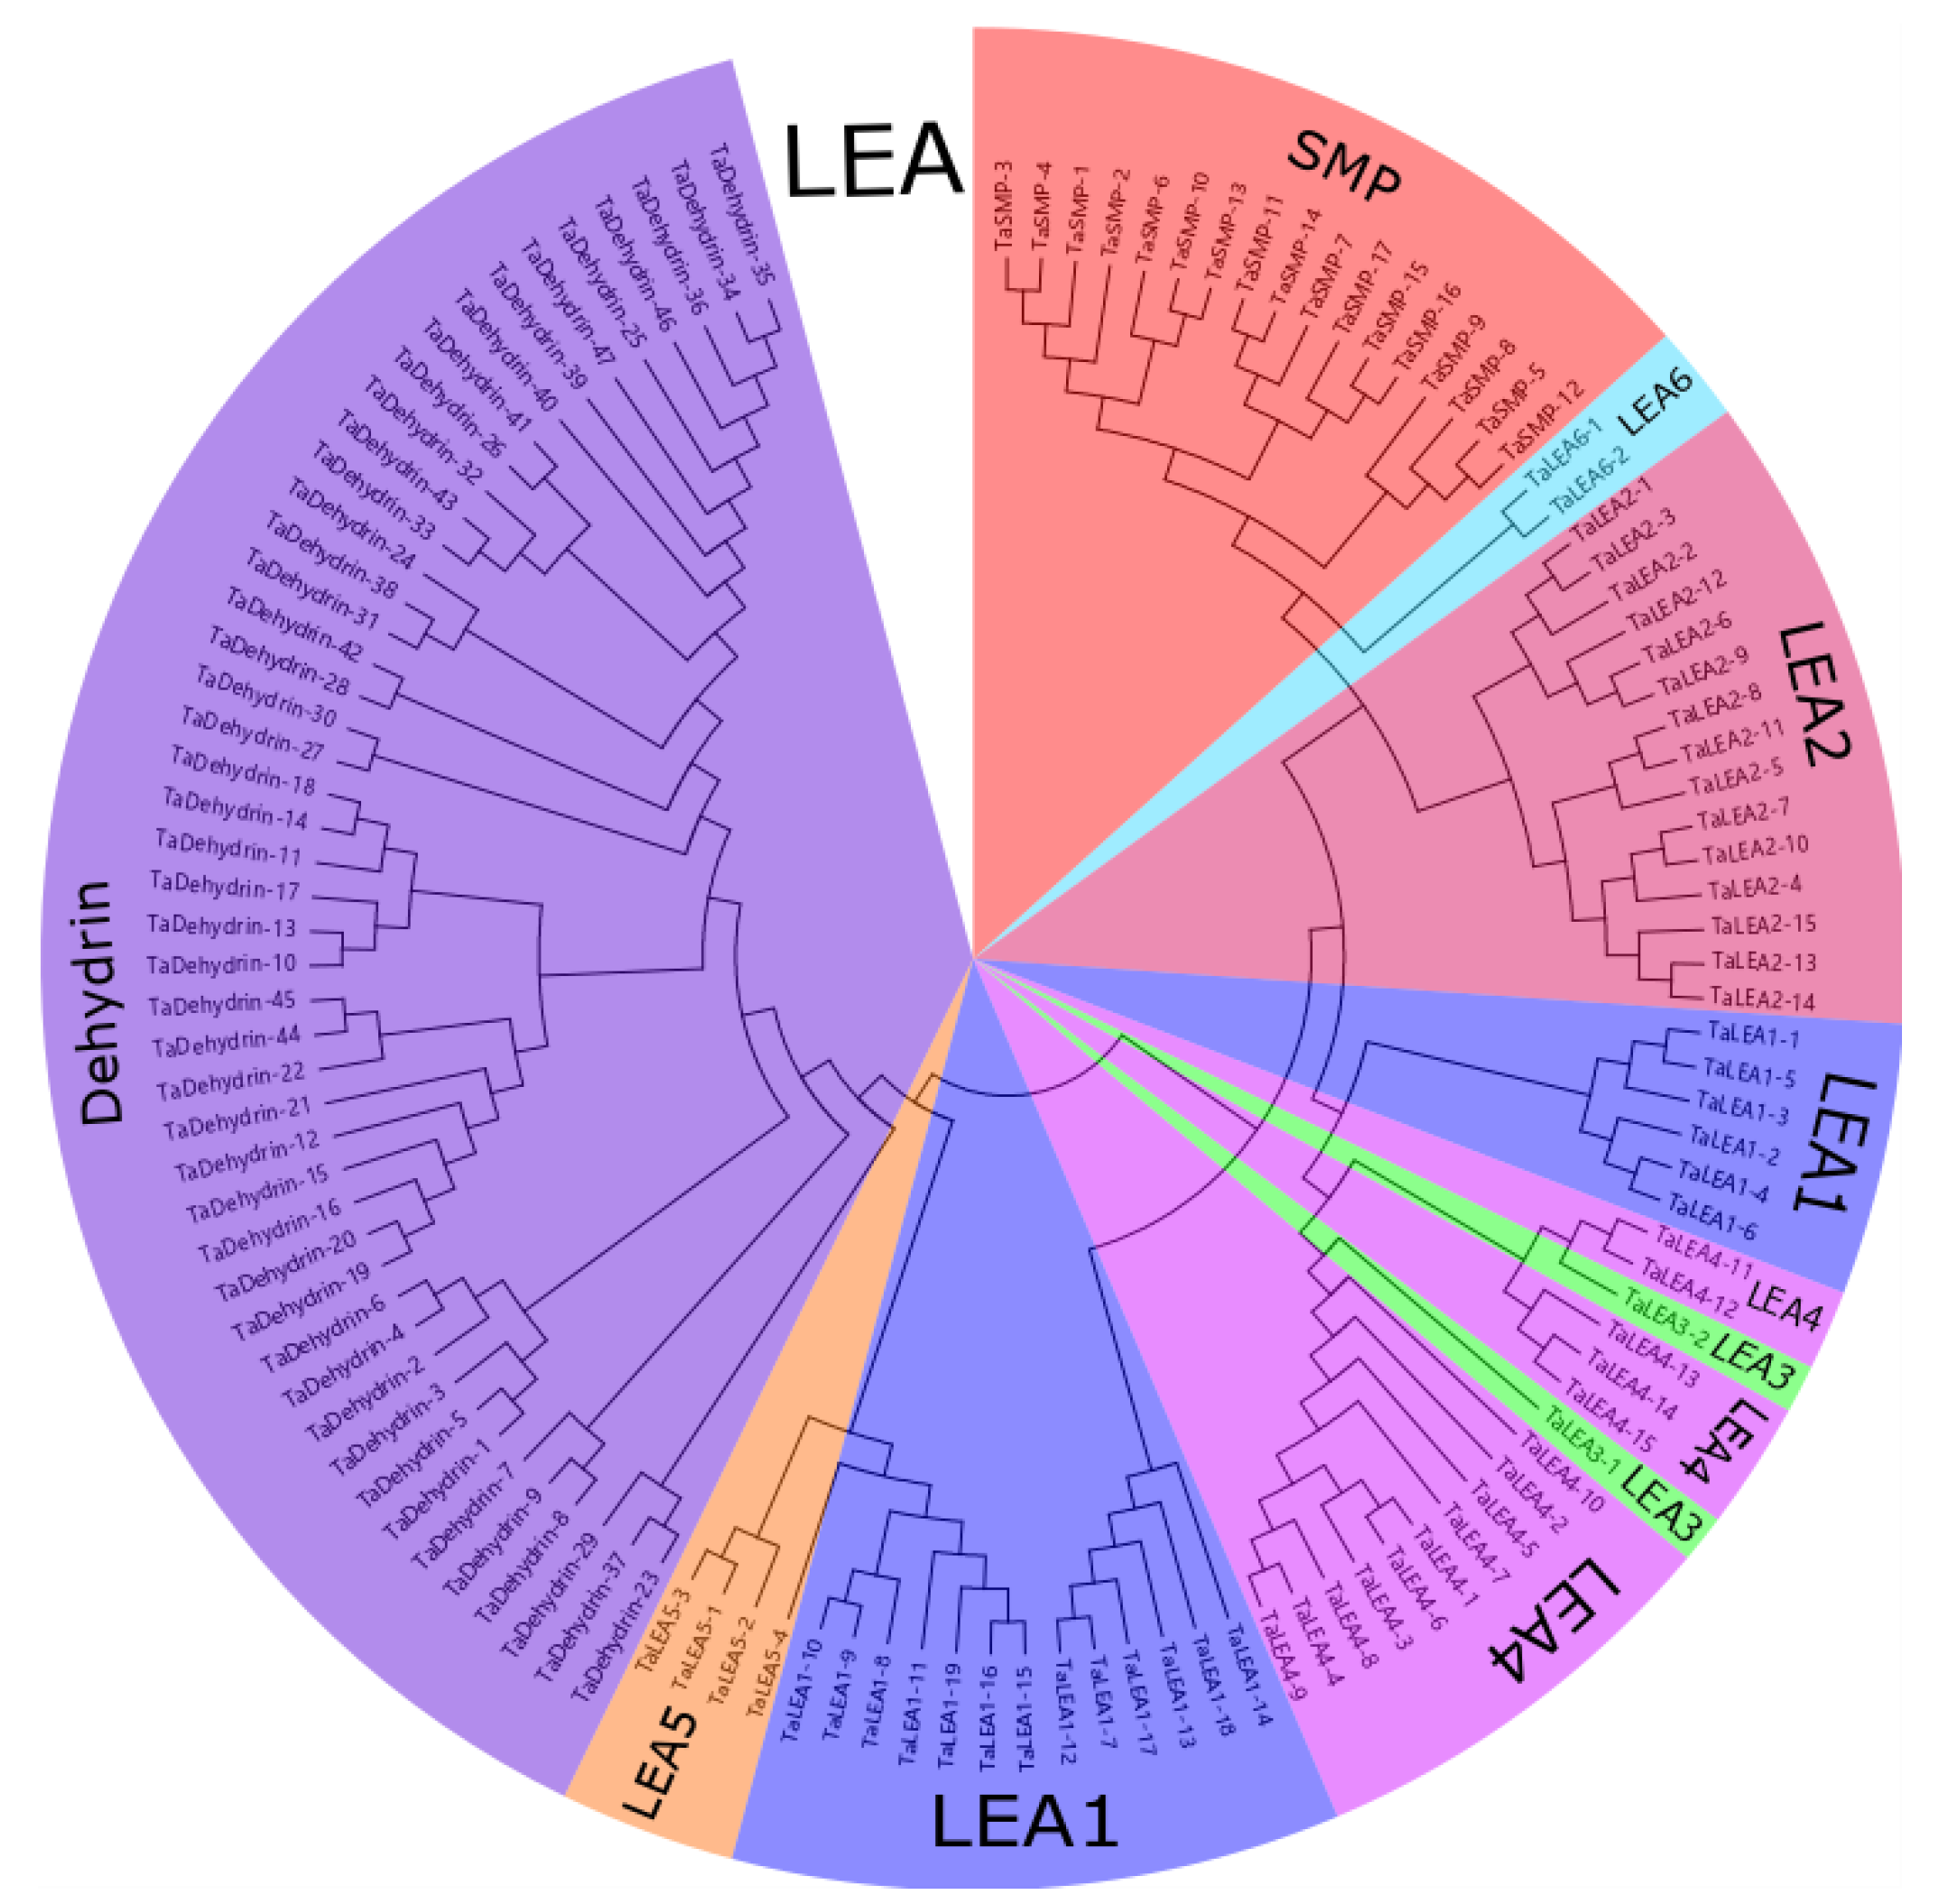
2.1. Identification and Phylogenetic Analysis of Late Embryogenesis-Abundant (LEA) Genes in Wheat Genomes
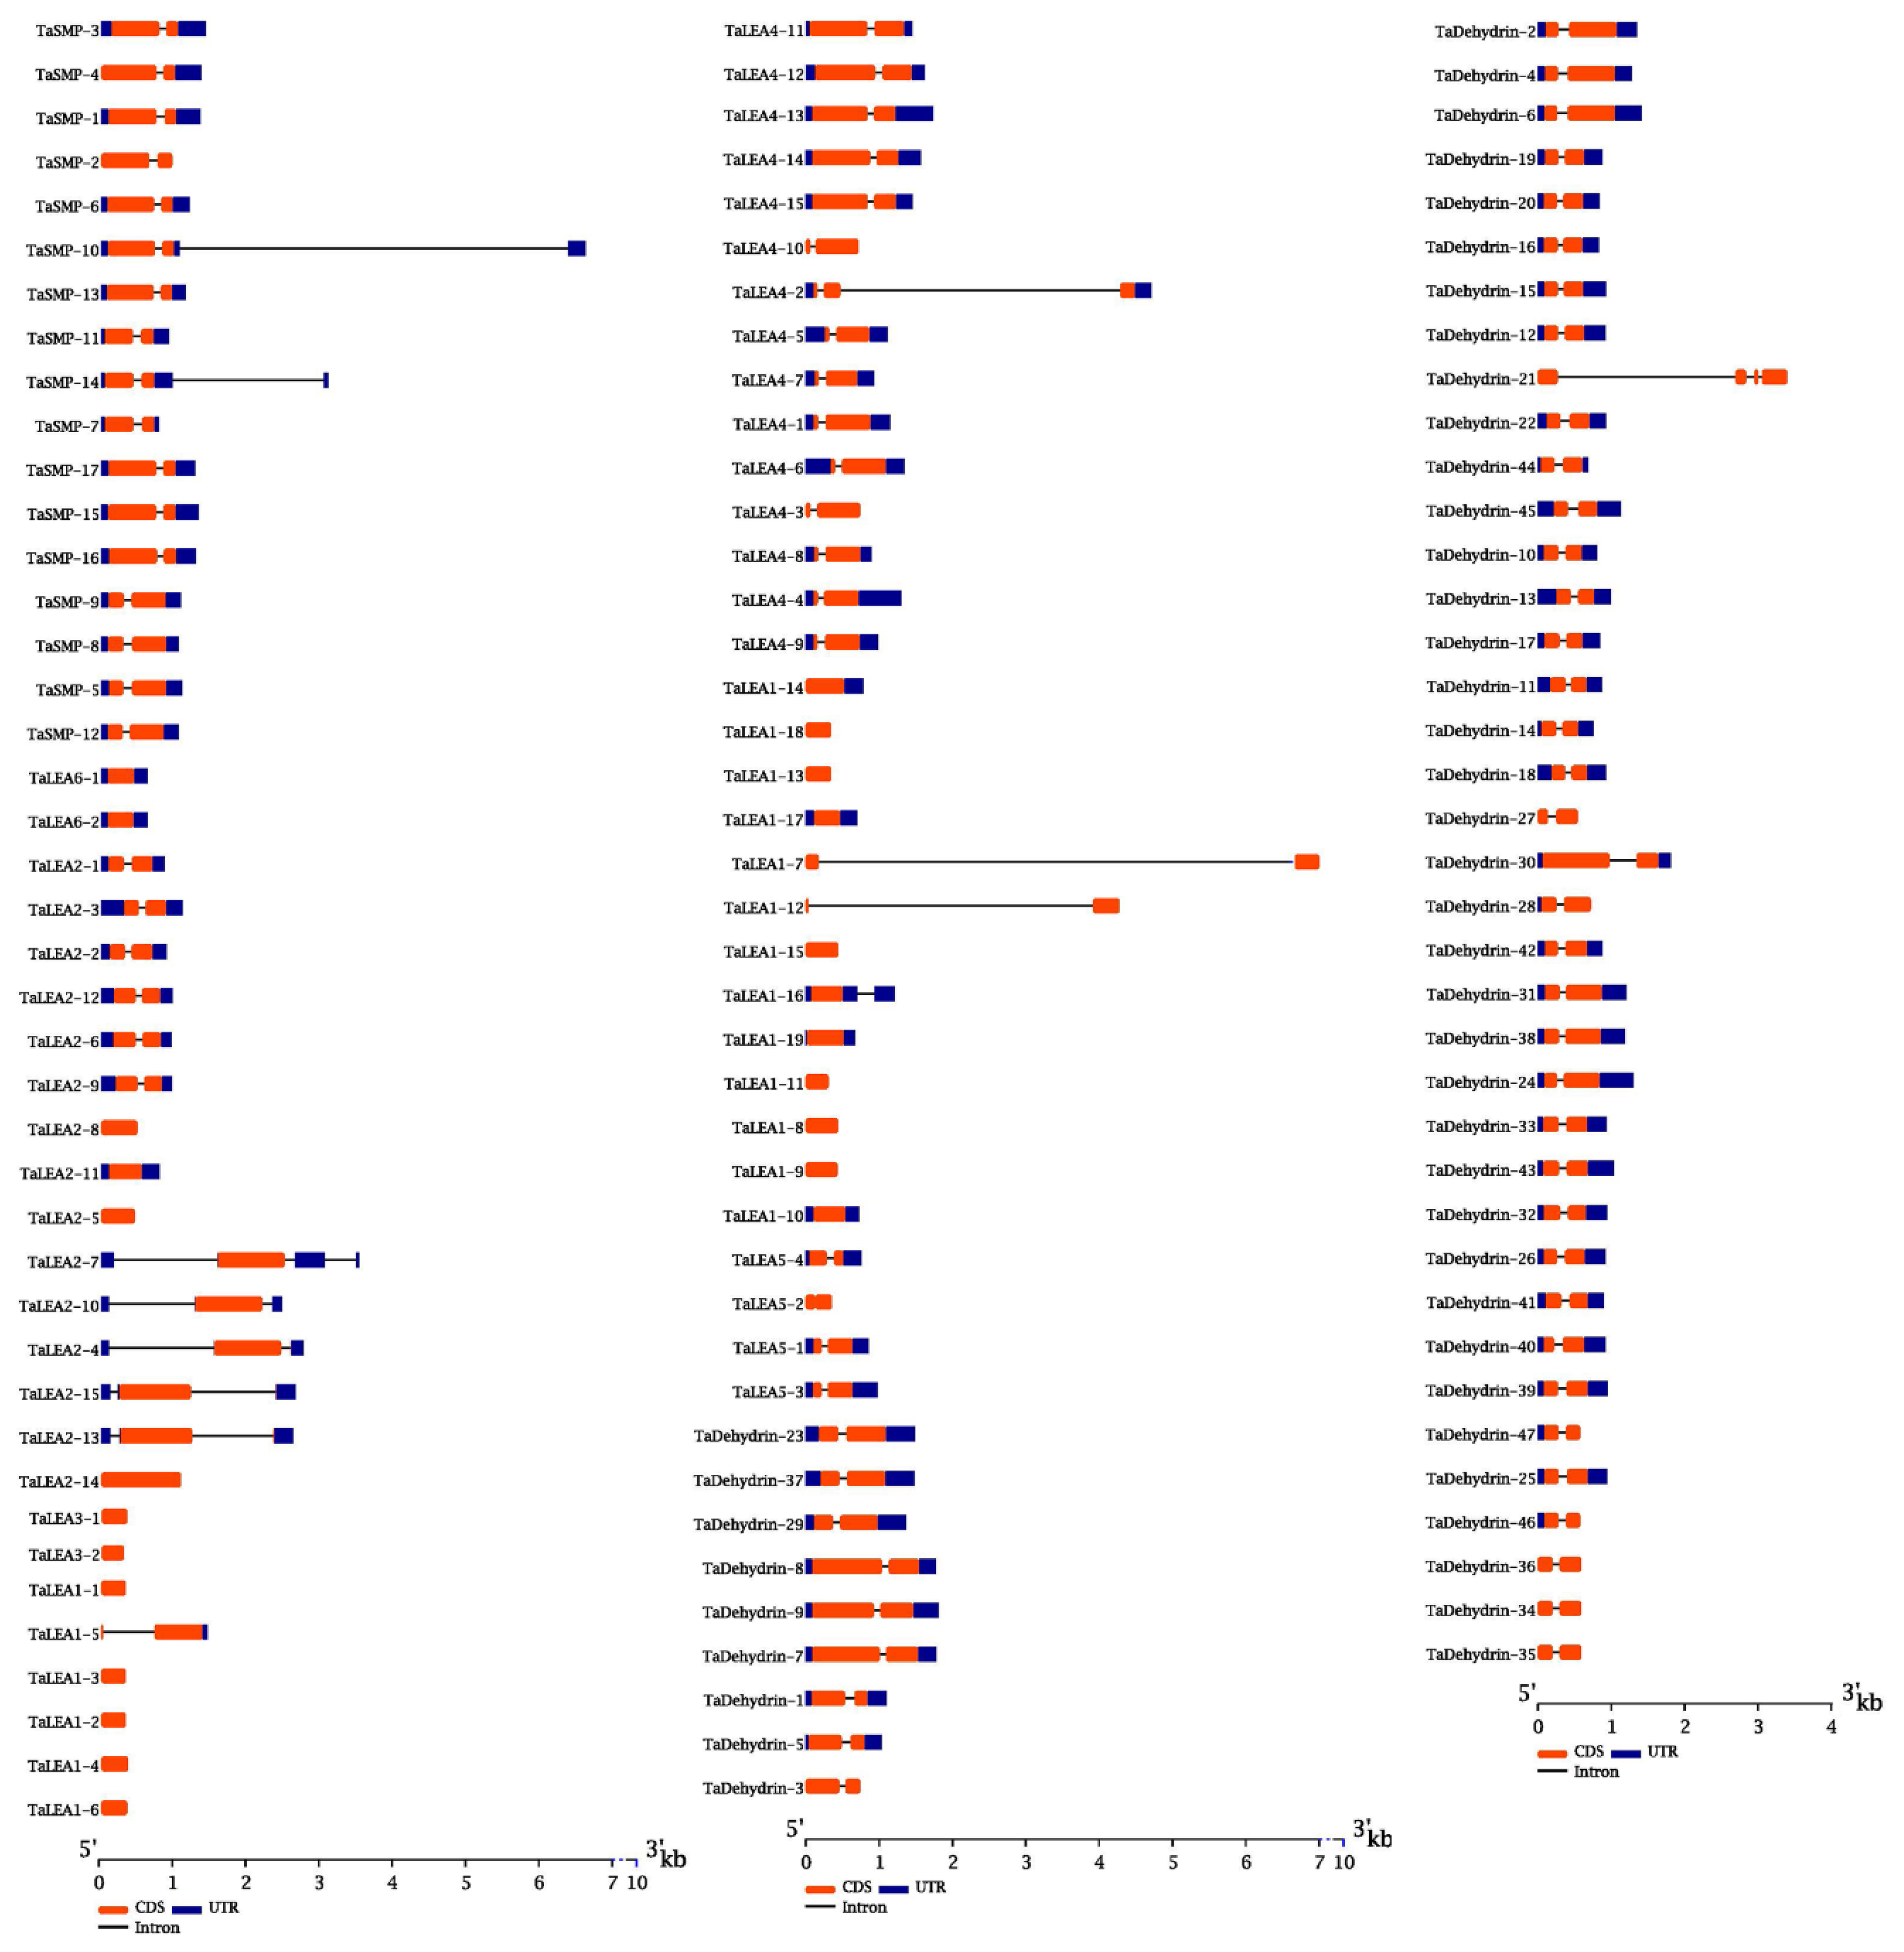
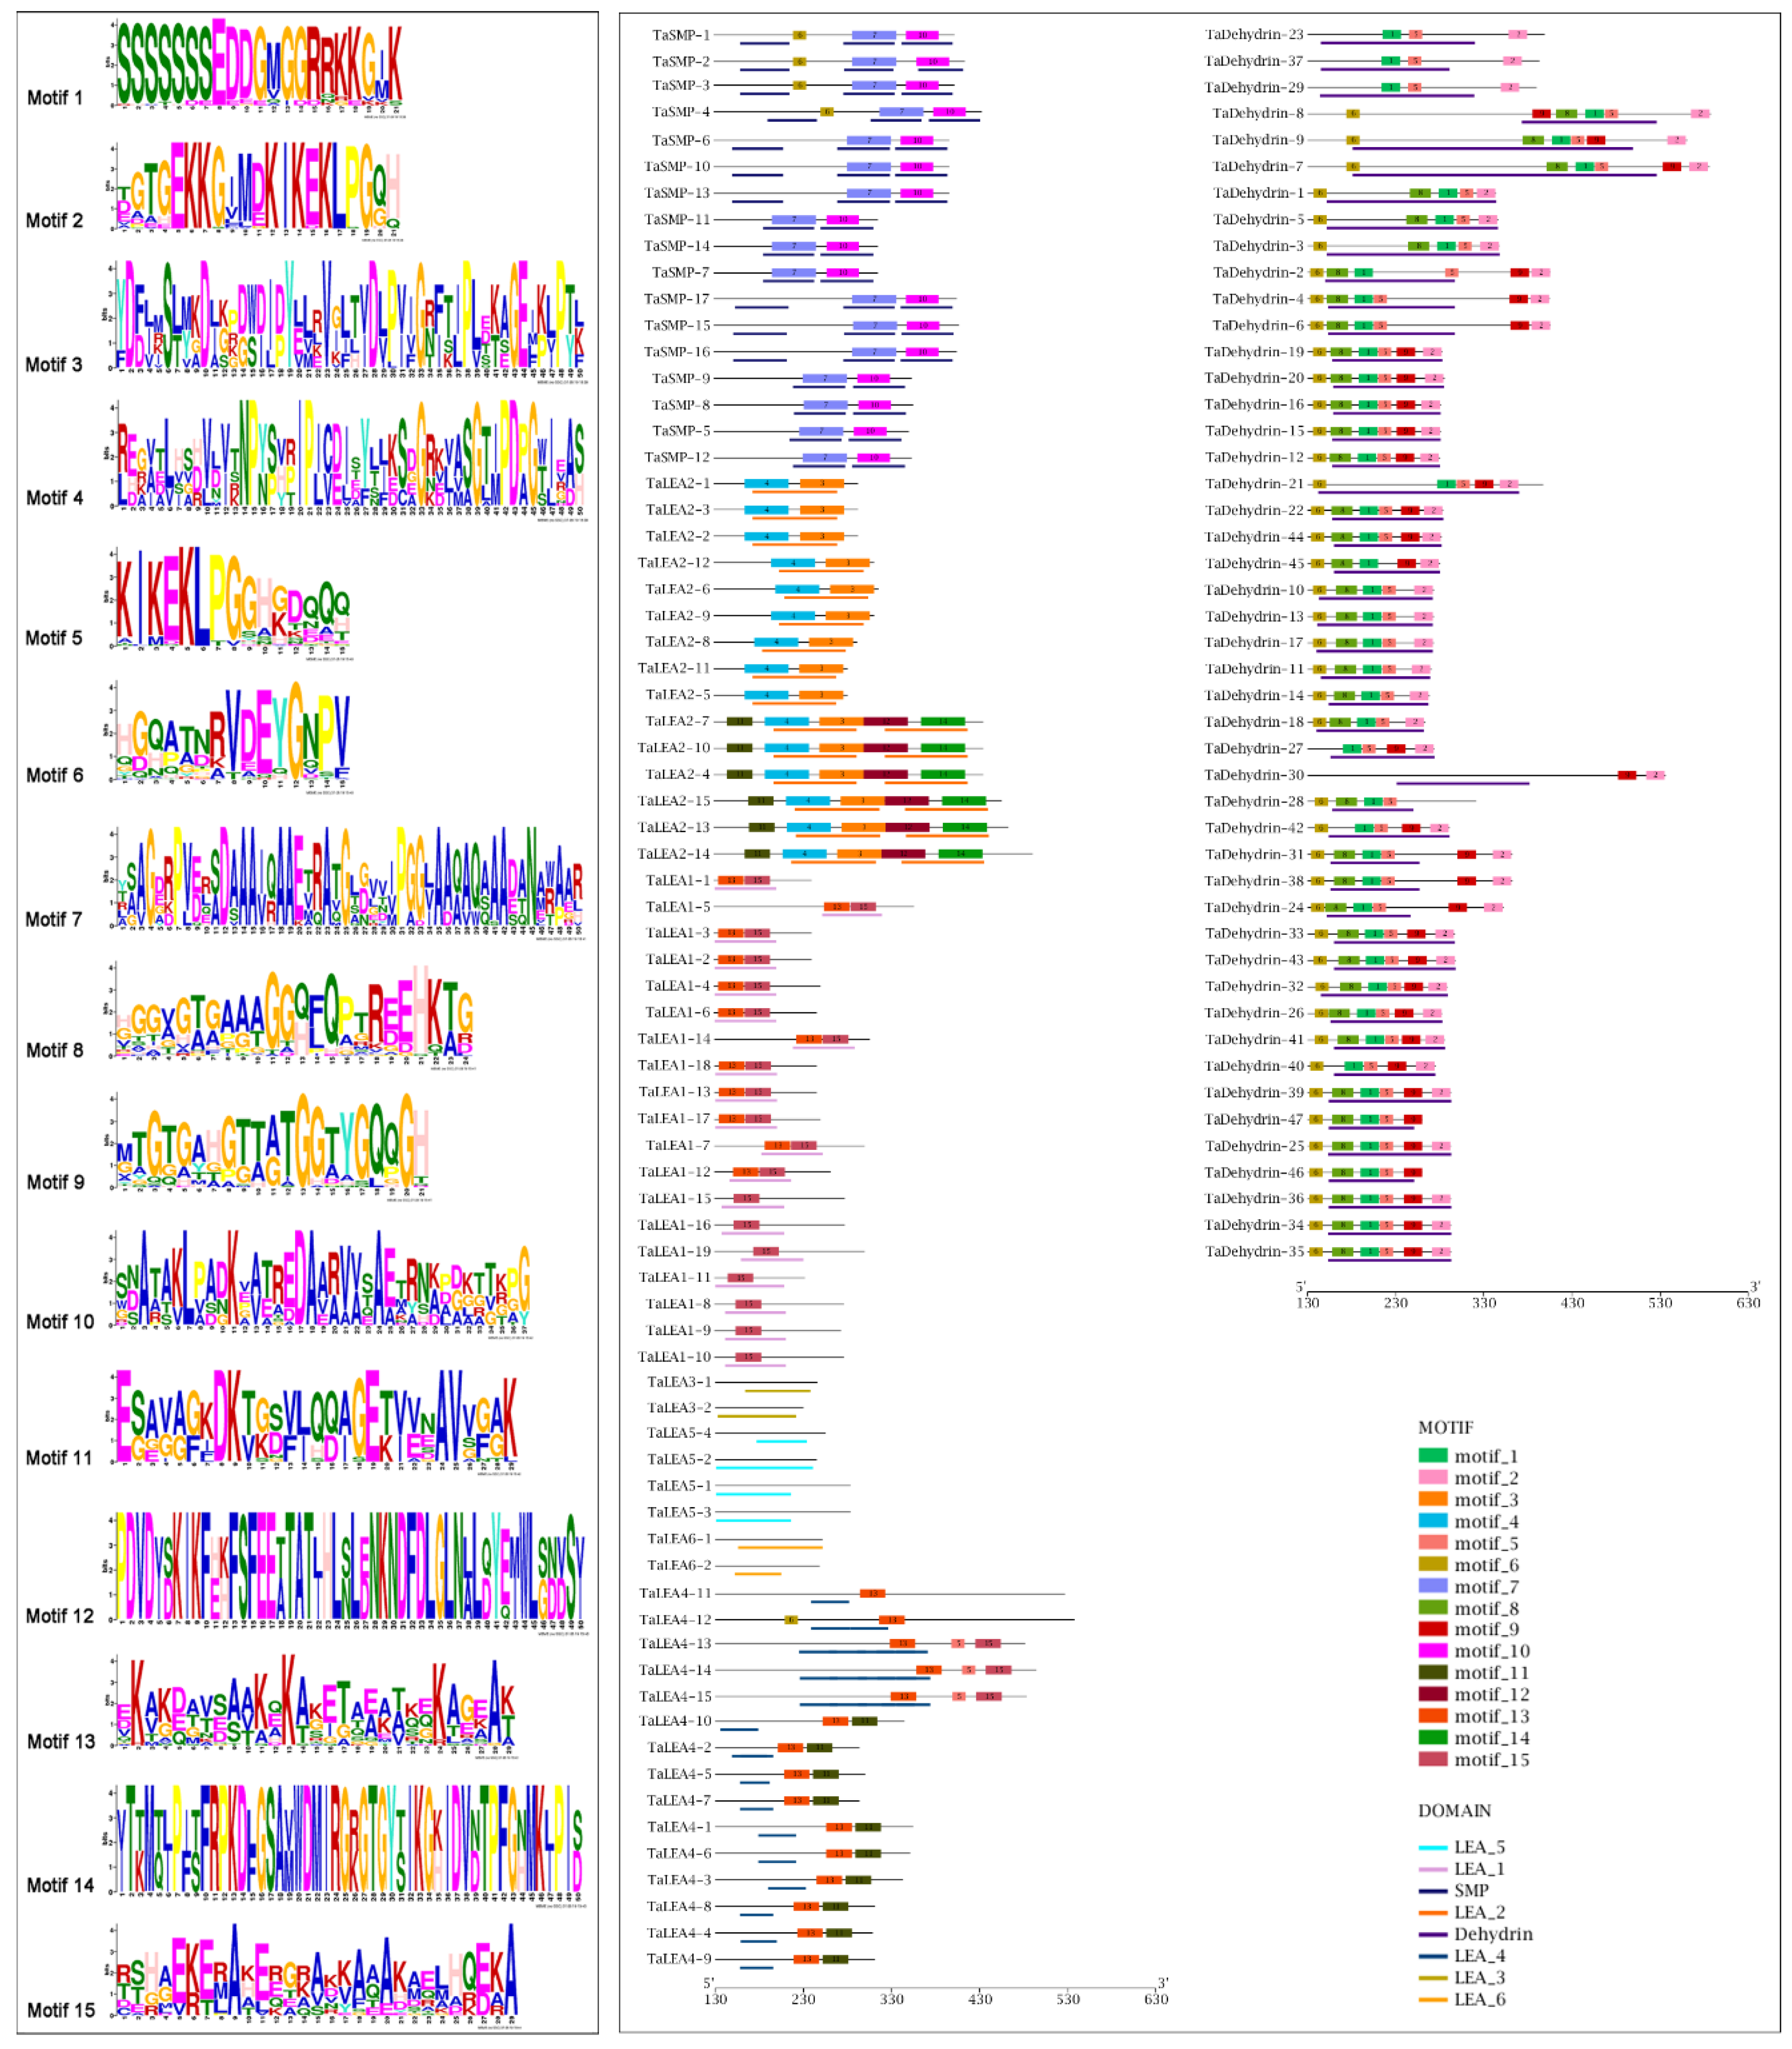
2.2. Structural Characterisation of Wheat LEA
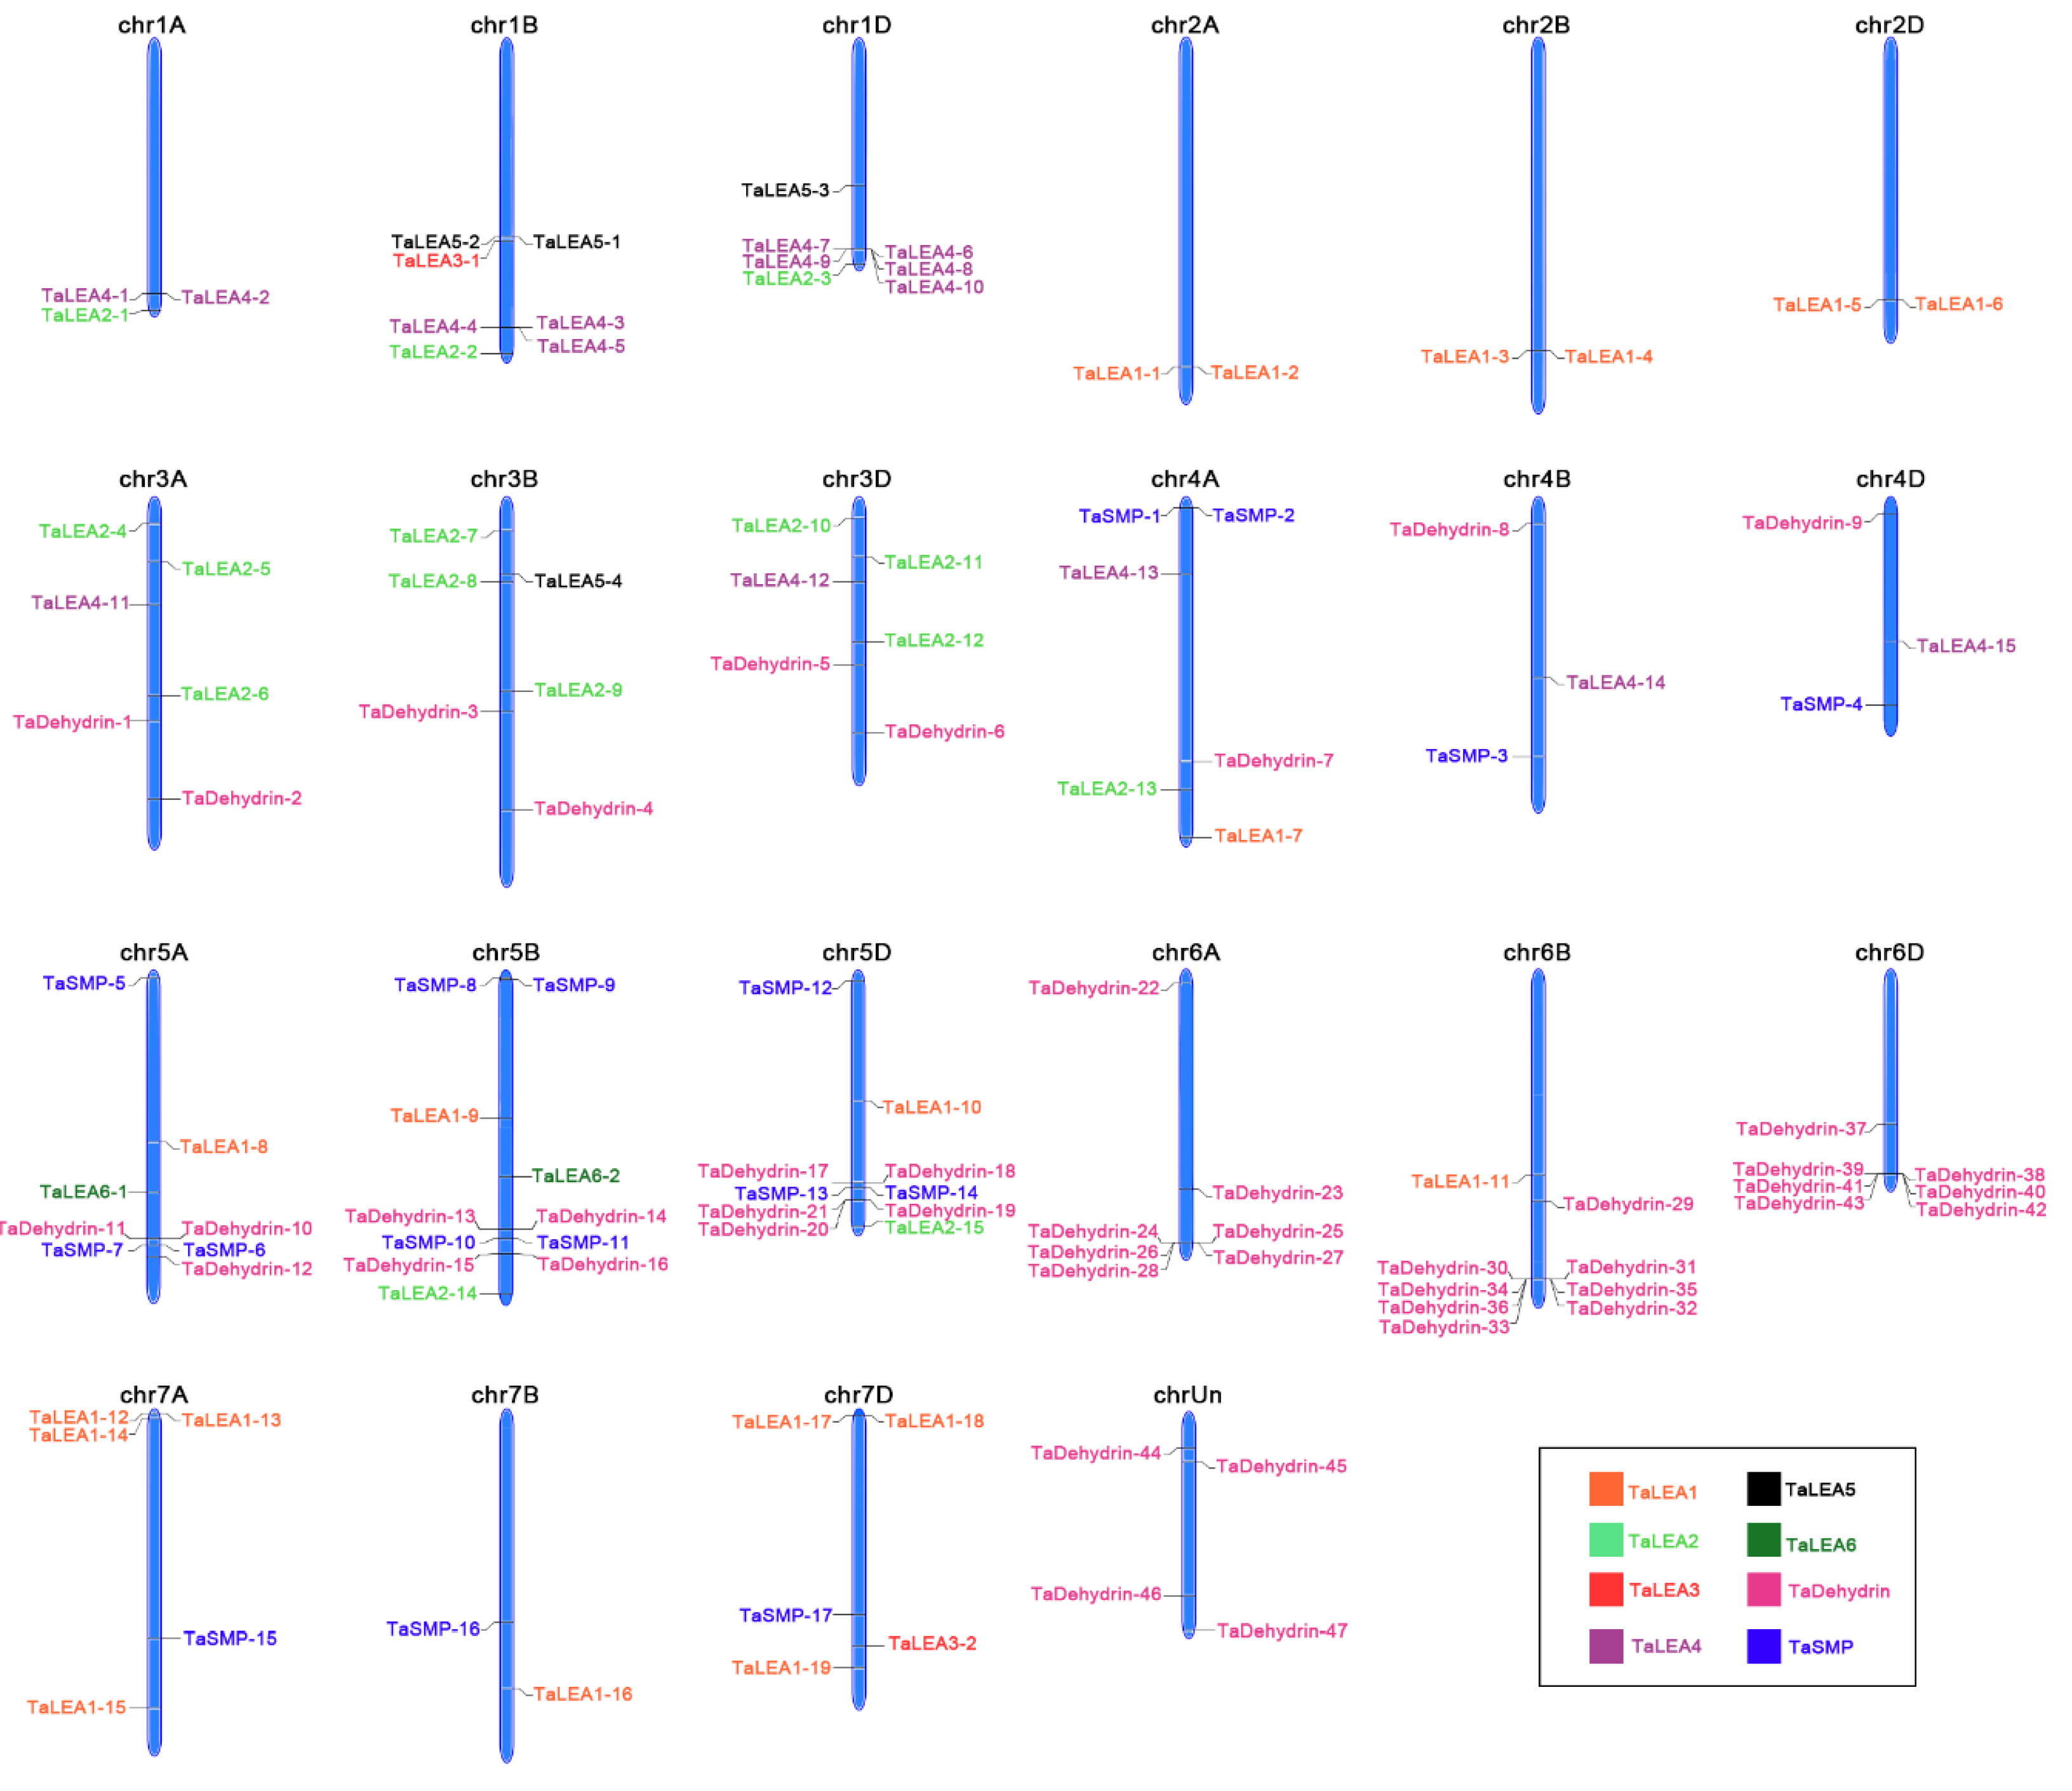
2.3. Distribution of LEA Genes on Wheat Chromosomes
2.4. Expression Profile Analysis of Wheat LEA Genes
2.5. Plant Materials, Growth Conditions, and Sampling
2.6. Quantitative Real-Time Polymerase Chain Reaction Analysis of TaLEA Proteins
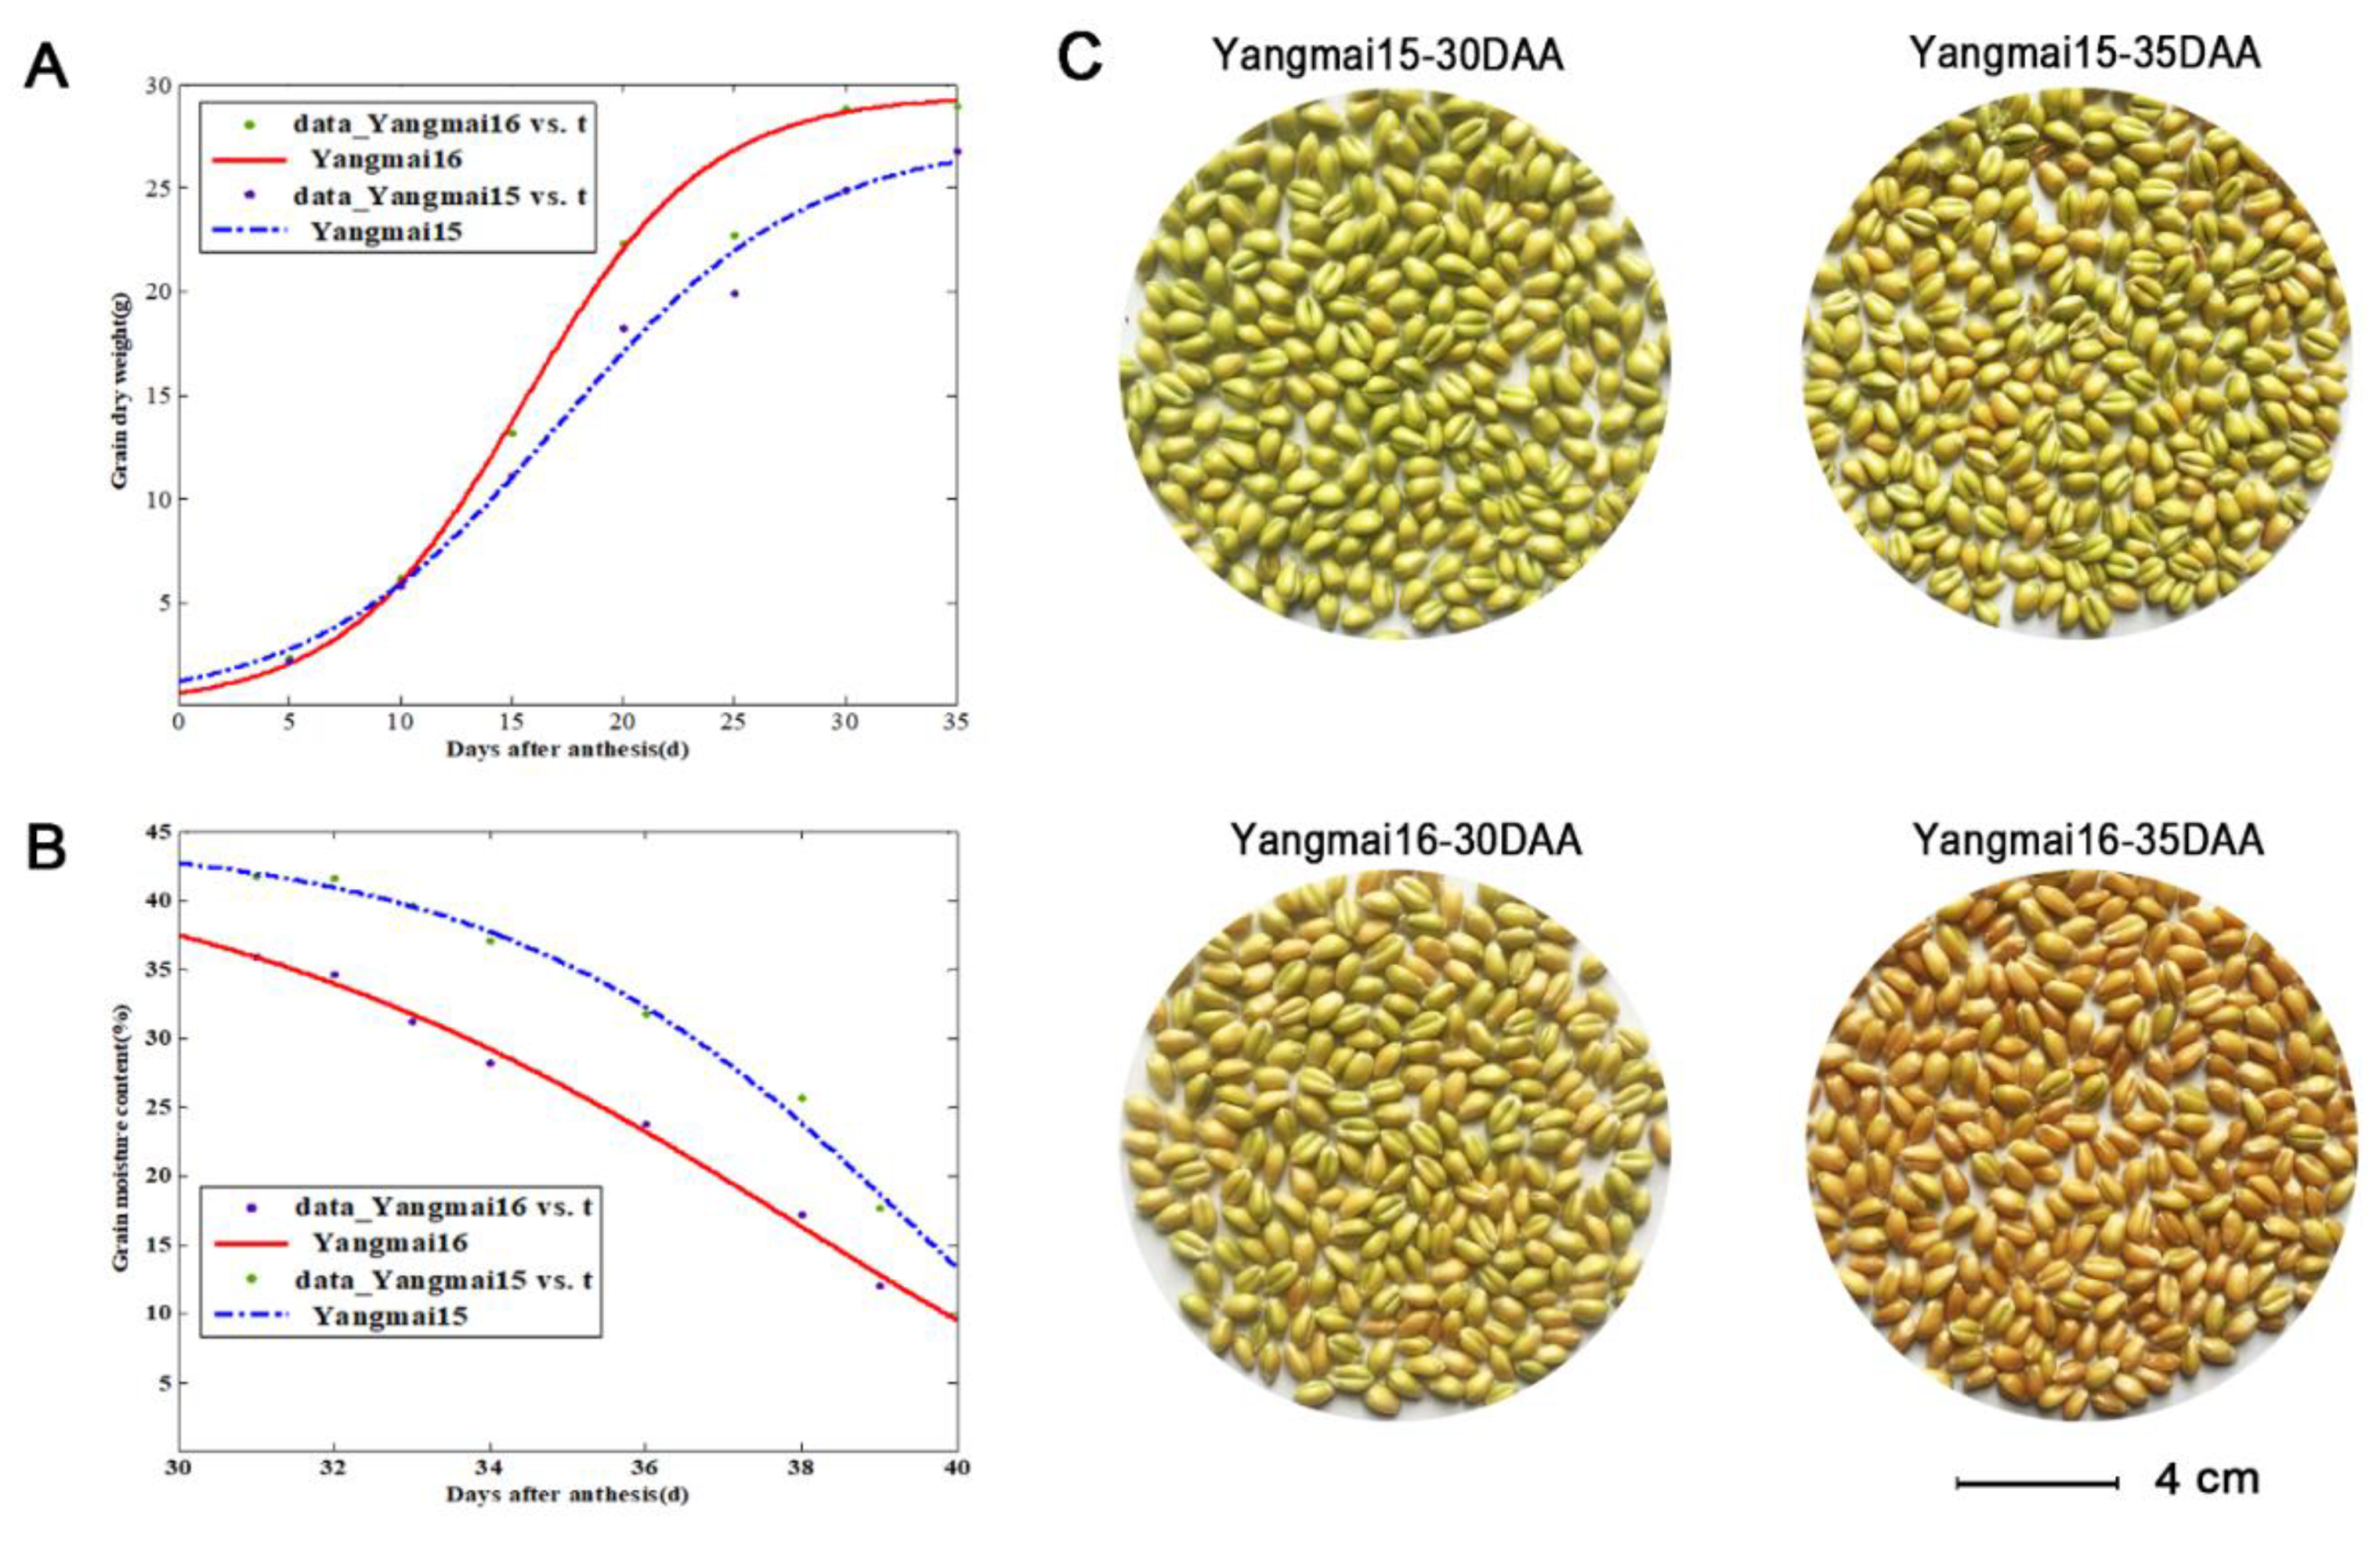
2.7. Determination of the Dry Weight and Moisture Content of Grains
3. Results
3.1. Genome-Wide Identification and Phylogenetic Analysis of Wheat LEA Genes
3.2. Structural Characterization of Wheat LEA
3.3. Chromosomal Locations of Wheat LEA Genes
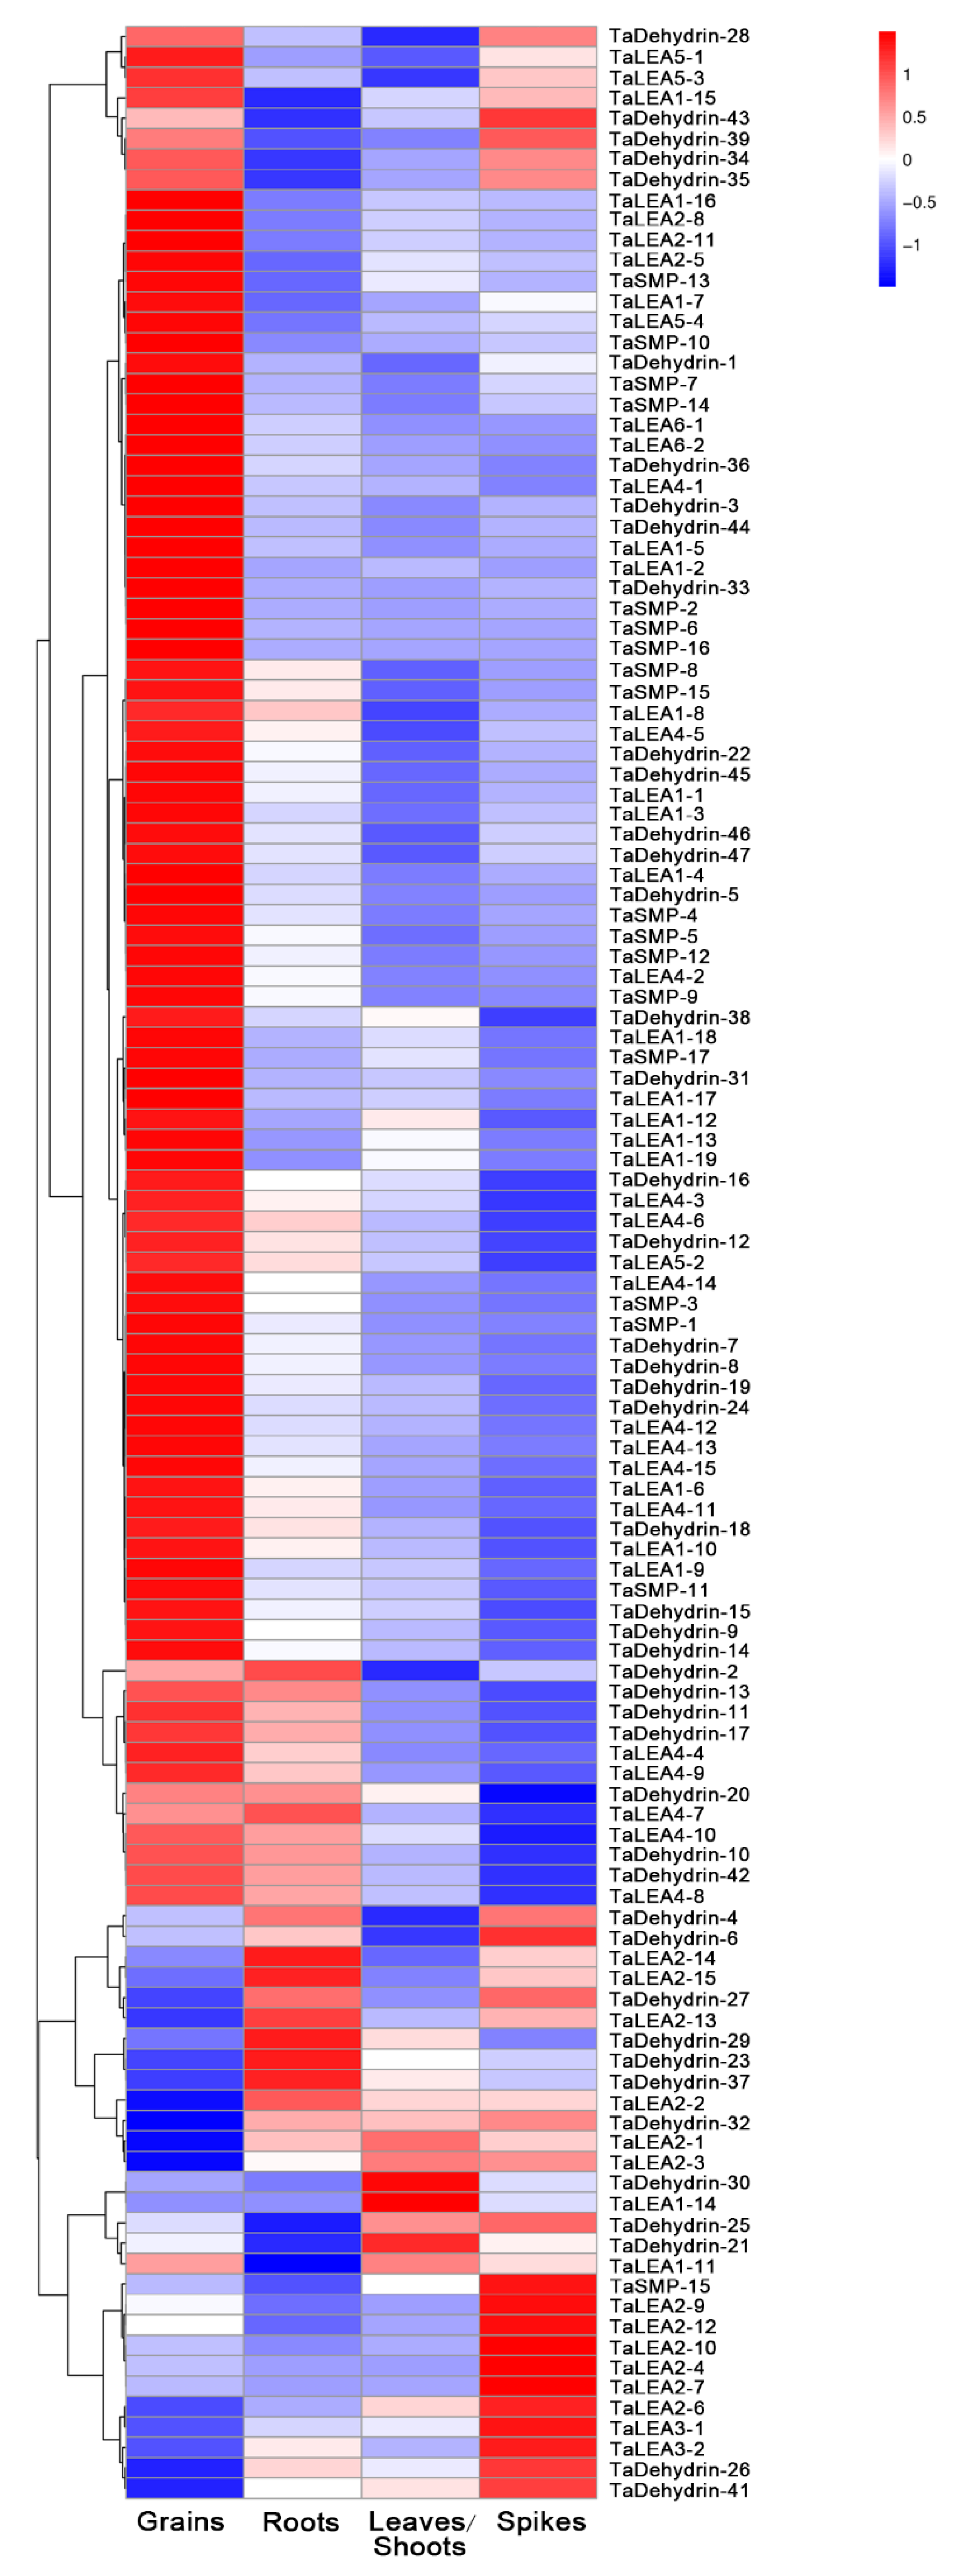
3.4. Expression Profile Analysis of Wheat LEA Genes in Different Tissues
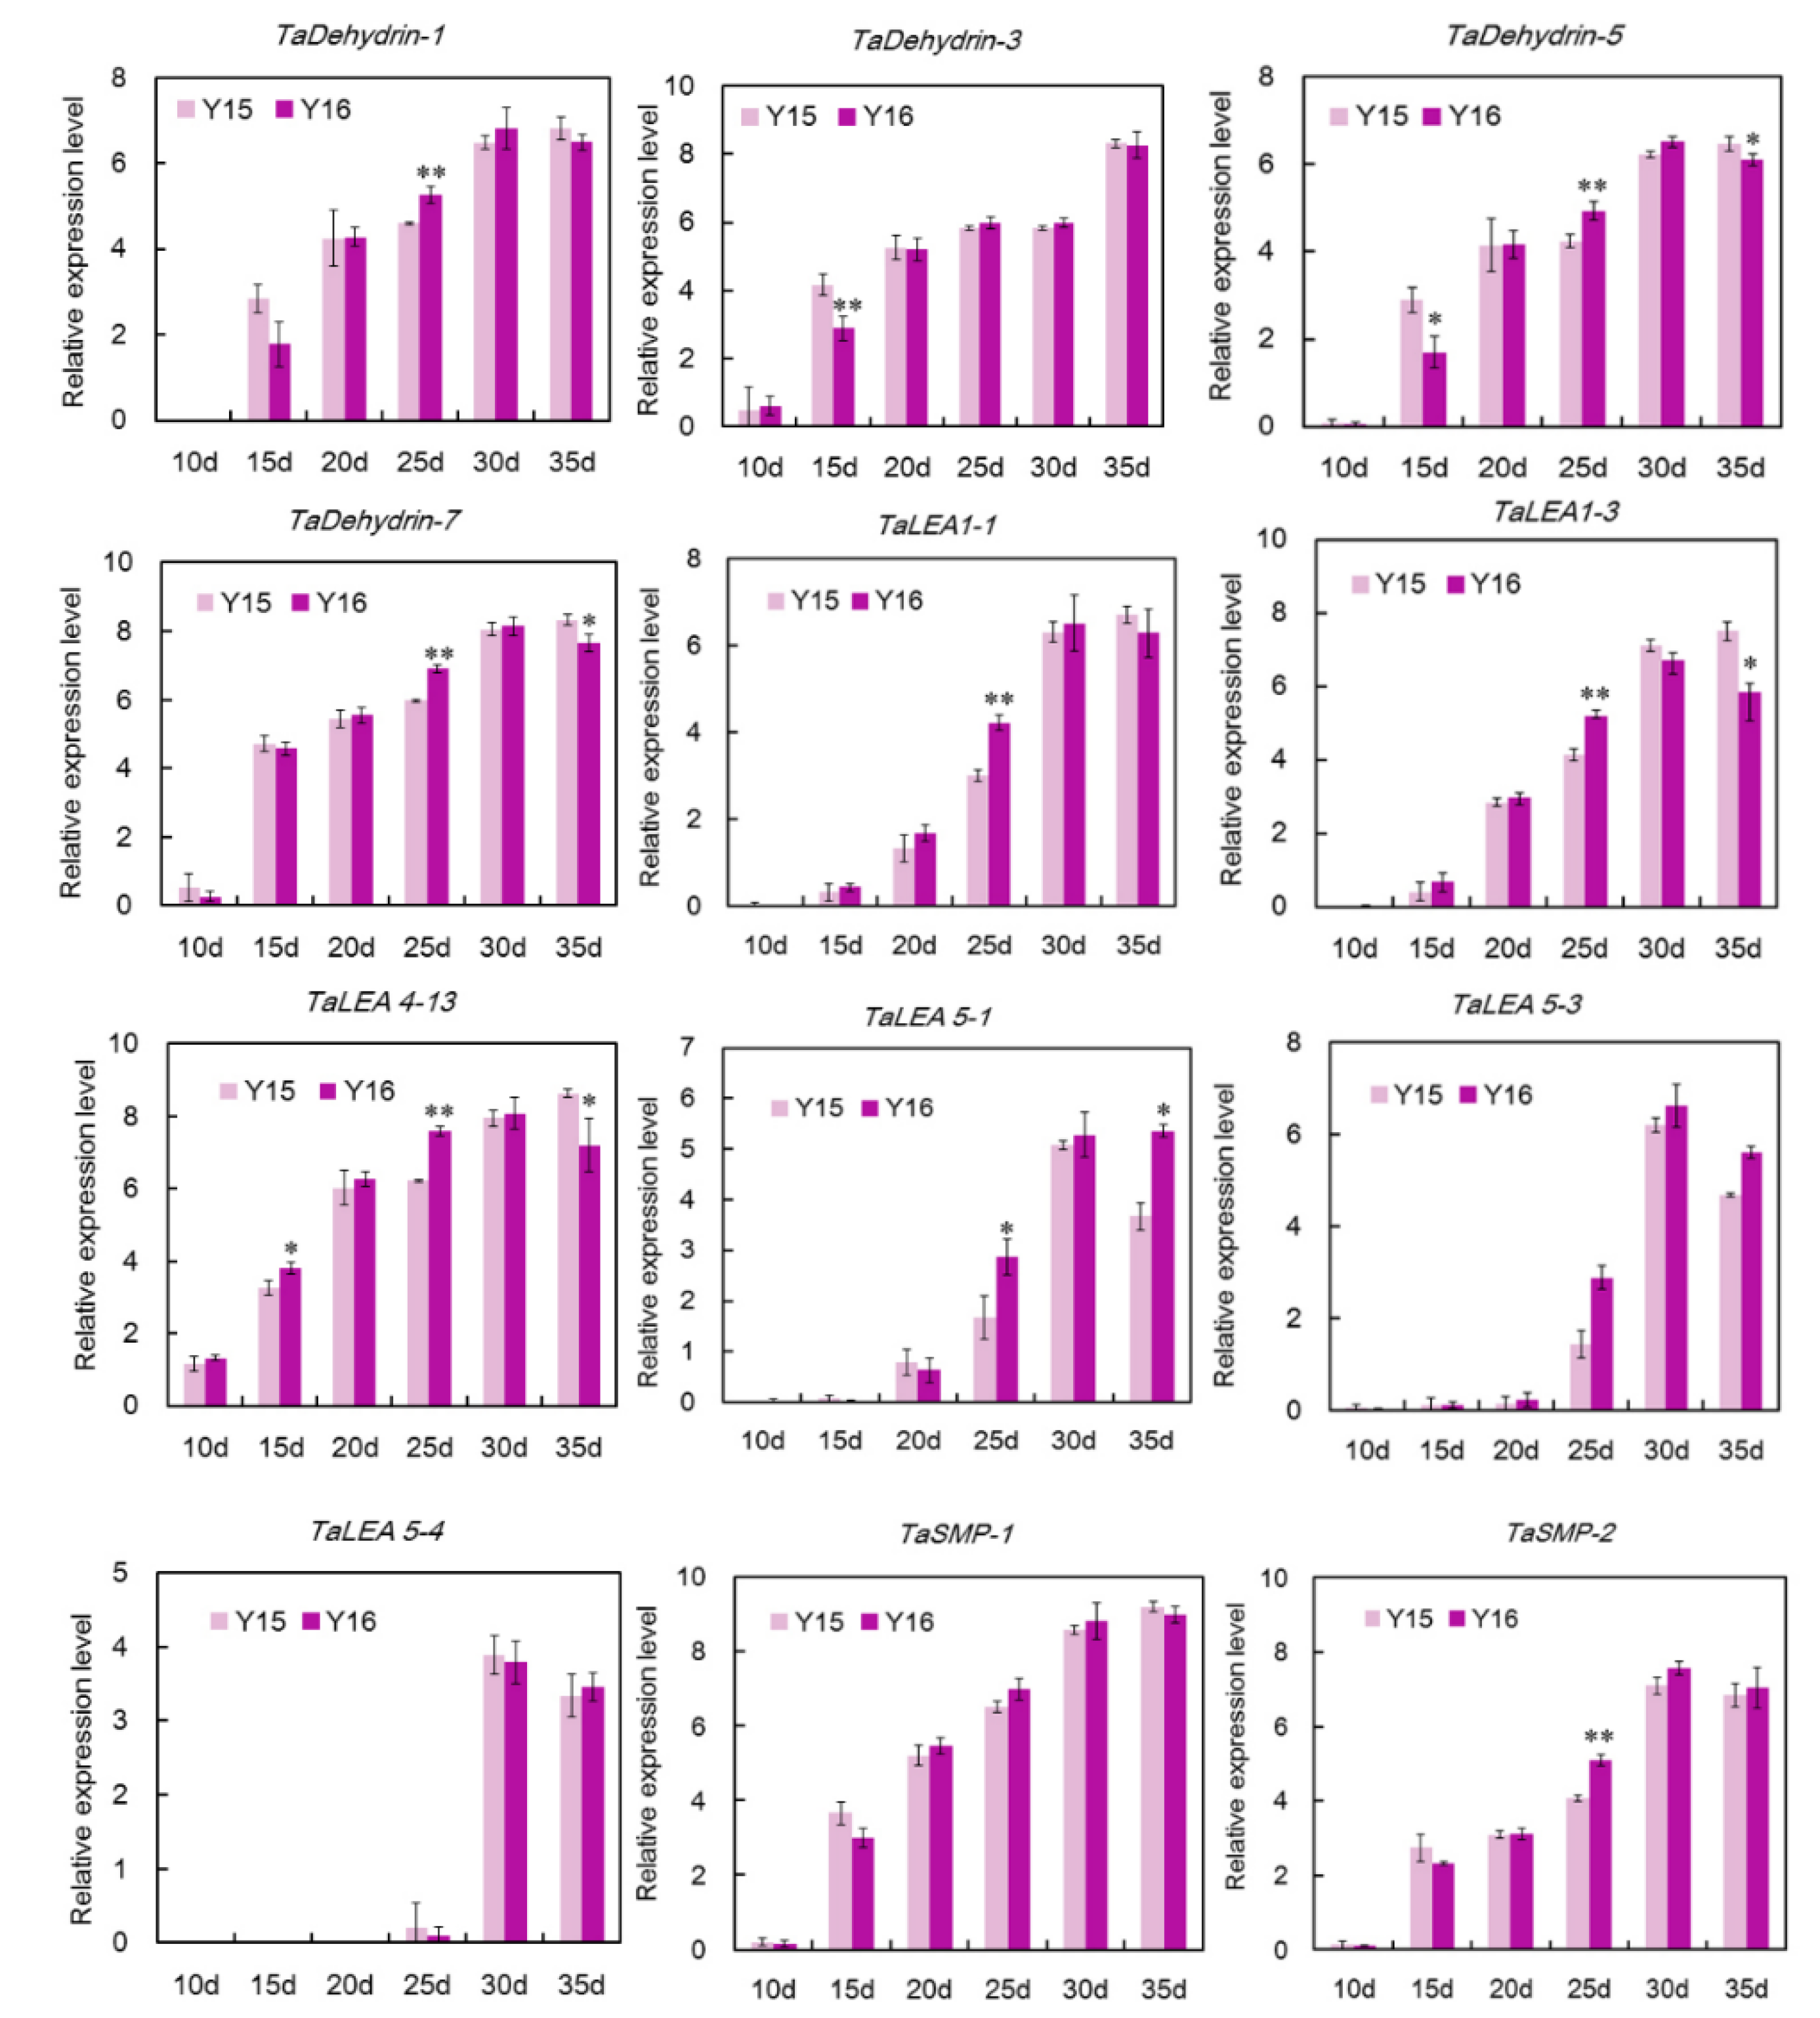
3.5. qRT-PCR Analysis of Wheat LEA Genes in the Grain Maturation of Two Different Cultivers
4. Discussion
4.1. Identification and Analysis of Wheat LEA Gene Family
4.2. Wheat Seed Desiccation and the Roles of TaLEA Genes in Acquirement of Desiccation Tolerance
Supplementary Materials
Author Contributions
Funding
Acknowledgments
Conflicts of Interest
References
- Dure, L.; Crouch, M.; Harada, J.; Ho, T.H.; Mundy, J.; Quatrano, R.; Thomas, T.; Sung, Z.R. Common amino acid sequence domains among the LEA proteins of higher plants. Plant Mol. Biol. 1989, 12, 475–486. [Google Scholar] [CrossRef] [PubMed]
- Olveracarrillo, Y.; Reyes, J.L.; Covarrubias, A.A. Late embryogenesis abundant proteins: Versatile players in the plant adaptation to water limiting environments. Plant Signal. Behav. 2011, 6, 586–589. [Google Scholar] [CrossRef] [PubMed]
- Finch-Savage, W.E.; Leubner-Metzger, G. Seed dormancy and the control of germination. New Phytol. 2006, 171, 501–523. [Google Scholar] [CrossRef] [PubMed]
- Angelovici, R.; Galili, G.; Fernie, A.R.; Fait, A. Seed desiccation: A bridge between maturation and germination. Trends Plant Sci. 2010, 15, 211–218. [Google Scholar] [CrossRef] [PubMed]
- Roberts, E.H. Predicting the storage life of seeds. Seed Sci. Technol. 1973, 1, 499–514. [Google Scholar]
- Manz, B.; Muller, K.; Kucera, B.; Volke, F.; Leubnermetzger, G. Water uptake and distribution in germinating tobacco seeds investigated in vivo by nuclear magnetic resonance imaging. Plant Physiol. 2005, 138, 1538–1551. [Google Scholar] [CrossRef] [PubMed]
- Dure, L.; Greenway, S.; Galau, G.A. Developmental biochemistry of cottonseed embryogenesis and germination: Changing messenger ribonucleic acid populations as shown by in vitro and in vivo protein synthesis. Biochemistry 1981, 20, 4162–4168. [Google Scholar] [CrossRef] [PubMed]
- Ingram, J.; Bartels, D. The molecular basis of dehydration tolerance in plants. Annu. Rev. Plant Physiol. Plant Mol. Biol. 1996, 47, 377–403. [Google Scholar] [CrossRef] [PubMed]
- Hundertmark, M.; Hincha, D.K. LEA (Late Embryogenesis Abundant) proteins and their encoding genes in Arabidopsis thaliana. BMC Genom. 2008, 9, 118–128. [Google Scholar] [CrossRef]
- Du, D.; Zhang, Q.; Cheng, T.; Pan, H.; Yang, W.; Sun, L. Genome-wide identification and analysis of late embryogenesis abundant (LEA) genes in Prunus mume. Mol. Biol. Rep. 2013, 40, 1937–1946. [Google Scholar] [CrossRef]
- Lim, J.; Lim, C.W.; Lee, S.C. The pepper Late Embryogenesis Abundant protein, CaDIL1, positively regulates drought tolerance and ABA signaling. Front. Plant Sci. 2018, 9, 1301. [Google Scholar] [CrossRef] [PubMed]
- Wang, W.; Gao, T.; Chen, J.; Yang, J.; Huang, H.; Yu, Y. The late embryogenesis abundant gene family in tea plant (Camellia sinensis): Genome-wide characterization and expression analysis in response to cold and dehydration stress. Plant Physiol. Biochem. 2019, 135, 277–286. [Google Scholar] [CrossRef] [PubMed]
- Chen, Y.; Li, C.; Zhang, B.; Yi, J.; Yang, Y.; Kong, C.; Lei, C.; Gong, M. The role of the Late Embryogenesis-Abundant (LEA) protein family in development and the abiotic stress response: A comprehensive expression analysis of potato (Solanum Tuberosum). Genes 2019, 10, 148. [Google Scholar] [CrossRef] [PubMed]
- Amara, I.; Odena, A.; De Oliveira, E.; Moreno, A.; Masmoudi, K.; Pages, M.; Goday, A. Insights into maize LEA proteins: From proteomics to functional approaches. Plant Cell Physiol. 2012, 53, 312–329. [Google Scholar] [CrossRef] [PubMed]
- Wang, X.; Zhu, H.; Jin, G.; Liu, H.; Wu, W.; Zhu, J. Genome-scale identification and analysis of LEA genes in rice (Oryza sativa L.). Plant Sci. 2007, 172, 414–420. [Google Scholar] [CrossRef]
- Cao, J.; Li, X. Identification and phylogenetic analysis of late embryogenesis abundant proteins family in tomato (Solanum lycopersicum). Planta 2015, 241, 757–772. [Google Scholar] [CrossRef] [PubMed]
- Ling, H.; Zeng, X.; Guo, S. Functional insights into the late embryogenesis abundant (LEA) protein family from Dendrobium officinale (Orchidaceae) using an Escherichia coli system. Sci. Rep. 2016, 6, 39693. [Google Scholar] [CrossRef]
- Liang, Y.; Xiong, Z.; Zheng, J.; Xu, D.; Zhu, Z.; Xiang, J.; Gan, J.; Raboanatahiry, N.; Yin, Y.; Li, M. Genome-wide identification, structural analysis and new insights into late embryogenesis abundant (LEA) gene family formation pattern in Brassica napus. Sci. Rep. 2016, 6, 24265. [Google Scholar] [CrossRef]
- Bojorquez-Velazquez, E.; Barrera-Pacheco, A.; Espitia-Rangel, E.; Herrera-Estrella, A.; Barba de la Rosa, A.P. Protein analysis reveals differential accumulation of late embryogenesis abundant and storage proteins in seeds of wild and cultivated amaranth species. BMC Plant Biol. 2019, 19, 59. [Google Scholar] [CrossRef]
- Hand, S.C.; Menze, M.A.; Toner, M.; Boswell, L.C.; Moore, D. LEA proteins during water stress: Not just for plants anymore. Annu. Rev. Physiol. 2011, 73, 115–134. [Google Scholar] [CrossRef]
- Battaglia, M.; Olveracarrillo, Y.; Garciarrubio, A.; Campos, F.; Covarrubias, A.A. The enigmatic LEA proteins and other hydrophilins. Plant Physiol. 2008, 148, 6–24. [Google Scholar] [CrossRef] [PubMed]
- Hincha, D.K.; Thalhammer, A. LEA proteins: IDPs with versatile functions in cellular dehydration tolerance. Biochem. Soc. Trans. 2012, 40, 1000–1003. [Google Scholar] [CrossRef] [PubMed] [Green Version]
- Hunault, G.; Jaspard, E. LEAPdb: A database for the late embryogenesis abundant proteins. BMC Genom. 2010, 11, 221. [Google Scholar] [CrossRef] [PubMed]
- Gonzalez, R.M.; Iusem, N.D. Twenty years of research on Asr (ABA-stress-ripening) genes and proteins. Planta 2014, 239, 941–949. [Google Scholar] [CrossRef] [PubMed]
- Wetzler, D.E.; Wightman, F.F.; Bucci, H.A.; Rinaldi, J.; Caramelo, J.J.; Iusem, N.D.; Ricardi, M.M. Conformational plasticity of the intrinsically disordered protein ASR1 modulates its function as a drought stress-responsive gene. PLoS ONE 2018, 13, e0202808. [Google Scholar] [CrossRef]
- Tunnacliffe, A.; Wise, M.J. The continuing conundrum of the LEA proteins. Naturwissenschaften 2007, 94, 791–812. [Google Scholar] [CrossRef] [PubMed]
- Ren, X.; Zhu, C.; Zeng, G. Current research of basic substances related to desiccation tolerance in seeds. Chin. Bull. Bot. 2001, 18, 183–189. [Google Scholar]
- Shinde, S.; Nurul Islam, M.; Ng, C.K. Dehydration stress-induced oscillations in LEA protein transcripts involves abscisic acid in the moss, Physcomitrella patens. New Phytol. 2012, 195, 321–328. [Google Scholar] [CrossRef]
- Duan, J.; Cai, W. OsLEA3-2, an abiotic stress induced gene of rice plays a key role in salt and drought tolerance. PLoS ONE 2012, 7, e45117. [Google Scholar] [CrossRef]
- Liu, Y.; Wang, L.; Xing, X.; Sun, L.; Pan, J.; Kong, X.; Zhang, M.; Li, D. ZmLEA3, a multifunctional group 3 LEA protein from Maize (Zea mays L.), is involved in biotic and abiotic stresses. Plant Cell Physiol. 2013, 54, 944–959. [Google Scholar] [CrossRef]
- Wang, M.; Li, P.; Li, C.; Pan, Y.; Jiang, X.; Zhu, D.; Zhao, Q.; Yu, J. SiLEA14, a novel atypical LEA protein, confers abiotic stress resistance in foxtail millet. BMC Plant Biol. 2014, 14, 290. [Google Scholar] [CrossRef] [PubMed]
- Sanchez-Garcia, M.; Alvaro, F.; Peremarti, A.; Trevaskis, B.; Martin-Sanchez, J.A.; Royo, C. Breeding effects on dry matter accumulation and partitioning in Spanish bread wheat during the 20th century. Euphytica 2015, 203, 321–336. [Google Scholar] [CrossRef]
- Meena, R.P.; Karnam, V.; Tripathi, S.C.; Jha, A.; Sharma, R.K.; Singh, G.P. Irrigation management strategies in wheat for efficient water use in the regions of depleting water resources. Agric. Water Manag. 2019, 214, 38–46. [Google Scholar] [CrossRef]
- Gao, D.; Zhang, X.; Kang, J.; Bie, T.; Zhang, B.; Zhang, X.; Cheng, S. Negative effect of late sowing on wheat production in middle and lower reaches of Yangtze river valley and breeding Strategies. J. Triticeae Crops 2014, 34, 279–283. [Google Scholar] [CrossRef]
- Wang, H.; Zhu, D.; Wang, J.; Chen, M.; Zhang, X.; Gao, D. Study on the early maturing characteristics of Yangmai 16 under late planting. J. Triticeae Crops 2016, 36, 1657–1666. [Google Scholar] [CrossRef]
- Pfeifer, M.; Kugler, K.G.; Sandve, S.R.; Zhan, B.; Rudi, H.; Hvidsten, T.R.; International Wheat Genome Sequencing Consortium; Mayer, K.F.X.; Olsen, O. Genome interplay in the grain transcriptome of hexaploid bread wheat. Science 2014, 345, 1250091. [Google Scholar] [CrossRef] [Green Version]
- Appels, R.; Eversole, K.; Stein, N.; Feuillet, C.; Keller, B.; Rogers, J.; Pozniak, C.J.; Choulet, F.; Distelfeld, A.; Poland, J.; et al. Shifting the limits in wheat research and breeding using a fully annotated reference genome. Science 2018, 361, eaar7191. [Google Scholar] [CrossRef]
- Alaux, M.; Rogers, J.; Letellier, T.; Flores, R.; Alfama, F.; Pommier, C.; Mohellibi, N.; Durand, S.; Kimmel, E.; Michotey, C.; et al. Linking the international wheat genome sequencing consortium bread wheat reference genome sequence to wheat genetic and phenomic data. Genome Biol. 2018, 19, 111. [Google Scholar] [CrossRef]
- Ramirez-Gonzalez, R.H.; Borrill, P.; Lang, D.; Harrington, S.A.; Brinton, J.; Venturini, L.; Davey, M.; Jacobs, J.; van Ex, F.; Pasha, A.; et al. The transcriptional landscape of polyploid wheat. Science 2018, 361, eaar6089. [Google Scholar] [CrossRef] [Green Version]
- Xu, L.; Tang, Y.; Gao, S.; Su, S.; Hong, L.; Wang, W.; Fang, Z.; Li, X.; Ma, J.; Quan, W.; et al. Comprehensive analyses of the annexin gene family in wheat. BMC Genom. 2016, 17, 415. [Google Scholar] [CrossRef]
- Qiao, L.; Zhang, X.; Han, X.; Zhang, L.; Li, X.; Zhan, H.; Ma, J.; Luo, P.; Zhang, W.; Cui, L.; et al. A genome-wide analysis of the auxin/indole-3-acetic acid gene family in hexaploid bread wheat (Triticum aestivum L.). Front. Plant Sci. 2015, 6, 770. [Google Scholar] [CrossRef] [PubMed]
- Yue, H.; Shu, D.; Wang, M.; Xing, G.; Zhan, H.; Du, X.; Song, W.; Nie, X. Genome-wide identification and expression analysis of the HD-Zip gene family in wheat (Triticum aestivum L.). Genes 2018, 9, 70. [Google Scholar] [CrossRef] [PubMed]
- Kumar, S.; Stecher, G.; Tamura, K. MEGA7: Molecular Evolutionary Genetics Analysis version 7.0 for bigger datasets. Mol. Biol. Evol. 2016, 33, 1870–1874. [Google Scholar] [CrossRef] [PubMed]
- Huidong, M. Logistic equation and its application. J. Jingsu Agric. Coll. 1983, 4, 53–57. [Google Scholar] [CrossRef]
- Seber, G.; Wild, C. Nonlinear Regression. Chaper 7: Growth Model; Wiley: New York, NY, USA, 1989; pp. 325–365. [Google Scholar]
- Schlueter, J.A.; Dixon, P.; Granger, C.; Grant, D.; Clark, L.; Doyle, J.J.; Shoemaker, R.C. Mining EST databases to resolve evolutionary events in major crop species. Genome 2004, 47, 868–876. [Google Scholar] [CrossRef] [Green Version]
- Blanc, G.; Barakat, A.; Guyot, R.; Cooke, R.; Delseny, M. Extensive duplication and reshuffling in the Arabidopsis genome. Plant Cell 2000, 12, 1093–1101. [Google Scholar] [CrossRef] [PubMed]
- Wang, X.; Shi, X.; Hao, B.; Ge, S.; Luo, J. Duplication and DNA segmental loss in the rice genome: implications for diploidization. New Phytol. 2005, 165, 937–946. [Google Scholar] [CrossRef]
- Blanc, G.; Wolfe, K.H. Widespread paleopolyploidy in model plant species inferred from age distributions of duplicate genes. Plant Cell 2004, 16, 1667–1678. [Google Scholar] [CrossRef]
- Li, L.; Xu, H.; Yang, X.; Li, Y.; Hu, Y. Genome-wide identification, classification and expression analysis of LEA gene family in soybean. Sci. Agric. Sin. 2011, 44, 3945–3954. [Google Scholar] [CrossRef]
- Li, X.; Cao, J. Late Embryogenesis Abundant (LEA) gene family in maize: Identification, evolution, and expression profiles. Plant Mol. Biol. Report. 2016, 34, 15–28. [Google Scholar] [CrossRef]
- Zhaxybayeva, O.; Gogarten, J.P. Spliceosomal introns: New insights into their evolution. Curr. Biol. 2003, 13, R764–R766. [Google Scholar] [CrossRef] [PubMed]
- Jeffares, D.C.; Penkett, C.J.; Bahler, J. Rapidly regulated genes are intron poor. Trends Genet. 2008, 24, 375–378. [Google Scholar] [CrossRef] [PubMed]
- Tian, W.; Guo, Q.; Li, Z.; Ding, N.; Zhang, S.; Wen, S. Genome-wide identification and expression analysis in the heat stress of the DREB transcription factor family in bread wheat (Triticum aestivum L.). J. Triticeae Crops 2018, 38, 1146–1156. [Google Scholar] [CrossRef]
- Shu, Y.; Liu, Y.; Zhang, J.; Song, L.; Guo, C. Genome-wide analysis of the AP2/ERF superfamily genes and their responses to abiotic stress in Medicago truncatula. Front. Plant Sci. 2015, 6, 1247. [Google Scholar] [CrossRef]
- Leprince, O.; Pellizzaro, A.; Berriri, S.; Buitink, J. Late seed maturation: Drying without dying. J. Exp. Bot. 2016, 68, 827–841. [Google Scholar] [CrossRef] [PubMed]
- Wang, Y.; Xu, H.; Zhu, H.; Tao, Y.; Zhang, G.; Zhang, L.; Zhang, C.; Zhang, Z.; Ma, Z. Classification and expression diversification of wheat dehydrin genes. Plant Sci. 2014, 214, 113–120. [Google Scholar] [CrossRef]
- Finch-Savage, W.E.; Bassel, G.W. Seed vigour and crop establishment: Extending performance beyond adaptation. J. Exp. Bot. 2016, 67, 567–591. [Google Scholar] [CrossRef]
- Nadaud, I.; Girousse, C.; Debiton, C.; Chambon, C.; Bouzidi, M.F.; Martre, P.; Branlard, G. Proteomic and morphological analysis of early stages of wheat grain development. Proteomics 2010, 10, 2901–2910. [Google Scholar] [CrossRef]
- Shewry, P.R.; Mitchell, R.A.C.; Tosi, P.; Wan, Y.; Underwood, C.; Lovegrove, A.; Freeman, J.; Toole, G.A.; Mills, E.N.C.; Ward, J.L. An integrated study of grain development of wheat (cv. Hereward). J. Cereal Sci. 2012, 56, 21–30. [Google Scholar] [CrossRef]
- Dong, K.; Zhen, S.; Cheng, Z.; Cao, H.; Ge, P.; Yan, Y. Proteomic analysis reveals key proteins and phosphoproteins upon seed germination of wheat (Triticum aestivum L.). Front. Plant Sci. 2015, 6, 1017. [Google Scholar] [CrossRef]
- Xiao, B.; Huang, Y.; Tang, N.; Xiong, L. Over-expression of a LEA gene in rice improves drought resistance under the field conditions. Theor. Appl. Genet. 2007, 115, 35–46. [Google Scholar] [CrossRef]
- Xu, D.; Duan, X.; Wang, B.; Hong, B.; Ho, T.; Wu, R. Expression of a late embryogenesis abundant protein gene, HVA1, from barley confers tolerance to water deficit and salt stress in transgenic rice. Plant Physiol. 1996, 110, 249–257. [Google Scholar] [CrossRef] [PubMed]
- Olvera-Carrillo, Y.; Campos, F.; Reyes, J.L.; Garciarrubio, A.; Covarrubias, A.A. Functional analysis of the group 4 Late Embryogenesis Abundant proteins reveals their relevance in the adaptive response during water deficit in Arabidopsis. Plant Physiol. 2010, 154, 373–390. [Google Scholar] [CrossRef]
- Garnczarska, M.; Zalewski, T.; Kempka, M. Changes in water status and water distribution in maturing lupin seeds studied by MR imaging and NMR spectroscopy. J. Exp. Bot. 2007, 58, 3961–3969. [Google Scholar] [CrossRef] [PubMed] [Green Version]
- Garnczarska, M.; Zalewski, T.; Wojtyla, L. A comparative study of water distribution and dehydrin protein localization in maturing pea seeds. J. Plant Physiol. 2008, 165, 1940–1946. [Google Scholar] [CrossRef] [PubMed]
- Song, S.; Fu, J. Role of maturation drying in seed development and germination. Chin. Bull. Bot. 1998, 15, 23–32. [Google Scholar]


| Gene_Name | Gene_ID | Amino Acid Number | MW | pI | Instability Index | Aliphatic Index | GRAVY |
|---|---|---|---|---|---|---|---|
| TaDehydrin-1 | TraesCS3A02G254600 | 213 | 21,831.76 | 6.25 | 35.63 | 46.76 | −0.83 |
| TaDehydrin-10 | TraesCS5A02G369800 | 143 | 14,570.81 | 8 | 34.57 | 36.36 | −1.151 |
| TaDehydrin-11 | TraesCS5A02G369900 | 140 | 14,240.47 | 8.01 | 38 | 39.86 | −1.083 |
| TaDehydrin-12 | TraesCS5A02G424800 | 149 | 15,217.65 | 9.33 | 25.94 | 32.21 | −1.087 |
| TaDehydrin-13 | TraesCS5B02G372100 | 143 | 14,429.64 | 8 | 34.24 | 35.66 | −1.118 |
| TaDehydrin-14 | TraesCS5B02G372200 | 138 | 14,218.46 | 8.01 | 38.03 | 38.99 | −1.104 |
| TaDehydrin-15 | TraesCS5B02G426700 | 150 | 15,176.65 | 9.52 | 31.65 | 34.6 | −1.062 |
| TaDehydrin-16 | TraesCS5B02G426800 | 150 | 15,221.65 | 9.36 | 24.14 | 32 | −1.063 |
| TaDehydrin-17 | TraesCS5D02G379200 | 143 | 14,515.73 | 7.11 | 33.97 | 36.99 | −1.123 |
| TaDehydrin-18 | TraesCS5D02G379300 | 133 | 13,930.2 | 8.81 | 40.1 | 38.95 | −1.189 |
| TaDehydrin-19 | TraesCS5D02G433200 | 152 | 15,345.79 | 9.52 | 27.66 | 32.24 | −1.05 |
| TaDehydrin-2 | TraesCS3A02G396200 | 275 | 27,016.77 | 9.6 | 26.32 | 37.13 | −0.775 |
| TaDehydrin-20 | TraesCS5D02G433300 | 154 | 15,587.09 | 9.52 | 25.9 | 31.17 | −1.024 |
| TaDehydrin-21 | TraesCS5D02G519300LC | 266 | 28,166.53 | 9.76 | 46.85 | 52.93 | −0.803 |
| TaDehydrin-22 | TraesCS6A02G059800 | 153 | 15,511.87 | 8.84 | 37 | 39.08 | −1.041 |
| TaDehydrin-23 | TraesCS6A02G253300 | 268 | 28,823.05 | 5.25 | 56.43 | 63.73 | −0.997 |
| TaDehydrin-24 | TraesCS6A02G350500 | 221 | 22,048.66 | 9.05 | 7.59 | 23.48 | −1.071 |
| TaDehydrin-25 | TraesCS6A02G350600 | 162 | 16,284.68 | 9.22 | 17.14 | 38.02 | −0.994 |
| TaDehydrin-26 | TraesCS6A02G350700 | 152 | 15,522.71 | 7.17 | 27.53 | 31.51 | −1.176 |
| TaDehydrin-27 | TraesCS6A02G350800 | 143 | 14,815.21 | 9.22 | 37.6 | 36.36 | −1.012 |
| TaDehydrin-28 | TraesCS6A02G350900 | 190 | 20,142.87 | 10.74 | 50.46 | 35.63 | −1.274 |
| TaDehydrin-29 | TraesCS6B02G273400 | 259 | 27,973.07 | 5.2 | 57.39 | 62.93 | −1.054 |
| TaDehydrin-3 | TraesCS3B02G286600 | 217 | 22,297.38 | 6.87 | 35.47 | 47.7 | −0.856 |
| TaDehydrin-30 | TraesCS6B02G383200 | 405 | 40,293.09 | 6.83 | -0.26 | 29.98 | −1.064 |
| TaDehydrin-31 | TraesCS6B02G383500 | 231 | 23,229.05 | 9.22 | 2.83 | 23.25 | −1.074 |
| TaDehydrin-32 | TraesCS6B02G383600 | 158 | 15,838.17 | 9.13 | 23.2 | 34.11 | −1.041 |
| TaDehydrin-33 | TraesCS6B02G383800 | 166 | 16,704.04 | 8.05 | 17.71 | 33.01 | −1.054 |
| TaDehydrin-34 | TraesCS6B02G695700LC | 162 | 16,127.46 | 9.19 | 13.99 | 35 | −0.983 |
| TaDehydrin-35 | TraesCS6B02G695800LC | 162 | 16,127.46 | 9.19 | 13.99 | 35 | −0.983 |
| TaDehydrin-36 | TraesCS6B02G695900LC | 162 | 16,097.44 | 9.19 | 14.98 | 35.62 | −0.968 |
| TaDehydrin-37 | TraesCS6D02G234700 | 262 | 28,155.2 | 5.19 | 57.34 | 61.83 | −1.051 |
| TaDehydrin-38 | TraesCS6D02G332900 | 231 | 23,020.75 | 9.05 | 6.9 | 24.16 | −1.028 |
| TaDehydrin-39 | TraesCS6D02G333000 | 162 | 16,195.51 | 8.05 | 14.92 | 33.21 | −1.019 |
| TaDehydrin-4 | TraesCS3B02G428200 | 274 | 27,193.96 | 9.74 | 24.64 | 34.34 | −0.859 |
| TaDehydrin-40 | TraesCS6D02G333100 | 144 | 14,512.72 | 9.19 | 15.79 | 33.96 | −1.076 |
| TaDehydrin-41 | TraesCS6D02G333200 | 155 | 15,729 | 8.83 | 26.81 | 34.06 | −1.125 |
| TaDehydrin-42 | TraesCS6D02G333300 | 160 | 16,255.59 | 8.07 | 21.61 | 39.81 | −1.05 |
| TaDehydrin-43 | TraesCS6D02G333600 | 167 | 16,712.02 | 7.17 | 14.3 | 31.08 | −1.062 |
| TaDehydrin-44 | TraesCSU02G086200 | 151 | 15,288.66 | 9.1 | 38.15 | 42.19 | −1.011 |
| TaDehydrin-45 | TraesCSU02G122200 | 149 | 14,855.02 | 6.86 | 33.61 | 40.13 | −0.947 |
| TaDehydrin-46 | TraesCSU02G564500LC | 130 | 12,865.8 | 9.05 | 25.25 | 32.38 | −0.968 |
| TaDehydrin-47 | TraesCSU02G656800LC | 130 | 12,865.8 | 9.05 | 25.25 | 32.38 | −0.968 |
| TaDehydrin-5 | TraesCS3D02G255500 | 215 | 22,243.3 | 6.63 | 37.53 | 44.51 | −0.912 |
| TaDehydrin-6 | TraesCS3D02G390200 | 275 | 27,156.85 | 9.7 | 23.91 | 34.58 | −0.855 |
| TaDehydrin-7 | TraesCS4A02G250900 | 455 | 43,740.8 | 8.84 | -6.02 | 31.38 | −0.779 |
| TaDehydrin-8 | TraesCS4B02G064200 | 457 | 43,891.98 | 8.84 | -3.84 | 32.74 | −0.741 |
| TaDehydrin-9 | TraesCS4D02G063100 | 430 | 41,223.14 | 9.04 | 0.85 | 31.65 | −0.773 |
| TaLEA1-1 | TraesCS2A02G449700 | 110 | 11,589.91 | 9.4 | 32.94 | 39.45 | −1.056 |
| TaLEA1-10 | TraesCS5D02G177300 | 146 | 14,589.98 | 7.11 | 25.53 | 57.81 | −0.588 |
| TaLEA1-11 | TraesCS6B02G244900 | 102 | 10,650.63 | 8.06 | 34.58 | 42.55 | −1.089 |
| TaLEA1-12 | TraesCS7A02G030100 | 131 | 13,910.81 | 9.87 | 39.53 | 54.66 | −0.852 |
| TaLEA1-13 | TraesCS7A02G030300 | 115 | 12,294.95 | 9.84 | 38.36 | 58 | −0.886 |
| TaLEA1-14 | TraesCS7A02G042500 | 175 | 19,508.1 | 10.39 | 47.89 | 52.23 | −1.061 |
| TaLEA1-15 | TraesCS7A02G439200 | 147 | 14,483 | 9.13 | 30.34 | 57.48 | −0.453 |
| TaLEA1-16 | TraesCS7B02G337800 | 147 | 14,522.94 | 8.93 | 30.4 | 51.5 | −0.555 |
| TaLEA1-17 | TraesCS7D02G026300 | 119 | 12,561.2 | 9.84 | 33.94 | 56.13 | −0.845 |
| TaLEA1-18 | TraesCS7D02G026400 | 115 | 12,306.88 | 9.94 | 29.52 | 52.96 | −0.95 |
| TaLEA1-19 | TraesCS7D02G428800 | 169 | 16,768.61 | 9.56 | 24.28 | 55.86 | −0.442 |
| TaLEA1-2 | TraesCS2A02G449800 | 110 | 11,406.59 | 9.19 | 15.59 | 36.82 | −1.047 |
| TaLEA1-3 | TraesCS2B02G471500 | 110 | 11,481.72 | 8.69 | 28.51 | 39.45 | −0.993 |
| TaLEA1-4 | TraesCS2B02G471600 | 120 | 12,363.79 | 9.58 | 25.19 | 37.83 | −0.96 |
| TaLEA1-5 | TraesCS2D02G449200 | 226 | 24,041.95 | 10.1 | 51.53 | 45.66 | −0.828 |
| TaLEA1-6 | TraesCS2D02G449300 | 116 | 12,059.47 | 9.58 | 21.73 | 40.78 | −0.975 |
| TaLEA1-7 | TraesCS4A02G459700 | 169 | 18,344.61 | 10.03 | 45.86 | 55.15 | −0.931 |
| TaLEA1-8 | TraesCS5A02G172800 | 146 | 14,712.07 | 6.71 | 25.02 | 53.15 | −0.634 |
| TaLEA1-9 | TraesCS5B02G170200 | 143 | 14,466.79 | 6.65 | 24.27 | 54.34 | −0.645 |
| TaLEA2-1 | TraesCS1A02G423800 | 163 | 17,826.52 | 5.03 | 14.94 | 89.75 | −0.069 |
| TaLEA2-10 | TraesCS3D02G091400 | 305 | 33,630.14 | 4.65 | 28.86 | 92.98 | −0.329 |
| TaLEA2-11 | TraesCS3D02G158600 | 151 | 16,272.66 | 4.78 | 14.24 | 93.58 | −0.068 |
| TaLEA2-12 | TraesCS3D02G227800 | 181 | 19,544.98 | 4.29 | 26.07 | 80.17 | −0.173 |
| TaLEA2-13 | TraesCS4A02G343300 | 333 | 36,961.06 | 5.09 | 23.57 | 90.66 | −0.393 |
| TaLEA2-14 | TraesCS5B02G531400 | 361 | 40,184.79 | 4.96 | 28.8 | 95.76 | −0.288 |
| TaLEA2-15 | TraesCS5D02G529700 | 326 | 36,210.08 | 4.9 | 28.44 | 91.13 | −0.406 |
| TaLEA2-2 | TraesCS1B02G455900 | 163 | 17,748.48 | 5.17 | 17.63 | 92.76 | −0.022 |
| TaLEA2-3 | TraesCS1D02G432400 | 163 | 17,808.55 | 5.05 | 15.34 | 90.98 | −0.037 |
| TaLEA2-4 | TraesCS3A02G091500 | 305 | 33,629.19 | 4.65 | 24.8 | 94.89 | −0.297 |
| TaLEA2-5 | TraesCS3A02G150800 | 151 | 16,254.62 | 4.78 | 11.33 | 96.16 | −0.055 |
| TaLEA2-6 | TraesCS3A02G225600 | 186 | 19,778.21 | 4.37 | 28.98 | 76.45 | −0.165 |
| TaLEA2-7 | TraesCS3B02G106700 | 305 | 33,625.18 | 4.68 | 26.92 | 92.66 | −0.343 |
| TaLEA2-8 | TraesCS3B02G240900LC | 162 | 17,614.16 | 5.68 | 23.58 | 90.25 | −0.199 |
| TaLEA2-9 | TraesCS3B02G255100 | 181 | 19,458.89 | 4.33 | 26.15 | 79.12 | −0.169 |
| TaLEA3-1 | TraesCS1B02G243600 | 115 | 12,671.65 | 9.18 | 54.99 | 73.91 | −0.42 |
| TaLEA3-2 | TraesCS7D02G389300 | 99 | 10,643.23 | 10.11 | 52.88 | 76.26 | −0.167 |
| TaLEA4-1 | TraesCS1A02G364000 | 224 | 23,196.17 | 8.81 | 22.88 | 37.46 | −1.118 |
| TaLEA4-10 | TraesCS1D02G369800 | 214 | 21,965.87 | 8.89 | 8.45 | 43.74 | −0.95 |
| TaLEA4-11 | TraesCS3A02G188700 | 396 | 42,151.23 | 5.06 | 40.57 | 45.88 | −0.962 |
| TaLEA4-12 | TraesCS3D02G192100 | 407 | 43,198.53 | 5.42 | 36.92 | 43 | −0.963 |
| TaLEA4-13 | TraesCS4A02G129100 | 351 | 37,340.93 | 6.5 | 20.4 | 47.04 | −1.007 |
| TaLEA4-14 | TraesCS4B02G175600 | 363 | 38,561.24 | 6.7 | 18.15 | 46.86 | −1.031 |
| TaLEA4-15 | TraesCS4D02G177500 | 352 | 37,457.1 | 6.44 | 20.76 | 49.12 | −0.97 |
| TaLEA4-2 | TraesCS1A02G364100 | 163 | 17,097.7 | 9.16 | 48.51 | 41.66 | −1.045 |
| TaLEA4-3 | TraesCS1B02G381200 | 212 | 21,896.87 | 9.02 | 21.71 | 36.75 | −1.096 |
| TaLEA4-4 | TraesCS1B02G381400 | 178 | 18,146.72 | 8.63 | 23.16 | 42.64 | −0.954 |
| TaLEA4-5 | TraesCS1B02G381500 | 169 | 17,528 | 5.95 | 25.29 | 41.95 | −1.009 |
| TaLEA4-6 | TraesCS1D02G369200 | 220 | 22,708.72 | 9 | 21.62 | 36.82 | −1.108 |
| TaLEA4-7 | TraesCS1D02G369300 | 163 | 16,930.39 | 6.62 | 26.37 | 39.26 | −1.026 |
| TaLEA4-8 | TraesCS1D02G369400 | 180 | 18,788.43 | 5.99 | 28.19 | 40.5 | −1.046 |
| TaLEA4-9 | TraesCS1D02G369500 | 180 | 18,740.37 | 5.99 | 23.35 | 42.67 | −1.029 |
| TaLEA5-1 | TraesCS1B02G237400 | 153 | 16,878.38 | 5.57 | 37.06 | 33.2 | −1.539 |
| TaLEA5-2 | TraesCS1B02G436600LC | 113 | 12,029.24 | 5.53 | 41.95 | 51.06 | −0.962 |
| TaLEA5-3 | TraesCS1D02G225800 | 153 | 16,771.27 | 5.47 | 39.18 | 33.2 | −1.503 |
| TaLEA5-4 | TraesCS3B02G166400 | 124 | 13,694.2 | 5.17 | 54.16 | 61.45 | −1.308 |
| TaLEA6-1 | TraesCS5A02G258900 | 121 | 12,844.87 | 5.44 | 44.66 | 51.74 | −1.065 |
| TaLEA6-2 | TraesCS5B02G257700 | 118 | 12,534.6 | 5.67 | 42.9 | 48.9 | −1.044 |
| TaSMP-1 | TraesCS4A02G030600 | 272 | 27,106.72 | 4.72 | 35.79 | 70.59 | −0.336 |
| TaSMP-10 | TraesCS5B02G390600 | 266 | 27,101.21 | 5.15 | 38.24 | 77.56 | −0.316 |
| TaSMP-11 | TraesCS5B02G390800 | 185 | 18,756.74 | 4.69 | 20.34 | 75.24 | −0.248 |
| TaSMP-12 | TraesCS5D02G026500 | 224 | 22,869.26 | 5.2 | 52.2 | 70.36 | −0.442 |
| TaSMP-13 | TraesCS5D02G395600 | 266 | 27,028.16 | 5.04 | 38.1 | 79.4 | −0.273 |
| TaSMP-14 | TraesCS5D02G395700 | 185 | 18,795.83 | 5.12 | 25.34 | 74.76 | −0.258 |
| TaSMP-15 | TraesCS7A02G333100 | 277 | 28,312.94 | 4.18 | 23.46 | 70.04 | −0.32 |
| TaSMP-16 | TraesCS7B02G244300 | 275 | 28,060.67 | 4.19 | 22.74 | 69.49 | −0.308 |
| TaSMP-17 | TraesCS7D02G340400 | 275 | 28,179.74 | 4.19 | 20.55 | 68.76 | −0.349 |
| TaSMP-2 | TraesCS4A02G030700 | 284 | 28,955.83 | 4.78 | 36.11 | 70 | −0.412 |
| TaSMP-3 | TraesCS4B02G275300 | 272 | 27,037.57 | 4.65 | 34.14 | 69.89 | −0.355 |
| TaSMP-4 | TraesCS4D02G273900 | 303 | 30,498.73 | 5.23 | 40.31 | 73.07 | −0.305 |
| TaSMP-5 | TraesCS5A02G021400 | 220 | 22,346.74 | 5.31 | 50.58 | 71.64 | −0.376 |
| TaSMP-6 | TraesCS5A02G385600 | 266 | 27,030.13 | 5.06 | 36.78 | 77.56 | −0.306 |
| TaSMP-7 | TraesCS5A02G385700 | 185 | 18,762.78 | 5.21 | 21.47 | 74.16 | −0.255 |
| TaSMP-8 | TraesCS5B02G018300 | 225 | 22,887.23 | 5.31 | 52.92 | 70.93 | −0.424 |
| TaSMP-9 | TraesCS5B02G018900 | 224 | 23,131.59 | 5.17 | 43.42 | 72.1 | −0.45 |
© 2019 by the authors. Licensee MDPI, Basel, Switzerland. This article is an open access article distributed under the terms and conditions of the Creative Commons Attribution (CC BY) license (http://creativecommons.org/licenses/by/4.0/).
Share and Cite
Liu, D.; Sun, J.; Zhu, D.; Lyu, G.; Zhang, C.; Liu, J.; Wang, H.; Zhang, X.; Gao, D. Genome-Wide Identification and Expression Profiles of Late Embryogenesis-Abundant (LEA) Genes during Grain Maturation in Wheat (Triticum aestivum L.). Genes 2019, 10, 696. https://0-doi-org.brum.beds.ac.uk/10.3390/genes10090696
Liu D, Sun J, Zhu D, Lyu G, Zhang C, Liu J, Wang H, Zhang X, Gao D. Genome-Wide Identification and Expression Profiles of Late Embryogenesis-Abundant (LEA) Genes during Grain Maturation in Wheat (Triticum aestivum L.). Genes. 2019; 10(9):696. https://0-doi-org.brum.beds.ac.uk/10.3390/genes10090696
Chicago/Turabian StyleLiu, Datong, Jing Sun, Dongmei Zhu, Guofeng Lyu, Chunmei Zhang, Jian Liu, Hui Wang, Xiao Zhang, and Derong Gao. 2019. "Genome-Wide Identification and Expression Profiles of Late Embryogenesis-Abundant (LEA) Genes during Grain Maturation in Wheat (Triticum aestivum L.)" Genes 10, no. 9: 696. https://0-doi-org.brum.beds.ac.uk/10.3390/genes10090696