Article

Down Regulation and Loss of Auxin Response Factor 4 Function Using CRISPR/Cas9 Alters Plant Growth, Stomatal Function and Improves Tomato Tolerance to Salinity and Osmotic Stress

1
Laboratoire de Biotechnologie et Physiologie Végétales, Centre de biotechnologie végétale et microbienne biodiversité et environnement, Faculté des Sciences, Université Mohammed V de Rabat, Rabat 1014, Morocco
2
GBF, Université de Toulouse, INRA, 31326 Castanet-Tolosan, France
3
Departamento de Biologia Vegetal, Universidade Federal de Viçosa, Viçosa 36570-900, Brazil
*
Authors to whom correspondence should be addressed.
These authors contributed equally to this work.
Submission received: 23 December 2019 / Revised: 23 February 2020 / Accepted: 28 February 2020 / Published: 3 March 2020
(This article belongs to the Special Issue TILLING and CRISPR to design the varieties of tomorrow)

Abstract

:
Auxin controls multiple aspects of plant growth and development. However, its role in stress responses remains poorly understood. Auxin acts on the transcriptional regulation of target genes, mainly through Auxin Response Factors (ARF). This study focuses on the involvement of SlARF4 in tomato tolerance to salinity and osmotic stress. Using a reverse genetic approach, we found that the antisense down-regulation of SlARF4 promotes root development and density, increases soluble sugars content and maintains chlorophyll content at high levels under stress conditions. Furthermore, ARF4-as displayed higher tolerance to salt and osmotic stress through reduced stomatal conductance coupled with increased leaf relative water content and Abscisic acid (ABA) content under normal and stressful conditions. This increase in ABA content was correlated with the activation of ABA biosynthesis genes and the repression of ABA catabolism genes. Cu/ZnSOD and mdhar genes were up-regulated in ARF4-as plants which can result in a better tolerance to salt and osmotic stress. A CRISPR/Cas9 induced SlARF4 mutant showed similar growth and stomatal responses as ARF4-as plants, which suggest that arf4-cr can tolerate salt and osmotic stresses. Our data support the involvement of ARF4 as a key factor in tomato tolerance to salt and osmotic stresses and confirm the use of CRISPR technology as an efficient tool for functional reverse genetics studies.

1. Introduction

Auxin is a key regulator of many plant growth and development processes throughout the plant life cycle [1]. Auxins regulate diverse cellular and developmental responses in plants via three types of transcriptional regulators, auxin response factors (ARFs), Aux/IAA and TOPLESS (TPS) proteins [2]. ARFs play a key role in regulating the expression of auxin response genes. In total, 23 ARF genes have been isolated from Arabidopsis thaliana [3]. Most of them share a structure with conserved domains: an N-terminal DNA-binding domain (DBD), a variable central transcriptional regulatory region (MR), which can function as an activator or repressor domain, and a carboxy-terminal dimerization domain (CTD) that contributes to the formation of either ARF/ARF homo- and hetero-dimers or ARF/Aux/IAA hetero-dimers [4,5]. Since ARF1, the first Arabidopsis ARF gene, was cloned and its function investigated [6], the ARF gene family has been identified and well characterized in many crop species, including tomato (Solanum lycopersicum), maize (Zea mays), rice (Oryza sativa), poplar (Populus trichocarpa), Chinese cabbage (Brassica rapa), banana (Musa sp.) and physic nut (Jatropha curcas L.) [4,7,8,9,10].
In tomato, the ARF gene family is also involved in the control of many physiological processes [5]. Downregulation of ARF3 decreased the density of epidermal cells and trichomes in tomato [11]. The Slarf2A/B mutation leads to a severe fruit ripening inhibition with dramatically reduced ethylene production, while the over-expression of ARF2A resulted in a blotchy ripening pattern in fruit as a result of a significant accumulation of ripening-related genes and metabolites [12]. Down-regulation of SlARF6 and SlARF8 in transgenic plants through the overexpression of miR167a may lead to floral development defects and female sterility [13]. Transcriptional down-regulation of ARF4 expression leads to severe leaf curling along the longitudinal axis [14]. The down-regulation of SlARF4 also resulted in ripening-associated phenotypes such as enhanced firmness, sugar and chlorophyll content leading to dark green fruit and blotchy ripening [14,15]. This phenotype was also reported in SlARF10 gain of function mutant [16].
ARF genes also seem to be implicated in plant responses to environmental stresses. It has been reported that both OsARF11 and OsARF15 show differential expression in salt stress conditions, suggesting that they are involved in the rice response to stress [7]. In banana, the expression of many ARF genes was altered in response to salinity and osmotic stresses [9]. We have previously shown that, in tomato, expression levels of many SlARF genes are responsive to a wide range of abiotic stress conditions [17]. Interestingly, the SlARF4 regulatory region was enriched in cis-acting elements specific to salinity and water deficit response [17]. Here, we extended this observation to plants subjected to salinity and osmotic stress. We investigated whether loss of SlARF4 function in tomato could have an impact on plant growth and function under water deficit, high salinity or osmotic stress conditions. By assessing morphological, anatomical, physiological and molecular analyses, we provide evidence for the involvement of SlARF4 in tomato response to salinity and osmotic stress. We discuss the potential role of elements of the auxin signaling network in responses to environmental stresses.

2. Material and Methods

2.1. Plant Material

Wild-type tomato (Solanum lycopersicum, L.) cv Micro-Tom (WT), and the following AUXIN RESPONSE FACTOR 4 lines were used in this study: an ARF4 antisense silenced line (ARF4-as), and a reporter line with the β-glucoronidase (GUS) gene driven by the native ARF4 promoter region (pARF4::GUS). ARF4-as plant lines were previously generated and well-characterized by Sagar et al. (2014) [15]. The most representative plant line was chosen.

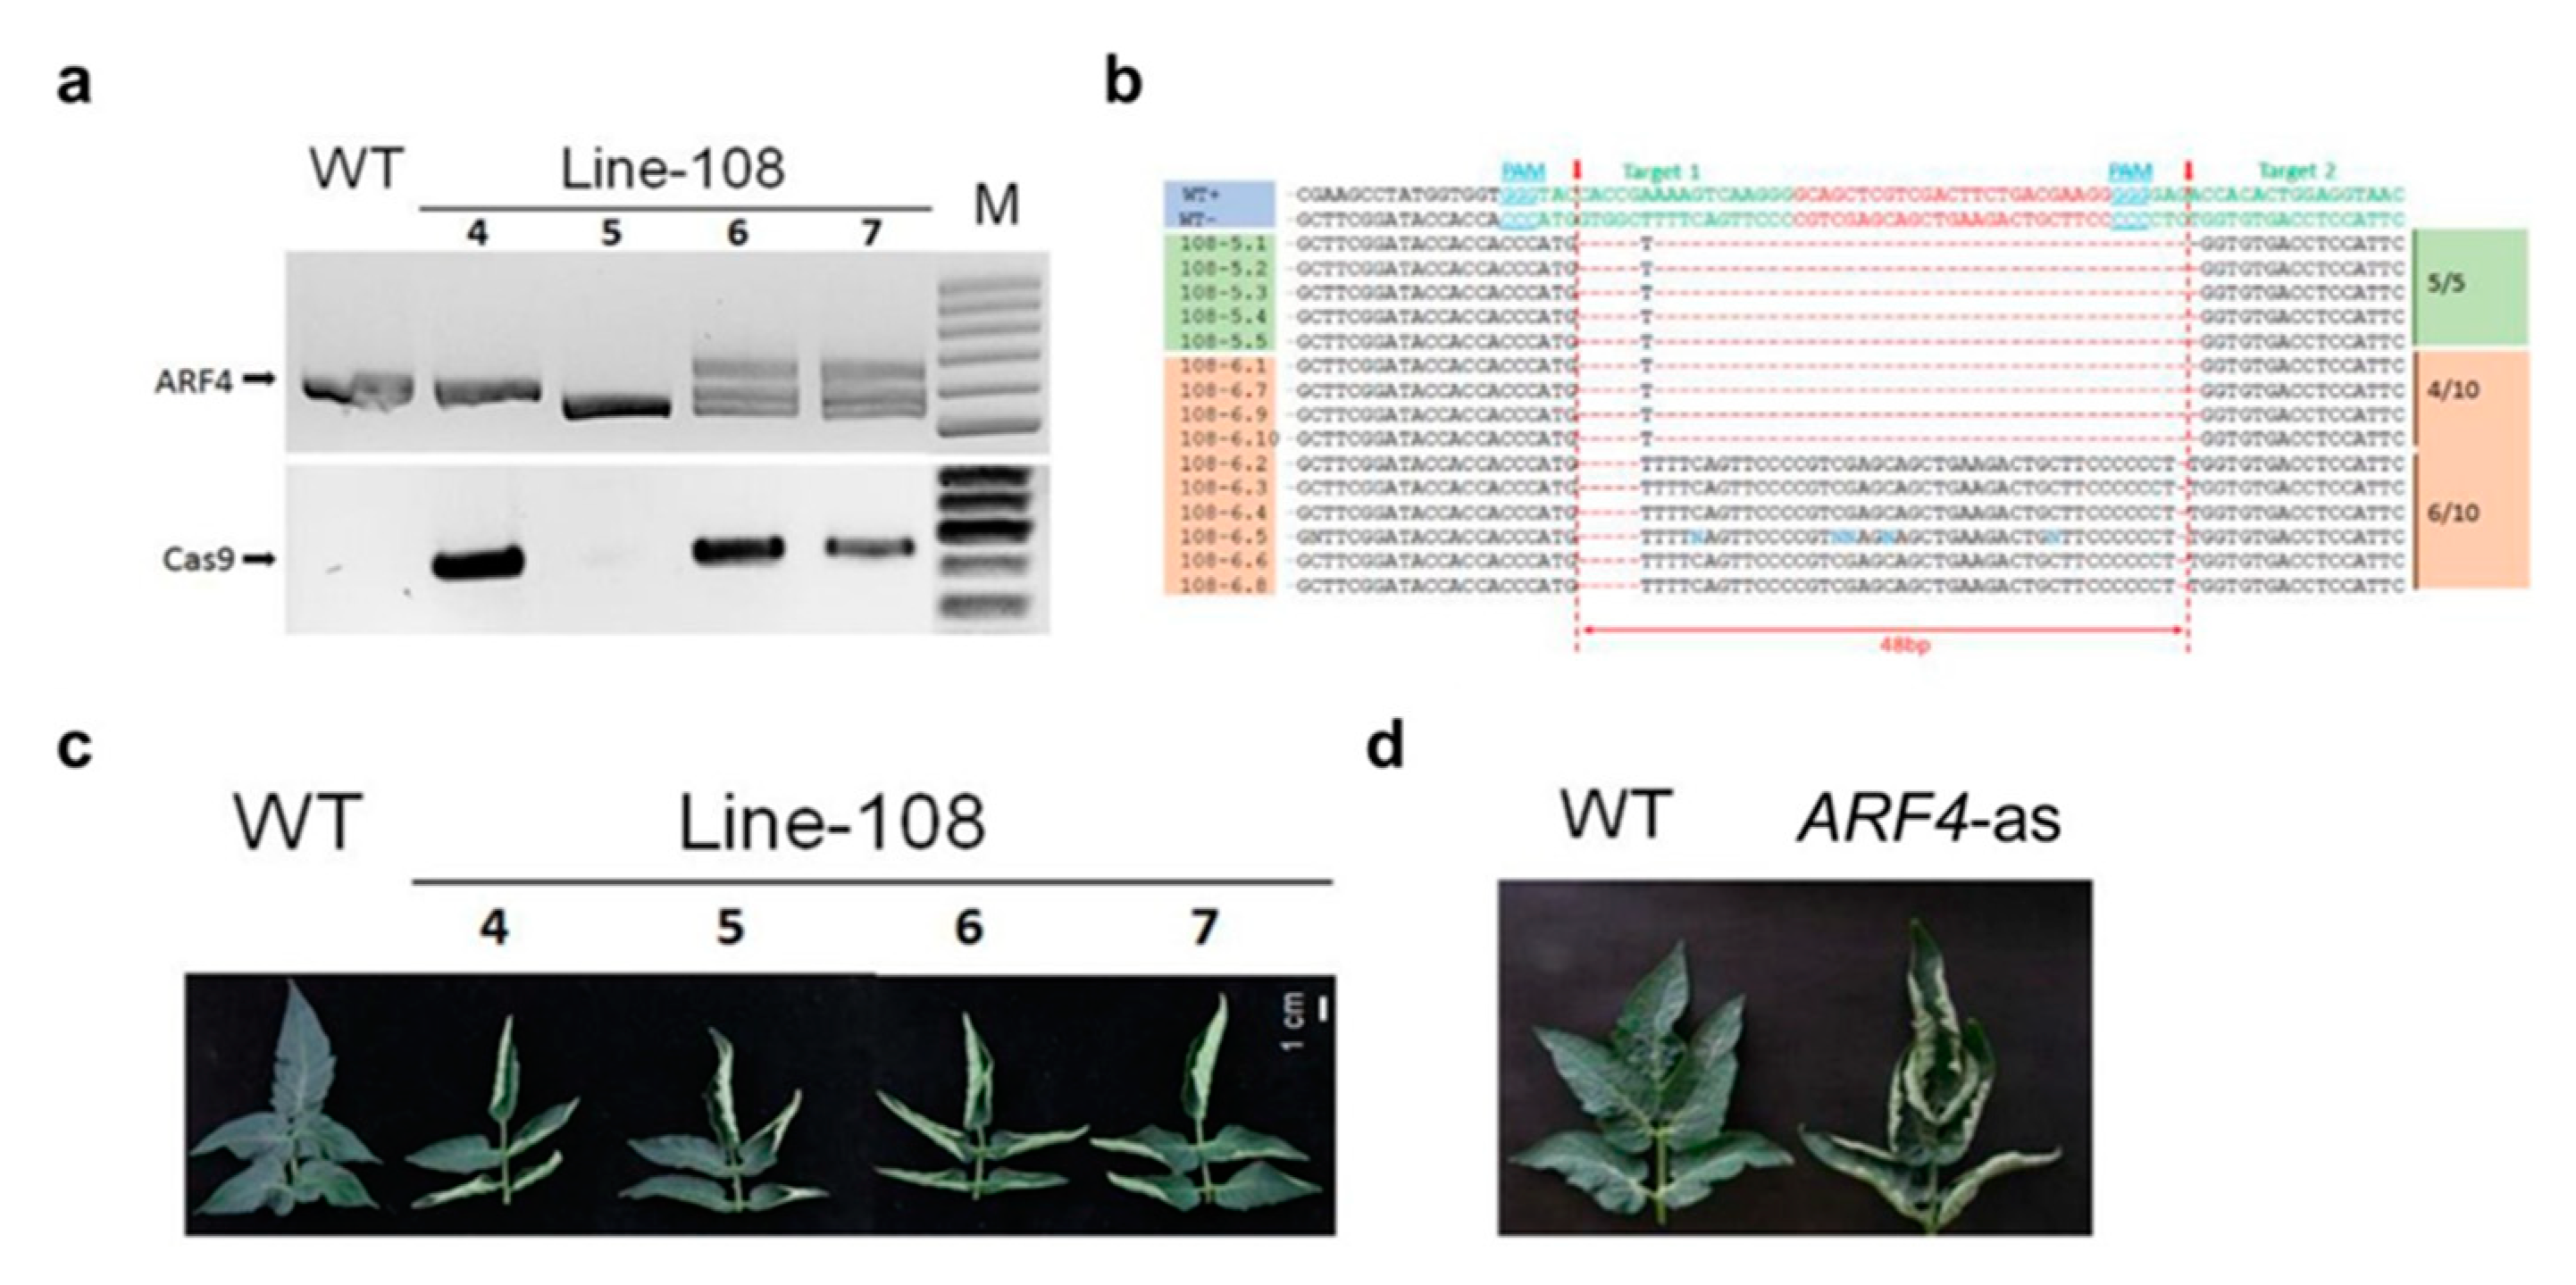
2.2. Generation of SlARF4-Crispr (arf4-cr) Plants

Tomato SlARF4-crispr (arf4-cr) plants were obtained by Agrobacterium tumefasciens mediated genetic transformation according to Wang et al. (2005) [18]. CRISPR/Cas9 mutant lines were generated following previous standard protocol [19]. Two single-guide (sg) RNAs in the Solyc11g069190 coding sequence were designed using the CRISPR-P server (http://cbi.hzau.edu.cn/cgi-bin/CRISPR) [20]. The sgRNA sequences are AATGGAGGTCACACCAGAG and GGAACTGAAAAGCCACCAT, aiming to create a 49bp deletion in the DBD domain of SlARF4 gene. The sgRNAs were first cloned in the Level 1 vectors pICH47751 and pICH47761 driven by the Arabidopsis U6 promoter, respectively. The Level 1 constructs pICH47732-NOSpro::NPTII, pICH47742-35S:Cas9, pICH47751-AtU6pro:sgRNA1, and pICH47761-AtU6::sgRNA2 were then assembled into the Level 2 destination vector pAGM4723. For genotyping of the transgenic lines, genomic DNA was extracted using ReliaPrep™ gDNA Tissue Miniprep System (Promega, Madison, United States)). The CRISPR/Cas9-positive lines were identified by PCR, then further genotyped for mutations using the primers (Fwd: ACATGGTTTCACTGTAAAGGGATCT and Rev: CTGGCCTGAAAGAAAAGCATCAAA) spanning the two sgRNAs target sequences by PCR and Sanger sequencing of ARF4-PCR products.

2.3. Characterization of ARF4-as and arf4-cr Plants

2.3.1. Plant Growth Conditions

Plants were grown as described previously [21]. Seeds of WT, ARF4-as and arf4-cr transgenic plants were sown in germination trays with commercial substrate (Tropstrato HT Hortaliças, Vida Verde) and supplemented with 1g L−1 10:10:10 NPK and 4 g L−1 dolomite limestone (MgCO3 + CaCO3). After the emergence of the first pair of true leaves, the seedlings were transferred to plastic pots (350 mL) with the same substrate described above, supplemented with 8 g L−1 10:10:10 nitrogen: phosphorus: potassium (N:P:K) and 4 g L-1 lime. The experiment was conducted in a greenhouse localized at Universidade Federal de Viçosa (642 m asl, 20°45′ S; 42°51′ W), Minas Gerais, Brazil, under semi-controlled conditions (mean temperature of 28 °C and 450–500 μmol m−2 s−1 PAR irradiance). Irrigation was performed twice a day, where each plastic pot received the same volume of water.

2.3.2. Growth Analyses

Growth measurements were conducted as described previously [22]. Plant height and internode length were measured 35 days after germination (DAG). At 45 DAG the plants were harvested and divided into leaves, stem and root. Leaf area was measured using leaf area meter (Li-Cor Model 3100 Area Meter, Lincoln, NE, USA). Leaf, stem and root were then packed separately in paper bags and oven dried at 70 °C for 72 h until they reached constant weight. Shoot and root biomass were measured from the dry weight of leaves, stem and root. Specific Leaf Area (SLA) was determined as described by Hunt (1982) [23].

2.3.3. Microscopy

For anatomical analysis, leaf discs were collected from the medium point of the fifth lateral leaflet and fixed in FAA50 (Formaldehyde, acetic acid and ethanol 50%) for 48 h, and then stored in ethanol 70%. Samples were infiltrated with historesin (Leica Microsystems, Wetzlar, Germany) and cut in cross sections with ~5 μm (RM2155, Leica Microsystems, Wetzlar, Germany). Leaf cross sections were mounted in water on glass slides and stained with toluidine blue. Histological sections were observed using an optic microscope (AX-70 TRF, Olympus Optical, Tokyo, Japan) and then photographed using digital photo camera (Zeiss AxioCam HRc, Göttinger, Germany). Anatomical features, such as leaf thickness and thickness of cell layers, were analyzed using Image-Pro Plus® software (version 4.5, Media Cybernetics, Silver Spring, MD, USA).

2.3.4. Measurements of Photosynthetic Parameters

Photosynthetic parameters were performed using an open-flow infrared gas exchange analyzer system (Li 6400XT, Li-Cor, Lincoln, USA) equipped with an integrated fluorescence chamber (Li-6400-40; Li-Cor Inc.). All measurements were made on terminal leaflets of intact and completely expanded leaves. The analysis was conducted under common conditions for photon flux density (1000 μmol m−2 s−1), leaf temperature (25 ± 0.5 °C), leaf-to-air vapor pressure difference (16.0 ± 3.0 mbar), air flow rate into the chamber (500 μmol s−1), reference CO2 concentration of 400 ppm using an area of 2 cm2 in the leaf chamber.
A/Ci curves were determined initiated at an ambient CO2 concentration of 400 μmol mol–1 under a saturating photosynthetic Photon Flux Density (PPFD) of 1000 μmol m–2 s –1 at 25 °C under ambient O2 supply. CO2 concentration was decreased to 50 μmol mol–1 of air in step changes. Upon the completion of the measurements at low Ca, Ca was returned to 400 μmol mol–1 of air to restore the original A. Next, CO2 was increased stepwise to 1600 μmol mol–1 of air. The maximum rate of carboxylation (Vcmax), maximum rate of carboxylation limited by electron transport (Jmax) and triose-phosphate utilization (TPU) were estimated by fitting the mechanistic model of CO2 assimilation proposed by Farquhar et al. (1980) [24]. Corrections for the leakage of CO2 into and out of the leaf chamber of the LI-6400 were applied to all gas-exchange data as described by Rodeghiero et al. (2007) [25].

2.3.5. Kinetics of Stomatal Conductance

The evaluation of stomatal behavior in response to light and CO2 variation was performed in WT and ARF4-as plants 40 DAG, under laboratory conditions (temperature 22–25 °C; relative humidity 50–60% and radiation of 150–200 µmol −2 s−1), using an open-flow infrared gas exchange analyzer system (Li 6400XT, Li-Cor, Lincoln, CA, USA). The variation of gs was performed on the fifth or sixth fully expanded leaf. For step-change evaluation of gs in response to light intensity, leaves were stabilized for 30 min in the dark and then radiation was increased to 1000 µmol m−2 s−1, and allowed to stabilize for 240 min. Subsequently, light was turned off and observations recorded for another 100 min. The alternation in the amount of light was based on the results presented by Lawson et al. (2010) [26]. The response of gs to CO2 was performed in a similar manner to those described above for light response. The analysis was performed in a range of 240 min, with changes in CO2 concentration (400-800-400 µmol CO2 m−2 s−1).

2.3.6. Productivity Traits

The productivity parameters were measured in eight plants per genotype (WT, ARF4-as and SlARF4-crispr). The average fruit weight was determined after individual weighing of each fruit, using a semi analytical balance with a sensitivity of 0.01 g (Shimadzu® AUY220 model, Japan)). Equatorial and polar diameter was measured using a digital pachymeter (Jomarca STAINLESS HARDENED, Nieuw, Vennep, Netherland). The determination of the soluble solids content (°Brix) was performed in 10 fruits per plant using a digital temperature-compensated refractometer, model RTD 45 (Instrutherm®, São Paulo, SP, USA).

2.4. ARF4 Expression under Salt, Drought and Osmotic Stresses

2.4.1. Plant Growth and Stress Conditions

WT tomato seeds were sterilized for 10 min in 50% sodium hypochlorite, rinsed four times with sterile distilled water and sown in pots containing peat. Then they were incubated in a culture room with 16 h light/8 h dark photoperiod and 25 ± 2 °C temperature. After 3 weeks, plants were subjected to salt and drought stresses. Salt stress was performed by watering daily the plants with 250 mM of NaCl solution. Control plants were daily watered with distilled water. Leaves and roots samples were harvested after 2 and 24 h of salt stress application. Drought stress was performed on three-week-old plants by water holding for 48 h and for 5 days. Watering continued normally throughout for control plants. Leave and root samples were collected after drought stress application. Three biological replicates were done for each condition.

2.4.2. RNA Extraction

Total RNA was extracted from leaves and roots samples by using The Plant RNeasy extraction kit (RNeasy Plant Mini Kit, Qiagen, Valencia, CA, USA). To remove any residual genomic DNA, the RNA was treated with an RNase-Free DNase according to the manufacturer’s instruction (Ambion® DNA-freeTMDNase, Austin, Texas, United States). The concentration of RNA was accurately quantified by spectrophotometric measurement and 1µg of total RNA was separated on 2% agarose gel to monitor its integrity. DNase-treated RNA (2 μg) was then reverse-transcribed in a total volume of 20 μL using the Omniscript Reverse Transcription Kit (Qiagen, Hilden, Germany).

2.4.3. Real Time PCR

The real-time quantification of cDNA corresponding to 2 µg of total RNA was performed in the ABI PRISM 7900HT sequence detection system using the QuantiTech SYBR Green RT-PCR kit (Qiagen). The Gene-specific primers used are listed in Table S1. The reaction mixture (10 µL) contained 2 µg of total RNA, 1,2 µM of each primer and appropriate amounts of enzymes and fluorescent dyes as recommended by the manufacturer. Actin gene was used as reference. Real-Time PCR conditions were as follow: 50 °C for 2 min, 95 °C for 10 min, then 40 cycles of 95 °C for 15 s and 60 °C for 1 min, and finally one cycle at 95 °C for 15 s and 60 °C for 15 s. Three independent biological replicates were used for real-time PCR analysis. For each data point, the CT value was the average of CT values obtained from the three biological replicates.

2.4.4. Histochemical Analysis of GUS Expression

Transgenic plants expressing pARF4::GUS were generated by Agrobacterium. tumefaciens-mediated transformation according to Wang et al. (2005) [18]. For that, PCR was performed on the genomic DNA of tomato Micro-Tom (10 ng.mL–1) using specific primers. The corresponding amplified fragment was cloned into the pMDC162 vector containing the GUS reporter gene using Gateway technology (Invitrogen). The cloned SlARF promoter was sequenced from both sides using vector primers in order to see whether the end of the promoter is matching with the beginning of the reporter gene. Sequencing results analyses were carried out using the Vector NTI (Invitrogen) and ContigExpress software by referring to ARF promoter sequences.
After being surface sterilized, pARF4::GUS seeds were cultivated in Petri dishes containing half strength Murashige & Skoog medium for 7 days in a growth chamber at 25 °C with 16 h light/8 h dark cycle. One-week-old plants were then grown hydroponically for two weeks in Broughton & Dillworth (BD) liquid medium [27]. Three-week-old plants were subjected to salt and osmotic treatment. Salt stress was performed by adding 250 mM of NaCl to the culture medium. After 24 h of the salt stress application, plants were incubated overnight at 37°C in GUS buffer (3 mM 5-bromo-4-chloro-3-indolyl-β-D-glucuronide (Duchefa Biochemie, Haarlem, The Netherlands), 0.1% v/v Triton X-100 (Sigma, Steinhaim, Germany) 8 mM β-mercaptoethanol, 50 mM Na2HPO4/NaH2PO4 [pH 7.2]) then followed by a destaining in 70% EtOH. Osmotic stress was conducted by adding 15% PEG 20000 to the liquid culture solution. Plants were collected after five days of stress application and were GUS-stained as described above. For each stress condition, control plants were cultivated in BD liquid medium for the same period.

2.5. Stress Tolerance Assays in the Transgenic Tomato Plants

2.5.1. Plant Growth and Stress Application

WT and ARF4-as seeds were first surface-sterilized for 10 min in 50% sodium hypochlorite, and then rinsed four times with sterile distilled water. They were then cultured in petri dishes containing half strength Murashige & Skoog (MS) medium for 7 days in a growth chamber at 25° with 16 h light/8 h dark cycle. One-week-old plants were then grown hydroponically in pots containing 1 L of BD aerated nutriment solution for two weeks in the same growth conditions (25° with 16 h light/8 h dark cycle) [27]. Three weeks plants were then subjected to salt and osmotic stresses. Salt stress was performed by adding 100 mM or 150 mM NaCl to the liquid BD medium. Leaves and roots samples were harvested after 2 weeks of treatment. osmotic treatment was conducted as follows: three weeks plants were subjected to osmotic stress by adding 5% or 15% PEG 20,000 corresponding to final osmotic potentials of −0.09 MPa and −0.28 MPa to the hydroponic solution for 2 weeks. Meanwhile, the control plants were grown normally in BD medium. Leaves and roots samples were collected after 2 weeks of culture for both stressed and unstressed plants. For each treatment, the hydroponic solution was renewed each 3 days.

2.5.2. Morphological Analysis

  • Determination of shoot and root fresh weights
Shoot and root fresh weights were determined as followed: stressed and unstressed plants from each line were harvested and rinsed thoroughly with distilled water (DW). The plants were blot dried on blotting sheet and cut into shoots and roots. The fresh weight of each part of the plant was measured and the mean of shoots and roots weights was determined based on at least twelve plants per line in each condition.
  • Determination of primary root length and lateral root density
Primary root length was determined as followed. Pictures for each plant were analyzed using ImageJ software in order to determinate the root length. Twelve independent plants from each line under control and stress conditions were used to calculate the mean.
The lateral root number was determined by counting the number of emerging roots and the mean was calculated based on at least twelve plants per line in each condition. The lateral root density (LR density) was determined using the following equation: number of LRs/the length of the root.

2.5.3. Physiological Analysis

  • Determination of chlorophyll content
Determination of chlorophyll content of each line under stressful and normal conditions was performed as described in Bassa et al. (2012) [28]. A 100 mg aliquot of leaves collected from stressed and unstressed plants was weighted and ground with 1 mL of 80% acetone. The liquid obtained was centrifuged for 1 min at 10,000 rpm to remove any remaining solid tissue. Samples were analyzed by spectrophotometry at two wavelengths, 645 and 663 nm, using 80% acetone as the blank. The total chlorophyll content was determined using the following equations: Total Chlorophyll Content = 20.2 × Chl a + 8.02 × Chl b (Chl a = 0.999A663 – 0.0989A645 and Chl b = –0.328A663+1.77A645)
  • Determination of soluble sugar content
Total soluble sugar content was determined as in Dubois et al. (1956) [29]. Thus, 100 mg of fresh leaves and roots of each sample were homogenized in 5 mL of 80% ethanol in test tubes. Test tubes were kept in water bath of 80 °C for 1 h, and sample extracts were transferred to another test tube, and 0.5 mL distilled water and 1 mL of 5% phenol then added and allowed to incubate for 1 h. Finally, after 1 h, 2.5 mL sulfuric acid was added to the test tubes and shaken well on an orbital shaker. Absorbance was read at 485 nm on Spectrophotometer. Sucrose was used as standard.
  • Determination of leaf stomatal conductance
Leaf abaxial stomatal conductance of the youngest fully expanded leaf (usually the fifth leaf, counting from the base) of stressed and well-drained plants of each studied line were determined after two weeks of stress treatment using a hand-held leaf diffusion poromoter (SC-1 LEAF POROMETER, Decagon, Pullman, Washington, United States). For each line, three biological replicates were conducted at each condition.
  • Determination of Abscisic acide (ABA) content
Three weeks ARF4-as and WT plants were exposed to salt and osmotic stress. Leaf samples were taken after 24 h for salt stress and after 48 h for osmotic. ABA measurement assays were performed as described Forcat et al. (2008) [30]. Briefly, 110 mg of frozen tissue were extracted at 4 °C for 30 min with 400 μL of H2O with 10% methanol + 1% acetic acid. The internal standard was 2H6 ABA. The extract was centrifuged at 13,000 g for 10 min at 4 °C. The supernatant was carefully removed and the pellet re-incubated for 30 min with 400 μL of methanol-acetic acid mix. Following the centrifugation, the supernatants were pooled. Extracts were then analyzed by Liquid Chromatography- Mass Spectrometry (LC-MS) using an Acquity Ultra Performance Liquid Chromatography (UPLC) coupled to a XevoQtof (Waters, MA, USA). Analysis parameters were described in Jaulneau et al. (2010) [31].
  • Determination of Relative water content (RWC):
Tomato fully expanded leaves were excised and fresh weight (FW) was recorded every 30 min. The excised leaves were then allowed to float on deionised water for about 24 h and turgid weight (TW) was recorded. Leaves were dried at 80 °C for 24 h and dry weight (DW) recorded. Finally, RWC was calculated according to Smart and Bingham (1974) [32].

2.5.4. Quantitative Expression Assays

Three-weeks-old WT and ARF4-as plants grown hydroponically in BD medium were subjected to either 150 mM of NaCl or 15% of PEG. Leaves and root samples were harvested after 2 h and 24 h for salt stress and after 48 h for osmotic stress. RNA extraction, cDNA synthesis and real time PCR were performed as previously described in paragraph “ARF4 gene expression under salt and osmotic stress conditions”. The gene-specific primers used are listed in Table S1.

3. Results

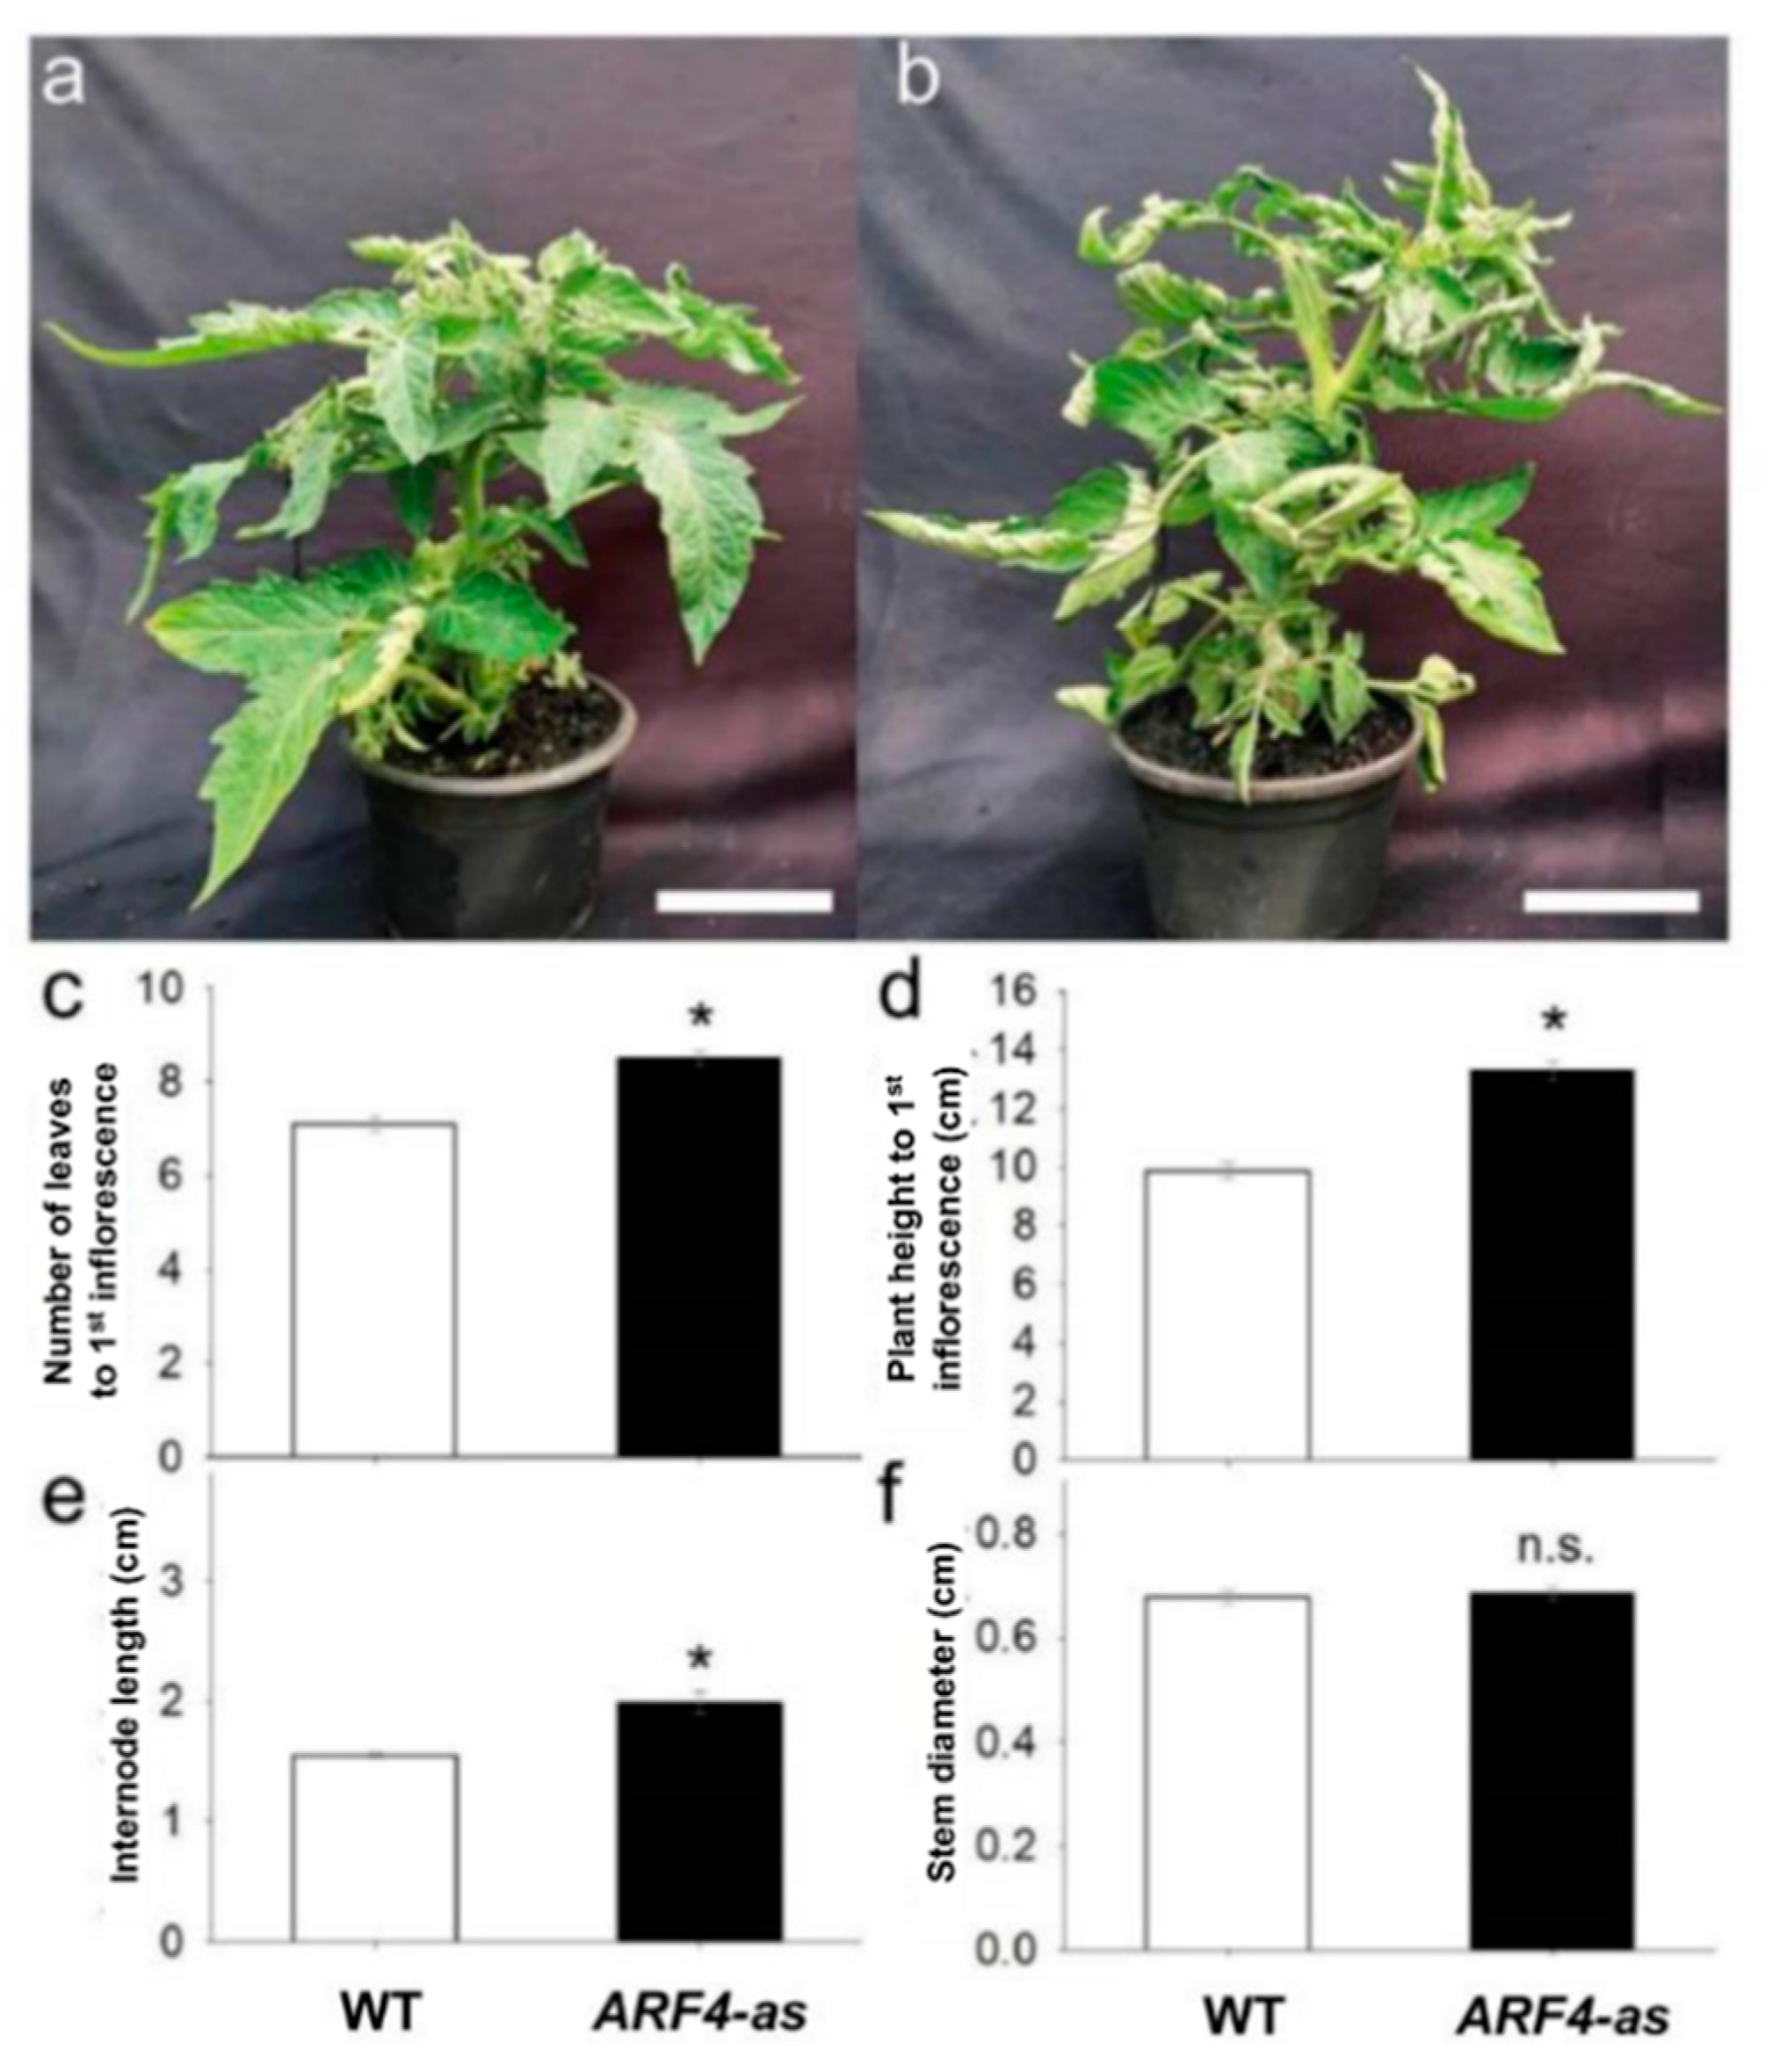
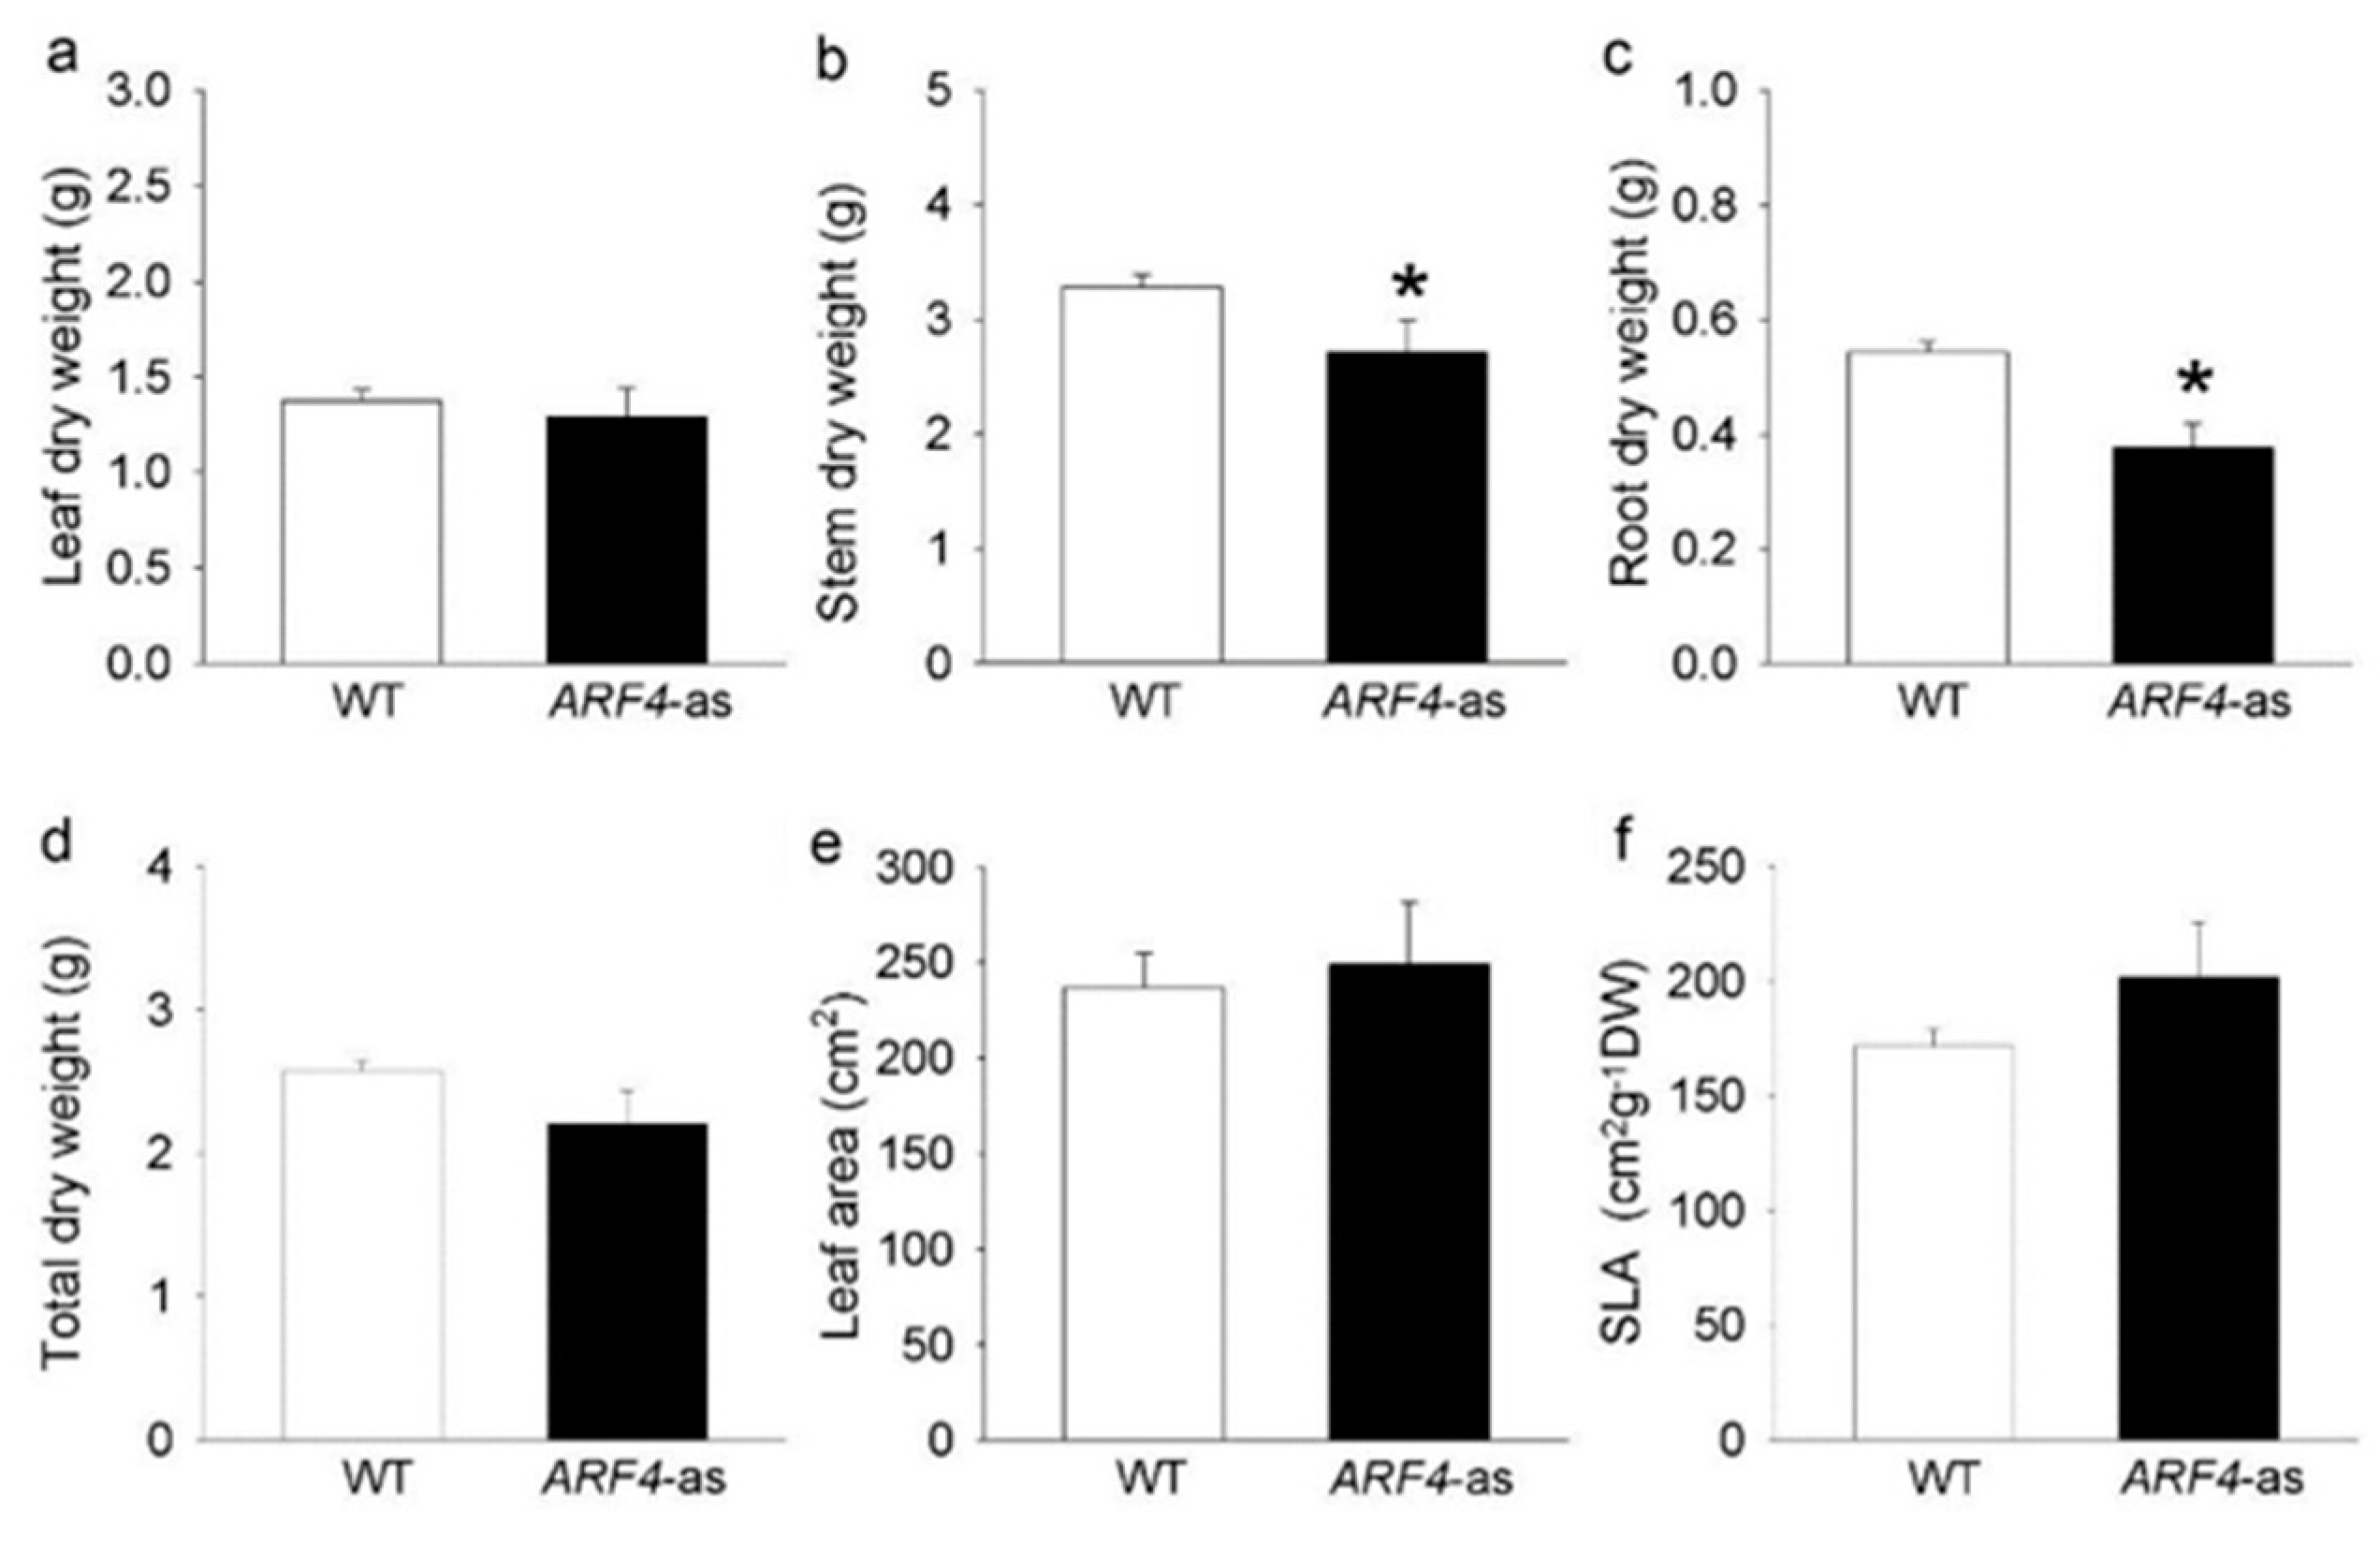
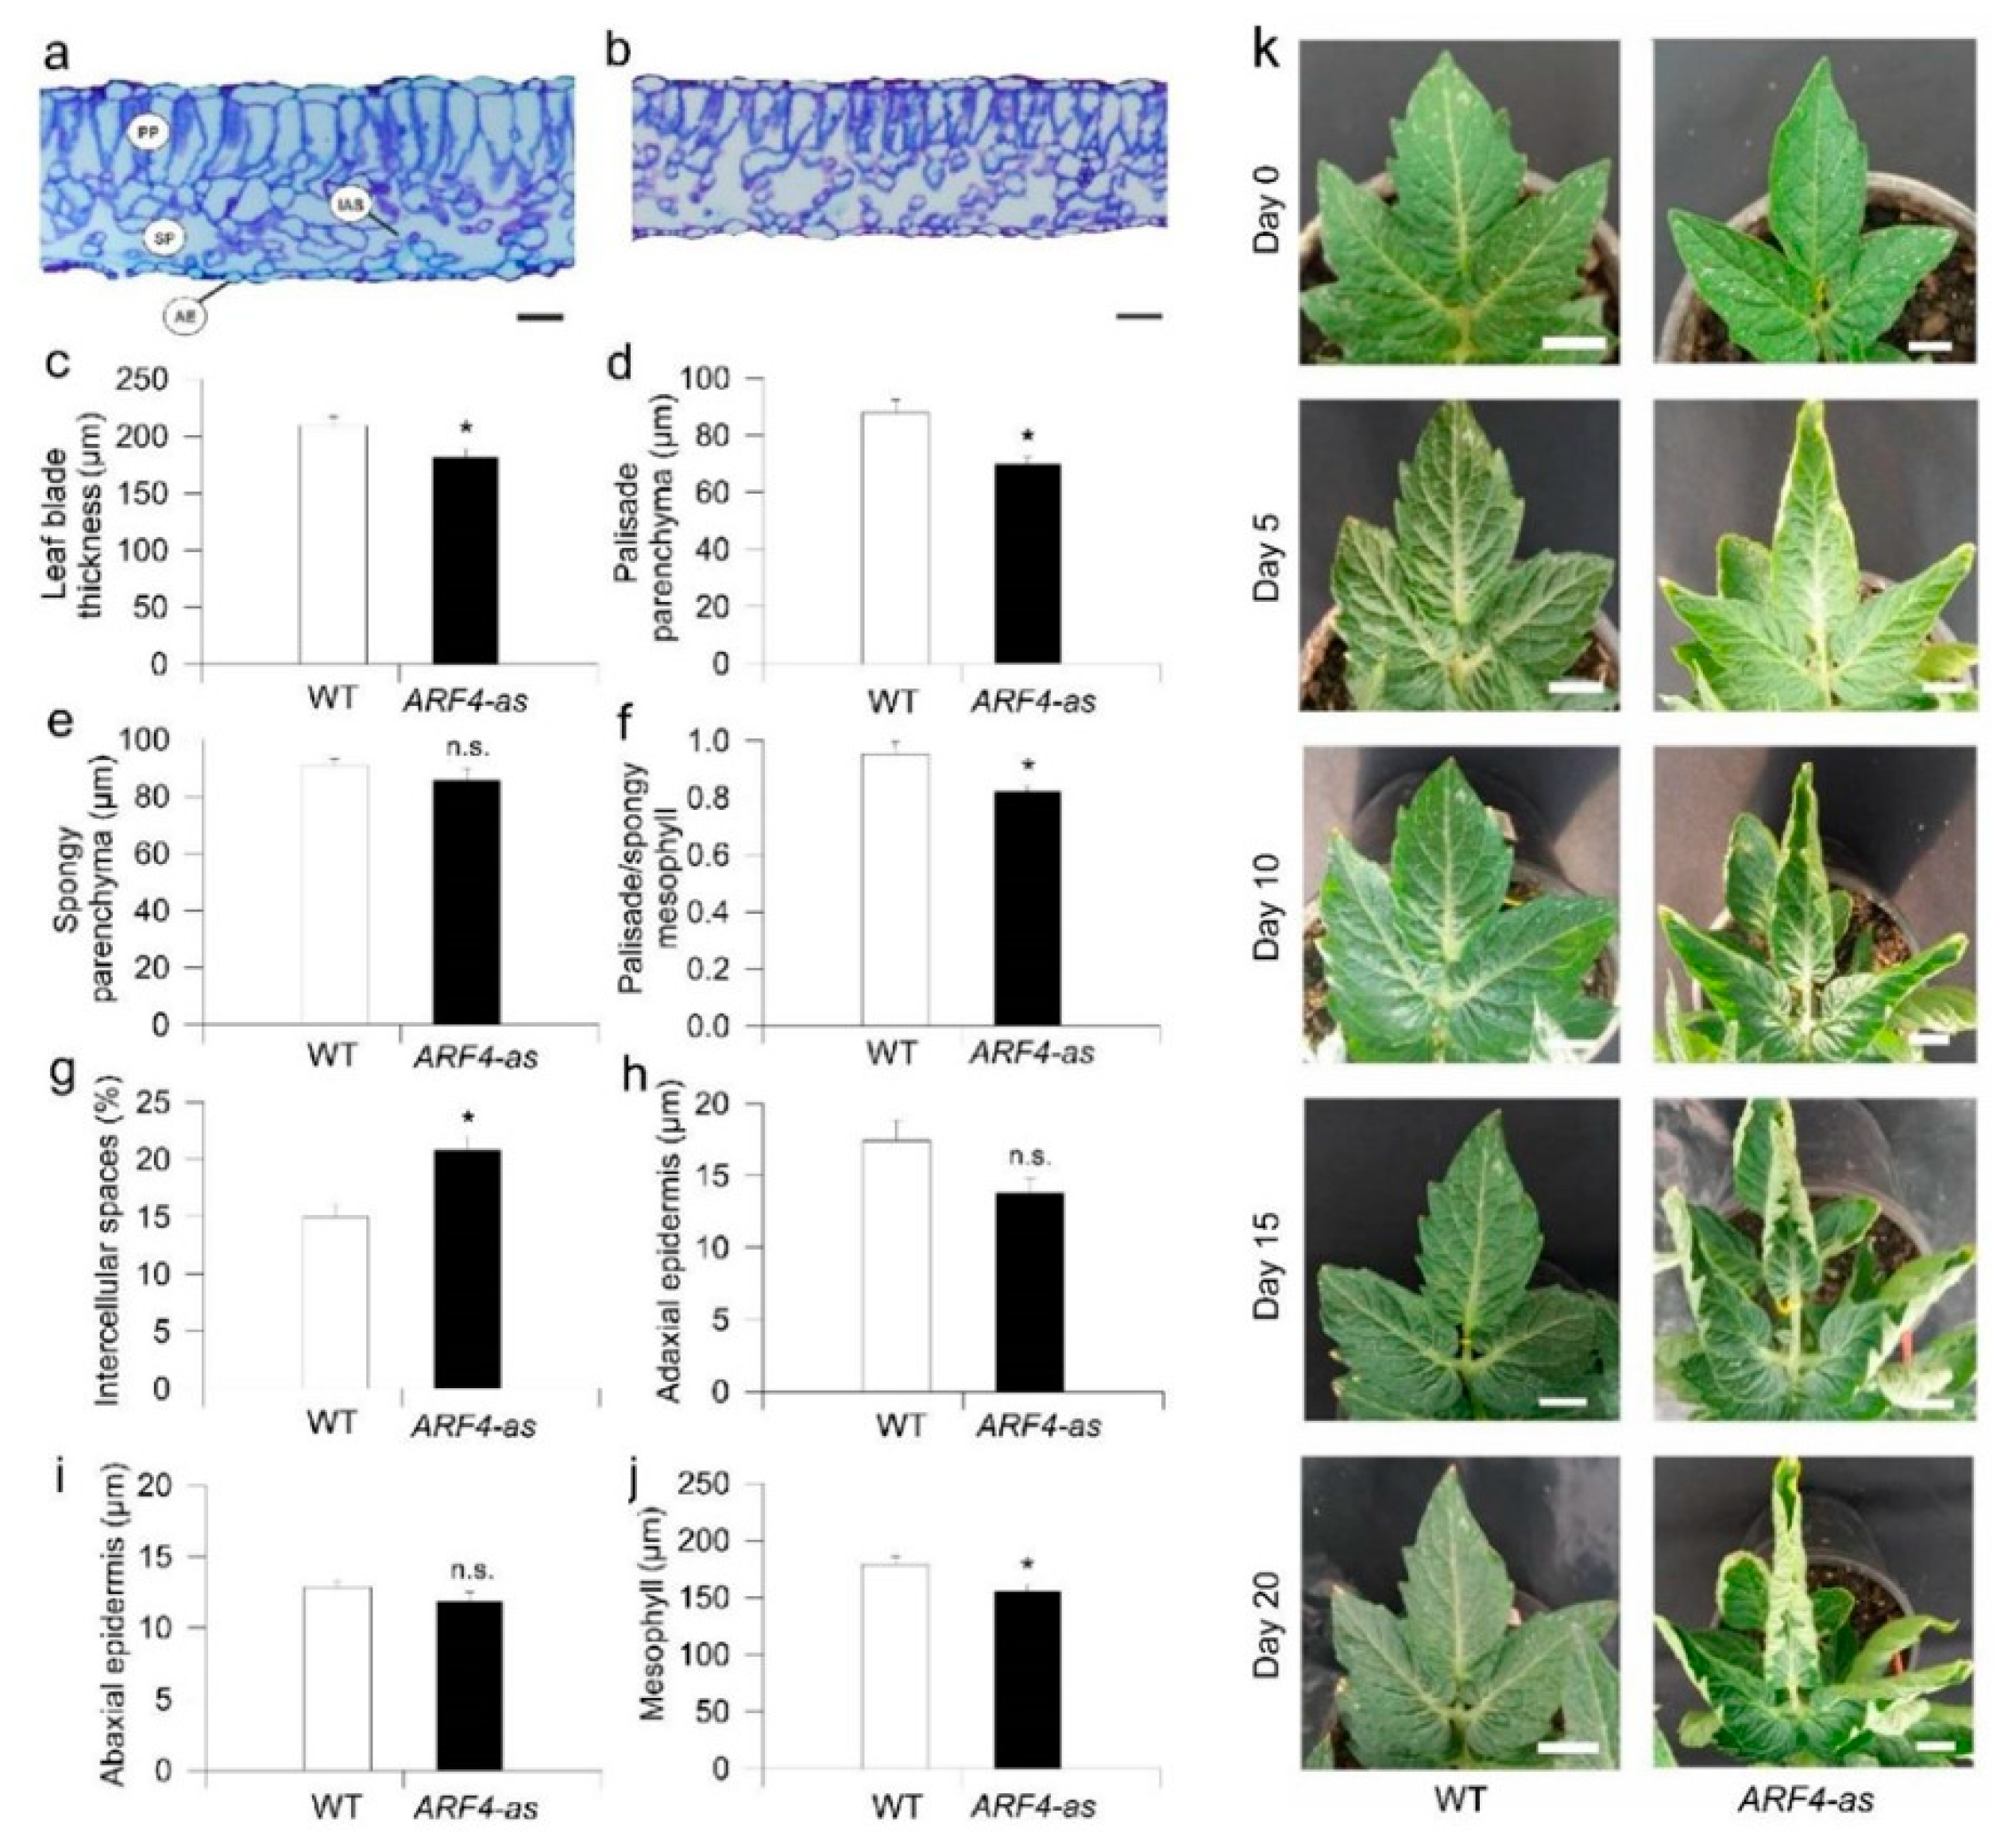
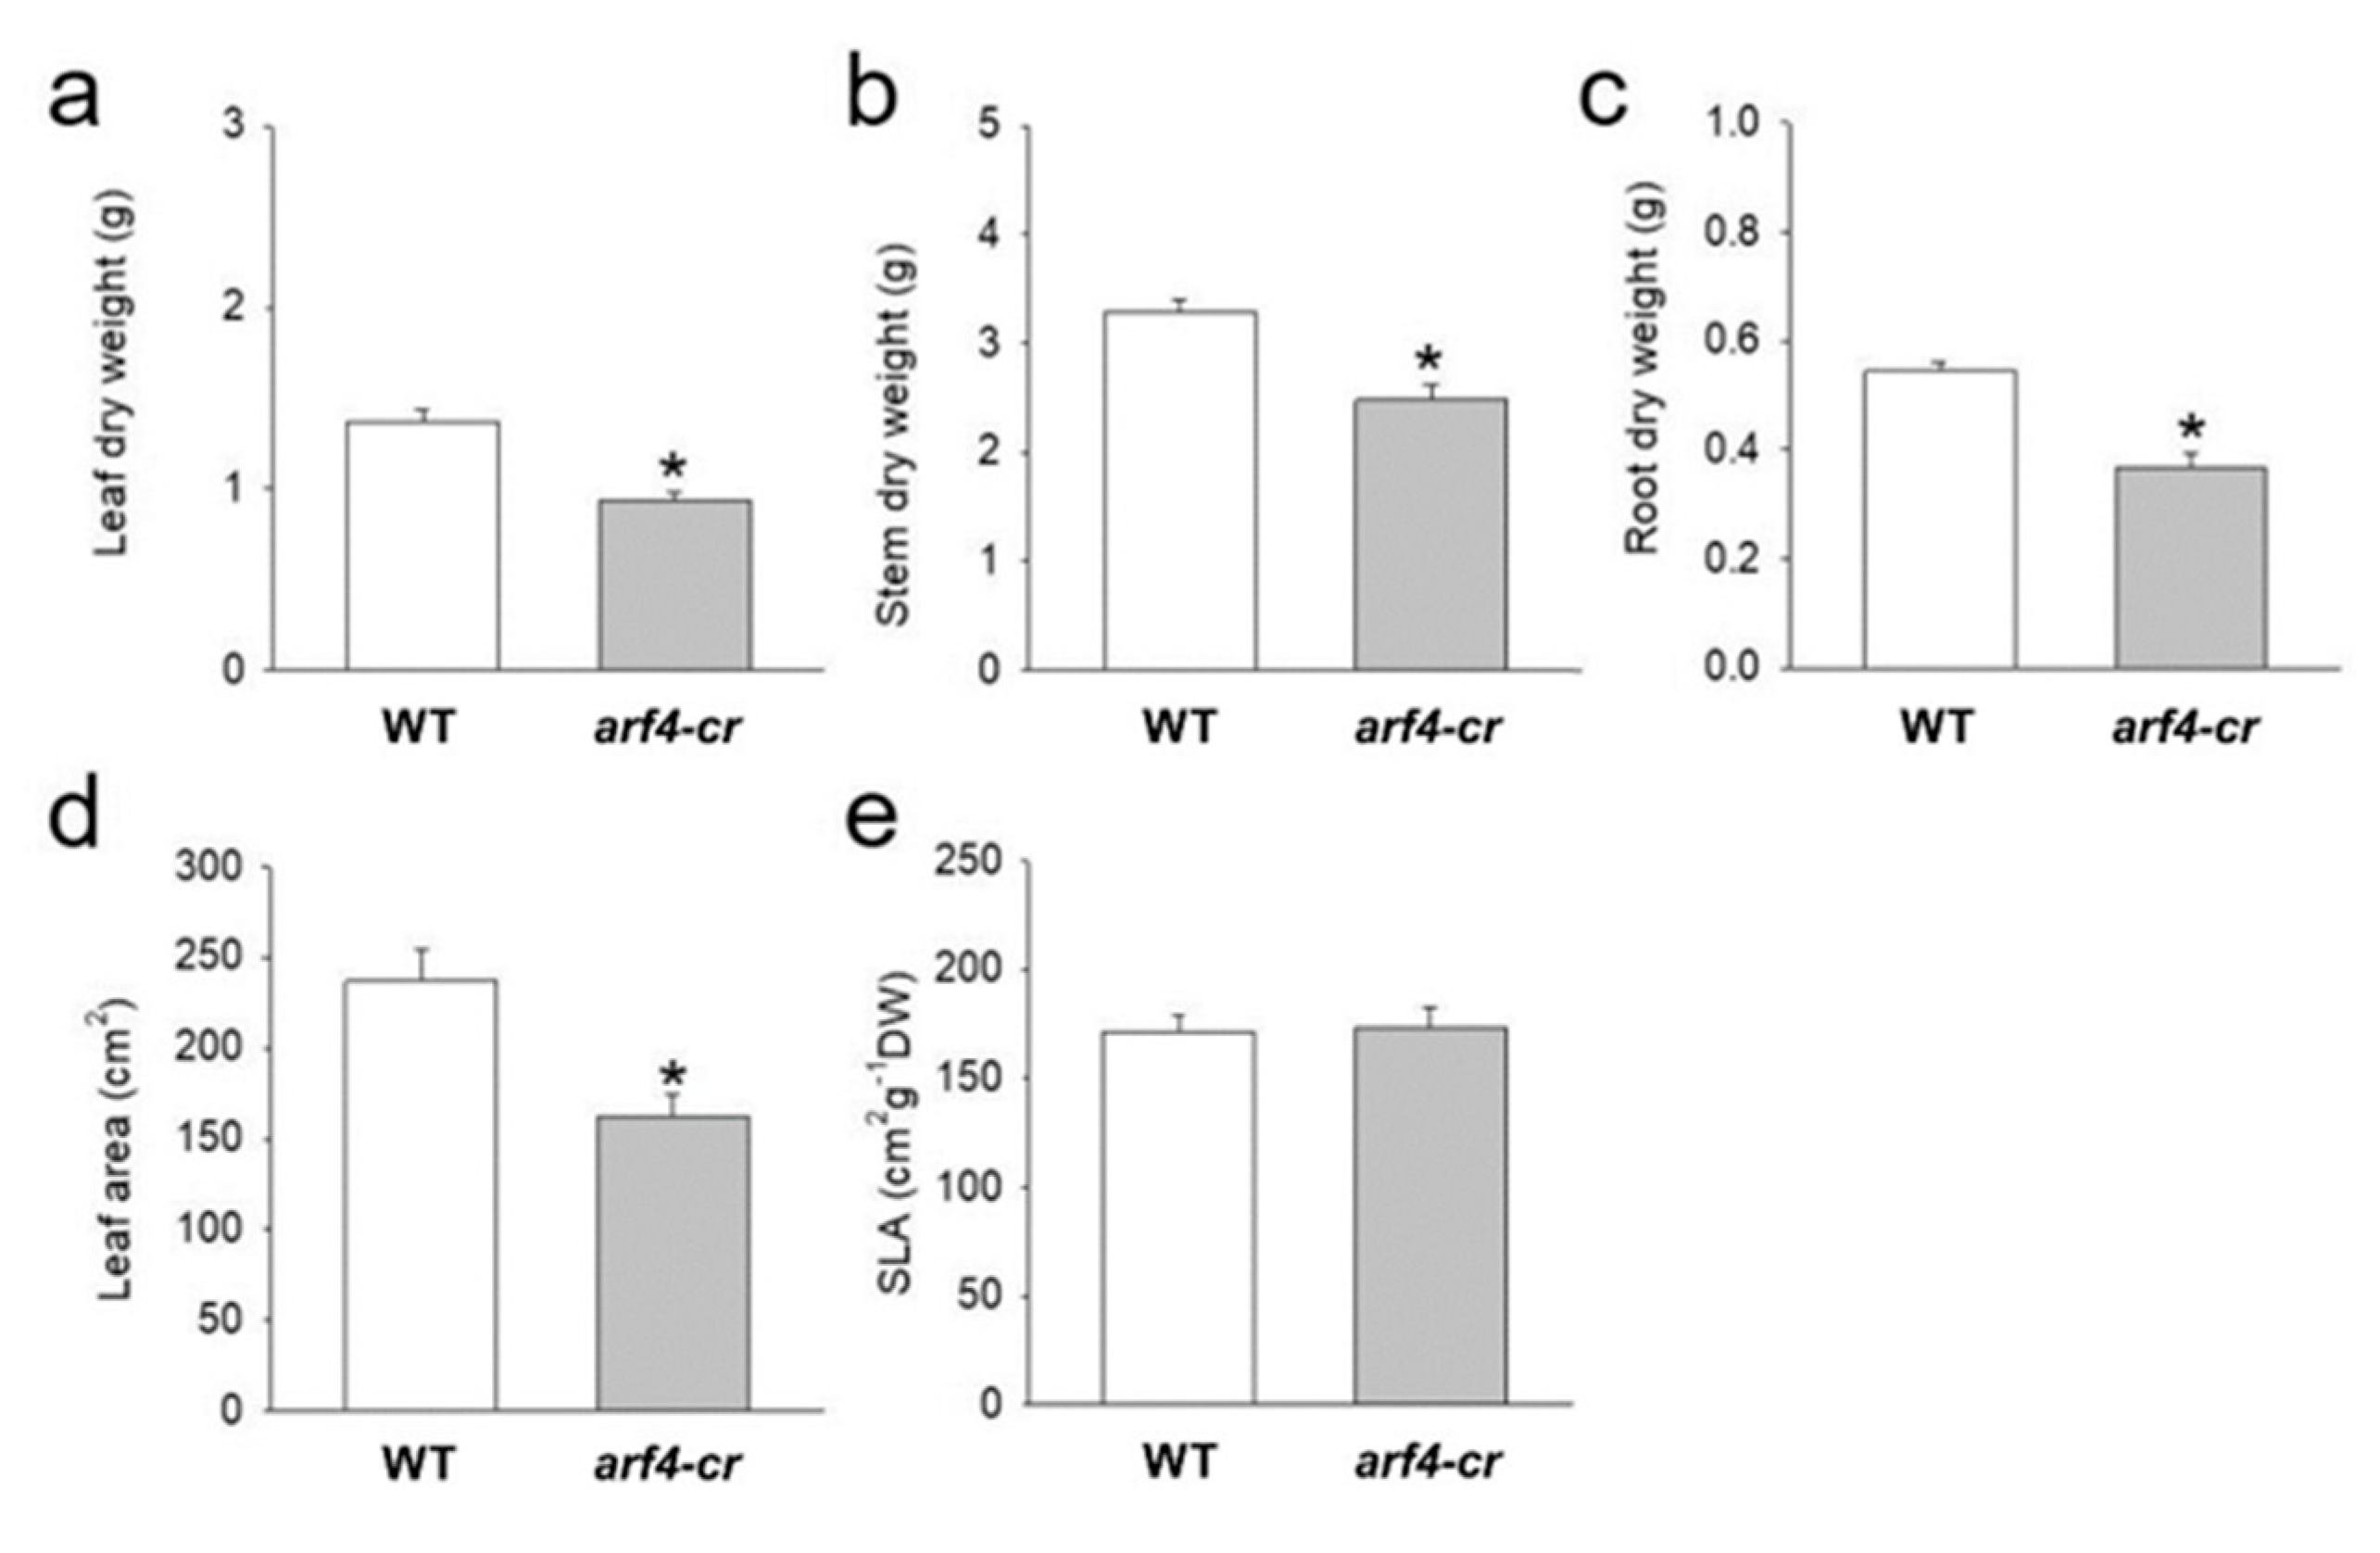
3.1. SlARF4 Downregulated Line Shows Altered Anatomical, Morphological and Physiological Parameters

We analyzed a previously published AUXIN RESPONSE FACTOR 4 antisense line (ARF4-as) [15]. The ARF4-as plants exhibit a wide range of morphogenic phenotypes, namely delayed flowering, increased height and leaf curling as compared to their isogenic Micro-Tom (wild-type, WT) counterparts (Figure 1). Stem and root dry weight, on the other hand, showed a significant reduction in ARF4-as plants compared to WT, along with a minor increase in leaf area and specific leaf area (Figure 2).
ARF4-as plants displayed an upward curling along the longitudinal axis of leaves (Figure 3b–k). The extent of the changes detected in leaf morphology prompted us to check leaf ultrastructure in WT and ARF4-as plants. Leaf thickness was clearly reduced in ARF4-as plants compared to WT (Figure 3a,b). Average leaf blade thickness was 209 ± 8 µm in WT compared to 181 ± 7 µm in ARF4-as (Figure 3c). The palisade parenchyma (PP), spongy parenchyma (SP) and mesophyll tissue layers were thinner in ARF4-as plants than in WT plants (Figure 3d,e,j). The palisade:spongy mesophyll ratio was significantly higher in WT than in ARF4-as (Figure 3f). Meanwhile, the intracellular air spaces (IAS) were more conspicuous in ARF4-as compared to WT (Figure 3g), while no visible difference was observed in adaxial or abaxial epidermis between genotypes (Figure 3h,i).
Consistent with the presence of thinner leaves in the ARF4-as mutant plants, net CO2 assimilation rate (A) showed lower values along with a decreased stomatal conductance (gs) in ARF4-as plants while WT plants exhibited higher CO2 assimilation rate and gs values (Figure 4a–b). It is well known that A can be limited by the slowest of two biochemical processes: (1) the maximum rate of ribulose 1,5-biphosphate (RuBP) carboxylase/oxygenase (Rubisco) catalyzed carboxylation (Vcmax) and (2) regeneration of RuBP controlled by electron transport rate (Jmax) [33]. Consistently, Vcmax and Jmax exhibited a significant decrease in ARF4-as plants (Table S2), indicating that photosynthesis is reduced due to the silencing of SlARF4 (Figure 5a).
Stomatal conductance is one of the main parameters that affect photosynthesis under osmotic stress [34]. As stomatal behavior is closely linked to CO2 uptake, it is considered to be one of the main reasons for reduced photosynthesis [35]. Stomatal conductance was significantly lower in ARF4-as compared to WT (Figure 4c). The response of stomatal conductance (gs) to changing air vapor pressure deficit (VPD) was determined in ARF4-as and WT plants. At low VPD, WT plants exhibited high gs and tended to reduce gs as VPD increased from 1.25 kPa to 2 kPa and maintained a moderate gs values at higher VPDs. Meanwhile, ARF4-as plants presented a relatively low gs values at both low and high VPD compared to WT plants (Figure 5b). We verified a similarly impaired stomatal response in ARF4-as plants in response to step changes in irradiance and CO2 levels (Figure S1), suggesting that ARF4 could be an important player in the regulation of stomatal movements. Furthermore, intrinsic water-use efficiency (WUE) was notably higher in ARF4-as plants (Figure 4d) suggesting that the downregulation of SlARF4 has the potential to improve the ration of carbon assimilation to transpirational water loss.
Given this potential impact on carbon assimilation, we next sought to examine whether SlARF4 under-expression might affect plant agronomic parameters. Yield, number of fruits and fruit fresh weight were not altered between WT and ARF4-as plants, whereas fruit shape was altered in ARF4-as plants (Figure S2), as expected, given the well-known role of auxin in fruit development [12,36].

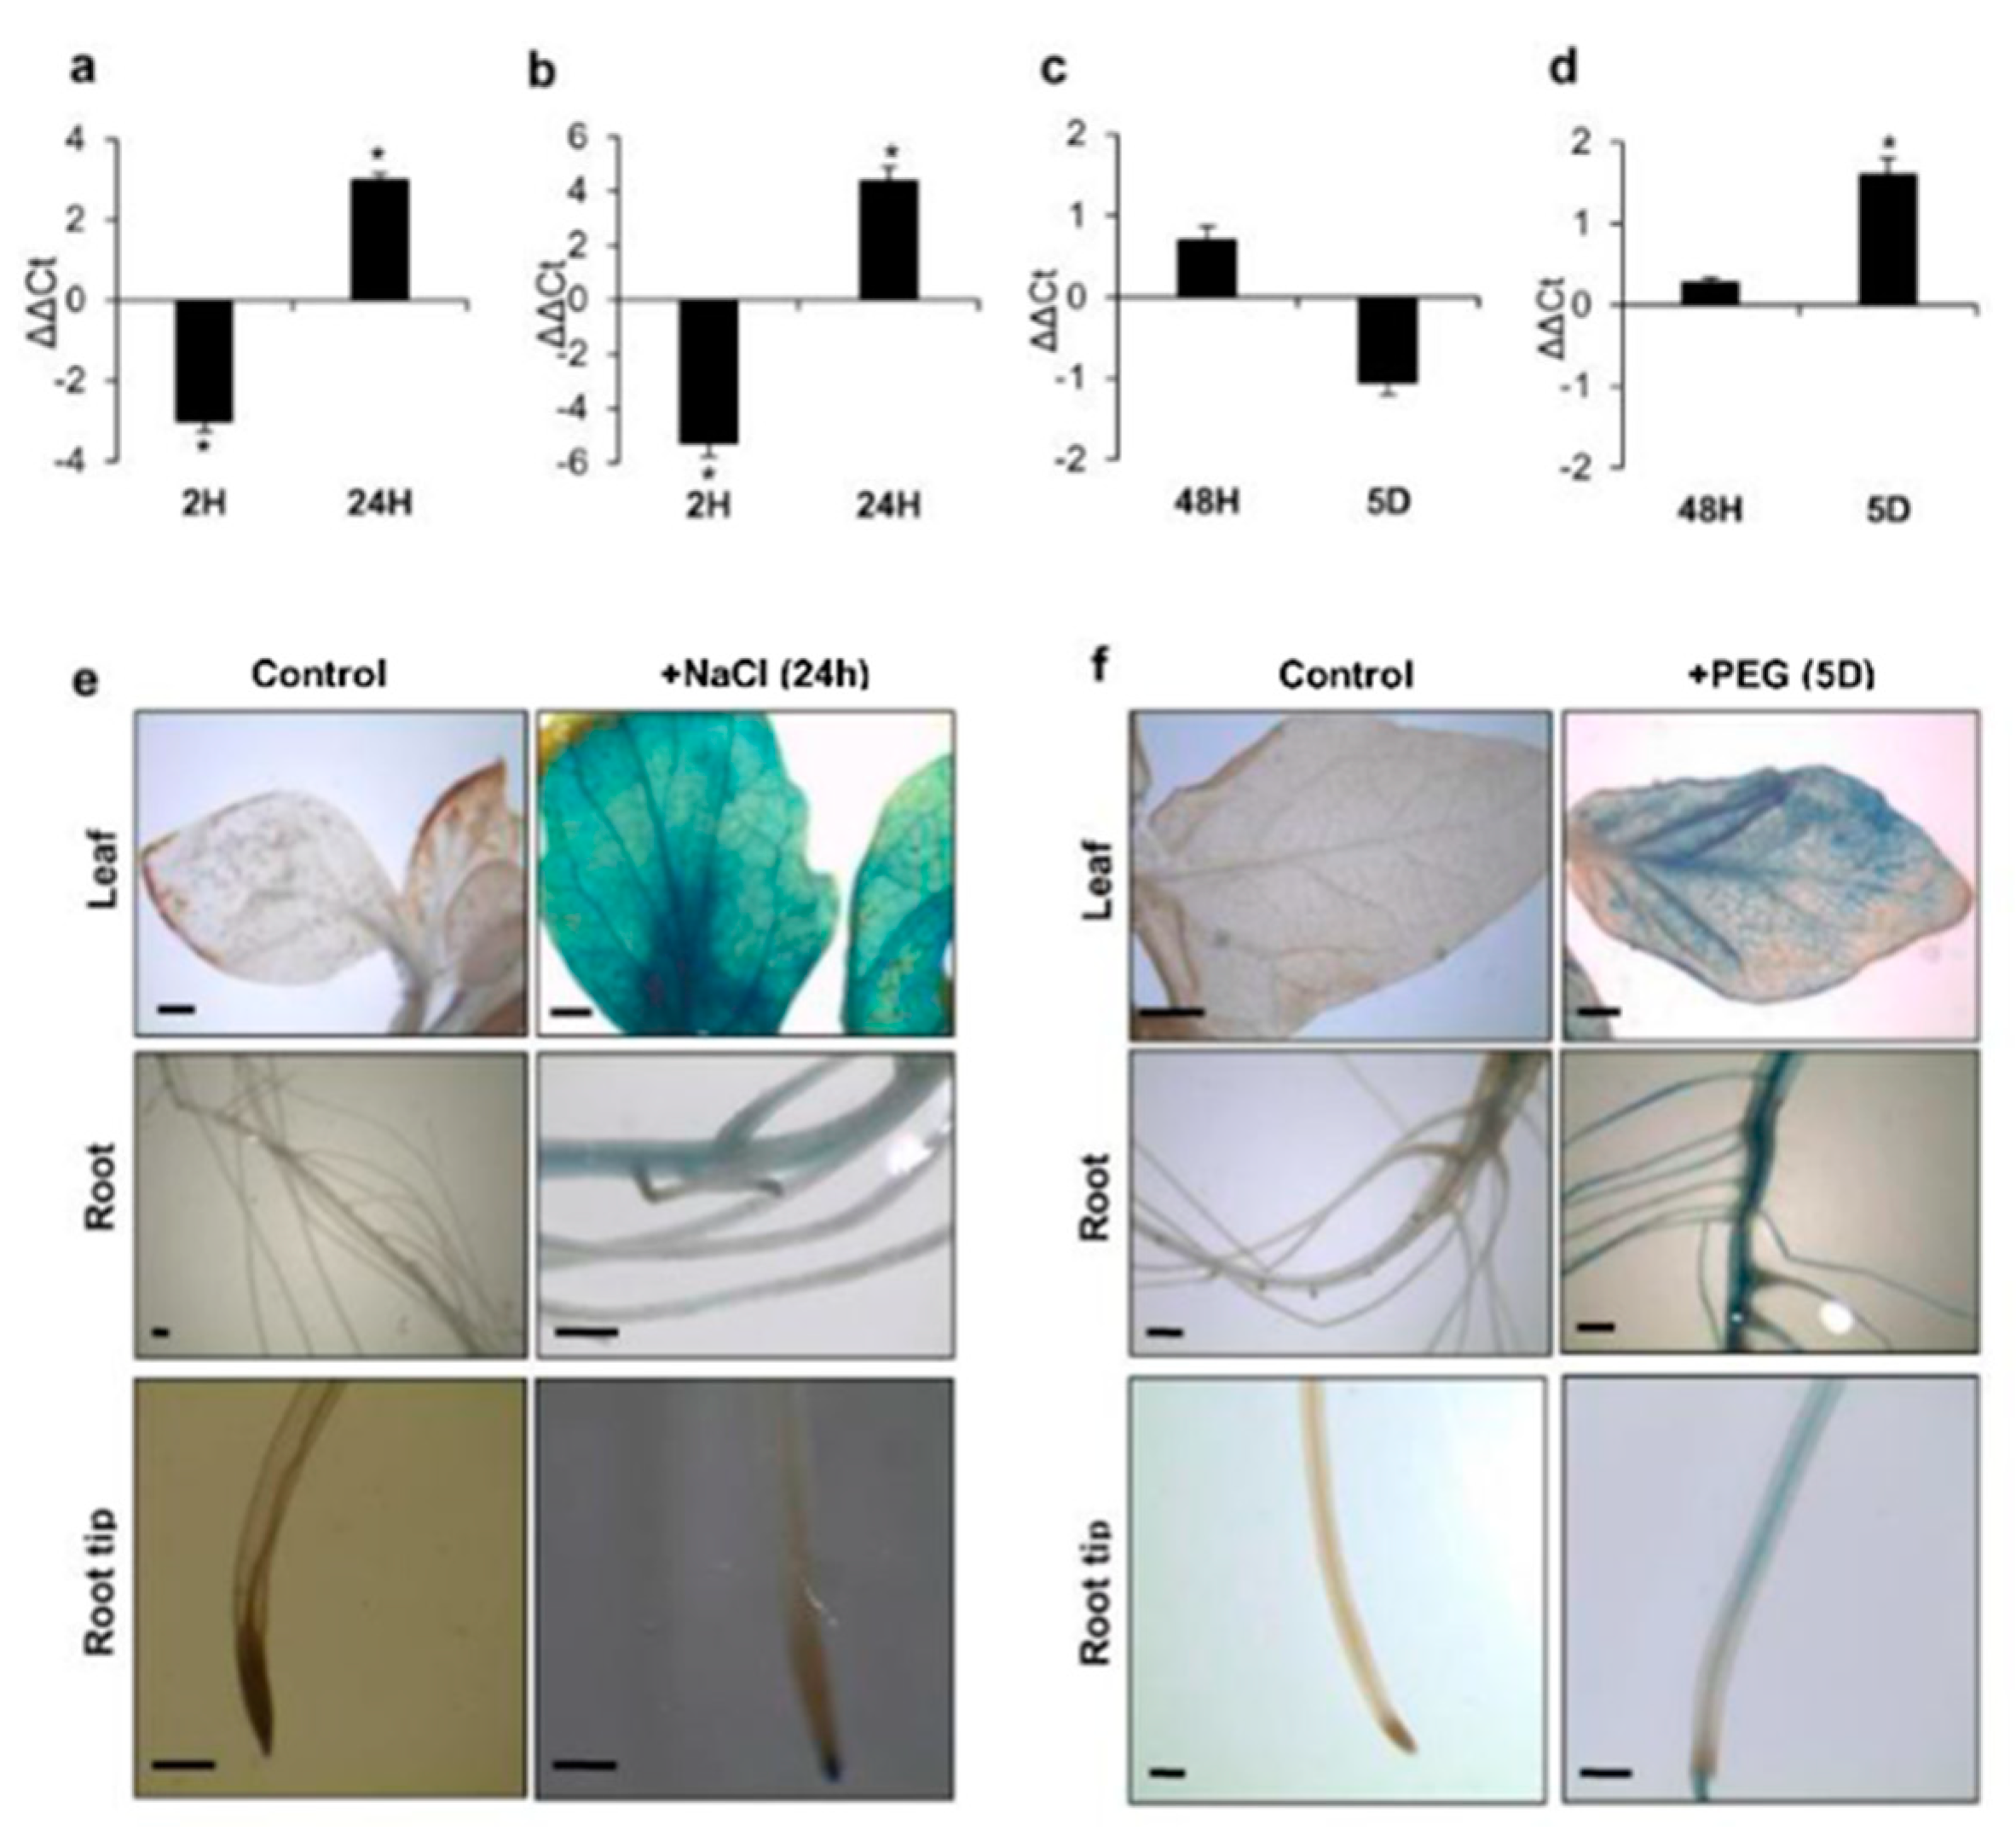
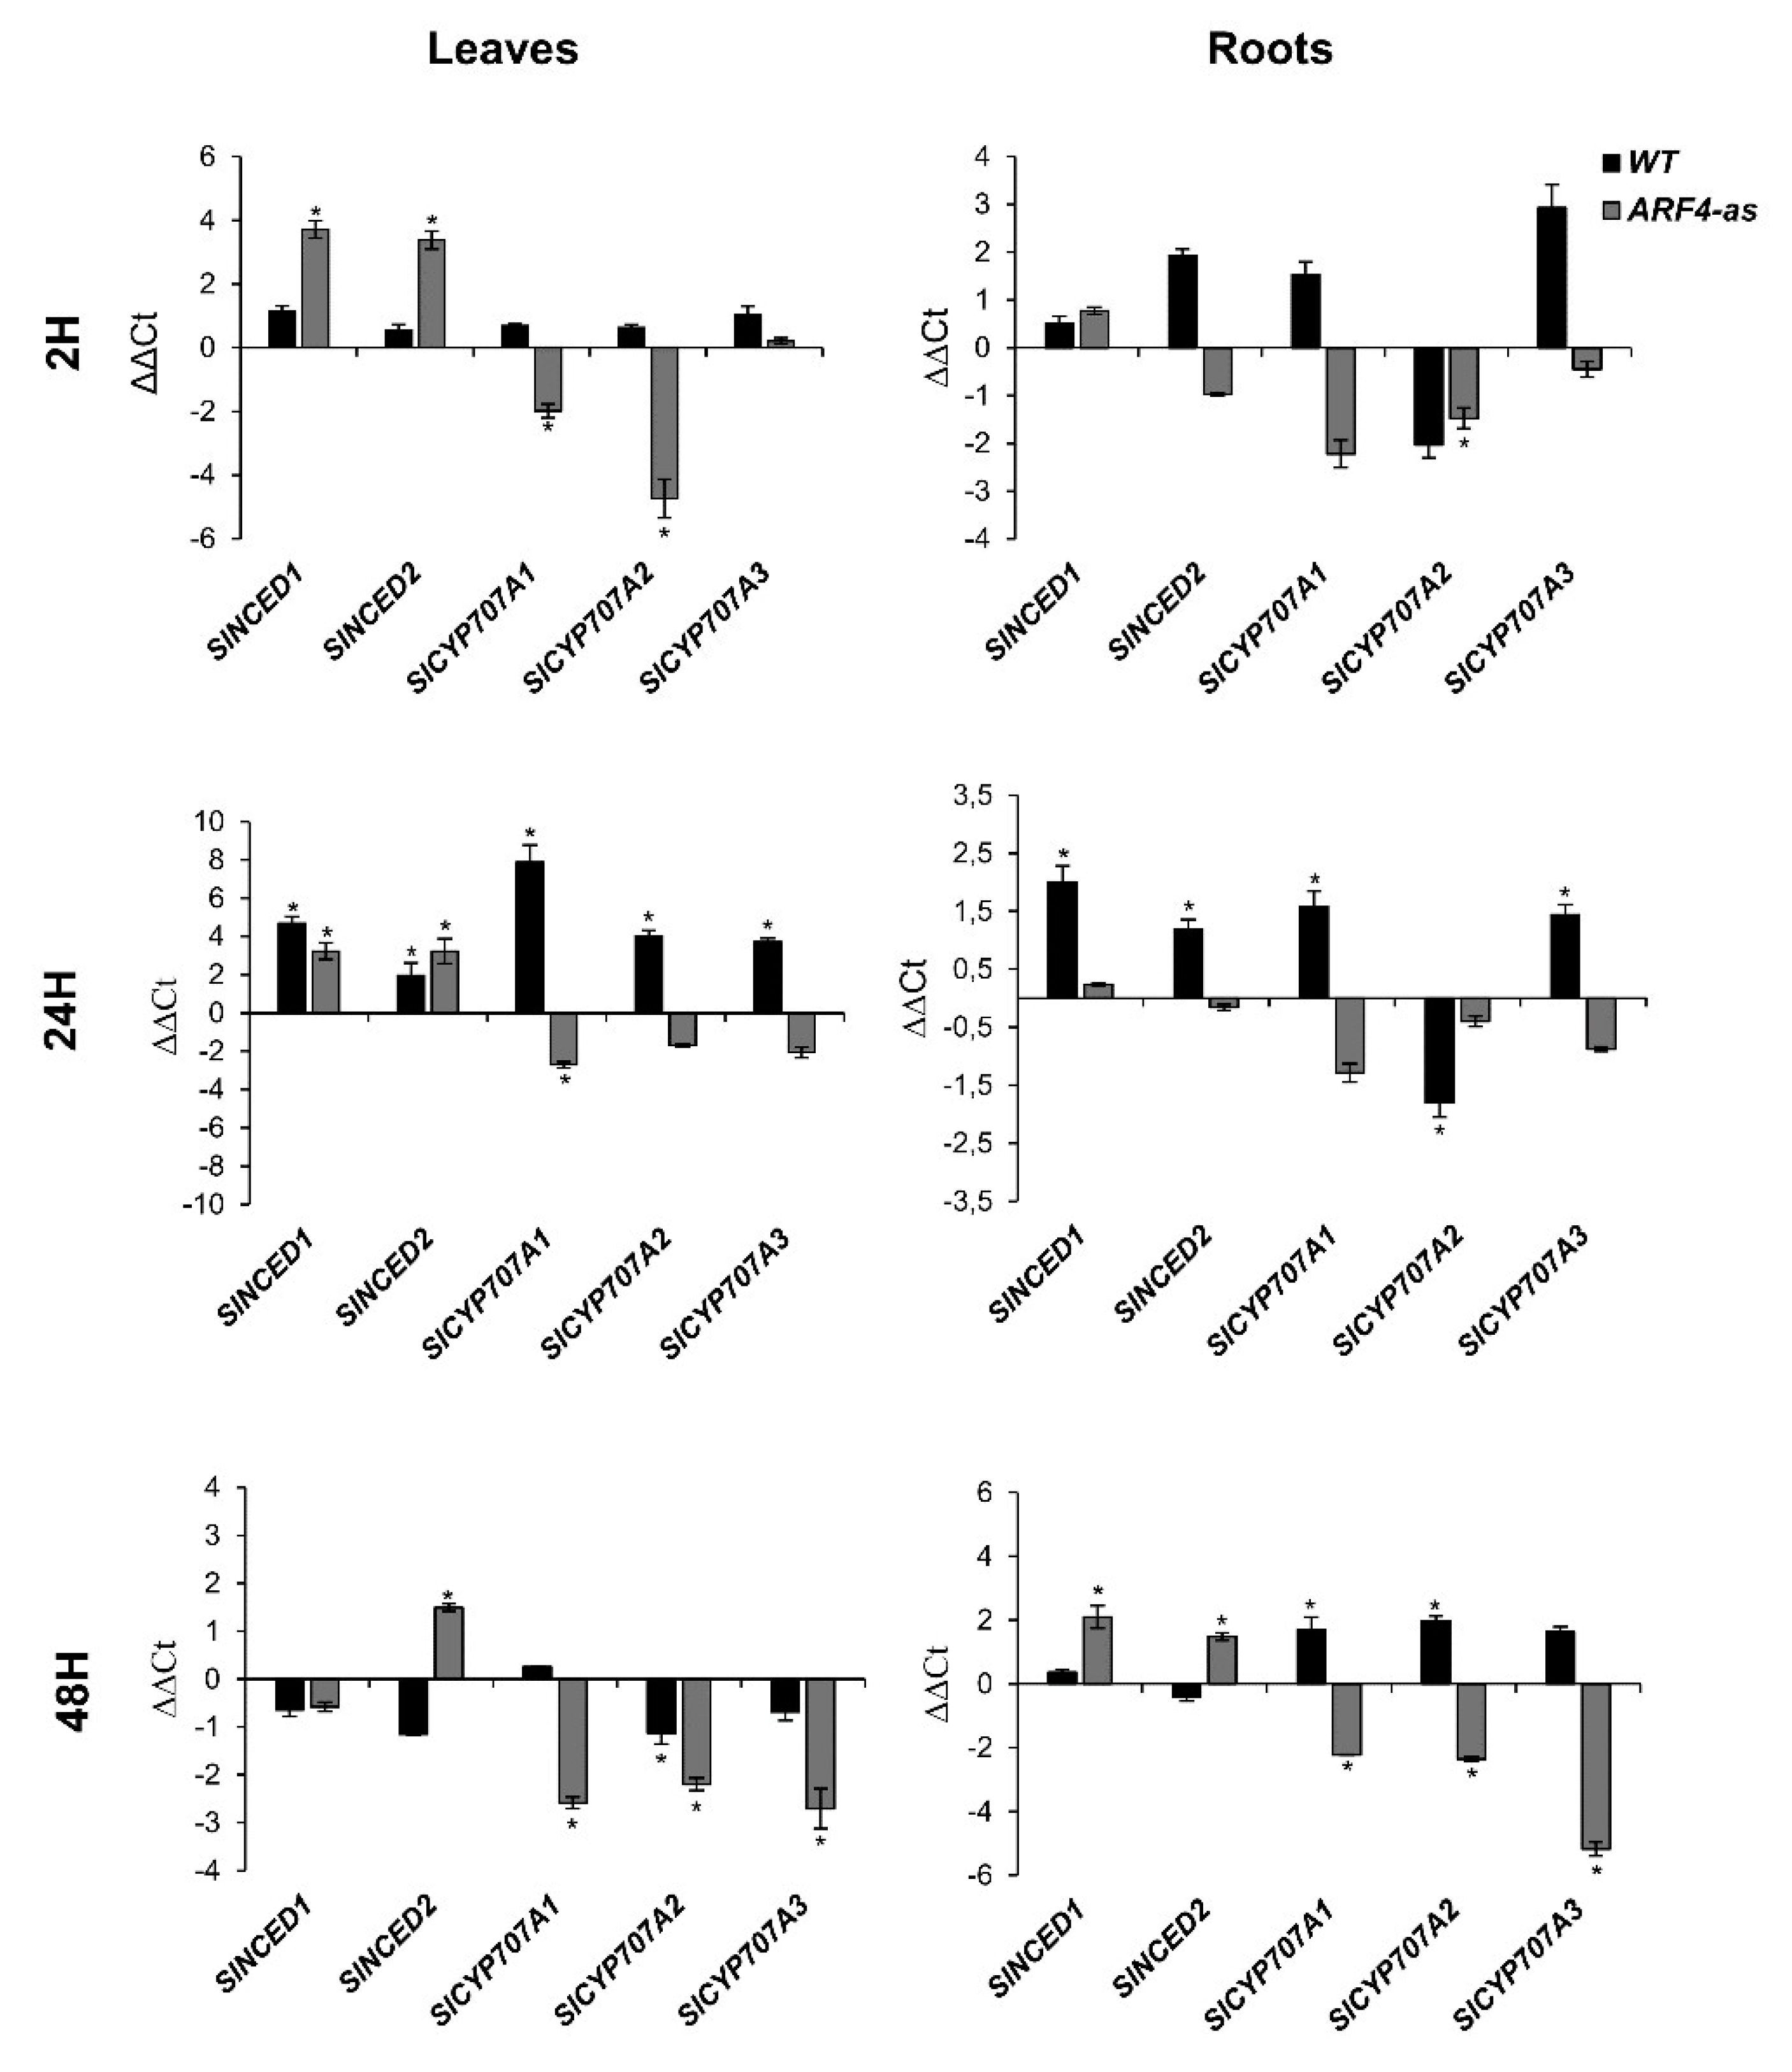
3.2. ARF4 has Altered Expression in Response to Salt and Osmotic Stresses

The expression pattern of SlARF4 was analyzed by real-time PCR in leaves and roots exposed to salt or drought stress. ARF4 gene expression was significantly regulated by salt and drought stresses. SlARF4 expression was significantly repressed in leaves and roots after 2 hours of salt treatment while its expression was significantly induced in leaves and roots after 24 h (Figure 6a,b). During drought treatment, SlARF4 gene was slightly induced after 48 h of stress application in leaves (Figure 6c). In drought stressed roots, SlARF4 was although significantly induced after 5 days of stress exposure (Figure 6d). Tomato lines harboring pARF4::GUS constructs were generated and used to assay in planta analysis of ARF4 expression under stress conditions. We observed strong expression in leaves, primary root and root tip after 24 h of salt stress exposure (Figure 6e). After five days of osmotic treatment, GUS activity was detected in the root system and in different parts of the leaf (Figure 6f).

3.3. ARF4 alters the Plants Response to Salt and Osmotic Stress

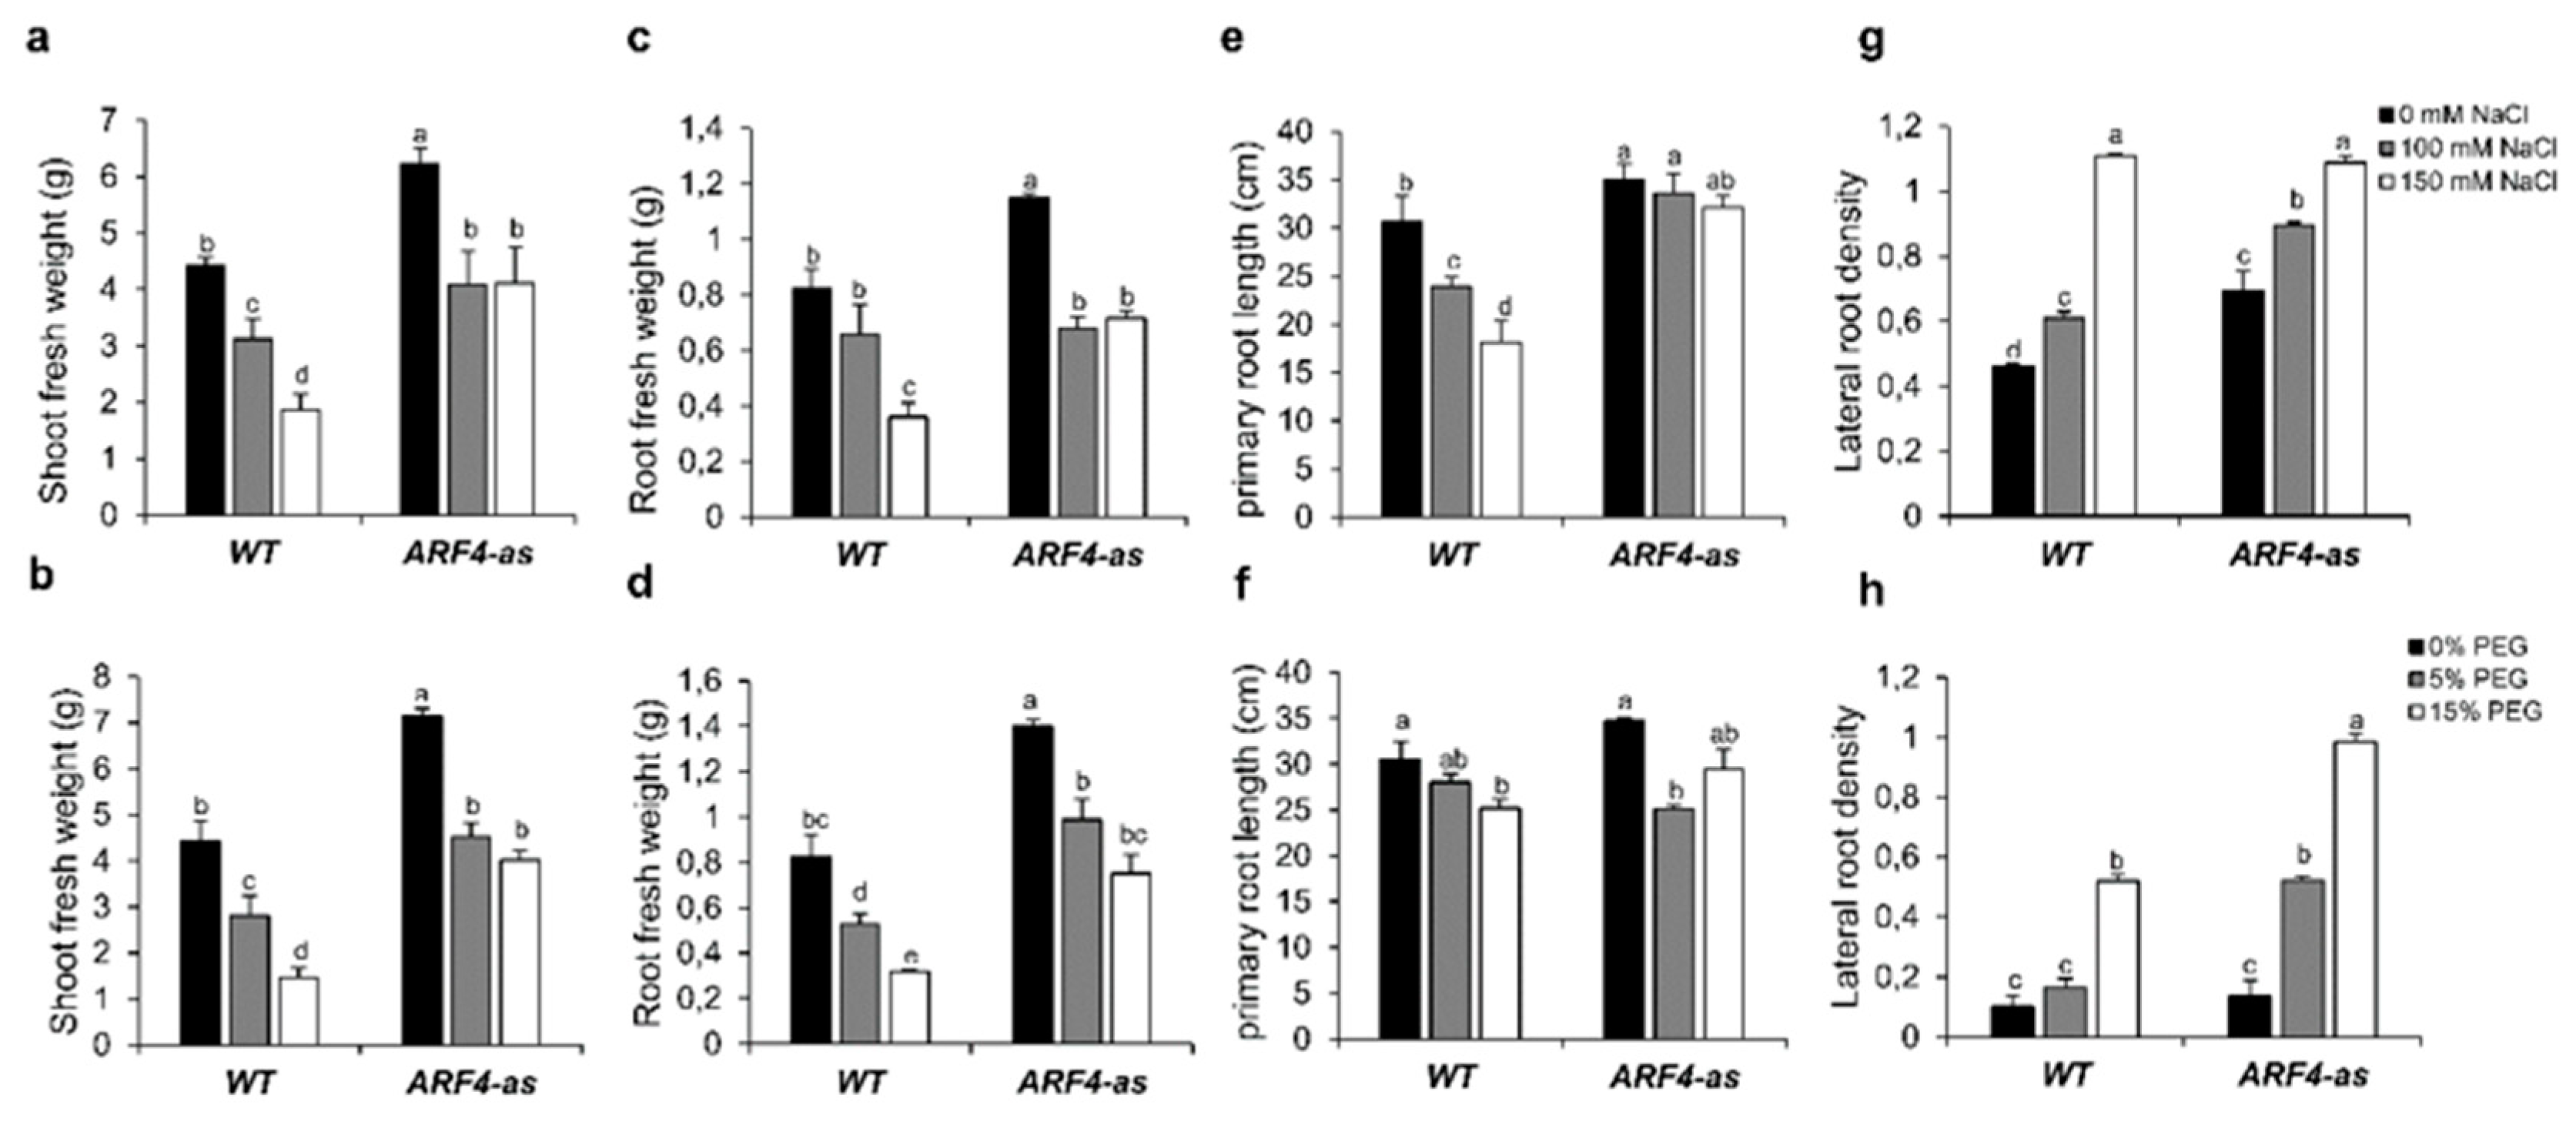
3.3.1. Shoot and Root Fresh Weight are Differentially Altered in ARF4 Transgenic Lines

Shoot fresh weight was investigated in WT and ARF4-as plants under salt and osmotic stress conditions. In the absence of stress, fresh weight was significantly higher in the ARF4-as as compared to WT (Figure 7a). Two levels of NaCl (100 mM and 150 mM) were applied, and both led to reductions in shoot fresh weight in both genotypes. In response to 150 mM NaCl, shoot fresh weight decreased by 60% in WT plants respectively and only by 30% in ARF4-as plants (Figure 7a). In roots, the reduction in the fresh weight was around 55% and 28% for WT and ARF4-as plants lines respectively (Figure 7c). Similarly, to salt stress, osmotic stress affected plant growth. Shoot fresh weight decreased by 66% for WT by 44% for ARF4-as plants when exposed to 15% of PEG 20000 (Figure 7b).
Root fresh weight deceases significantly with the increase of PEG concentration. The decrease reached 57% in WT plants while the reduction was around 40% in ARF4-as in response to 15% of PEG20000 (Figure 7d).

3.3.2. Root Development and Density are Less Affected in ARF4-as Plants

Root development was investigated in WT and ARF4-as plants in response to different concentrations of NaCl or PEG. Our results showed a significant reduction in primary root length in WT (by 40% in salt stress condition and by 17% in response to osmotic stress) while the decrease was nearby 8% and 12% in ARF4-as plants in response to salt and osmotic stress respectively (Figure 7e,f).
Root density was also investigated in the three lines under salt and osmotic stress conditions. Our results showed that root density significantly increased with the increase of NaCl or PEG concentrations in WT and in ARF4-as plants (Figure 7g,h). Root density increases by 57% in WT and 120% in ARF4-as., respectively. In response to osmotic stress, both plant lines showed a significant increase in root density. At 5% of PEG 20,000, root density increased by 50% and 130% in WT and ARF4-as plants respectively.

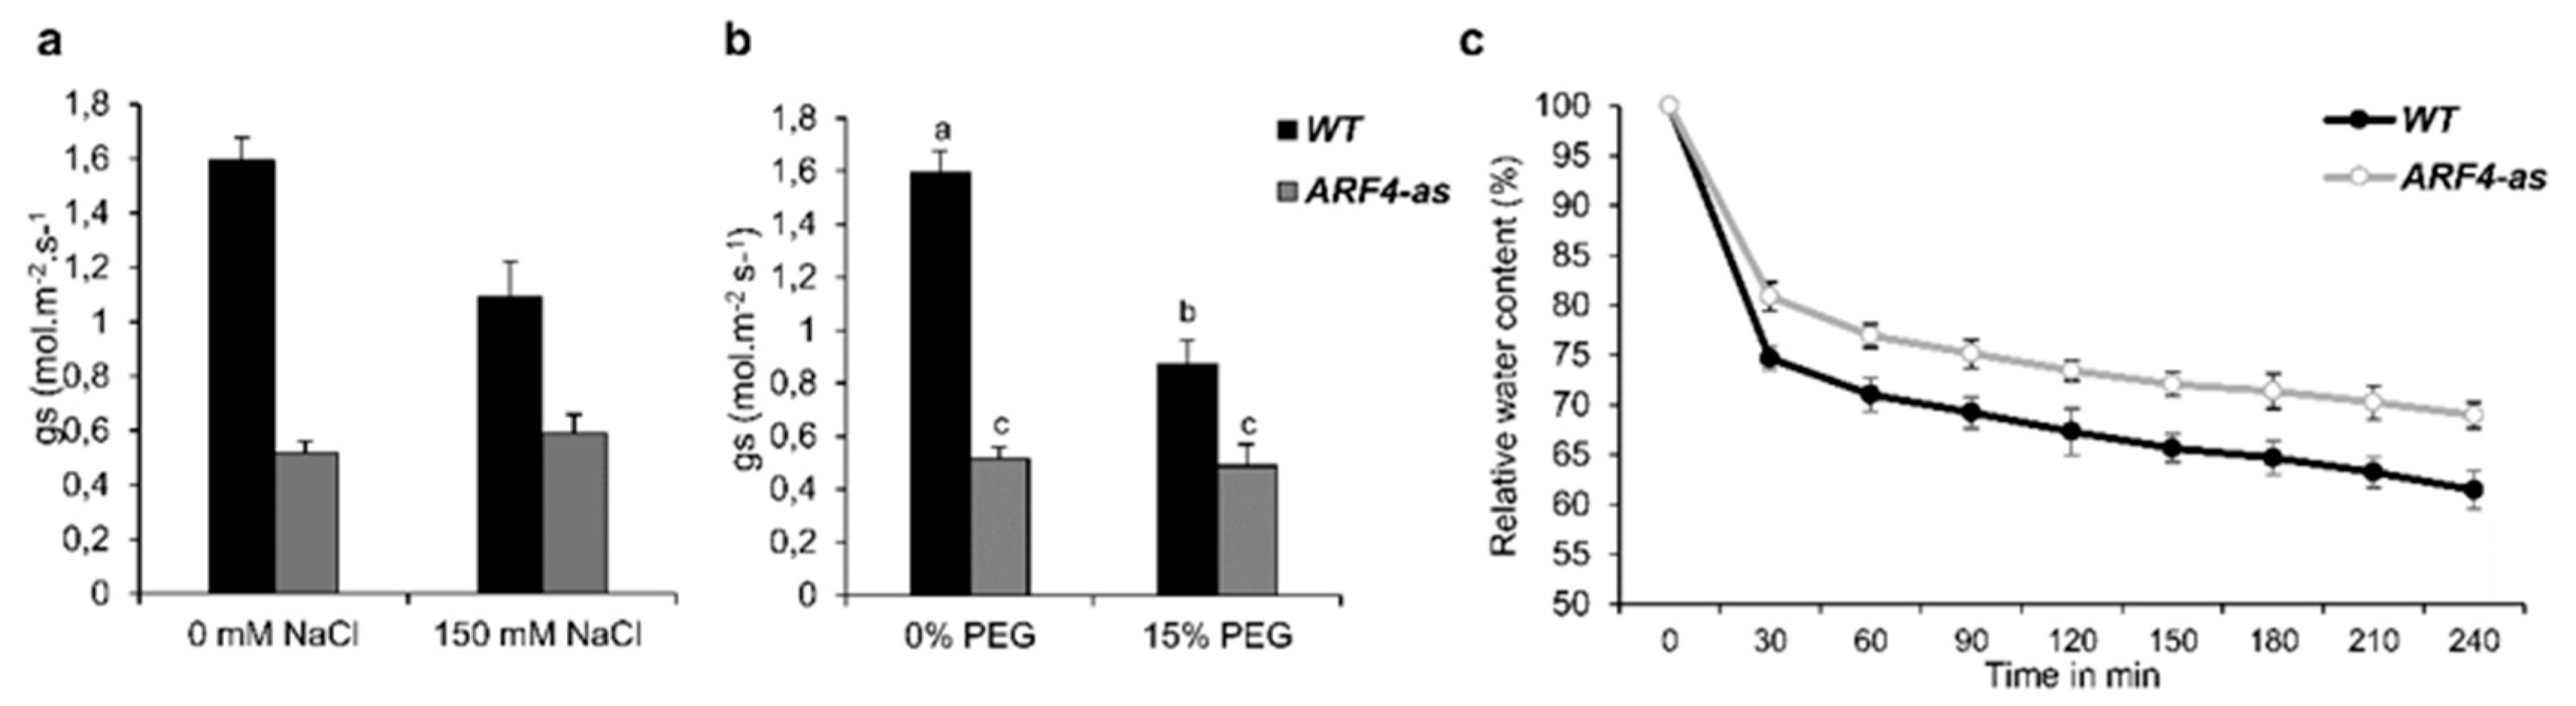
3.4. ARF4-as Plants are Less Affected by Salt and Osmotic Stress

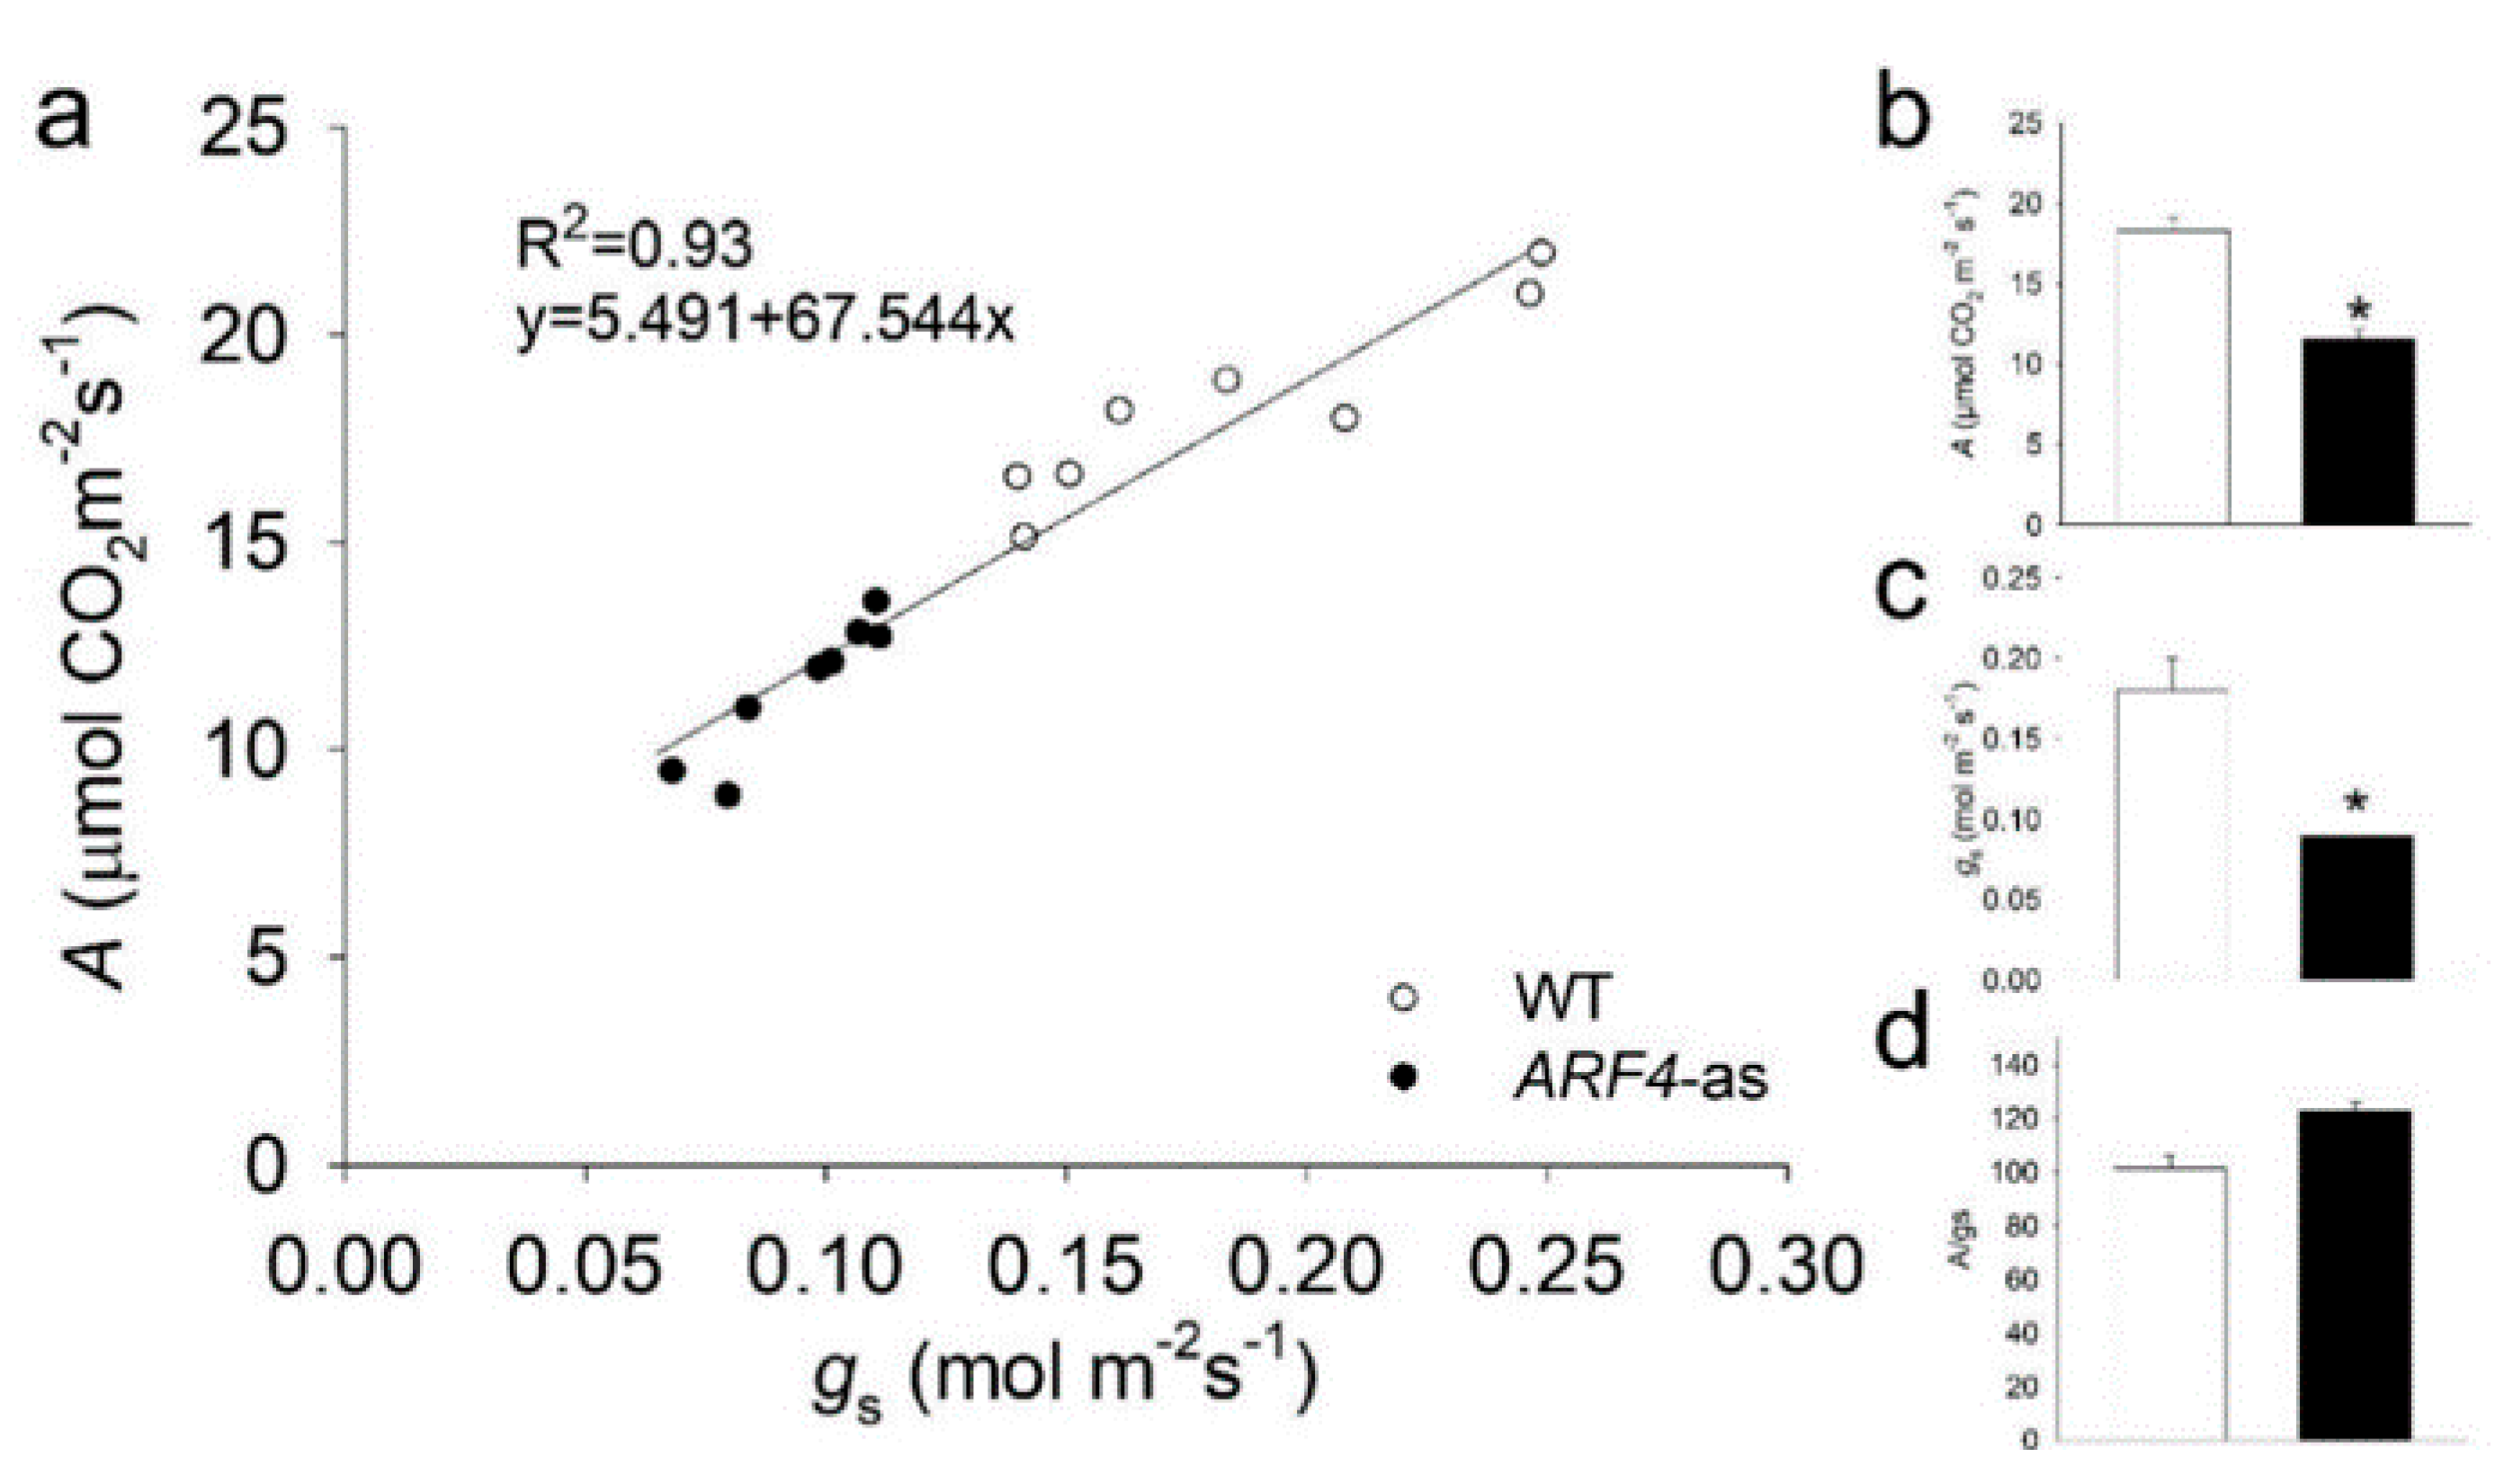
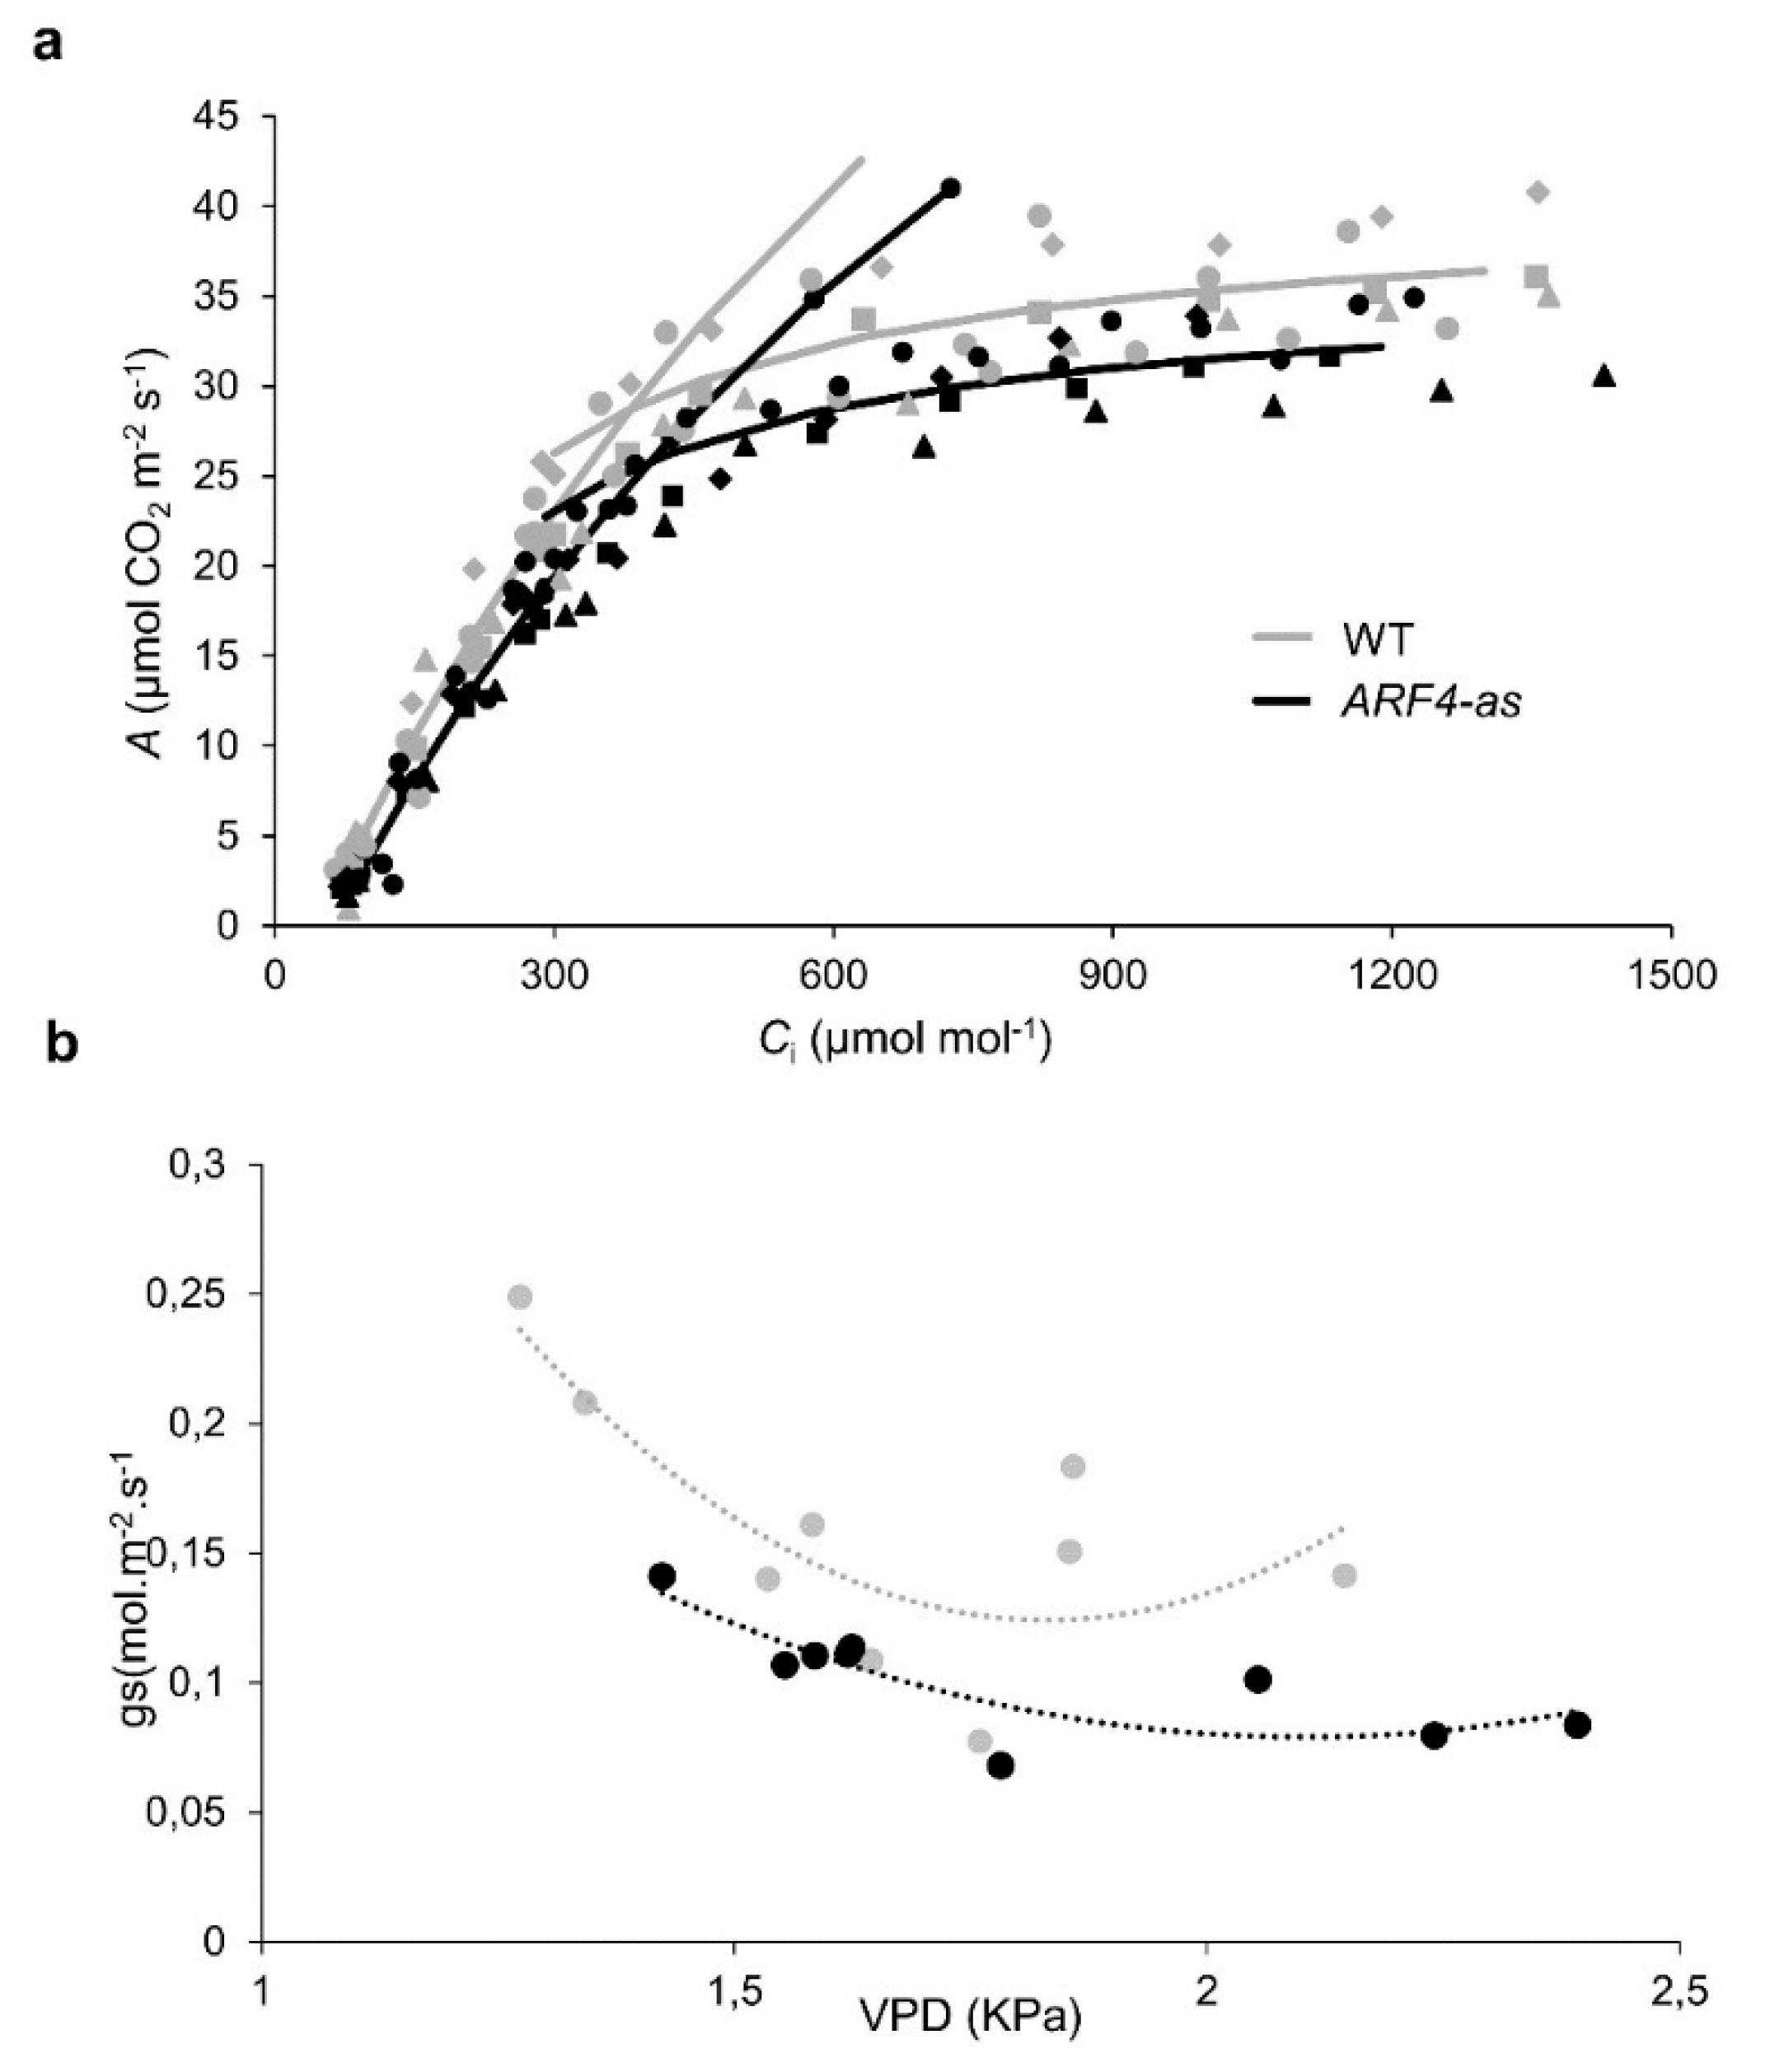
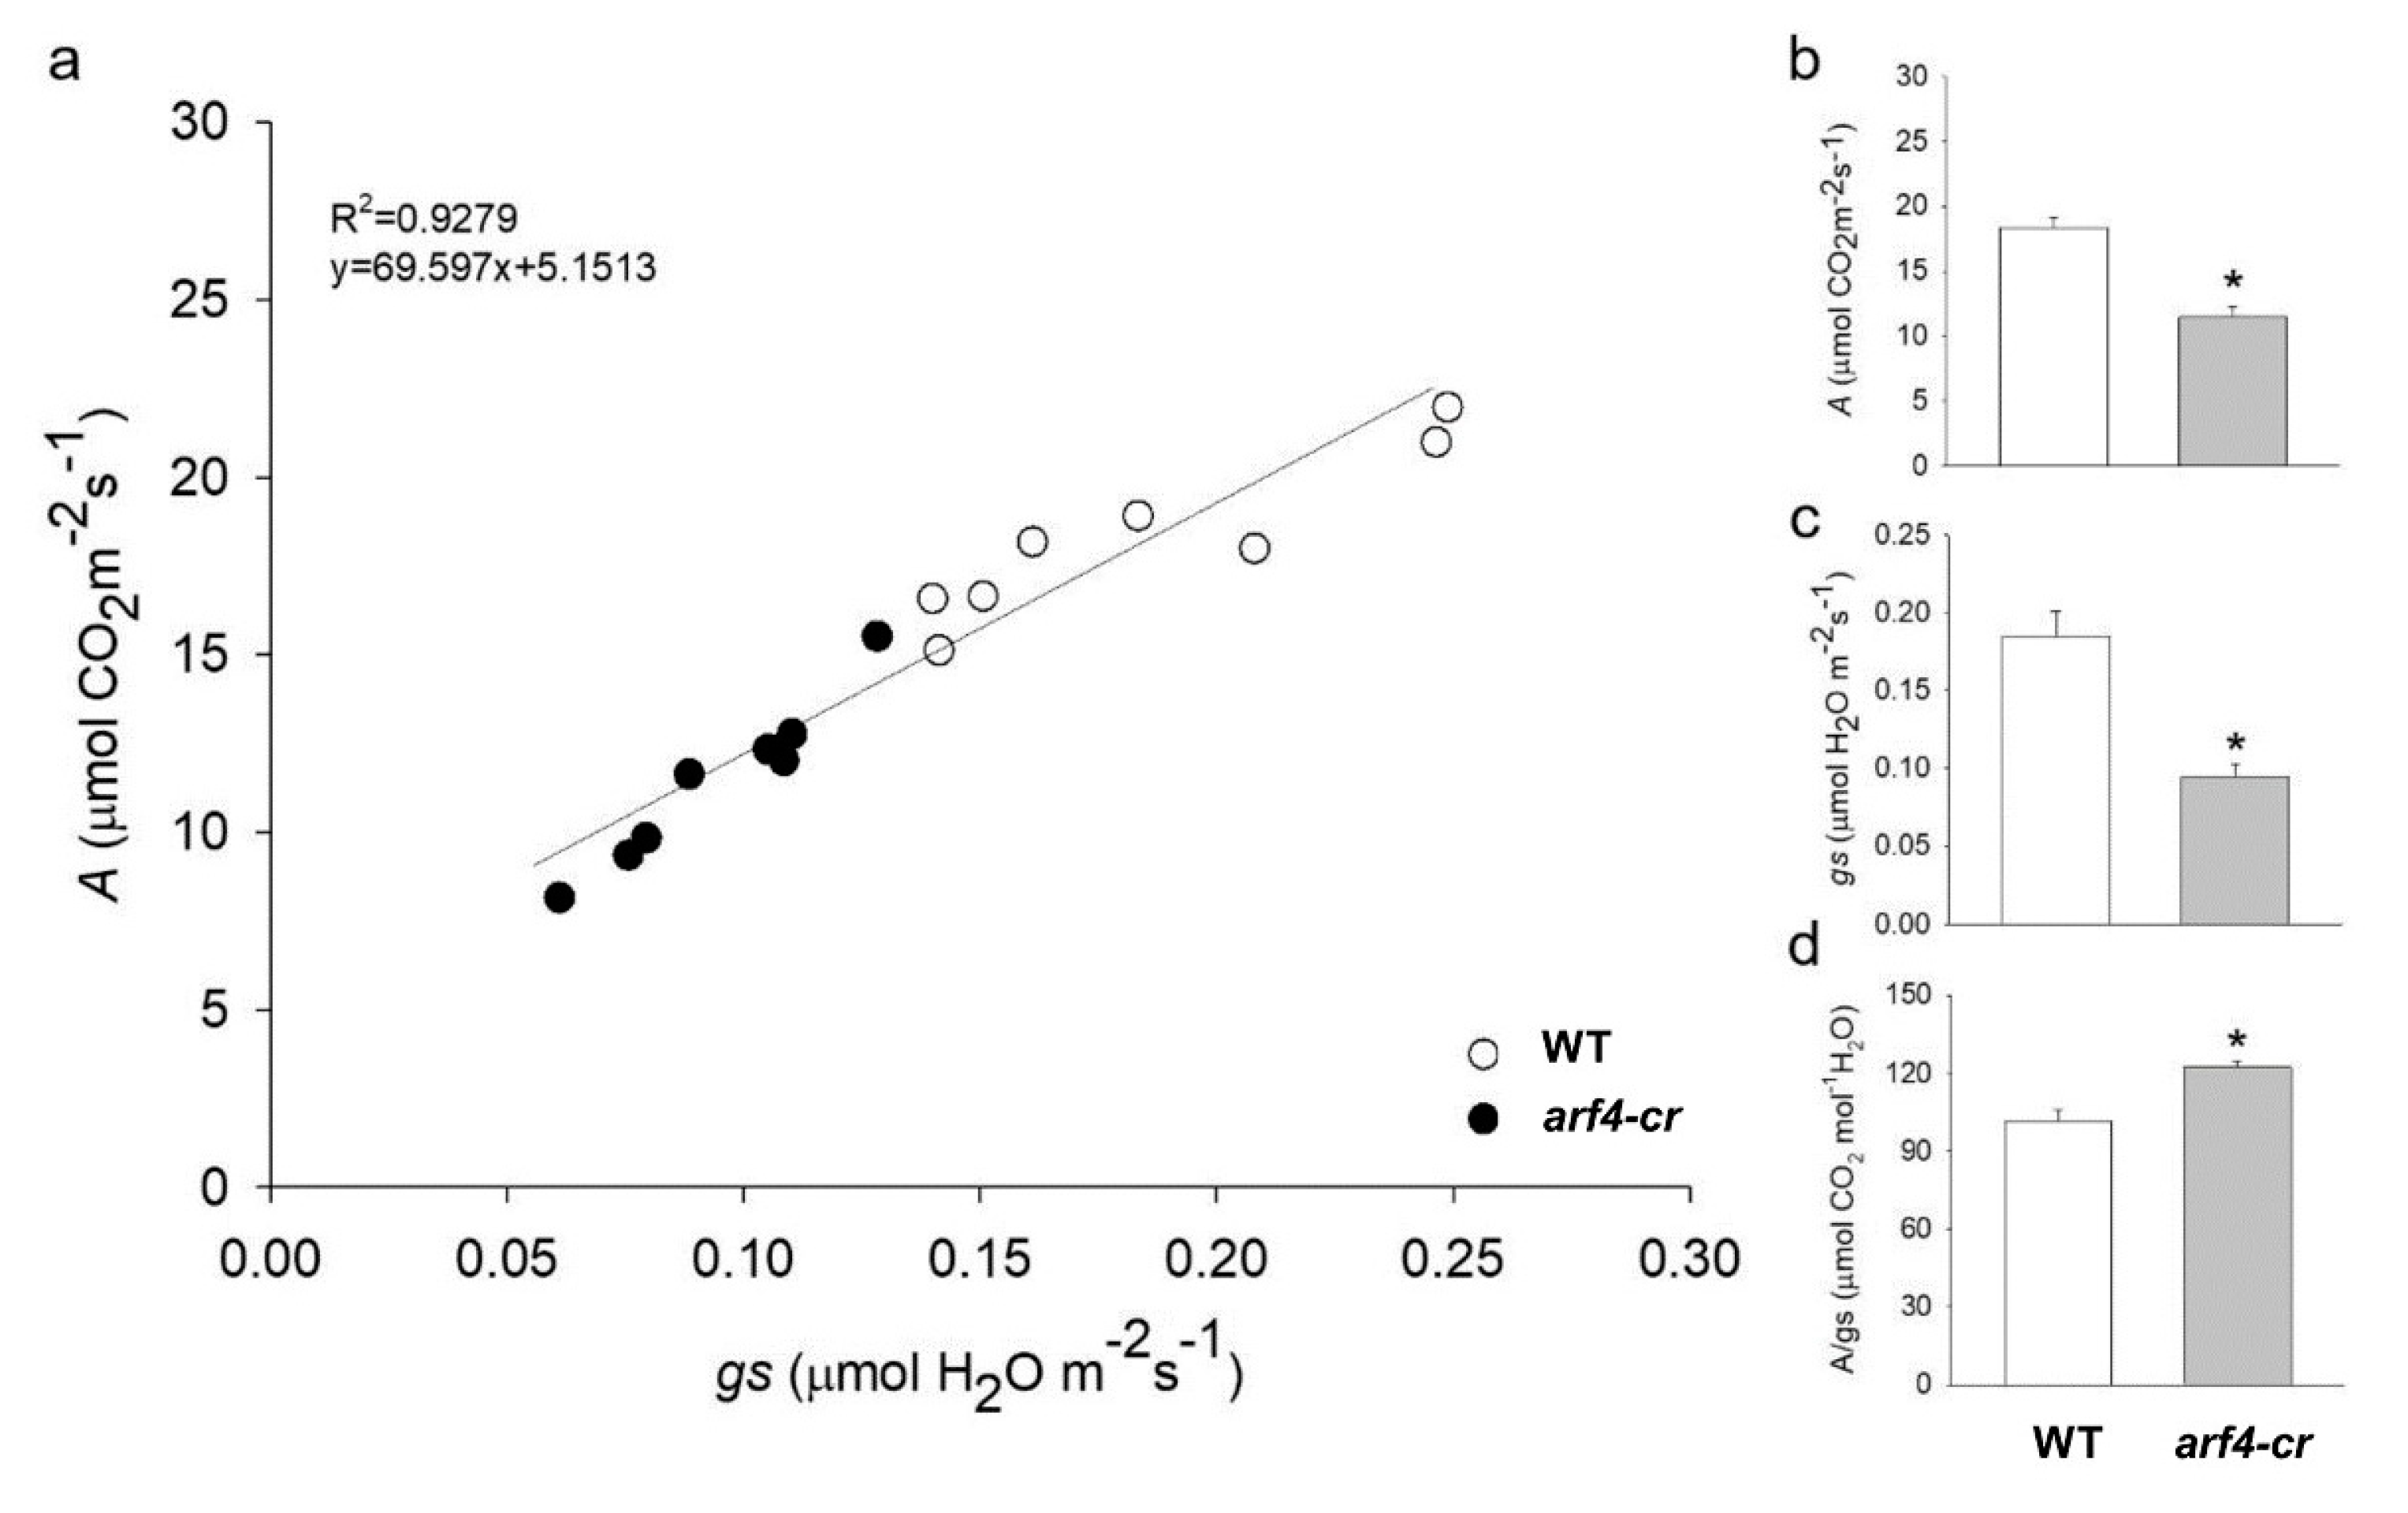
3.4.1. Photosynthesis is Less Affected in ARF4-as Plants

Photosynthesis is among the primary processes to be affected by salinity and drought stress [37]. Our results showed that total chlorophyll content decreased significantly in WT plants exposed to different concentrations of NaCl while no significant changes in chlorophyll content was detected in ARF4-as plants (Figure S3). At 150 mM of NaCl, total chlorophyll content decreased only by 4% in the ARF4-as plants as compared to the control. Meanwhile, the diminution of total chlorophyll content was around 62.8% respectively in WT at 150 mM of NaCl compared to the control. The drastic decline in total chlorophyll content was also observed as a result of osmotic stress application on WT plants. The reduction in total chlorophyll content averaged the 37% in WT plants cultivated at 15% of PEG 20,000 respectively (Figure S3). Meanwhile, total chlorophyll content increased significantlyARF4-as in response to osmotic stress. In fact, the average of chlorophyll content was 1.2 times higher in ARF4-as at 15% PEG 20,000 than at 0% PEG 20,000.

3.4.2. Sugars are Highly Accumulated in ARF4-as Plants in Stress Conditions

Soluble carbohydrates content was next investigated in ARF4-as and WT plant lines in response to different concentrations of NaCl or PEG. In response to salt stress, leaf soluble sugar content decreased by 57.5% in WT plants and was increased by 146% in ARF4-as line exposed to 150 mM of NaCl for 2 weeks (Figure S3). In roots, soluble sugar content was also decreased in WT by 49.4%, while an increase around the 191% in soluble sugar content was detected in ARF4-as plants. PEG induced osmotic stress imposed to plants significantly decreased soluble sugar contents at all the stress levels in WT and ARF4-as plants. Leaf soluble sugar content decreased by 42.8% and 18% respectively in WT and ARF4-as plants exposed to 15% of PEG 20,000. In roots, PEG application induced a significant decrease in soluble sugar content by 41.1% (at 15% of PEG 20,000) in WT plants respectively. Meanwhile, a significant increase in soluble carbohydrates content was although reported in ARF4-as plants and reached the 67% at 15% PEG 20,000 as compared to the control.
Carbohydrates produced in leaves during photosynthesis are transported throughout the plant by SUTs in order to support plant growth. The SUT1 proteins are involved in the movement of sucrose into and out of the source and sink tissues and through the phloem via apoplastic pathways [38]. Investigating the expression of the sucrose transporter SlSUT1 under salt and osmotic stresses had revealed that its expression was induced in WT and ARF4-as leaves and roots exposed to salt stress (Figure S4). These findings were also detected in response to osmotic stress. In osmotic stressed leaves, SlSUT1 was significantly induced in WT and ARF4-as plants. In roots, the expression of SlSUT1 was also up-regulated significantly.

3.4.3. ARF4-as Plants Showed Lower Stomatal Conductance

Stomata play a key role in plant response to environmental changes as they control both water loss and CO2 uptake [39]. Stomatal conductance was estimated in WT and ARF4-as plants in salt or osmotic stress (Figure 8a,b). Under normal conditions, ARF4-as plants exhibited low stomatal conductance as compared to WT plants. Salt and osmotic stress application induces a significant decrease in stomatal conductance in WT. In fact, the reduction in stomatal conductance observed in the WT was around 32% and 46% in response to salt and osmotic stress respectively. Meanwhile, no significant changes in stomatal conductance were detected in ARF4-as plants, that still maintained the same values of stomatal conductance observed in normal conditions.
Stomatal closure can be trigged by various internal and external factors. Schultz (2003) have shown that the decline in leaf water potential can trigger stomatal closure under stressful conditions [40]. Relative water content (RWC) was investigated in WT and ARF4-as plants. A remarkable decrease in RWC was observed in both lines (Figure 8c). Up to 25% and 15% of water losses was recorded during the first 30 min of dehydration in WT and ARF4-as plants respectively. RWC reached 65% in WT and after 3 h of dehydration while a 28% decrease of water losses was found in ARF4-as plants.

3.4.4. ARF4-as Plants Exhibited A High ABA Content

As ABA is the key hormone for regulating stomatal aperture and thus RWC [41], endogenous ABA content of 5 weeks ARF4-as and WT plants in normal or under salt and osmotic conditions were then measured in leaf tissues. Our results showed that the ABA content in ARF4-as increased by 120% and 101% under salt and osmotic stress conditions respectively whereas in WT plants increased by only 20% in salt conditions and decreased by 26% in PEG treatment (Table 1).
Endogenous ABA content is controlled by to the balance between its biosynthesis and its degradation. In tomato, two genes, SlNCED1 and SlNCED2, encoding 9-cis-epoxycarotenoid dioxygenases are responsible for ABA biosynthesis, whereas SlCYP707A1, SlCYP707A2, SlCYP707A3 and SlCYP707A4 encoding ABA 8′-hydroxylase are responsible for ABA catabolism [42]. Investigating the expression of these genes in WT and the ARF4-as plants revealed that their expression was significantly regulated by salt or osmotic stress application (Figure 9). Indeed, SlNCED1 expression was significantly induced in ARF4-as leaves after 2 h and 24 h of salt stress exposure while no significant changes was observed in roots. In WT, the expression of SlNCED1 was significantly up regulated in leaves and roots after 24 h of salt treatment. In response to osmotic stress, the expression of SlNCED1 was significantly up-regulated in ARF4-as roots while no significant change in SlNCED1 expression was detected in WT plants. SlNCED2 expression was significantly induced in the ARF4-as leaves after 2 h and 24 h of salt application and in WT after 24 h. A significant increase in the expression of SlNCED2 was detected in ARF4-as plants in response to osmotic stress.
The expression pattern of SlCYP707A1, SlCYP707A2 and SlCYP707A3, key ABA degradation genes was also assessed in ARF4-as and WT plants under salt and osmotic stress conditions (Figure 9). Quantitative RT-PCR results showed that the expression of the ABA metabolism genes was up-regulated in WT leaves after 2 h and 24 h of salt stress exposure. In roots, the expression of SlCYP707A1 and SlCYP707A3 was up regulated in WT plants in response to salt stress while a significant repression was reported in the expression of SlCYP707A2. Although, the expression of the ABA metabolism genes expression was repressed in the ARF4-as salt stressed roots. In response to osmotic stress, the expression of CYP707A1, CYP707A2 and CYP707A3 was repressed in ARF4-as plants while their expression was up regulated in WT roots and downregulated in leaves.

3.5. Antioxidant Genes Expression is Altered in Response to Salinity and Osmotic Stress

3.5.1. Cat1 (Catalase) Expression in Response to Salt and Osmotic Stress

Catalases are tetrameric heme-containing enzymes with the potential to directly degrade H2O2 into H2O and O2 and essential for ROS detoxification [43]. In angiosperms, catalase is encoded by three genes: Cat1, Cat2 and Cat3 [44]. We investigated Cat1 expression in WT and ARF4-as plants exposed to salt and osmotic stresses. Cat1 expression was induced in ARF4-as plants exposed to salt stress. A high up regulation in Cat1 expression was detected in WT roots in response to salt stress (Figure S5). In osmotic stressed leaves, Cat1 expression was significantly induced in WT while a remarkable but not significant repression was observed in ARF4-as plants. Meanwhile, Cat1 gene expression was highly up regulated or repressed in WT and ARF4-as plant roots respectively.

3.5.2. SOD (Superoxide Dismutase) Expression in Response Salt and Osmotic Stress

Superoxide dismutase (SOD) is an enzyme that belongs to the family of metalloenzymes ubiquitous in all aerobic organisms. It is one of the first defenses against ROS induced damages by catalyzing the removal of O2 by scavenging it into O2 and H2O2 [43,44]. Based on the metal ion it binds, SOD are classified into three isozymes; Mn-SOD (in mitochondria), Fe-SOD (in chloroplasts) and Cu/ZnSOD (in cytosol, peroxisomes and chloroplasts) [43]. Investigating the expression of Cu/ZnSOD revealed that its expression was remarkably repressed in WT plants subjected to salt and osmotic stresses. Meanwhile, Cu/ZnSOD gene expression was induced in ARF4-as leaves in response to salt and osmotic stresses while its expression was repressed in the roots (Figure S5).

3.5.3. mdhar (Monodehydroxyascorbate Reductase) Expression in Response to Salt and Osmotic Stress

Monodehydroxyascorbate reductase (MDHAR) is another enzymatic antioxidant indirectly involved in the ROS scavenging through regenerating ascorbic acid, indispensable for the degradation of H2O2 by the APX enzyme [43]. Investigating the expression pattern of mdhar gene in salt stress conditions revealed a significant up regulation in ARF4-as leaves and roots while its expression was repressed in WT plants (Figure S5). In response to osmotic stress, the expression of mdhar was slightly upregulated in ARF4-as leaves. In roots, mdhar is significantly up regulated in ARF4-as plant line.

3.6. SlARF4-Crispr Mutant Exhibited Similar Alteration in Growth and Stomatal Functions Observed in ARF4-as Plants

SlARF4 mutants were also generated using CRISPR-Cas9 technology. Two target sequences were located in the SlARF4 DBD domain and guide RNAs designed to target them. The transformants from T1 generation of line 108 were genotyped (by PCR and DNA sequencing). Based on PCR results, plants #5, #6 and #7 yielded a DNA fragment with a 49bp DNA deletion. The Cas9 transgene was segregated out in plant #5 while still bearing the desired mutation of SlARF4 gene. The presence of Cas9 gene in arf4-cr mutants was confirmed in two of the three randomly analyzed plants (Figure 10a). DNA sequencing of ARF4-PCR product from plant #5 and #6 revealed that plant #5 harbored a single fragment type containing the expected 49bp DNA deletion. However, only four out of 10 PCR clones from plant #6 hold the 49bp deletion in the DBD domain while the remaining 6 PCR clones showed although a small deletion in both target regions (Figure 10b). At the morphological level, the T1 generation plants showed dramatic up curling phenotype, similar to ARF4-as plants (Figure 10c, d).
Besides the leaf curling phenotype, the arf4-cr mutant (#5) showed a significant decrease in leaf, root and stem dry weight as compared to its WT siblings (Figure 11a–c). Leaf area was also significantly lower in SlARF4-Crispr plants (Figure 11d). Moreover, as expected, net CO2 assimilation rate (A) and stomatal conductance (gs) was significantly lower in arf4-cr plants than in WT while water use efficiency was significantly higher in arf4-cr mutant (Figure 12). Regarding the agronomical traits, plant productivity and quality were not affected by knoking out SlARF4 with CRISPR technology. Yield and fruit fresh weight of arf4-cr plants were slightly but not significantly higher as compared to WT while equatorial and polar diameter of arf4-cr fruits were significantly higher (Figure S6). arf4-cr plants showed similar growth and stomatal variations compared to ARF4-as plants mainly in stem weight, root weight, CO2 assimilation and stomatal conductance (Figure 2, Figure 4 and Figure S3). Thus, these results pointed out the efficiency of CRISPR technology as a substitute to the antisense technology for gene manipulation.

4. Discussion

In the face of a global scarcity of water resources and the increased water and soil salinization, abiotic stresses present major challenges in sustaining crop yield. Plant tolerance to these stresses relies on the implementation of molecular mechanisms for cellular adjustments, including signal perception and transduction cascades, transcriptional networks and adaptive metabolic pathways. Plant hormones such as ABA, ethylene and SA play an important role in mediating plant responses to stresses. Auxin, the key regulator of many aspects of plant growth and development, could be a key player in plant response to biotic and abiotic stress. ARFs play crucial role in auxin signaling. ARF4 is involved in the regulation of several processes such as lateral root development, fruit quality and development [14,15,45]. Here, we demonstrated that the downregulation of ARF4 confers tolerance to salt and osmotic stress. Interestingly, even under stress conditions, ARF4-as plants show (i) a normal plant development, (ii) high chlorophyll content along with a significant accumulation of sugars, (iii) an increase in ABA content and a higher WUE, (iv) a significant upregulation of antioxidants and thus (iv) an enhanced stress tolerance compared to WT plants. These multiple fitness benefits obtained by downregulating ARF4 in plants constitute a desirable trait for horticultural crops.
Successful plant growth relies on the plasticity in leaf anatomical characteristics, which enables plants to cope with diverse stress environments [46]. The transcriptional downregulation of ARF4 leads to severe leaf curling along the longitudinal axis which was consistent with that observed in DR12-ASL lines generated in the Kemer cultivar by Jones et al. (2002) and those obtained in Micro Tom by Sagar et al. (2013) [14,15]. Leaf rolling is a one of the most common responses to water stress [47]. It has been reported that greater leaf rolling may be an important indicator linked to osmotic tolerance and may have a positive impact on crop yield under water stress conditions [48]. Plants with a leaf rolling mechanism exhibit a resistance to osmotic and high temperature and had higher WUE. This was explained by the fact that leaf rolling reduced transpiration rate [47].
Plants’ tolerance to abiotic stress depends also on their ability to adjust the relationship between water, transpiration, photosynthesis and water use efficiency through stomatal changes in order to maximize CO2 assimilation [49]. In fact, the decrease in stomatal conductance can enhance plant tolerance to osmotic stress of many plant species such as chickpea and rice [50,51]. ARF4-as plants showed decreased stomatal conductance coupled with an increase in WUE, suggesting that the downregulation of ARF4 can lead to a better tolerance to abiotic stresses. Thus, the combination of a marked leaf curling phenotype associated with decreased gs and high WUE in ARF4-as plants suggests that these plants might tolerate better salinity and water deficit.
The auxin response has emerged recently as an active player in plant response to abiotic stresses [51]. Extensive research has shown that various environmental signals are associated with changes in auxin homeostasis, redistribution, and signaling [52]. Accumulating evidence indicates that auxin plays a role in plant responses to abiotic stresses through complex metabolic and signaling networks. Auxin coordinates plant development essentially through two groups of transcriptional regulators Aux/IAA and ARFs [3]. Genome-wide expression analyses have suggested that the expression of numerous ARF genes change when plants respond to abiotic stresses in many plant species [7,9,53,54]. In tomato, expression profiling of the ARF family under abiotic stress conditions showed that most of the tomato ARFs were responsive and some of them were significantly regulated [17]. Among them, SlARF4 expression was significantly induced in tomato plants in response to salt (24 h) or drought (five days). Additionally, the SlARF4 regulatory region was enriched in cis-acting elements specific to salinity and water deficit response [17]. In this work, ARF4 expression assessed both in vitro and in planta was affected by either salt, drought or osmotic treatment, which suggests that this gene is involved in tomato response to those stresses.
Plant growth and development are heavily constrained by salinity and water deficit [55]. In the current study, plant growth evaluated through fresh weight was significantly affected in WT and ARF4-as transgenic plants in response to salt or osmotic stress. The reduction in fresh weight was reported in many plant species which includes barley and cabbage in response to salinity or water deficit [56,57]. The decrease in seedling growth (evaluated through the measurement of fresh weight) is due to restricted cell division and enlargement, as salt and drought stress directly reduces growth by decreasing cell division and elongation [58]. However, the reduction in fresh weight was less pronounced in the ARF4-as plants which suggest that ARF4-as plants might tolerate better salt and osmotic stress than the other plant lines.
The root system is the first organ to encounter salinity and drought stress. Root development can be severely affected by environmental stresses [59]. In Arabidopsis, root length and development was significantly reduced in response to salinity [60]. In this study, we had noticed a significant decrease in primary root length in WT and in ARF4-as plants in response to salt or osmotic stress conditions as compared with normal conditions. However, less reduction was reported in ARF4-as plants. In general, deeper rooting has been shown to be beneficial for plant production and survival as it increases water uptake which confer the advantage to support plant growth during adverse conditions [61]. Numerous studies have linked plant stress tolerance with the increase in root length and density for several plant species such as barley, sunflower, wheat, rice and cotton [37]. ARF4-as plants showed less reduction in primary root length coupled with an increase in root density. ARF4 was found to be implicated in defining root architecture in Arabidopsis under optimal growth conditions through the control of lateral root emergence [45] which suggest that this gene might play an important role in root architecture in stress conditions and thus contribute to the improvement tomato tolerance to salinity and osmotic stress.
Plants’ photosynthesis activity is known to be affected by abiotic stress [37]. Stress-induced decrease in chlorophyll content have been reported in several plant species including tomato [62]. Zarafshar et al. (2014) explained this decrease as the result of pigment photo-oxidation and chlorophyll degradation [63]. ARF4-as plants showed although a slight decrease in total chlorophyll content in response to salt stress and a slight increase in osmotic stress conditions. Tomato tolerant genotypes showed less reductions in photosynthetic pigments [64]. The lack of changes in chlorophyll content in the ARF4-as plants shows the capacity to preserve the photosynthetic apparatus and thus indicates their better tolerance to salinity and osmotic stress.
Metabolic activities in plant cells are very complex, and various biochemical pathways are interconnected with each other, working in coherence towards cellular homeostasis [65]. High concentration of osmolytes including sugars help plants to tolerate abiotic stresses by improving their ability to preserve osmotic balance within the cells [66]. To assess this, we studied sugars accumulation to correlate their levels with the presence or the absence of SlARF4 function. We found that soluble sugars content (Figure S3) increased more in ARF4-as transgenic plants than in WT in response to salt or osmotic stresses. Besides its accumulation under stress conditions, sugars can be transported to different organs of the plant. SUT1; gene encoding for a sucrose transporter, was found to be upregulated in ARF4-as plants in response to salt or osmotic stress. Previous studies had reported an increase in SUT1 transcript in sugarcane leaves after 24 h of osmotic treatment with PEG [67]. Thus, its upregulation in ARF4-as might improve tolerance to osmotic and salinity through the stimulation of sucrose transport required for the osmoregulation and for the cellular energy demands during salt or osmotic stresses.
Stomata are known for their role in the regulation of gas exchange and water loss by transpiration [68]. Their opening and closing is affected by environmental and internal parameters that maintain the water balance and functioning of complex signal transduction pathways [69]. Salt, drought and osmotic tolerance was correlated with a decline in stomatal conductance in many plant species [50,70]. In this work, we found that the downregulation of SlARF4 resulted in reduced stomatal conductance under salt and osmotic stresses along with a high RWC, which suggests the involvement of ARF4 in the regulation of stomatal closure in order to prevent water loss through transpiration to cope with salt or drought conditions.
ABA content is closely defined by the balance between its biosynthesis and biodegradation. In tomato, ABA biosynthesis is governed by the activity of SlNCED1 and SlNCED2, whereas SlCYP707A1, SlCYP707A2, SlCYP707A3 and SlCYP707A4 encoding ABA 8′-hydroxylase are main genes for ABA catabolism [42]. Water stress is known to induce the expression of NCED genes in tomato [71]. Moreover, transgenic plants overexpressing the NCED gene accumulated large amounts of ABA and were more resistant to drought stress [72]. Regarding ABA biodegradation genes, Arabidopsis knock-out mutant cyp707a3-1 accumulated higher endogenous ABA levels coupled with a reduced transpiration rate, thereby resulting in a phenotype exhibiting enhanced tolerance to drought stress [73]. The significant increase in SlNCED1 expression in ARF4-as leaves and roots along with the repression of the three ABA catabolism genes in normal and salt stress conditions explain the increase in the concentration of ABA in leaves. This finding suggests the involvement of ARF4 in the regulation of ABA synthesis and provides clues on the existence of a possible cross talk between auxin and ABA signaling pathways.
In plants, abiotic stresses induce the overproduction of reactive oxygen species (ROS), a highly reactive and toxic molecules that cause damage to proteins, lipids, carbohydrates and DNA and results ultimately in oxidative stress [43]. The ability of plants to mitigate the negative effects of abiotic stresses relays on the efficiency of the antioxidant defense systems to protect plant cells from oxidative damage by scavenging ROS accumulation. The key enzymatic antioxidants are catalase, superoxide dismutase (SOD), monodehydroascorbate reductase (MDHAR), dehydroascorbate reductase (DHAR) [43]. Several studies have linked abiotic stress tolerance to an overproduction of antioxydants in many plant species including tomato [74]. Genetic manipulation of genes encoding for these antioxydants increased plant tolerance to a wide range of abiotic stresses. For instance, the overproduction of a bacterial cat1 gene improved tolerance to salinity in tomato [69]. Rice plants engineered to express a bacterial cat1 gene showed increased tolerance to osmotic stress [75]. The overexpression of Rice cytosolic Cu/Zn-SOD in chloroplasts of tobacco plant improved their photosynthetic performance during photooxidative stresses such as high salt or drought stresses [76]. The overexpression of mdhar in transgenic tobacco increased the tolerance against salt and osmotic stresses [77]. Here, we found that the expression of mdhar and SOD genes was significantly upregulated in ARF4-as plants in response to either salt or osmotic stress, which suggest that the down regulation of ARF4 improved tomato tolerance to salt and osmotic stresses by reducing ROS accumulation mainly through antioxidant enzymes activities.
The down regulation of SlARF4 induced many alterations on plant growth and stomatal functions. ARF4-as plants exhibited leaf-curling phenotype, low stomatal conductance along with an increase in WUE. We have previously demonstrated a connection between flowering time, auxin signaling and WUE in tomato [78,79]. It will be interesting to explore the role of ARF4 in these pathways. In response to stress, the down regulation of ARF4 results in a better root development, an accumulation of sugars and a high chlorophyll content alongside with a low stomatal conductance, a high RWC and ABA content. The expression of some antioxidant genes and ABA biosynthesis genes was significantly induced in ARF4-as plants conferring to these transgenic plants a better tolerance to salinity and osmotic stress. ARF4 CRISPR mutant shared similar growth and stomatal responses than those observed in ARF4-as. Thus, the use of gene-editing technology could represent a promising avenue for the incorporation of valuable abiotic stress tolerance traits in tomato and other horticultural crops [80,81].

5. Conclusions

This study provides clues on the involvement of ARF4 in the acquisition of salt and drought tolerance in tomato. We found that the downregulation of SlARF4 increases tomato tolerance to salinity and drought stress. Indeed, loss of SlARF4 function increases root length and density resulting in improved development of the root system. Furthermore, ARF4-as plants displayed leaf curling, lower stomatal conductance, higher WUE under normal conditions and maintained high level of chlorophyll content even in stress conditions suggesting that their photosynthetic activity was less affected by stress. Total carbohydrates were accumulated in high proportion in photosynthetic tissues of ARF4-as plants. At the molecular level, the expression of the sucrose transporter LeSUT1 was significantly up-regulated in ARF4-as which might explain carbohydrates accumulation in root tissues. Cu/ZnSOD and mdhar genes were found to be up-regulated in ARF4-as plants suggesting that ARF4-as mutant is more tolerant to salt and water stress. Furthermore, SlARF4-as plants showed a significant increase in ABA content associated with a low stomatal conductance under stressful conditions. This increase in ABA content is due to the activation of ABA biosynthesis genes and the repression of ABA catabolism genes. Besides, ARF4 mutant generated by CRISPR technology (arf4-cr) displayed similar growth and stomatal responses as ARF4-as which enable us to confirm the role of SlARF4. taken together, the data presented in this work brings new elements on auxin involvement in stress tolerance in tomato and underlines the role of ARF4 in this process providing new insights for the use of genetic editing technologies to breed abiotic stress tolerant crops.

Supplementary Materials

The following are available online at https://0-www-mdpi-com.brum.beds.ac.uk/2073-4425/11/3/272/s1, Figure S1: Stomatal responses to irradiance and CO2 levels in Micro-Tom (WT) and ARF4-as transgenic line, Figure S2. Productive parameters in tomato Micro-Tom (WT) and ARF4-as transgenic line, Figure S3. Photosynthesis and sugar accumulation in WT and ARF4-as plants exposed to different concentrations of NaCl or PEG, Figure S4. Expression of sucrose transporter SlSUT1 in WT and ARF4-as plants exposed to salt or osmotic stresses, Figure S5. Expression of Cat1, mdhar and SOD in WT and ARF4-as plants exposed to salt or osmotic stresses, Figure S6. Productive parameters in tomato Micro-Tom (WT) and arf4-cr transgenic line, Table S1: Gene ID and quantitative RT-PCR primers, Table S2. Characterization of photosynthetic parameters in tomato cv. Micro-Tom (WT) and isogenic ARF4 antisense transgenic line (ARF4-as) Vcmax.

Author Contributions

All authors have read and agree to the published version of the manuscript. Conceptualization, N.B., M.B, A.Z., A.S. and M.Z.; methodology, A.Z., A.S. and M.Z.; formal analysis, S.B., K.G., G.H., M.A.M.B., B.L.R.; writing original draft preparation, S.B., A.Z., K.G, A.S. and M.Z.; writing—review and editing, N.B., M.B., M.F., A.Z., A.S. and M.Z.; supervision, A.Z., A.S. and M.Z.; funding acquisition, M.Z. All authors have read and agreed to the published version of the manuscript.

Funding

This research was supported by Labex TULIP (ANR-10-LABX-41), by the ANR TomEpiSet project, by Hubert-Curien partnership program Volubilis {MA/12/280-27105PL} and benefited from networking activities within the European COST Action FA1106.

Acknowledgments

The authors are grateful to L. Lemonnier, D. Saint-Martin and O. Berseille for genetic transformation and culture of tomato plants and I. Mila for the cloning.

Conflicts of Interest

All Authors have read, edited and approved the final version of the manuscript. They have declared that no competing interests exist.

References

  1. Vanneste, S.; Friml, J. Auxin: A trigger for change in plant development. Cell 2009, 136, 1005–1016. [Google Scholar] [CrossRef]
  2. Szemenyei, H.; Hannon, M.; Long, J.A. TOPLESS mediates auxin-dependent transcriptional repression during Arabidopsis embryogenesis. Science 2008, 319, 1384–1386. [Google Scholar] [CrossRef] [PubMed]
  3. Guilfoyle, T.J.; Hagen, G. Auxin response factors. Curr. Opin. Plant Biol. 2007, 10, 453–460. [Google Scholar] [CrossRef] [PubMed]
  4. Zouine, M.; Fu, Y.; Chateigner-Boutin, A.-L.; Mila, I.; Frasse, P.; Wang, H.; Audran, C.; Roustan, J.-P.; Bouzayen, M. Characterization of the tomato ARF gene family uncovers a multi-levels post-transcriptional regulation including alternative splicing. PLoS ONE 2014, 9, e84203. [Google Scholar] [CrossRef] [PubMed]
  5. Li, S.-B.; Xie, Z.-Z.; Hu, C.-G.; Zhang, J.-Z. A review of auxin response factors (ARFs) in plants. Front. Plant Sci. 2016, 7, 47. [Google Scholar] [CrossRef] [Green Version]
  6. Ulmasov, T.; Murfett, J.; Hagen, G.; Guilfoyle, T.J. Aux/IAA proteins repress expression of reporter genes containing natural and highly active synthetic auxin response elements. Plant Cell 1997, 9, 1963–1971. [Google Scholar]
  7. Jain, M.; Khurana, J.P. Transcript profiling reveals diverse roles of auxin-responsive genes during reproductive development and abiotic stress in rice. FEBS J. 2009, 276, 3148–3162. [Google Scholar] [CrossRef]
  8. Xing, H.; Pudake, R.N.; Guo, G.; Xing, G.; Hu, Z.; Zhang, Y.; Sun, Q.; Ni, Z. Genome-wide identification and expression profiling of auxin response factor (ARF) gene family in maize. BMC Genomics 2011, 12, 178. [Google Scholar] [CrossRef] [Green Version]
  9. Hu, W.; Zuo, J.; Hou, X.; Yan, Y.; Wei, Y.; Liu, J.; Li, M.; Xu, B.; Jin, Z. The auxin response factor gene family in banana: Genome-wide identification and expression analyses during development, ripening, and abiotic stress. Front. Plant Sci. 2015, 6, 742. [Google Scholar] [CrossRef] [Green Version]
  10. Tang, Y.; Bao, X.; Liu, K.; Wang, J.; Zhang, J.; Feng, Y.; Wang, Y.; Lin, L.; Feng, J.; Li, C. Genome-wide identification and expression profiling of the auxin response factor (ARF) gene family in physic nut. PLoS ONE 2018, 13, e0201024. [Google Scholar] [CrossRef] [Green Version]
  11. Zhang, X.; Yan, F.; Tang, Y.; Yuan, Y.; Deng, W.; Li, Z. Auxin response gene SlARF3 plays multiple roles in tomato development and is involved in the formation of epidermal cells and trichomes. Plant Cell Physiol. 2015, 56, 2110–2124. [Google Scholar] [PubMed] [Green Version]
  12. Breitel, D.A.; Chappell-Maor, L.; Meir, S.; Panizel, I.; Puig, C.P.; Hao, Y.; Yifhar, T.; Yasuor, H.; Zouine, M.; Bouzayen, M. AUXIN RESPONSE FACTOR 2 intersects hormonal signals in the regulation of tomato fruit ripening. PLoS Genet. 2016, 12, e1005903. [Google Scholar] [CrossRef] [PubMed] [Green Version]
  13. Liu, N.; Wu, S.; Van Houten, J.; Wang, Y.; Ding, B.; Fei, Z.; Clarke, T.H.; Reed, J.W.; Van Der Knaap, E. Down-regulation of AUXIN RESPONSE FACTORS 6 and 8 by microRNA 167 leads to floral development defects and female sterility in tomato. J. Exp. Bot. 2014, 65, 2507–2520. [Google Scholar] [CrossRef] [PubMed] [Green Version]
  14. Jones, B.; Frasse, P.; Olmos, E.; Zegzouti, H.; Li, Z.G.; Latché, A.; Pech, J.C.; Bouzayen, M. Down-regulation of DR12, an auxin-response-factor homolog, in the tomato results in a pleiotropic phenotype including dark green and blotchy ripening fruit. Plant J. 2002, 32, 603–613. [Google Scholar] [CrossRef] [PubMed] [Green Version]
  15. Sagar, M.; Chervin, C.; Mila, I.; Hao, Y.; Roustan, J.-P.; Benichou, M.; Gibon, Y.; Biais, B.; Maury, P.; Latché, A. Sl-ARF4, an Auxin Response Factor involved in the control of sugar metabolism during tomato fruit development. Plant Physiol. 2013, 161, 1362–1374. [Google Scholar] [CrossRef] [PubMed] [Green Version]
  16. Yuan, Y.; Mei, L.; Wu, M.; Wei, W.; Shan, W.; Gong, Z.; Zhang, Q.; Yang, F.; Yan, F.; Zhang, Q.; et al. SlARF10, an auxin response factor, is involved in chlorophyll and sugar accumulation during tomato fruit development. J. Exp. Bot. 2018, 69, 5507–5518. [Google Scholar] [CrossRef] [Green Version]
  17. Bouzroud, S.; Gouiaa, S.; Hu, N.; Bernadac, A.; Mila, I.; Bendaou, N.; Smouni, A.; Bouzayen, M.; Zouine, M. Auxin Response Factors (ARFs) are potential mediators of auxin action in tomato response to biotic and abiotic stress (Solanum lycopersicum). PLoS ONE 2018, 13, e0193517. [Google Scholar] [CrossRef] [Green Version]
  18. Wang, H.; Jones, B.; Li, Z.; Frasse, P.; Delalande, C.; Regad, F.; Chaabouni, S.; Latche, A.; Pech, J.-C.; Bouzayen, M. The tomato Aux/IAA transcription factor IAA9 is involved in fruit development and leaf morphogenesis. Plant Cell 2005, 17, 2676–2692. [Google Scholar] [CrossRef] [Green Version]
  19. Brooks, C.; Nekrasov, V.; Lippman, Z.B.; Van Eck, J. Efficient gene editing in tomato in the first generation using the clustered regularly interspaced short palindromic repeats/CRISPR-associated9 system. Plant Physiol. 2014, 166, 1292–1297. [Google Scholar] [CrossRef] [Green Version]
  20. Lei, Y.; Lu, L.; Liu, H.-Y.; Li, S.; Xing, F.; Chen, L.-L. CRISPR-P: A web tool for synthetic single-guide RNA design of CRISPR-system in plants. Mol. Plant 2014, 7, 1494–1496. [Google Scholar] [CrossRef] [Green Version]
  21. Barbosa, M.A.M.; Chitwood, D.H.; Azevedo, A.A.; Araújo, W.L.; Ribeiro, D.M.; Peres, L.E.P.; Martins, S.C.V.; Zsögön, A. Bundle sheath extensions affect leaf structural and physiological plasticity in response to irradiance. Plant Cell Environ. 2019, 42, 1575–1589. [Google Scholar] [CrossRef] [PubMed] [Green Version]
  22. Gasparini, K.; Costa, L.C.; Brito, F.A.; Pimenta, T.M.; Cardoso, F.B.; Araújo, W.L.; Zsögön, A.; Ribeiro, D.M. Elevated CO2 induces age-dependent restoration of growth and metabolism in gibberellin-deficient plants. Planta 2019, 250, 1147–1161. [Google Scholar] [CrossRef] [PubMed]
  23. Hunt, R. Plant growth analysis: Second derivatives and compounded second derivatives of splined plant growth curves. Ann. Bot. 1982, 50, 317–328. [Google Scholar] [CrossRef]
  24. Farquhar, G.D.; von Caemmerer, S.V.; Berry, J.A. A biochemical model of photosynthetic CO2 assimilation in leaves of C 3 species. Planta 1980, 149, 78–90. [Google Scholar] [CrossRef] [Green Version]
  25. Rodeghiero, M.; Niinemets, Ü.; Cescatti, A. Major diffusion leaks of clamp-on leaf cuvettes still unaccounted: How erroneous are the estimates of Farquhar et al. model parameters? Plant Cell Environ. 2007, 30, 1006–1022. [Google Scholar] [CrossRef]
  26. Lawson, T.; von Caemmerer, S.; Baroli, I. Photosynthesis and stomatal behaviour. In Progress in Botany 72; Springer: Berlin/Heidelberg, Germany, 2010; pp. 265–304. [Google Scholar]
  27. Broughton, W.; Dilworth, M. Control of leghaemoglobin synthesis in snake beans. Biochem. J. 1971, 125, 1075–1080. [Google Scholar] [CrossRef] [Green Version]
  28. Bassa, C.; Mila, I.; Bouzayen, M.; Audran-Delalande, C. Phenotypes associated with down-regulation of Sl-IAA27 support functional diversity among Aux/IAA family members in tomato. Plant Cell Physiol. 2012, 53, 1583–1595. [Google Scholar] [CrossRef] [Green Version]
  29. Dubois, M.; Gilles, K.A.; Hamilton, J.K.; Rebers, P.T.; Smith, F. Colorimetric method for determination of sugars and related substances. Anal. Chem. 1956, 28, 350–356. [Google Scholar] [CrossRef]
  30. Forcat, S.; Bennett, M.H.; Mansfield, J.W.; Grant, M.R. A rapid and robust method for simultaneously measuring changes in the phytohormones ABA, JA and SA in plants following biotic and abiotic stress. Plant Methods 2008, 4, 16. [Google Scholar] [CrossRef] [Green Version]
  31. Jaulneau, V.; Lafitte, C.; Jacquet, C.; Fournier, S.; Salamagne, S.; Briand, X.; Esquerré-Tugayé, M.-T.; Dumas, B. Ulvan, a Sulfated Polysaccharide from Green Algae, Activates Plant Immunity through the Jasmonic Acid Signaling Pathway. J. Biomed. Biotechnol. 2010, 2010. [Google Scholar] [CrossRef] [Green Version]
  32. Smart, R.E.; Bingham, G.E. Rapid estimates of relative water content. Plant Physiol. 1974, 53, 258–260. [Google Scholar] [CrossRef] [PubMed] [Green Version]
  33. Bernacchi, C.J.; Rosenthal, D.M.; Pimentel, C.; Long, S.P.; Farquhar, G.D. Modeling the Temperature Dependence of C3 Photosynthesis. In Photosynthesis in silico: Understanding Complexity from Molecules to Ecosystems; Laisk, A., Nedbal, L., Govindjee, Eds.; Advances in Photosynthesis and Respiration; Springer: Dordrecht, The Netherlands, 2009; ISBN 978-1-4020-9237-4. [Google Scholar]
  34. Jiang, Q.; Roche, D.; Monaco, T.; Hole, D. Stomatal conductance is a key parameter to assess limitations to photosynthesis and growth potential in barley genotypes. Plant Biol. 2006, 8, 515–521. [Google Scholar] [CrossRef] [PubMed]
  35. Ashraf, M.; Harris, P.J. Photosynthesis under stressful environments: An overview. Photosynthetica 2013, 51, 163–190. [Google Scholar] [CrossRef]
  36. De Jong, M.; Mariani, C.; Vriezen, W.H. The role of auxin and gibberellin in tomato fruit set. J. Exp. Bot. 2009, 60, 1523–1532. [Google Scholar] [CrossRef] [PubMed] [Green Version]
  37. Munns, R.; James, R.A.; Läuchli, A. Approaches to increasing the salt tolerance of wheat and other cereals. J. Exp. Bot. 2006, 57, 1025–1043. [Google Scholar] [CrossRef] [Green Version]
  38. Jia, W.; Zhang, L.; Wu, D.; Liu, S.; Gong, X.; Cui, Z.; Cui, N.; Cao, H.; Rao, L.; Wang, C. Sucrose transporter AtSUC9 mediated by a low sucrose level is involved in Arabidopsis abiotic stress resistance by regulating sucrose distribution and ABA accumulation. Plant Cell Physiol. 2015, 56, 1574–1587. [Google Scholar] [CrossRef] [Green Version]
  39. Damour, G.; Simonneau, T.; Cochard, H.; Urban, L. An overview of models of stomatal conductance at the leaf level. Plant Cell Environ. 2010, 33, 1419–1438. [Google Scholar] [CrossRef]
  40. Schultz, H.R. Differences in hydraulic architecture account for near-isohydric and anisohydric behaviour of two field-grown Vitis vinifera L. cultivars during drought. Plant Cell Environ. 2003, 26, 1393–1405. [Google Scholar] [CrossRef]
  41. Leymarie, J.; Lascève, G.; Vavasseur, A. Interaction of stomatal responses to ABA and CO2 in Arabidopsis thaliana. Funct. Plant Biol. 1998, 25, 785–791. [Google Scholar] [CrossRef]
  42. Yang, R.; Yang, T.; Zhang, H.; Qi, Y.; Xing, Y.; Zhang, N.; Li, R.; Weeda, S.; Ren, S.; Ouyang, B. Hormone profiling and transcription analysis reveal a major role of ABA in tomato salt tolerance. Plant Physiol. Biochem. 2014, 77, 23–34. [Google Scholar] [CrossRef]
  43. Das, K.; Roychoudhury, A. Reactive oxygen species (ROS) and response of antioxidants as ROS-scavengers during environmental stress in plants. Front. Environ. Sci. 2014, 2, 53. [Google Scholar] [CrossRef] [Green Version]
  44. Choudhury, S.; Panda, P.; Sahoo, L.; Panda, S.K. Reactive oxygen species signaling in plants under abiotic stress. Plant Signal. Behav. 2013, 8, e23681. [Google Scholar] [CrossRef] [PubMed] [Green Version]
  45. Marin, E.; Jouannet, V.; Herz, A.; Lokerse, A.S.; Weijers, D.; Vaucheret, H.; Nussaume, L.; Crespi, M.D.; Maizel, A. miR390, Arabidopsis TAS3 tasiRNAs, and their AUXIN RESPONSE FACTOR targets define an autoregulatory network quantitatively regulating lateral root growth. Plant Cell 2010, 22, 1104–1117. [Google Scholar] [CrossRef] [PubMed] [Green Version]
  46. Pereira-Netto, A.B.D.; Gabriele, A.C.; Pinto, H.S. Aspects of leaf anatomy of kudzu (Pueraria lobata, Leguminosae-Faboideae) related to water and energy balance. Pesqui. Agropecu. Bras. 1999, 34, 1361–1365. [Google Scholar] [CrossRef] [Green Version]
  47. Kadioglu, A.; Terzi, R.; Saruhan, N.; Saglam, A. Current advances in the investigation of leaf rolling caused by biotic and abiotic stress factors. Plant Sci. 2012, 182, 42–48. [Google Scholar] [CrossRef]
  48. Fen, L.L.; Ismail, M.R.; Zulkarami, B.; Rahman, M.S.A.; Islam, M.R. Physiological and molecular characterization of drought responses and screening of drought tolerant rice varieties. Biosci. J. 2015, 31, 709–718. [Google Scholar] [CrossRef] [Green Version]
  49. Zhang, Y.; Wang, Z.; Wu, Y.; Zhang, X. Stomatal characteristics of different green organs in wheat under different irrigation regimes. Zuo Wu Xue Bao 2006, 32, 70–75. [Google Scholar]
  50. Mafakheri, A.; Siosemardeh, A.; Bahramnejad, B.; Struik, P.; Sohrabi, Y. Effect of drought stress on yield, proline and chlorophyll contents in three chickpea cultivars. Aust. J. Crop Sci. 2010, 4, 580. [Google Scholar]
  51. Rahman, A. Auxin: A regulator of cold stress response. Physiol. Plant. 2013, 147, 28–35. [Google Scholar] [CrossRef]
  52. Navarro, L.; Dunoyer, P.; Jay, F.; Arnold, B.; Dharmasiri, N.; Estelle, M.; Voinnet, O.; Jones, J.D. A plant miRNA contributes to antibacterial resistance by repressing auxin signaling. Science 2006, 312, 436–439. [Google Scholar] [CrossRef] [Green Version]
  53. Wang, S.; Bai, Y.; Shen, C.; Wu, Y.; Zhang, S.; Jiang, D.; Guilfoyle, T.J.; Chen, M.; Qi, Y. Auxin-related gene families in abiotic stress response in Sorghum bicolor. Funct. Integr. Genomics 2010, 10, 533–546. [Google Scholar] [CrossRef]
  54. Van Ha, C.; Le, D.T.; Nishiyama, R.; Watanabe, Y.; Sulieman, S.; Tran, U.T.; Mochida, K.; Van Dong, N.; Yamaguchi-Shinozaki, K.; Shinozaki, K. The auxin response factor transcription factor family in soybean: Genome-wide identification and expression analyses during development and water stress. DNA Res. 2013, 20, 511–524. [Google Scholar] [CrossRef] [PubMed]
  55. Guóth, A.; Tari, I.; Gallé, Á.; Csiszár, J.; Pécsváradi, A.; Cseuz, L.; Erdei, L. Comparison of the drought stress responses of tolerant and sensitive wheat cultivars during grain filling: Changes in flag leaf photosynthetic activity, ABA levels, and grain yield. J. Plant Growth Regul. 2009, 28, 167–176. [Google Scholar] [CrossRef]
  56. Farooq, M.; Wahid, A.; Kobayashi, N.; Fujita, D.; Basra, S.M.A. Plant Drought Stress: Effects, Mechanisms and Management. In Sustainable Agriculture; Lichtfouse, E., Navarrete, M., Debaeke, P., Véronique, S., Alberola, C., Eds.; Springer: Dordrecht, The Netherlands, 2009; pp. 153–188. ISBN 978-90-481-2666-8. [Google Scholar]
  57. Fayez, K.A.; Bazaid, S.A. Improving drought and salinity tolerance in barley by application of salicylic acid and potassium nitrate. J. Saudi Soc. Agric. Sci. 2014, 13, 45–55. [Google Scholar] [CrossRef] [Green Version]
  58. Akıncı, Ş.; Lösel, D.M. Plant water-stress response mechanisms. In Water stress; InTech: Rijeca, Croatia, 2012. [Google Scholar]
  59. Kurth, E.; Cramer, G.R.; Läuchli, A.; Epstein, E. Effects of NaCl and CaCl2 on cell enlargement and cell production in cotton roots. Plant Physiol. 1986, 82, 1102–1106. [Google Scholar] [CrossRef] [Green Version]
  60. Burssens, S.; Himanen, K.; Van de Cotte, B.; Beeckman, T.; Van Montagu, M.; Inzé, D.; Verbruggen, N. Expression of cell cycle regulatory genes and morphological alterations in response to salt stress in Arabidopsis thaliana. Planta 2000, 211, 632–640. [Google Scholar] [CrossRef]
  61. Comas, L.; Becker, S.; Cruz, V.M.V.; Byrne, P.F.; Dierig, D.A. Root traits contributing to plant productivity under drought. Front. Plant Sci. 2013, 4, 442. [Google Scholar] [CrossRef] [Green Version]
  62. Dogan, M.; Tipirdamaz, R.; Demir, Y. Salt resistance of tomato species grown in sand culture. Plant Soil Env. 2010, 56, 499–507. [Google Scholar] [CrossRef]
  63. Zarafshar, M.; Akbarinia, M.; Askari, H.; Hosseini, S.M.; Rahaie, M.; Struve, D.; Striker, G.G. Morphological, physiological and biochemical responses to soil water deficit in seedlings of three populations of wild pear (Pyrus boisseriana). Gembloux Agro-Bio Tech 2014, 18, 353–366. [Google Scholar]
  64. Hernandez, J.; Jimenez, A.; Mullineaux, P.; Sevilia, F. Tolerance of pea (Pisum sativum L.) to long-term salt stress is associated with induction of antioxidant defences. Plant Cell Environ. 2000, 23, 853–862. [Google Scholar] [CrossRef]
  65. Hasegawa, P.M.; Bressan, R.A.; Zhu, J.-K.; Bohnert, H.J. Plant cellular and molecular responses to high salinity. Annu. Rev. Plant Biol. 2000, 51, 463–499. [Google Scholar] [CrossRef] [PubMed] [Green Version]
  66. Atkinson, N.J.; Urwin, P.E. The interaction of plant biotic and abiotic stresses: From genes to the field. J. Exp. Bot. 2012, 63, 3523–3543. [Google Scholar] [CrossRef] [PubMed] [Green Version]
  67. Patade, V.Y.; Bhargava, S.; Suprasanna, P. Transcript expression profiling of stress responsive genes in response to short-term salt or PEG stress in sugarcane leaves. Mol. Biol. Rep. 2012, 39, 3311–3318. [Google Scholar] [CrossRef] [PubMed]
  68. Xie, C.; Zhang, R.; Qu, Y.; Miao, Z.; Zhang, Y.; Shen, X.; Wang, T.; Dong, J. Overexpression of MtCAS31 enhances drought tolerance in transgenic Arabidopsis by reducing stomatal density. New Phytol. 2012, 195, 124–135. [Google Scholar] [CrossRef]
  69. Mohamed, E.-A.; Iwaki, T.; Munir, I.; Tamoi, M.; Shigeoka, S.; Wadano, A. Overexpression of bacterial catalase in tomato leaf chloroplasts enhances photo-oxidative stress tolerance. Plant Cell Environ. 2003, 26, 2037–2046. [Google Scholar] [CrossRef]
  70. Brugnoli, E.; Lauteri, M. Effects of salinity on stomatal conductance, photosynthetic capacity, and carbon isotope discrimination of salt-tolerant (Gossypium hirsutum L.) and salt-sensitive (Phaseolus vulgaris L.) C3 non-halophytes. Plant Physiol. 1991, 95, 628–635. [Google Scholar] [CrossRef] [Green Version]
  71. Burbidge, A.; Grieve, T.M.; Jackson, A.; Thompson, A.; McCarty, D.R.; Taylor, I.B. Characterization of the ABA-deficient tomato mutant notabilis and its relationship with maize Vp14. Plant J. 1999, 17, 427–431. [Google Scholar] [CrossRef]
  72. Wan, X.-R.; Li, L. Regulation of ABA level and water-stress tolerance of Arabidopsis by ectopic expression of a peanut 9-cis-epoxycarotenoid dioxygenase gene. Biochem. Biophys. Res. Commun. 2006, 347, 1030–1038. [Google Scholar] [CrossRef]
  73. Umezawa, T.; Okamoto, M.; Kushiro, T.; Nambara, E.; Oono, Y.; Seki, M.; Kobayashi, M.; Koshiba, T.; Kamiya, Y.; Shinozaki, K. CYP707A3, a major ABA 8′-hydroxylase involved in dehydration and rehydration response in Arabidopsis thaliana. Plant J. 2006, 46, 171–182. [Google Scholar] [CrossRef]
  74. Gondim, F.A.; Gomes-Filho, E.; Costa, J.H.; Mendes Alencar, N.L.; Prisco, J.T. Catalase plays a key role in salt stress acclimation induced by hydrogen peroxide pretreatment in maize. Plant Physiol. Biochem. PPB 2012, 56, 62–71. [Google Scholar] [CrossRef]
  75. Moriwaki, T.; Yamamoto, Y.; Aida, T.; Funahashi, T.; Shishido, T.; Asada, M.; Prodhan, S.H.; Komamine, A.; Motohashi, T. Overexpression of the Escherichia coli catalase gene, katE, enhances tolerance to salinity stress in the transgenic indica rice cultivar, BR5. Plant Biotechnol. Rep. 2008, 2, 41–46. [Google Scholar] [CrossRef]
  76. Badawi, G.H.; Yamauchi, Y.; Shimada, E.; Sasaki, R.; Kawano, N.; Tanaka, K.; Tanaka, K. Enhanced tolerance to salt stress and water deficit by overexpressing superoxide dismutase in tobacco (Nicotiana tabacum) chloroplasts. Plant Sci. 2004, 166, 919–928. [Google Scholar] [CrossRef]
  77. Eltayeb, A.E.; Kawano, N.; Badawi, G.H.; Kaminaka, H.; Sanekata, T.; Morishima, I.; Shibahara, T.; Inanaga, S.; Tanaka, K. Enhanced tolerance to ozone and drought stresses in transgenic tobacco overexpressing dehydroascorbate reductase in cytosol. Physiol. Plant. 2006, 127, 57–65. [Google Scholar] [CrossRef]
  78. Robledo, J.M.; Medeiros, D.; Vicente, M.H.; Azevedo, A.A.; Thompson, A.J.; Peres, L.E.P.; Ribeiro, D.M.; Araújo, W.L.; Zsögön, A. Control of water-use efficiency by florigen. Plant Cell Environ. 2020, 43, 76–86. [Google Scholar] [CrossRef]
  79. Silva, W.B.; Vicente, M.H.; Robledo, J.M.; Reartes, D.S.; Ferrari, R.C.; Bianchetti, R.; Araújo, W.L.; Freschi, L.; Peres, L.E.P.; Zsögön, A. SELF-PRUNING Acts Synergistically with DIAGEOTROPICA to Guide Auxin Responses and Proper Growth Form. Plant Physiol. 2018, 176, 2904–2916. [Google Scholar] [CrossRef] [Green Version]
  80. Zsögön, A.; Cermak, T.; Voytas, D.; Peres, L.E.P. Genome editing as a tool to achieve the crop ideotype and de novo domestication of wild relatives: Case study in tomato. Plant Sci. 2017, 256, 120–130. [Google Scholar] [CrossRef]
  81. Zsögön, A.; Čermák, T.; Naves, E.R.; Notini, M.M.; Edel, K.H.; Weinl, S.; Freschi, L.; Voytas, D.F.; Kudla, J.; Peres, L.E.P. De novo domestication of wild tomato using genome editing. Nat. Biotechnol. 2018, 36, 1211–1216. [Google Scholar] [CrossRef] [Green Version]
Figure 1. Phenotype of cv. Micro-Tom tomato plants (wild-type, WT) and isogenic ARF4 antisense transgenic line (ARF4-as), 35 days after germination. (a) WT and (b) ARF4-as plants at the same stage of development, (c) number of leaves to first inflorescence, (d) plant height to first inflorescence, (e) plant internode length and (f) stem diameter. Bars are mean values (n = 7) ± s.e.m. Asterisks indicate values that were determined by Student’s t test to be significantly different (p < 0.05) from WT.
Genes 11 00272 g001
Figure 2. Dry weight and parameters related with leaf area for Micro-Tom (WT) and isogenic ARF4 antisense transgenic line (ARF4-as), 45 days after germination. (a) leaf dry weight, (b) stem dry weight, (c) root dry weight, (d) total dry weight, (e) total leaf area and (f) specific leaf area (SLA). Values are means ± s.e.m (n = 8). Asterisks indicate values that were determined by Student’s t test to be significantly different (p < 0.05) from the Micro-tom (WT).
Genes 11 00272 g002
Figure 3. Leaf anatomy and morphology is altered in an ARF4-as transgenic line. Representative leaf cross-sections of (a) Micro-Tom (WT) and (b) ARF4-antisense line (ARF4-as). Scale bars= 20 µm. (c) Total thickness of the leaf blade, (d) thickness of palisade, (e) thickness of spongy and (f) ratio of palisade to spongy mesophyll, (g) proportion of intercellular air spaces, (h) adaxial epidermis and (i) abaxial epidermis and (j) mesophyll thickness in WT and ARF4-as plants and (k) Time series of a representative leaf illustrating blade curling in ARF4-as plants. Day 0 represents the day when the leaf was fully expanded. Values are means ± s.e.m (n = 6). Asterisks indicate values that were determined by student’s t test to be significantly different (p < 0,05) from WT while n.s indicates non significant difference between ARF4-as and WT.
Genes 11 00272 g003
Figure 4. Net CO2 assimilation rate (A) and stomatal conductance (gs) in Micro-Tom (WT) and isogenic ARF4 antisense transgenic line (ARF4-as). (a) CO2 assimilation rate (A) as a function of stomatal conductance (gs), each point represents one measurement on an individual plant. Line fitted by linear regression. (b) net CO2 assimilation rate (A). (c) stomatal conductance (gs). (d) intrinsic water efficiency (A/gs). Values are means ± s.e.m (n = 8). Asterisks indicate values that were determined by Student’s t test to be significantly different (p < 0.05) between genotypes.
Genes 11 00272 g004
Figure 5. Photosynthetic assimilation rate and stomatal conductance in Micro-Tom (WT) and ARF4-antisense silencing line. (a) Net photosynthesis (A) curves in response to sub-stomatal (Ci) CO2 concentration in WT and ARF4-as plants. Values are presented as means ± s.e.m. (n = 5) obtained using the fully expanded fifth leaf. Two-branch curves: the biochemically based leaf photosynthesis model [24] was fitted to the data based on Ci, values of A/Ci for five plants of WT (gray) and ARF4-as (black). (b) Response of stomatal conductance (gs) to changes in leaf-to-air vapor pressure deficit (VPD). Vapor pressure difference was varied by changing the humidity of air, keeping leaf temperature constant. Each point represents one measurement on an individual plant.
Genes 11 00272 g005
Figure 6. SlARF4 expression in response to salt and drought stresses. Gene expression in leaves (a) and roots (b) of WT plants exposed to salt stress, in leaves (c) and roots (d) of WT plants exposed to osmotic stress. ΔΔCt refers to differences in gene expression relative to untreated plants. Values are mean ± SD of three biological replicates. GUS activity in pARF4::GUS tomato lines in salt (e) or osmotic (f) stress conditions. Bars scale (1mm). Stars (*) indicate the statistical significance (p < 0.05) according to Student’s t-test.
Genes 11 00272 g006
Figure 7. Growth parameters of tomato wildtype (WT) and ARF4-as in response to salt and osmotic stresses. (a,b) shoot fresh weight in salt and osmotic stress conditions respectively, (c,d) root fresh weight in salt and osmotic stress conditions respectively, (e,f) primary root length root in salt and osmotic stress conditions respectively, (g,h) root density in salt and osmotic stress conditions respectively. Salt and osmotic stresses were performed on three weeks tomato plants for two weeks by adding 100 mM of NaCl or 150 mM of NaCl for salt stress or 5% or 15% of Polyethylene Glycol (PEG) 20,000 for osmotic stress. Values are mean ± SD of three biological replicates. Bars with different letters indicate the statistical significance (p < 0.05) according to Student Newman-Keuls test.
Genes 11 00272 g007
Figure 8. Stomatal conductance and relative water content in WT and ARF4-as plants. (a,b) stomatal conductance in salt and osmotic stress conditions, (c) relative water content in response to dehydration. Bars with different letters indicate the statistical significance (p < 0.05) according to Student Newman-Keuls test.
Genes 11 00272 g008
Figure 9. Expression of SlNCED1, SlNCED2, SlCYP707A1, SlCYP707A2 and SlCYP707A3 genes in WT and ARF4-as leaves and roots after 2 h and 24 h of salt stress and 48 h of osmotic stress application. ΔΔCt refers to fold differences in gene expression relative to untreated plants. Values presented are mean ± SD of three biological replicates. Asterisks (*) indicate the statistical significance (p < 0.05) according to Student’s t-test.
Genes 11 00272 g009
Figure 10. CRISPR-Cas9 mediated gene editing in tomato Micro-Tom. (a) PCR genotyping of plants at the T1 generation of line-108. Deletion mutations of SlARF4 were found in plants #4, #5, #6 and #7. Among these, the T-DNA insertion (CRISPR-Cas9 transgene) was segregated out in plant #5 while still bearing the desired mutation in the SlARF4 gene. (b) Sequencing data of ARF4-PCR products from #5 and #6 plants. The PCR products from plant #5 yielded a single fragment type containing the expected 49bp DNA deletion, whereas in the case of plant #6, only 4 out of 10 PCR clones contain the desired mutation, the remaining 6 PCR clones exhibited a small deletion in both target regions. Red dashed indicated the expected cleavage sites for CRISPR-Cas9. (c) Leaf phenotype of CRISPR-Cas9 generated ARF4 mutants. (d) All four plants showed dramatic leaf curling, similar to the phenotype observed in ARF4-as plants.
Genes 11 00272 g010
Figure 11. Dry weight and parameters related with leaf area for Micro-Tom (WT) and arf4-cr, 45 days after germination. (a) leaf dry weight, (b) stem dry weight, (c) root dry weight, (d) leaf area and (e) Specific leaf area (SLA). Values are means ± s.e.m (n = 8). Asterisks indicate values that were determined by Student’s t test to be significantly different (p < 0.05) from the Micro-tom (WT).
Genes 11 00272 g011
Figure 12. Relationship between net CO2 assimilation rate (A) and stomatal conductance (gs) for Micro-Tom (WT) and arf4-cr. (a) CO2 assimilation rate (A) as a function of stomatal conductance (gs), (b) net CO2 assimilation rate (A), (c) stomatal conductance (gs), (d) intrinsic water efficiency (A/gs). Values are means ± s.e.m (n = 8). Asterisks indicate values that were determined by Student’s t test to be significantly different (p < 0.05) from the wild type (WT).
Genes 11 00272 g012
Table 1. Abscisic Acid (ABA)content (expressed in µmol/g of FW) in WT and ARF4-as leaves in response to salt or osmotic stress conditions. Values presented are mean ± SD of three biological replicates (except for data related to ARF4-as plants in osmotic stress conditions, where only two biological replicates were done).
Salt StressOsmotic Stress
0 mM NaCl150 mM NaCl0% PEG15% PEG
WT0.12720.14540.06810.05
ARF4-as0.11510.26360.06360.1272

