
TOMM40 RNA Transcription in Alzheimer’s Disease Brain and Its Implication in Mitochondrial Dysfunction


1
Geriatric Research, Education, and Clinical Center, VA Puget Sound Health Care System, Seattle, WA 98108, USA
2
Department of Medicine, University of Washington, Seattle, WA 98195, USA
*
Author to whom correspondence should be addressed.
Genes 2021, 12(6), 871; https://0-doi-org.brum.beds.ac.uk/10.3390/genes12060871
Submission received: 14 May 2021
/
Revised: 1 June 2021
/
Accepted: 4 June 2021
/
Published: 6 June 2021
(This article belongs to the Special Issue Genetics of Alzheimer’s Disease)
Abstract
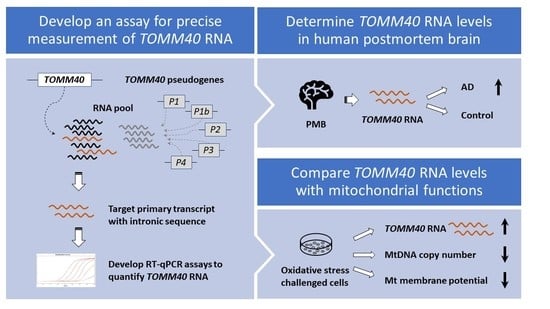
:Increasing evidence suggests that the Translocase of Outer Mitochondria Membrane 40 (TOMM40) gene may contribute to the risk of Alzheimer’s disease (AD). Currently, there is no consensus as to whether TOMM40 expression is up- or down-regulated in AD brains, hindering a clear interpretation of TOMM40’s role in this disease. The aim of this study was to determine if TOMM40 RNA levels differ between AD and control brains. We applied RT-qPCR to study TOMM40 transcription in human postmortem brain (PMB) and assessed associations of these RNA levels with genetic variants in APOE and TOMM40. We also compared TOMM40 RNA levels with mitochondrial functions in human cell lines. Initially, we found that the human genome carries multiple TOMM40 pseudogenes capable of producing highly homologous RNAs that can obscure precise TOMM40 RNA measurements. To circumvent this obstacle, we developed a novel RNA expression assay targeting the primary transcript of TOMM40. Using this assay, we showed that TOMM40 RNA was upregulated in AD PMB. Additionally, elevated TOMM40 RNA levels were associated with decreases in mitochondrial DNA copy number and mitochondrial membrane potential in oxidative stress-challenged cells. Overall, differential transcription of TOMM40 RNA in the brain is associated with AD and could be an indicator of mitochondrial dysfunction.
1. Introduction
Understanding the role that genetics plays in the pathogenesis of AD has been a major research focus for the past three decades. These collective efforts have provided valuable insights into the molecular mechanisms associated with this disease. The advancement of genome-wide approaches has led to the identification of more than 40 AD-associated genetic loci. However, most of these loci have only moderate effect sizes with odds ratios ranging from 1.1 to 1.5 (AlzGene), except for the apolipoprotein E gene (APOE) which has an odds ratio of 3.7. The strength of the association between APOE and AD risk is orders of magnitude larger than all other AD loci combined, suggesting that this locus is a major biological contributor to the risk of AD. Therefore, deciphering the mechanistic role of the APOE locus in AD should provide insight into the etiology of this devastating disease.
Besides APOE itself, the extended region surrounding APOE has also been consistently identified by genome-wide association studies (GWAS) to strongly associate with AD [1,2,3,4]. This extended region consists of at least three additional genes (i.e., NECTIN2, TOMM40, and Apolipoprotein C1 (APOC1)), which carry out specific cellular functions that may possibly intersect with AD pathophysiology. Because of the strong linkage disequilibrium (LD) of these genes with APOE, researchers have always assumed that the disease-associated genetic signals from these genes solely reflect their associations with the APOE ε4 allele. However, increasing evidence points to a different interpretation. For example, a genome-wide linkage study of 71 Swedish late onset AD families found that the strongest signal in a multipoint linkage analysis of APOE ε4-negative families still resided in the APOE region [5]. Furthermore, multiple studies have shown that individuals who carry an African ε4 haplotype of APOE have less risk of developing AD when compared to those with a Caucasian ε4 haplotype [6,7,8]. These observations suggest the presence of loci in this region, beyond APOE, that may influence AD risk. One strong candidate is the TOMM40 gene.
TOMM40 encodes a mitochondrial channel protein TOM40, which is essential for the formation of a translocase of the mitochondrial outer membrane (TOM) complex [9]. The TOM complex is involved in the recognition and import of nuclear-encoded proteins into the mitochondria [10]. Alterations of mitochondrial metabolism have gradually been accepted as prominent features in AD and mitochondrial dysfunction is a known characteristic of the disease [11,12,13,14]. Mitochondrial degeneration has shown to be an early sign of AD pathology, appearing even before neurofibrillary tangles (NFT) [15]. Damages to both the components and structure of mitochondria are extensively reported in AD [16], and the deficiency of several key antioxidant enzymes is a well-established hallmark of the AD brain [17]. Thus, abnormal mitochondrial dynamics, including components, morphology, membrane potential, and DNA copy number could contribute to AD risk [15,18].
TOMM40 has not only been genetically linked to AD risk but may also be functionally connected with AD pathophysiology. In a Chinese cohort, SNPs in TOMM40 remained statistically significantly associated with AD after adjusting for age, sex, and APOE ε4 status [19]. A deoxythymidine homopolymer (poly-T) at rs10524523 within intron 6 of the TOMM40 has been associated with the risk and age at onset of AD [20,21,22,23]; and the “VL” variant of this poly-T marker has been associated with increased mRNA expression of both TOMM40 and APOE in APOE ε3/ε3 brain [24]. In addition, our own high-density SNP association studies identified genetic variants in TOMM40 to be strongly associated with AD in Caucasians, after controlling for the APOE ε2/ε3/ε4 alleles [25,26]. Our quantitative trait loci studies showed that there is an association between TOMM40 SNPs and apoE protein levels in both cerebrospinal fluid and PMB, suggesting that genetic variation within TOMM40 may be associated with APOE and TOMM40 expression in the human brain [27,28,29]. Furthermore, there is evidence supporting a direct connection between TOMM40 and Aβ activity. For example, the Aβ peptide is imported into the mitochondria via the TOM40 protein [30] and the amyloid precursor protein has been reported to be associated with TOM40 in AD, but not controls [31]; Aβ peptides and mis-directed amyloid precursor protein interfere with mitochondrial protein import and disrupt mitochondrial function [31,32,33]; and the accumulation of Aβ in mitochondria leads to the overproduction of reactive oxygen species [30,34]. Given that TOMM40 appears to be involved in APP/Aβ translocation and metabolism as well as APOE regulation, it is plausible that TOMM40 plays a role in AD via effects on mitochondrial function. Consequently, TOMM40 expression levels may be impacting mitochondrial function and contributing to AD risk.
Expression of TOMM40 has been investigated in peripheral blood. Numerous studies consistently showed lower TOMM40 mRNA levels in AD blood samples compared to controls [35,36,37,38], and a decrease in TOM40 protein level has also been observed in AD blood [37]. However, studies using human PMB are scarce and have generated conflicting results. For example, TOMM40 mRNA levels were reported as both increased and decreased in the AD frontal cortex [39], or significantly increased in AD temporal and occipital cortices [24]. Currently, there is no consensus as to whether TOMM40 gene expression is up- or down-regulated in AD brains, and this inconsistency hinders a unified clear interpretation of TOMM40’s role in AD risk. The aim of this study was to definitively determine if PMB TOMM40 mRNA levels differ between AD and control subjects.
2. Materials and Methods
2.1. Human PMB and Cell Lines
This work used deidentified human biospecimens that have already been collected by other established programs. Therefore, no consent was obtained for this work. Previously, all human specimens were obtained from the University of Washington (UW) Alzheimer’s Disease Research Center after approval by the institutional review board of the Veterans Affairs Puget Sound Health Care System (MIRB# 00331). AD patient diagnosis was confirmed postmortem by neuropathological analysis. Clinically normal subjects were volunteers who were over 65 years of age, never diagnosed with AD, and lacked AD neuropathology at autopsy. AD Brains exhibited Braak stages between V and VI, whereas control brains exhibited Braak stages between I and III. Postmortem frontal lobe tissues were obtained from the middle frontal gyrus tissues that had been rapidly frozen at autopsy (<10 h after death) and stored at −80 °C until use. Demographics of the study sample are listed in Table 1. Hepatocytoma HepG2, glioblastoma U-87 MG and U-118 MG cells (ATCC) were grown in 89% Dulbecco’s modified Eagle’s medium (DMEM) (Gibco); neuroblastoma SH-SY5Y cells (ATCC) were grown in 89% DMEM with F12 (Gibco). Both media were supplemented with 10% fetal bovine serum (FBS) (Gibco). Glioblastoma LN-229 cells (ATCC) were grown in 94% DMEM supplemented with 5% FBS. All cell cultures were supplemented with 1% penicillin/ streptomycin (Invitrogen) and cultured at 37 °C in a 5% CO2 atmosphere.
2.2. DNA/RNA Extraction and Genotyping
Genomic DNA and RNA were isolated from frozen PMB using the AllPrep DNA/RNA Mini Kit (Qiagen). Nucleic acid concentrations were measured by NanoPhotometer (Implen), and samples were stored at −20 °C prior to use. SNPs (assay #) were genotyped using TaqMan allelic discrimination assays purchased from Thermo Fisher Scientific as follows: rs429358 (C_3084793_20), rs7412 (C_904973_10), rs71352238 (C_98078714_10), rs2075650 (C_3084828_20), rs741780 (C_3084816_10), and rs10119 (C_8711595_10). All procedures were performed according to the manufacturers’ protocols. For rs10524523 (poly-T) S/L/VL typing, PCR was performed using primers chr19_50094846F (5′-cctccaaagcattgggatta) and chr19_50095058R (5′-gggacagggaaagaaaacaa). The length of the amplicons was then determined using a QIAxcel Advanced system (Qiagen) based on a high-resolution capillary electrophoresis. The expected amplicon size was calculated to be 179 bp + poly-T length in bp. The observed amplicon size was ≤198 bp for the S variant (poly-T ≤ 19); 199–208 bp for the L variant (poly-T = 20–29); and ≥ 209 bp for the VL variant (poly-T ≥ 30).
2.3. Sequence Alignment and Phylogenetic Tree
The TOMM40 mRNA and TOMM40L transcript reference sequences were obtained from NCBI Nucleotide database. All TOMM40 pseudogene sequences were extracted from UCSC Genome Browser’s UCSC DAS server, using the genomic coordinates (version hg38) obtained from NCBI Genes & Expression’s Gene database. The nucleotide sequences were aligned using NIH’s BLAST blastn program. The query was optimized for highly similar sequences (megablast). The extracted TOMM40 pseudogene sequences were blasted against TOMM40 mRNA reference sequence to query for percent identity. The Phylogenetic Tree was generated from Molecular Data with MEGA (https://0-doi-org.brum.beds.ac.uk/10.1093.molbev/mst012, accessed on 22 March 2021). The bootstrap value (or node) was calculated from resampling analysis as an indicator of good confidence in specific node. The substitution rate is defined as the number of nucleotides that were substituted per site per unit time.
2.4. Conventional End-Point PCR and Gel Electrophoresis
Expression of pseudogene RNAs was examined by end-point PCR. Total RNAs were extracted from cells and cDNA synthesis was performed using the PrimeScript RT Reagent Kit (Takara Bio, Mountain View, CA, USA). Pseudogene-specific primer sets were used to amplify each pseudogene template or cDNA. Information on the pseudogene-specific primers is listed in Table S1. DNA fragment analysis of the amplification reactions was performed in a QIAxcel (Qiagen).
2.5. Reverse Transcriptase (RT) Reaction and Quantitative PCR (qPCR) Assay
RT-qPCR assays were performed as previously reported [40]. Briefly, a fixed reverse-transcribed cDNA input (5 ng) was amplified using TaqMan assays or SYBR PCR assays in a QuantStudio 5 (Applied Biosystems, Thermo Fisher). The thermal cycling profile consisted of 2 min at 50 °C, 10 min at 95 °C, and then 40 cycles of 15 s at 95 °C and 1 min at 60 °C. The amplification efficiency of both TaqMan and SYBR PCR assays were measured by a standard curve method using serial dilutions in qPCR reactions and calculated using [10(−1/slope)] -1. The calculated amplification efficiency is as follows: 0.92 (total TOMM40 mRNA); 0.90 (TOMM40 IVS9); 0.89 (pseudogene P1b/P2); 0.91 (total TOMM40 Ex4-Ex5). For each sample, qPCR assays were performed in triplicate. Information on primers, probes, and TaqMan assays is listed in Table S1. For TOMM40 RNA quantification, all reactions were quantified by using a fixed threshold (0.15) in the linear range of amplification and recording the number of cycles (cycle threshold, CT) required for the fluorescence signal to cross the threshold. To control for the quantity of input RNA, we quantified ACTB mRNA as an internal control for each sample and obtained a normalized ΔCT value: mean of CT triplicate (target)–mean of the ACTB CT triplicate. In this setting, smaller ΔCT values indicate higher RNA transcription levels. Additionally, fold change (FC) of TOMM40 transcription levels of AD to Control subjects was computed as FC (AD) = 2−ΔΔCt, where ΔΔCT = mean ΔCT (AD)– mean ΔCT (Control) [41].
2.6. Fraction Estimation of Pseudogene RNA and Surrogate RNA Using Digital PCR (dPCR)
The P1b/P2 primer set was used to measure levels of pseudogene RNAs and IVS9 primers were used to amplify TOMM40 surrogate RNA by qPCR. A primer set spanning Ex4 and Ex5 was used for measuring levels of the total TOMM40 RNA pool. These primers were also used for RT-qPCR (SYBR) assays as listed in Table S1. We performed absolute quantification of RNA levels by QIAcuity dPCR (Qiagen). The QIAcuity carries out fully automated processing including all necessary steps of plate priming, sealing of partitions, thermocycling, and image analysis. We used the the QIAcuity Nanoplate 26K 24-well. For each well, 40 μL reaction contained 13.3 μL of 3x EvaGreen PCR master mix (Qiagen), 0.4 μM of each forward and reverse primer, and a fixed concentration of cDNA template 3 μL (15 ng). The thermal cycling program consisted of 2 min at 95 °C, 40 cycles of 15 s at 95 °C, 20 s at 55 °C, and 1 min at 72 °C, and then 5 min at 40 °C. We computed the fraction of target RNA (pseudogene RNA or surrogate IVS9 RNA) by dividing the number of copies/μL of target RNA by the number of copies/μL of total TOMM40 RNA pool. For the quality control of QIAcuity dPCR, we replicated the assay with different amounts of template input and showed the reproducibility of the fraction of the target RNA in the total TOMM40 RNA pool.
2.7. Hydorogen Peroxide Treatment
Twenty-four hours prior to treatment, the cells were seeded at a density of 70–80%. For RNA transcription and mitochondrial DNA (MtDNA) copy number assays, cells were seeded on a 6-well plate, whereas a 96-well plate was used for the mitochondrial membrane potential assay. We searched the literature for the effects of hydrogen peroxide on mitochondrial function. Based on previously published conditions, we tested multiple concentrations (100 µM, 200 µM, 250 µM, 500 µM and 1 mM) of hydrogen peroxide in the cell lines and selected 500 µM as an optimal concentration that maintained good cell viability and had noticeable effects on mitochondrial function. The seeded cells were then treated with 500 μM Hydrogen peroxide, H2O2, (Sigma) in growth media. For controls, the same number of cells were plated and cultured without H2O2. Cells were collected 24 h post-treatment, subjected to genomic DNA and total RNA isolation, followed by measurement of MtDNA copy number and RNA transcription levels. Three to four independent treatments with H2O2 were performed.
2.8. MtDNA Copy Number Assay
Reactions for MtDNA copy number count and single copy reference gene, HGB (Hemoglobin), were run separately with 10 ng of DNA in a 384-well optical plate. Each reaction was run in triplicate on QuantStudio 5 (Applied Biosystems, Thermo Fisher, Foster City, CA, USA). The 10 μL reaction included 10 ng of DNA, 5 μL of 2x Power SYBR Green PCR Master Mix (Applied Biosystems, Thermo Fisher), and 0.05 μM of each forward and reverse primer. Thermal cycling profile consisted of 2 min at 50 °C, 10 min at 95 °C, and then 40 cycles of 15 s at 95 °C, 60 s at 56 °C, and 60 s at 72 °C. The ΔCT method was used to control for the quantity of input DNA for each sample by quantification of HGB DNA. The normalized ΔCT value was calculated: mean of MtDNA CT triplicate– mean of the HGB CT triplicate. The fold change (FC) of the MtDNA copy number isolated from H2O2-treated cells to untreated cells was computed as FC (treated) = 2-ΔΔCT, where ΔΔCT = ΔCT (treated) − ΔCT (untreated) [41].
2.9. Mitochondrial Membrane Potential (MMP) Assay
MMP of the human cell lines was analyzed using a MitoProbe JC-1 assay kit (Thermo Fisher). The cationic dye, JC-1 (5′,6,6′-tetrachloro-1,1′,3,3′-tetraethylbenzimidazolyl-carbocyanine iodide), exhibits potential-dependent accumulation in mitochondria, which is indicated by a fluorescence emission shift from monomeric green (529 nm) to JC-1 aggregates red (590 nm). Consequently, MMP change in response to cellular stimuli is represented by the ratio of red to green fluorescence intensity. The membrane potential disrupter, CCCP (carbonyl cyanide 3-cholorophenylhydrazone), was included in all assays as a control to confirm that the JC-1 response is sensitive to changes in membrane potential. Twenty-four hours prior to the hydrogen peroxide treatment, cells were seeded at a density of 70–80% on a black 96-well plate with a clear bottom. The seeded cells were treated with 500 μM H2O2 for 24 h and then assayed for MMP measurements. A quantity of 2 μM JC-1 was added and incubated at 37 °C, 5% CO2 for 30 min. The reaction plate was washed with PBS and the fluorescence was measured with 488 nm excitation and green (529 nm) or red (590 nm) emission using SpectraMax M2 plate reader (Molecular Devices). All procedures were performed according to the manufacturers’ protocols. Fold change (FC) of membrane potential of H2O2-treated cells to untreated cells was computed as FC (treated) = ratio of red to green (treated)/ratio of red to green (untreated). Three independent MMP assays were performed for each H2O2 treatment for each cell type.
2.10. Statistical Analyses
The qPCR data is expressed as normalized ΔCT values and was calculated as follows, ΔCT value = mean of CT triplicate (target)–mean of the ACTB CT triplicate. Statistical analyses were performed using independent samples t-test using the Statistical Package for the Social Sciences (SPSS) version 19 (SPSS). The MtDNA copy number assay and membrane potential assay were not performed in the same cell setting because the membrane potential assay needs to be conducted on live cells. For this reason, data were not statistically compared.
3. Results
3.1. Presence of Pseudogene RNAs Obscures Accurate Measurement of TOMM40 mRNA
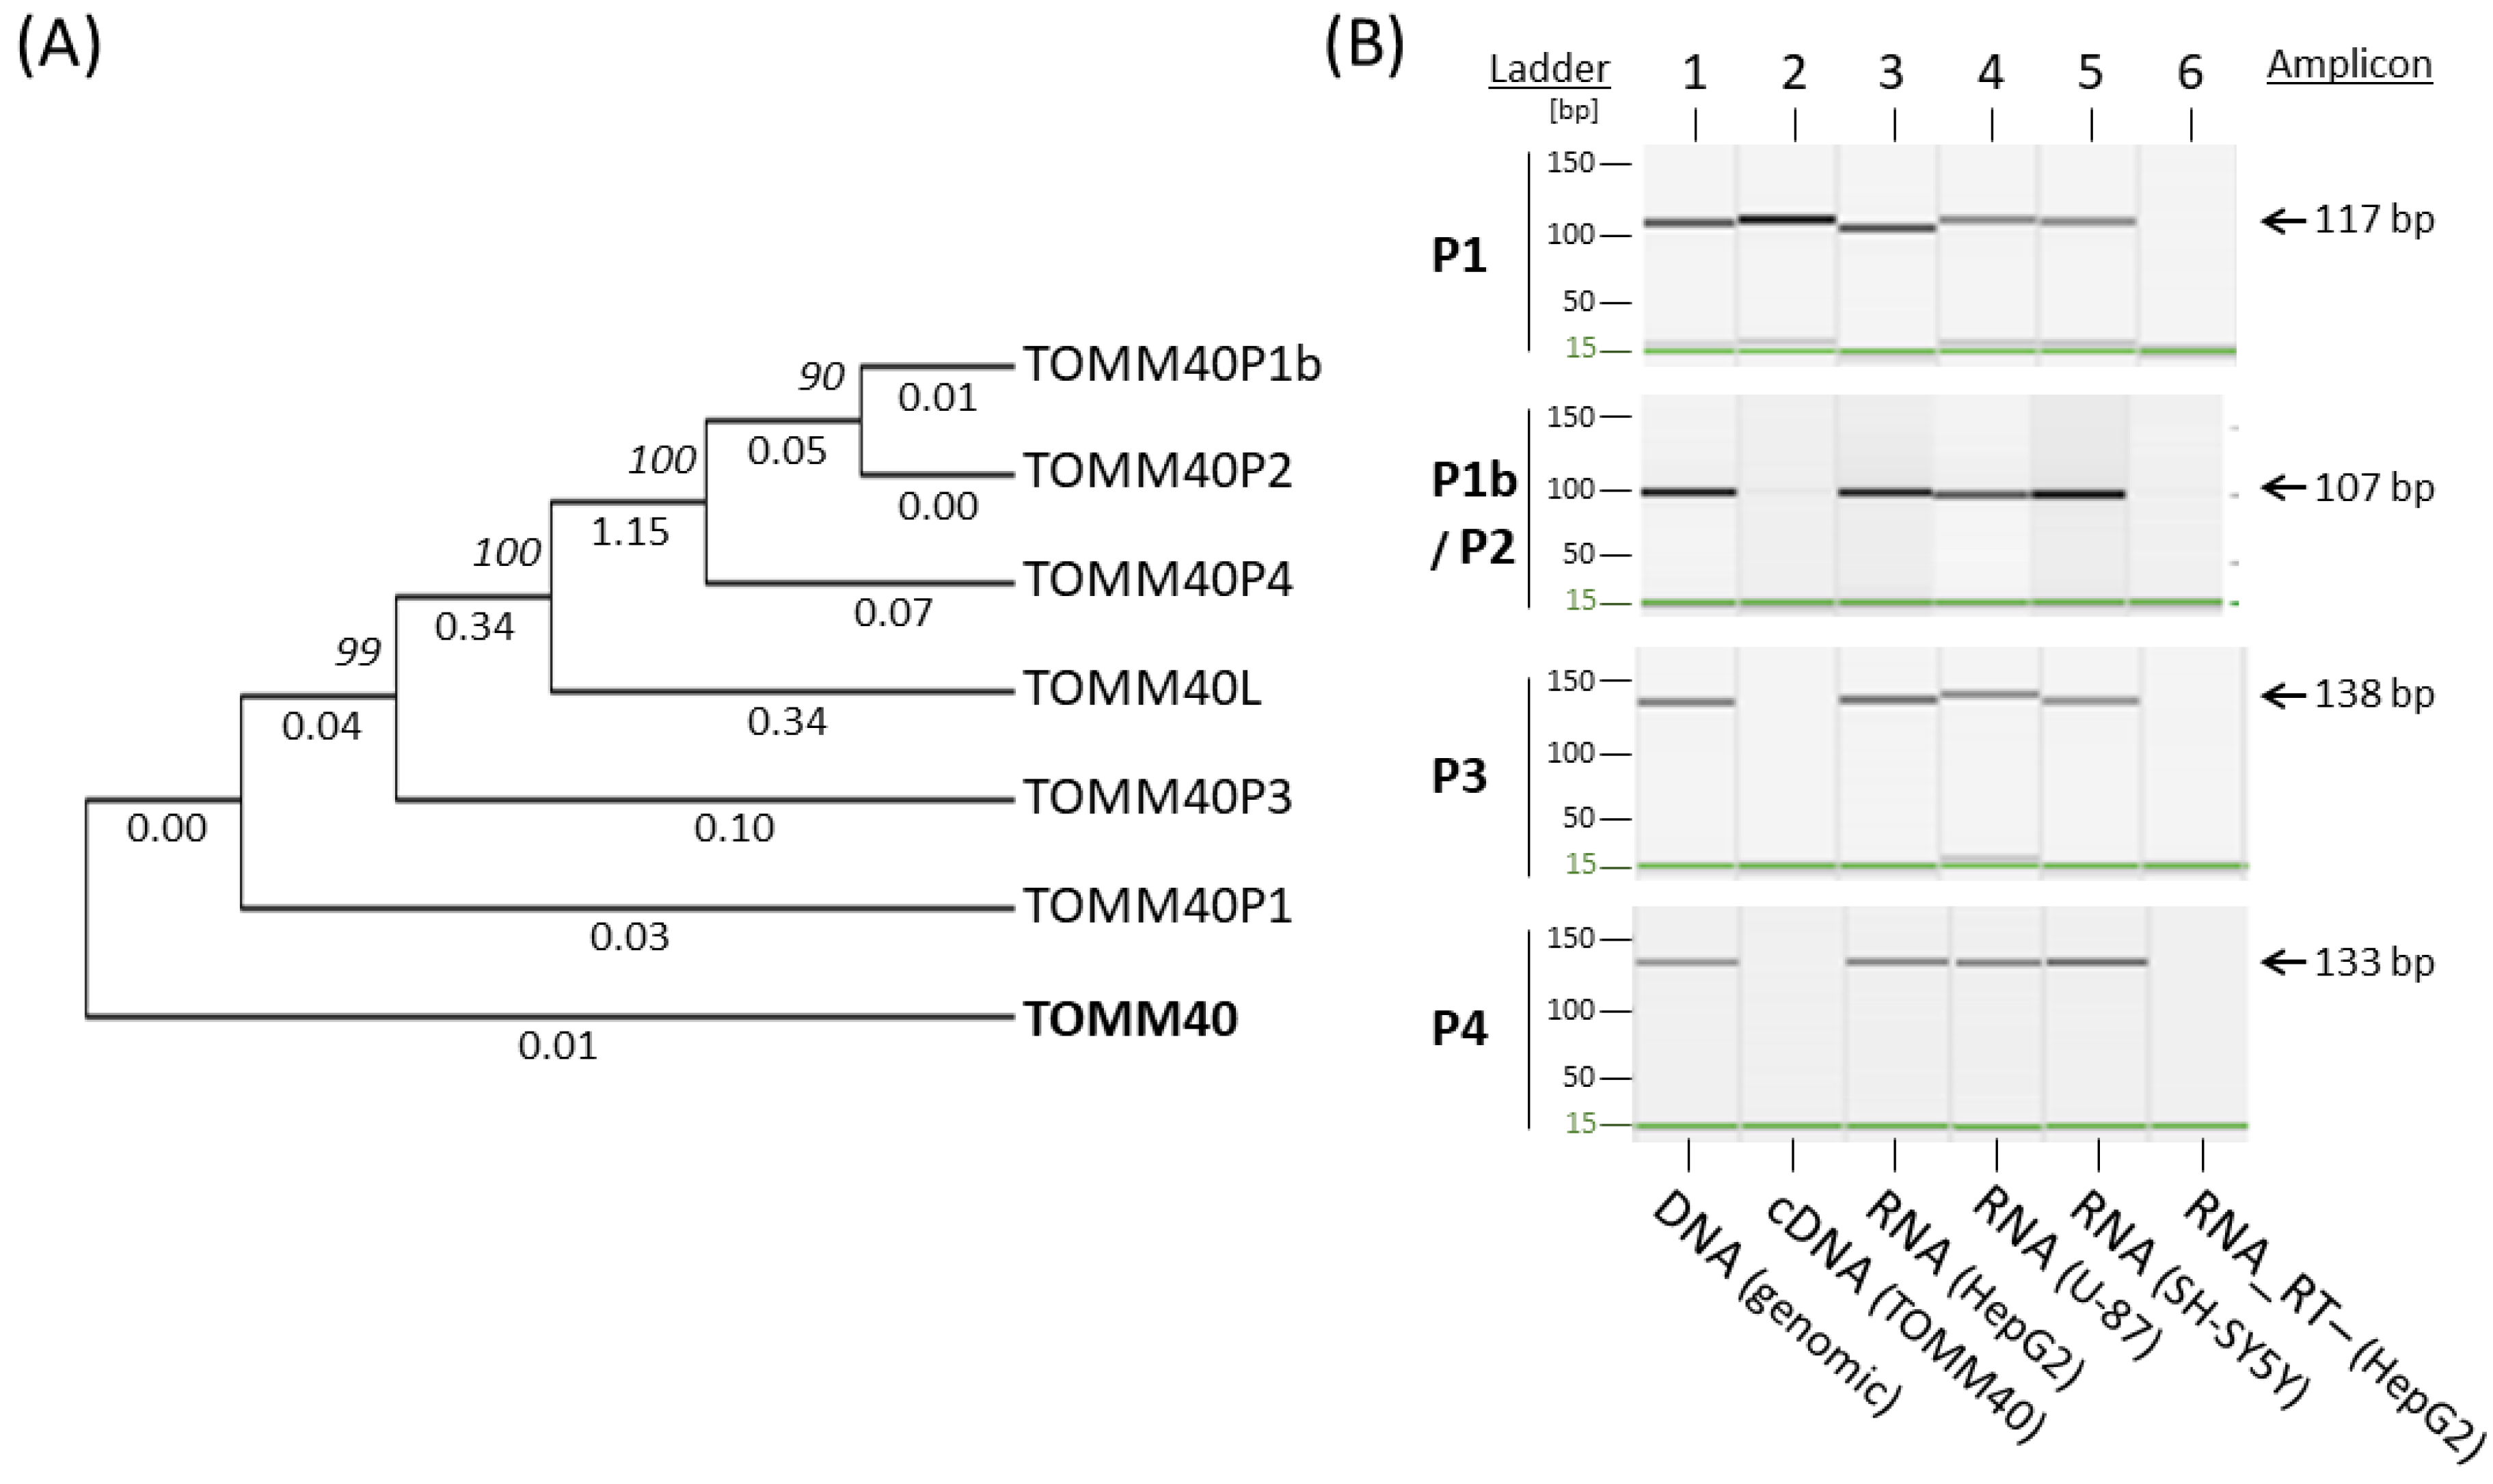
The transcription levels of TOMM40 mRNA in human brain and its association with AD risk have not been fully established. Studies have reported conflicting results of either up- or down-regulated TOMM40 mRNA in AD brains. The measurement of a gene’s mRNA levels should be a straightforward procedure unless other complications confound this measurement; apparently, an unknown barrier exists in the measurement of TOMM40 mRNA. To expose this obstacle, we first inspected the specificity of TOMM40 cDNA by aligning this sequence to the human genome (hg38) using the Blat tool in the UCSC genome browser (http://genome.ucsc.edu/, accessed on 18 March 2021). Besides TOMM40 itself, the alignment showed six additional hits, including one known gene (TOMM40L) with moderate homology to TOMM40 and five loci with a high degree of sequence homology. All five of these highly homologous loci contain a TOMM40 cDNA-like sequence lacking either TOMM40 introns or a full open reading frame, classic characteristics of a pseudogene. When queried the public databases, we found established pseudogene records for four of the five loci in the HUGO gene database (https://www.genenames.org/, accessed on 18 March 2021) with the designated nomenclatures of TOMM40P1, P2, P3, and P4. We designated the unnamed pseudogene “TOMM40P1b” due to its proximity to TOMM40P1. The genomic location, span, and similarity to TOMM40 cDNA of these pseudogenes are listed in Table 2. A phylogenetic tree analysis indicated that they are indeed closely related to each other (Figure 1A).
Because a large portion of the human genome’s non-coding regions, including pseudogenes, can produce RNA transcripts [42], we wondered whether these TOMM40 pseudogenes can be transcribed into RNA. To address this question, we developed new RT-PCR assays designed to specifically amplify each pseudogene’s putative RNA transcripts and generated pseudogene-specific DNA templates to serve as positive controls. To generate pseudogene templates, we PCR amplified each pseudogene’s genomic region using primer sets (Table S1) flanking immediate up- and down-stream segments of each pseudogene, and then purified these PCR fragments using agarose gel electrophoresis. Each pseudogene template contains the entire pseudogene sequence, thus mimicking its putative cDNA. Except for TOMM40P1, which is flanked by heavy repetitive sequences and could not be amplified, we successfully generated DNA templates for the remaining four pseudogenes (P1b, P2, P3, and P4). Due to high homology between P1b and P2, as seen in the phylogenetic tree (Figure 1A), we combined these two into a single template of P1b/P2. To design specific primers for the TOMM40 pseudogene RNA assays, we first identified nucleotide variants among sequences of TOMM40 cDNA and pseudogenes using Clustal Omega’s sequence alignment (https://www.ebi.ac.uk/Tools/msa/clustalo/, accessed on 10 June 2019). We then designed allele-specific PCR primers that carry the unique nucleotide(s) of each pseudogene at the 3′-end of the primers (Table S1). We tested these primers’ specificities in our collection of pseudogene templates using conventional end-point PCR and capillary gel electrophoresis. The results showed a robust amplification by each specific primer set with its own template, but they also showed various degrees of cross-amplifications with other pseudogene templates (Figure S1), implying that the allele-specific primers cannot fully differentiate each pseudogene. Nevertheless, these primers provide a molecular tool that makes detection of RNA transcripts of the TOMM40 pseudogenes feasible.
Using these pseudogene-specific primers, we tested whether putative RNAs of the TOMM40 pseudogenes could be detected in human cell lines (HepG2, U-87, and SH-SY5Y). Because the expected amplicons of pseudogene RNAs can also be generated from pseudogenes’ corresponding genomic DNA, we performed DNase digestion for all RNA isolations and included RT-negative controls for all experiments. In these experiments, we also integrated a TOMM40 cDNA control that was RT-PCR generated using TOMM40 cDNA-specific primers. We then performed RT-PCR reactions using total RNA isolated from these cells. The capillary gel electrophoresis showed that all pseudogenes-specific amplicons were amplified in all cell lines tested, with no amplification from RT-negative controls (Figure 1B). None of the pseudogene primer sets amplified TOMM40 cDNA except the primer set of P1 (Figure 1B, lane 2), which is likely due to the high homology between TOMM40 cDNA and P1. The similarity of these two sequences in the phylogenetic tree further supported this notion (Figure 1A). Together, these results indicated that all TOMM40 pseudogenes can produce RNA transcripts and some of these transcripts closely resemble TOMM40 mRNA.
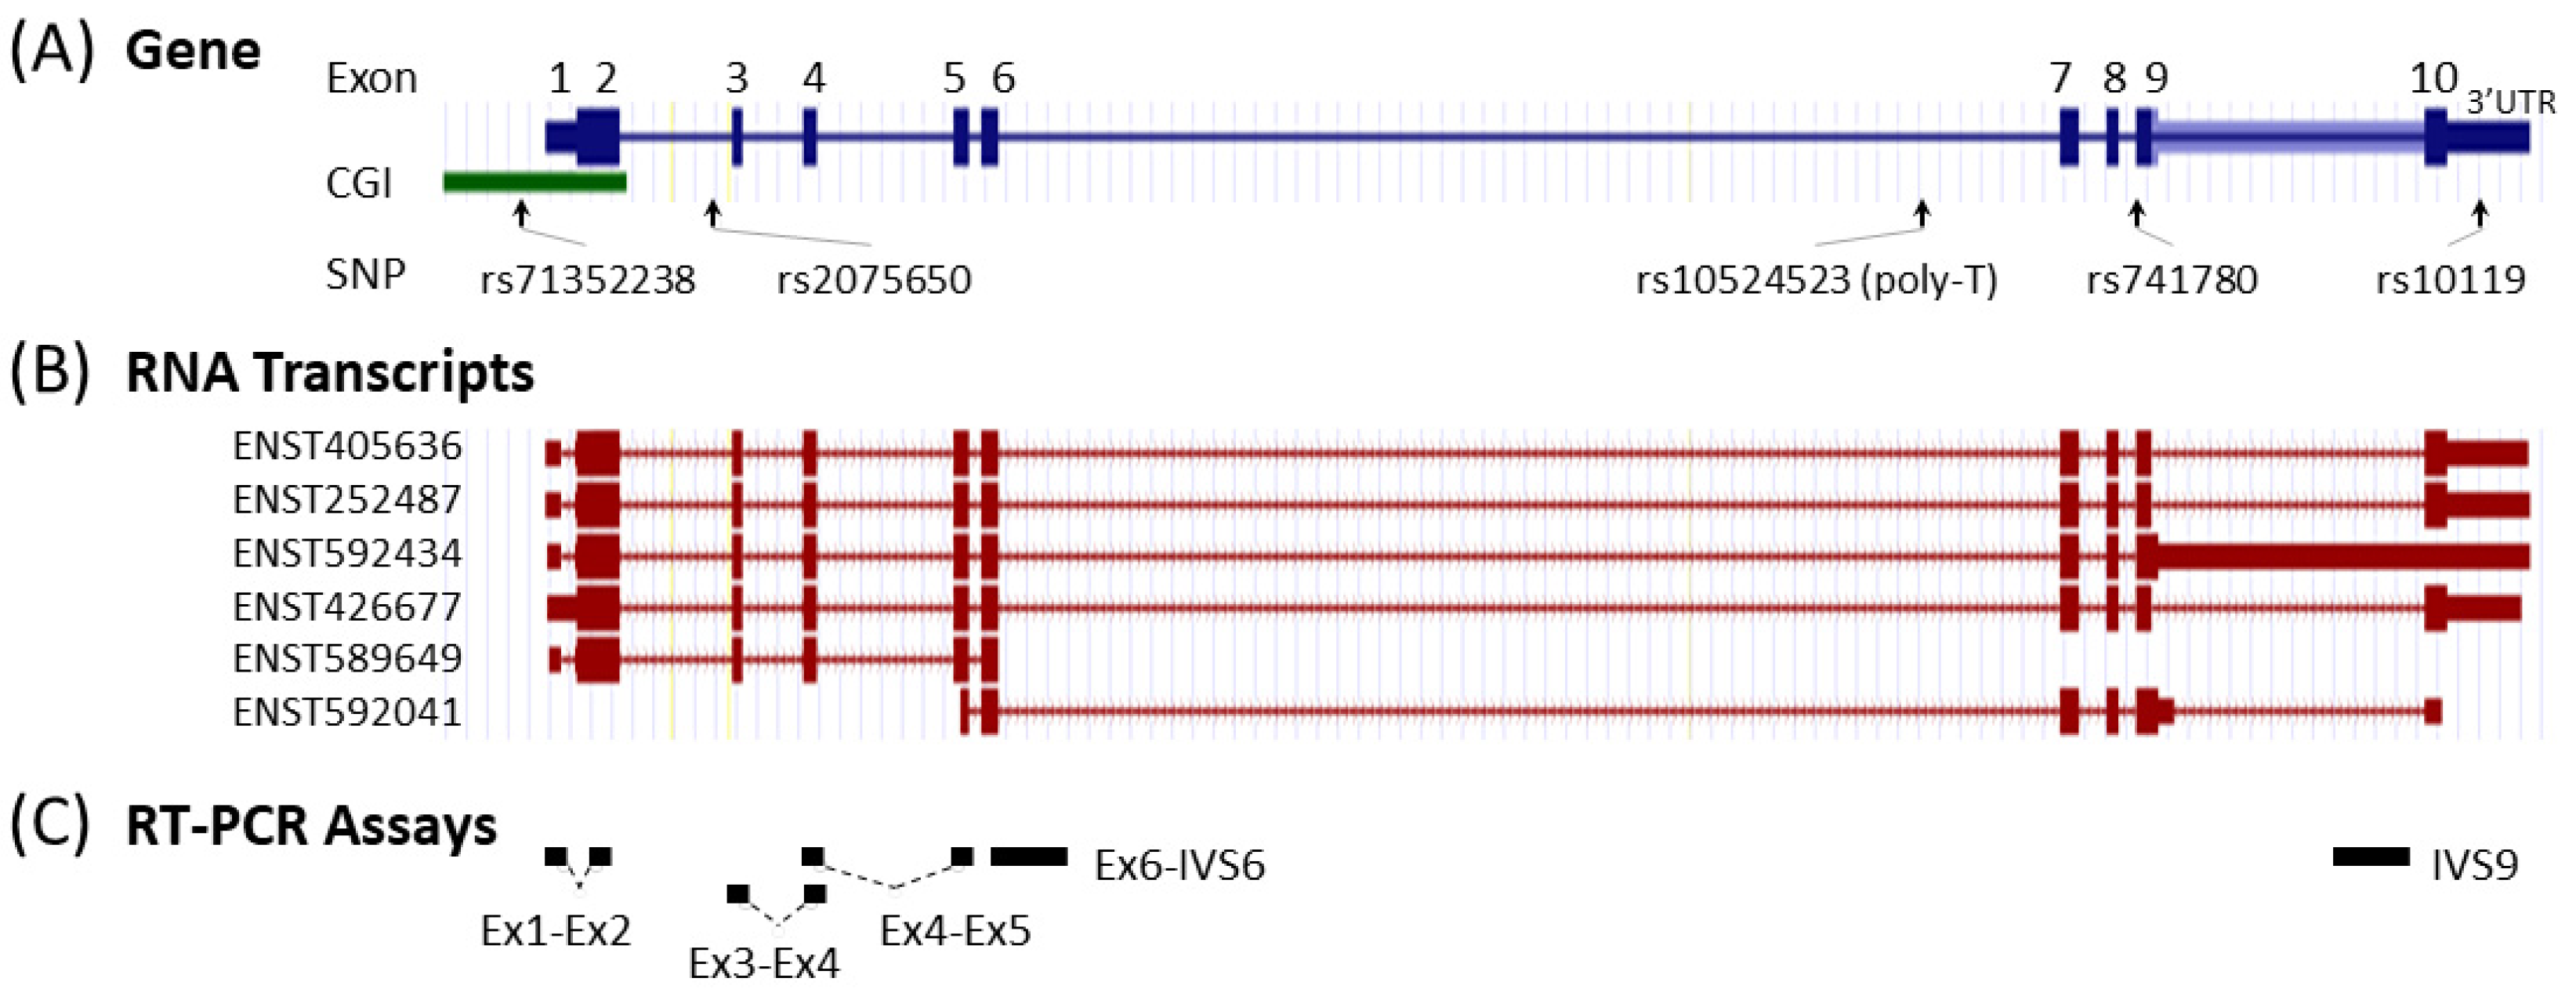
We also attempted to generate TOMM40 cDNA-specific primers that could separate TOMM40 mRNA from the pseudogene RNAs. The TOMM40 gene consists of 10 exons and six mRNA transcripts (Figure 2A,B). We applied the same allele-specific primer design method to integrate TOMM40 cDNA-specific nucleotide variants at the 3′-end of the primers. Using this approach, we generated two TOMM40 cDNA assays that amplify across the splicing junctions of exons 1–2 (Ex1-Ex2) and exons 3-4 (Ex3-Ex4) (Figure 2C). When subjected to RT-PCR experiments, these two assays effectively amplified cDNA templates of TOMM40; however, they also showed leaky attributes and cross-amplification of all pseudogene templates (Figure S2). This result suggests that RNA transcripts of TOMM40 and pseudogenes cannot be fully separated even with the meticulously designed allele-specific primers.
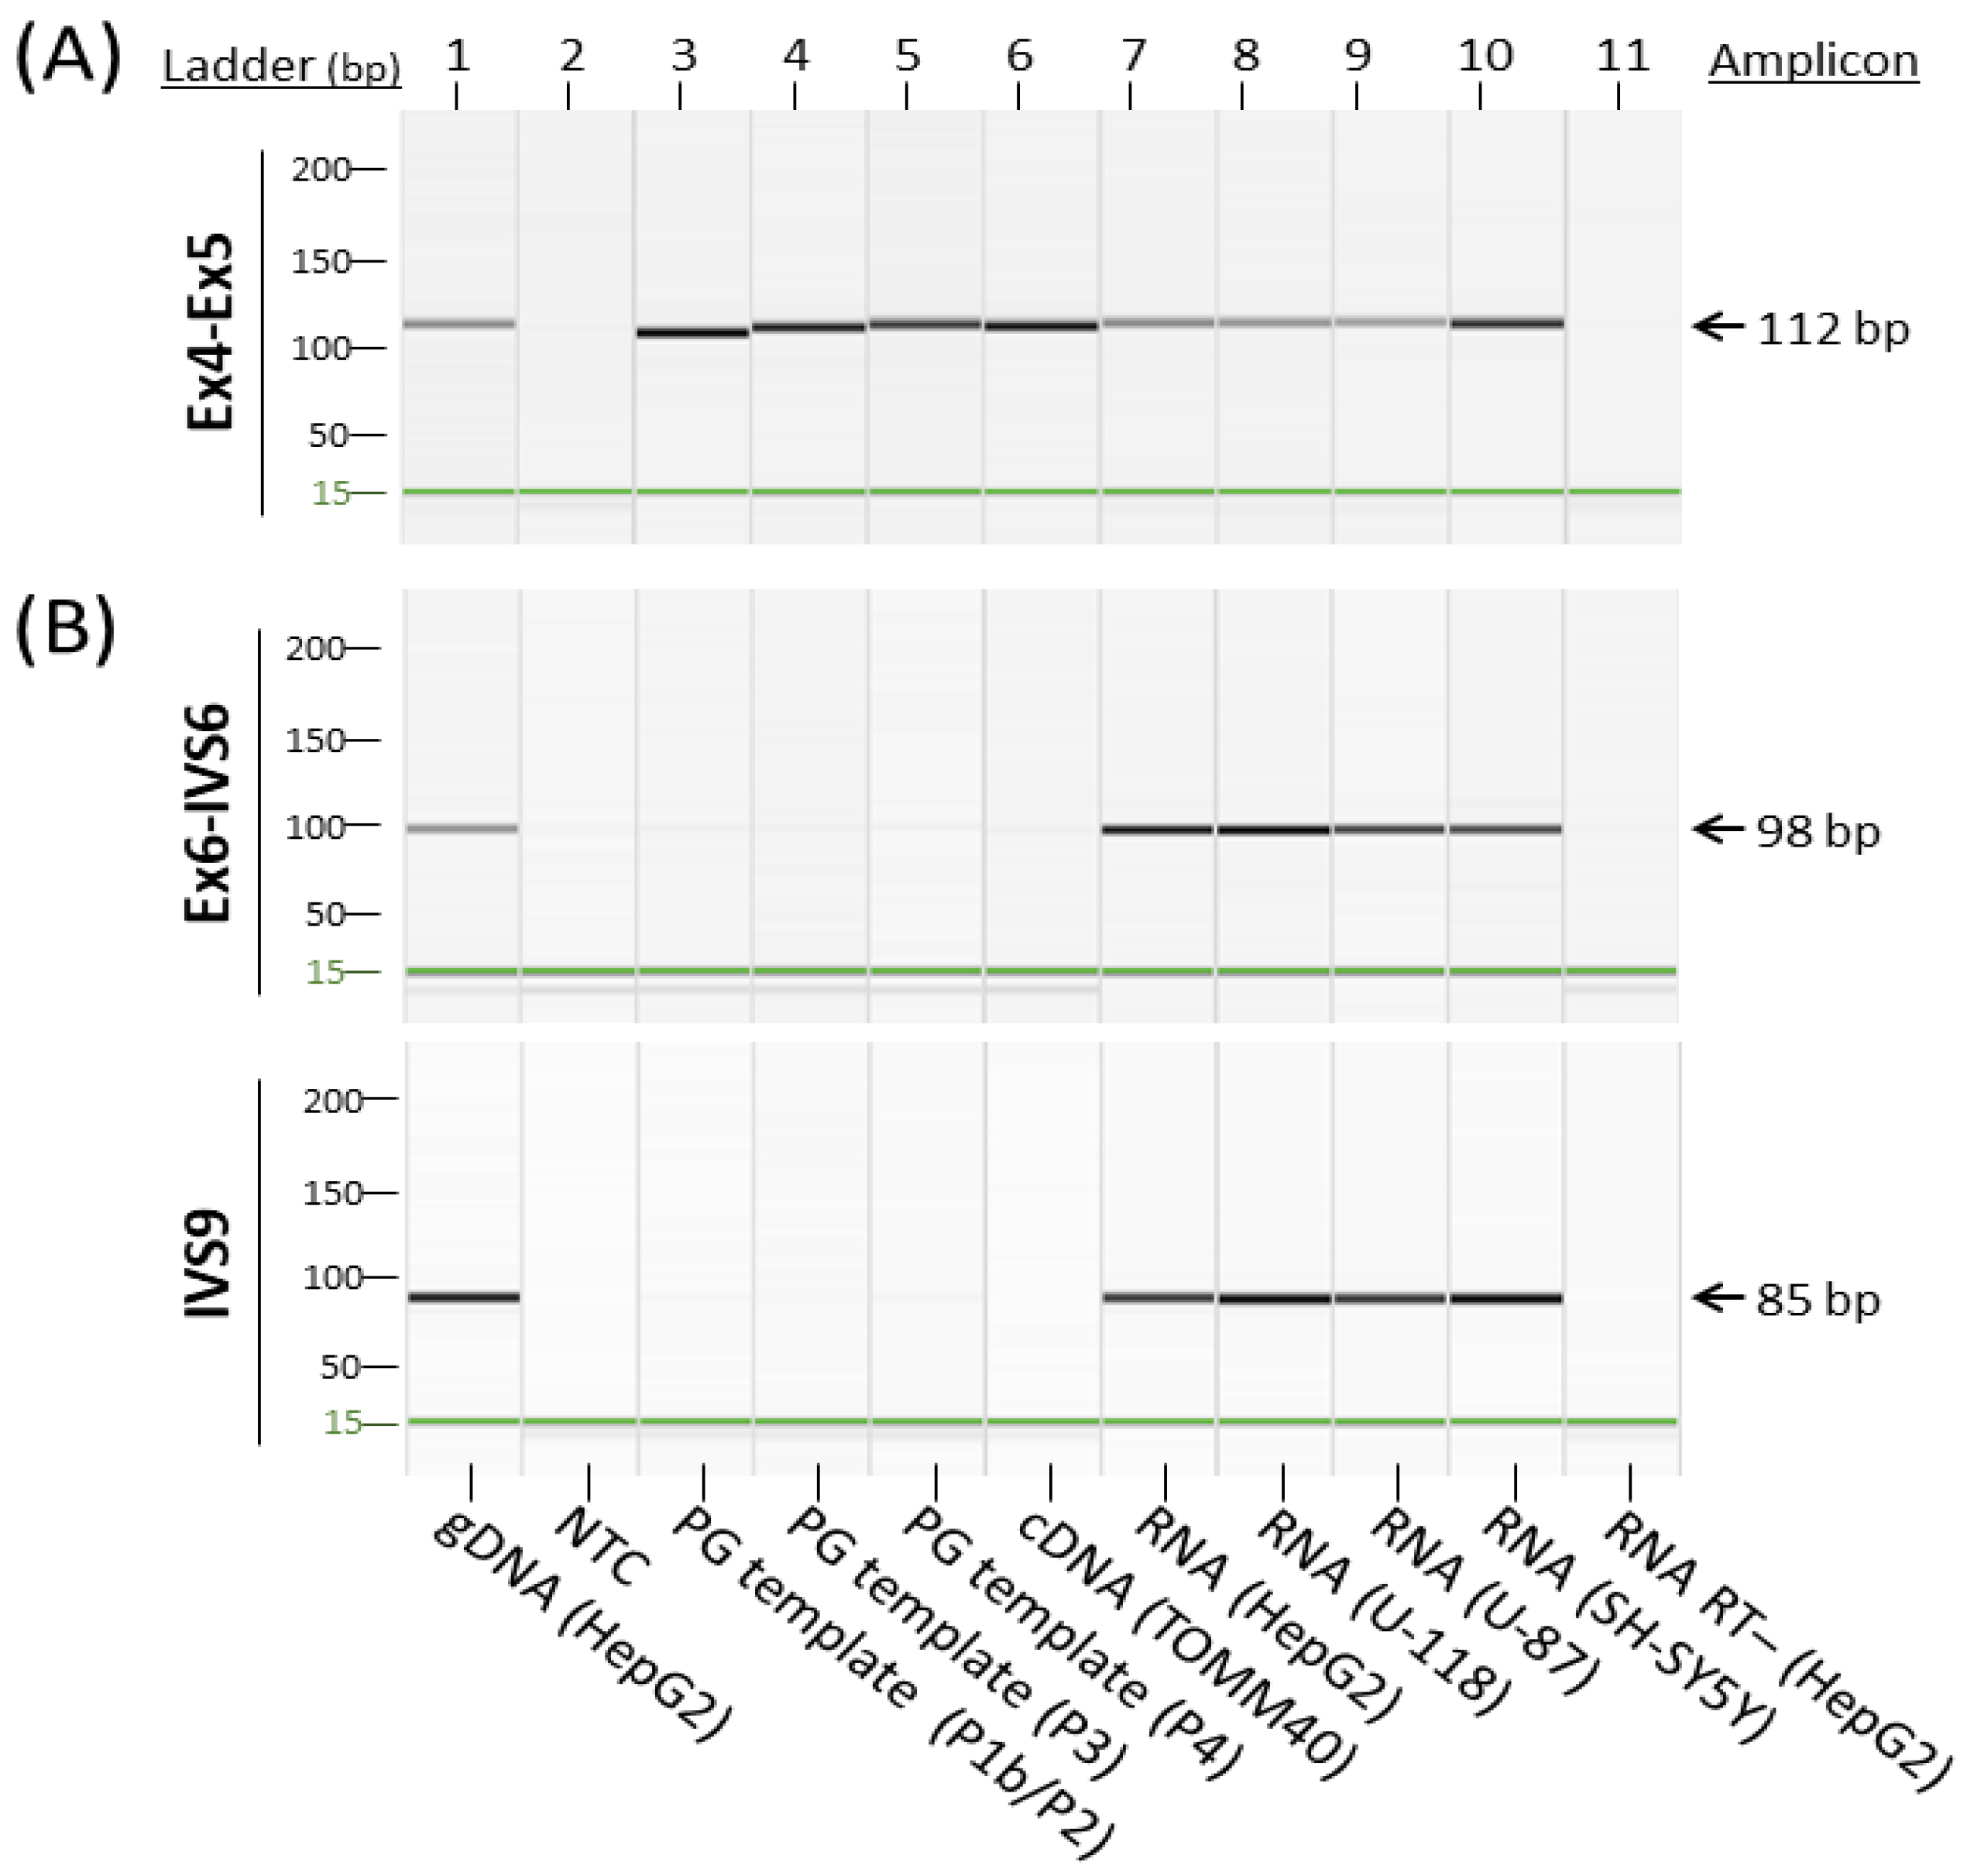
Learning from these observations, we suspected that the RNA transcription levels determined by commonly used TOMM40 gene expression assays likely include both RNA species of TOMM40 and its pseudogenes. We then designed experiments to further examine this possibility. Because exact primer and probe sequences of the commercial assays are not publicly available, we generated a TOMM40 cDNA assay that spans splice junctions of exons 4-5 (Ex4-Ex5), the general area targeted by a popular TOMM40 TaqMan expression assay (Thermo Fisher, assay Hs01587378_mH). When tested using end-point PCR, this assay cross-amplified all pseudogene templates (Figure 3A). This result is further evidence that conventional RT-PCR-based TOMM40 assays likely quantify transcription levels of the entire TOMM40-related RNA pool, which consists of both TOMM40 mRNA and its pseudogenes’ RNAs. Such assays cannot provide accurate measurements of true TOMM40 mRNA.
3.2. Development of TOMM40-Specific RT-PCR Assays
To obtain authentic transcription levels of TOMM40 mRNA, one could apply a deduction method in which pseudogene transcription levels are subtracted from the total TOMM40-related RNA pool. However, we found that most pseudogene-specific primer sets could cross-amplify templates of other pseudogenes (Figure S1), which made the precise measurement of each pseudogene RNA level unfeasible. Instead, we were only able to estimate the fraction of RNA representing pseudogenes within the total TOMM40 RNA pool. We reasoned that the P1b/P2 primer set can cross-amplify P3 and P4 in addition to its own template (Figure S1); using this one primer set allows us to access the transcription levels representing a large portion of the pseudogene RNAs while excluding amplification of the true TOMM40 RNA. When they were compared with the results of the Ex4-Ex5 assay, which represents a measurement of the total TOMM40-related RNA pool, we were able to approximate the proportion of the pseudogene RNAs. We applied this strategy on total RNA isolated from a subset of PMB tissues (AD n = 29 and control n = 16) and quantified the cDNA targets using digital PCR (dPCR). From each subject, two amplicons (P1b/P2 and Ex4–Ex5) were quantified separately, and the absolute quantification count of P1b/P2 was then divided by the count of Ex4–Ex5 to generate the fraction. The result showed that P1b/P2 RNA constituted around 10–18% of the total TOMM40-related RNA pool (Table S2). A detailed procedure for this comparison and calculation is listed in the methods section. Provided that this estimation did not include P1 levels, the actual fraction of the pseudogene RNAs in the total TOMM40-related RNA pool could be substantially higher.
The results described above prompted us to conclude that in order to eliminate cross-amplification of TOMM40 pseudogene RNAs and accurately quantify TOMM40 transcription, there is a need to develop an unconventional RT-PCR assay. Accordingly, we explored assays designed to target the primary RNA transcript of the TOMM40. We reasoned that the main difference between TOMM40 mRNA and pseudogene RNAs lies in its primary transcript―with pseudogenes lacking intronic sequences. While the primary transcript (pre-mRNA) transcription level is expected to be only a fraction of the spliced mRNA transcription level, this proportion is likely retained consistently across samples obtained from same cell/tissue-types. Thus, an RT-PCR assay based on this principle could provide an accurate surrogate measurement of the actual mRNA transcription level, which can then be used to compare samples from human subjects.
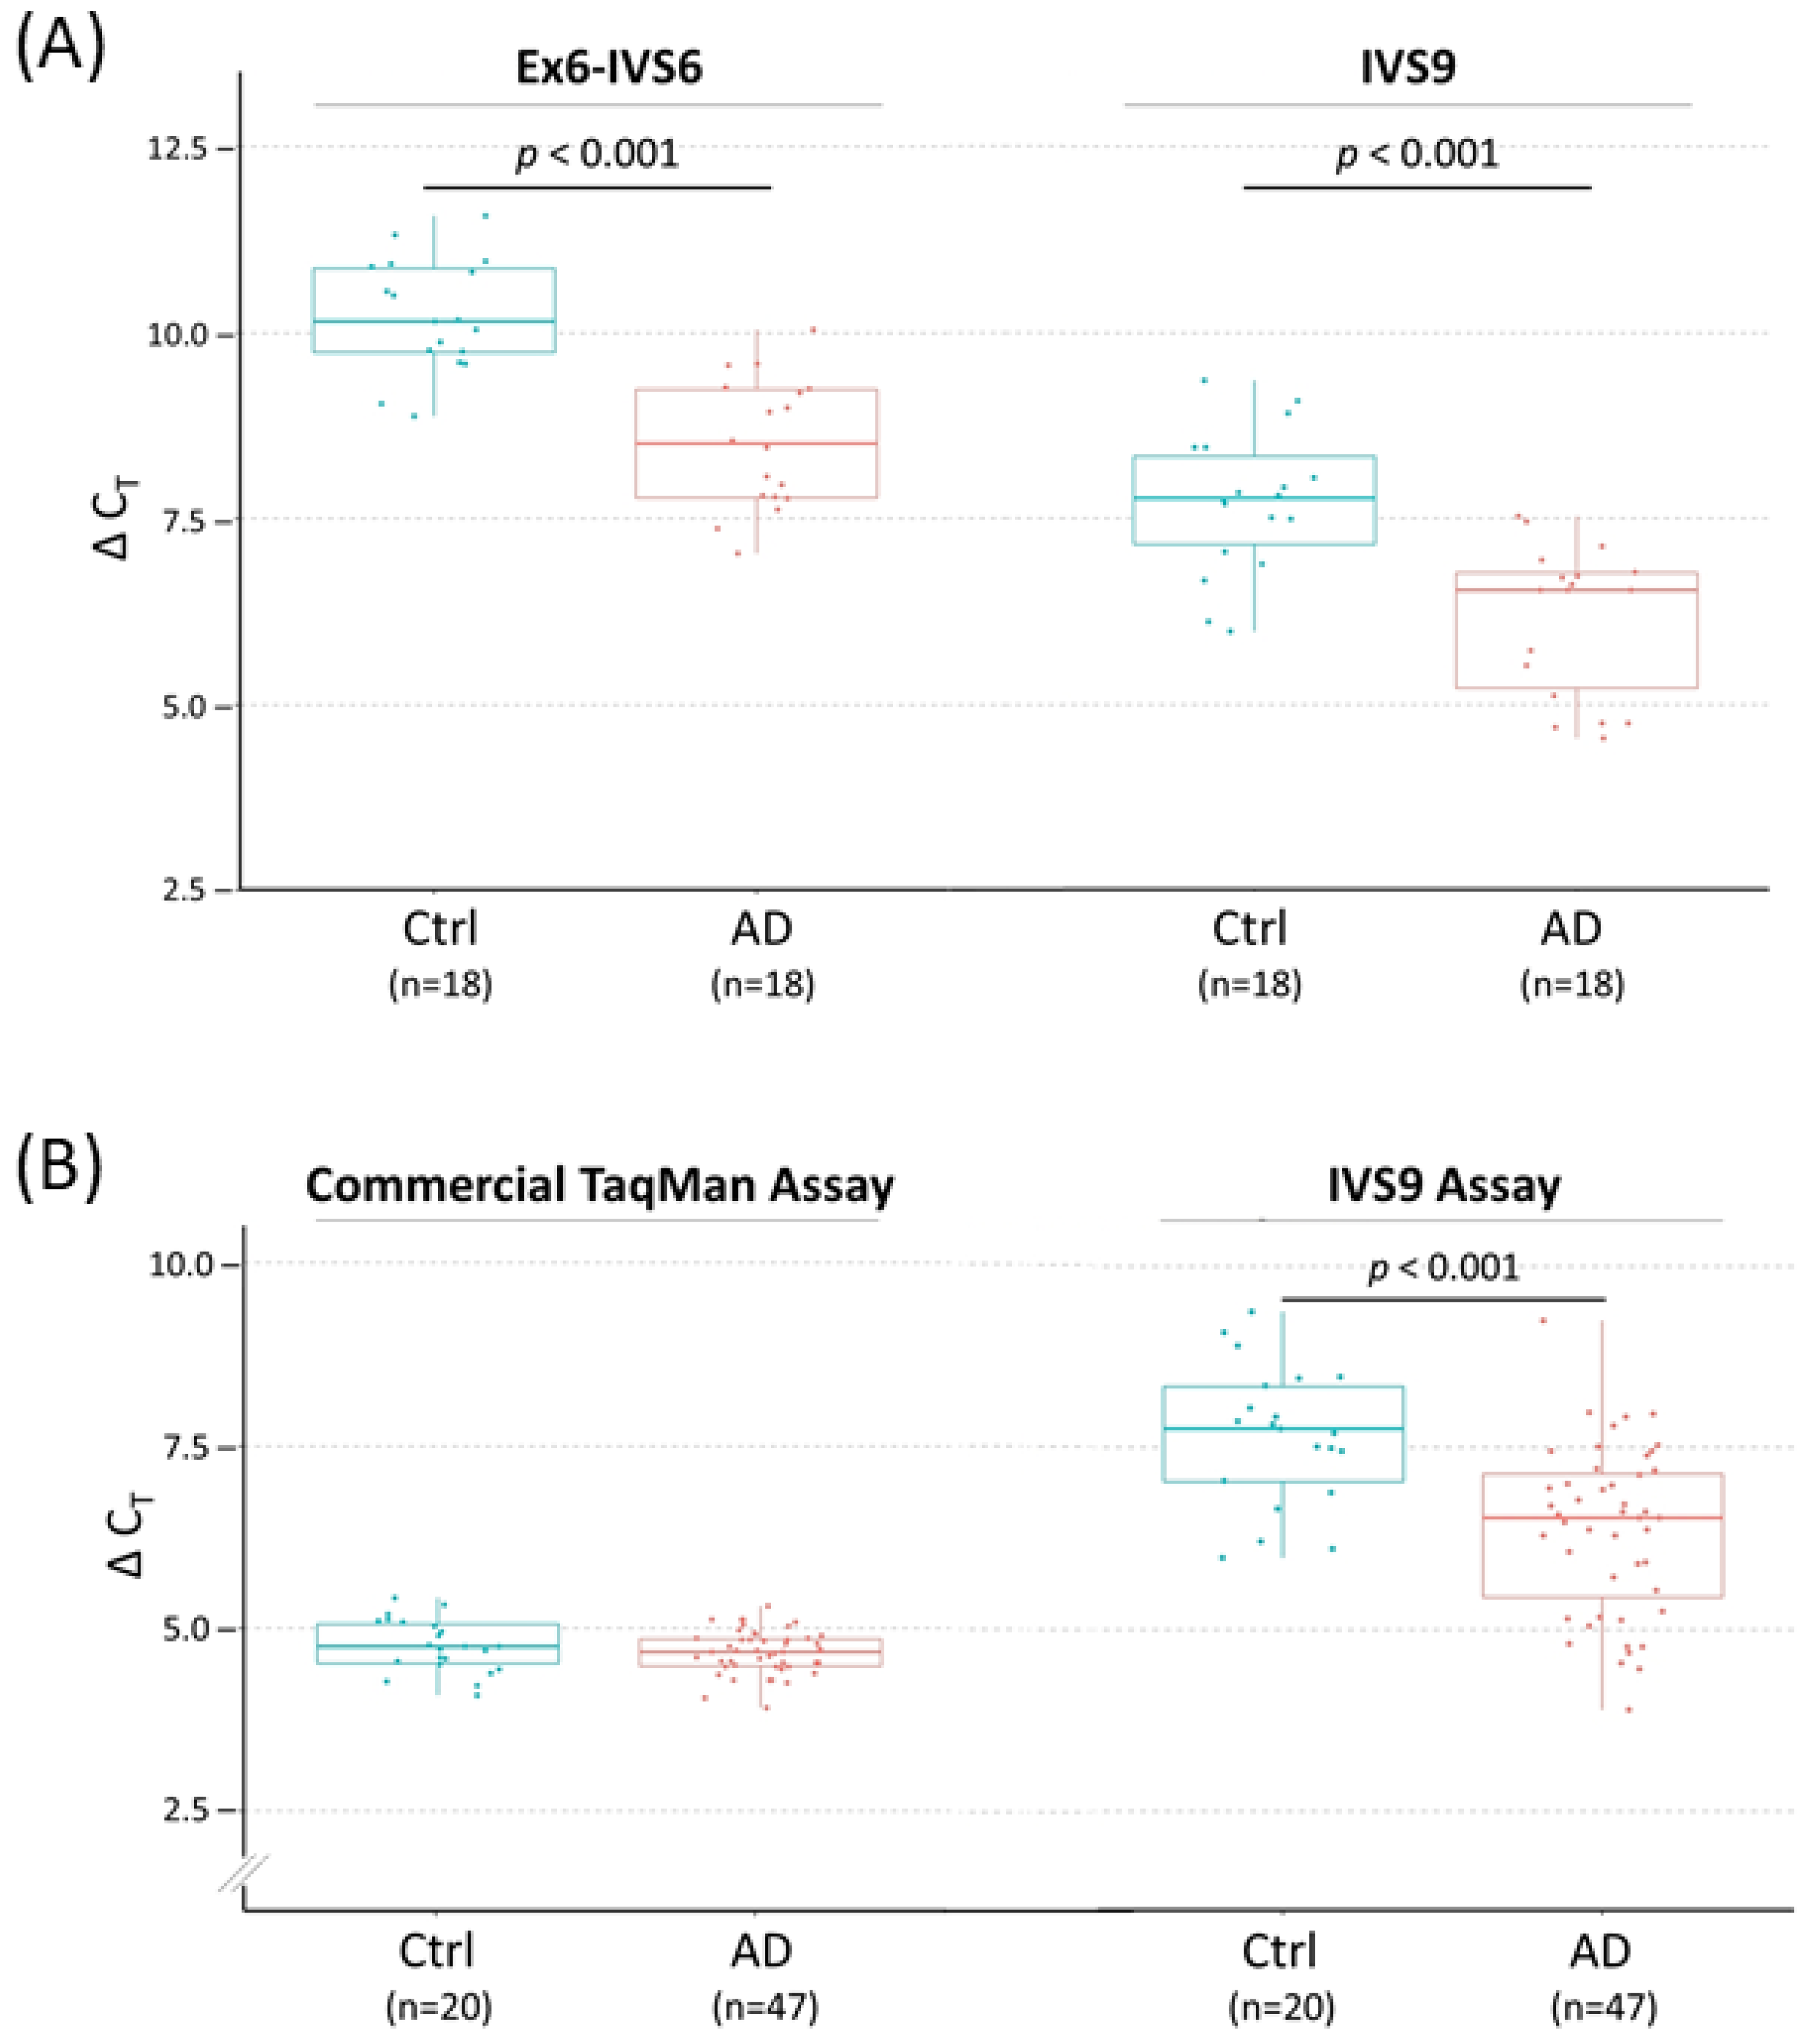
Based on this rationale, we first inspected the RNA structure of TOMM40 using the Ensembl RNA track in the UCSC genome browser. This track shows the presence of six variants of TOMM40 RNA transcripts (Figure 2B). To cover the majority of these transcripts, we designed two sets of TaqMan-based assays with one extending from exon 6 into intron 6 (Ex6-IVS6) and a second one extending within intron 9 (IVS9). Map locations of these assays are shown in Figure 2C, and corresponding primers and probe sequences are shown in Table S1. Initial conventional end-point PCR tests with their respective primers showed that both assays amplified RNA samples isolated from all four human cell lines (HepG2, U-118, U-87, and SH-SY5Y) with the expected amplicons. More importantly, no pseudogene amplicons were amplified by these new assays (Figure 3B). We next evaluated these assays in PMB tissues using a TaqMan (primers plus probe) setting in RT-qPCR. When these two assays were compared side by side, they both showed consistent expression patterns (≈2 ΔCT difference) between AD and control frontal lobes (Figure 4A). Between these two assays, the IVS9 assay showed a higher sensitivity, as indicated by its lower ΔCT value; thus, we selected this assay for our surrogate quantification of TOMM40 mRNA. We estimated that RNA levels measured by the IVS9 surrogate assay represent approximately 7–20% of the total TOMM40-related RNA pool levels using the same dPCR approach mentioned above (Table S2). We then applied this IVS9 assay to quantify TOMM40 mRNA transcription levels in human PMB samples and compared these levels to the ones generated from the commercial TaqMan assay (Thermo Fisher, Hs01587378_mH). No differences in TOMM40 mRNA transcription levels were observed between AD and control when the commercial assay was used. On the contrary, TOMM40 mRNA showed significantly (p < 0.001, t-test) higher expression (≈2.5-fold) in AD compared to control when the IVS9 assay was used (Figure 4B).
3.3. Effects of TOMM40 RNA Transcription Levels
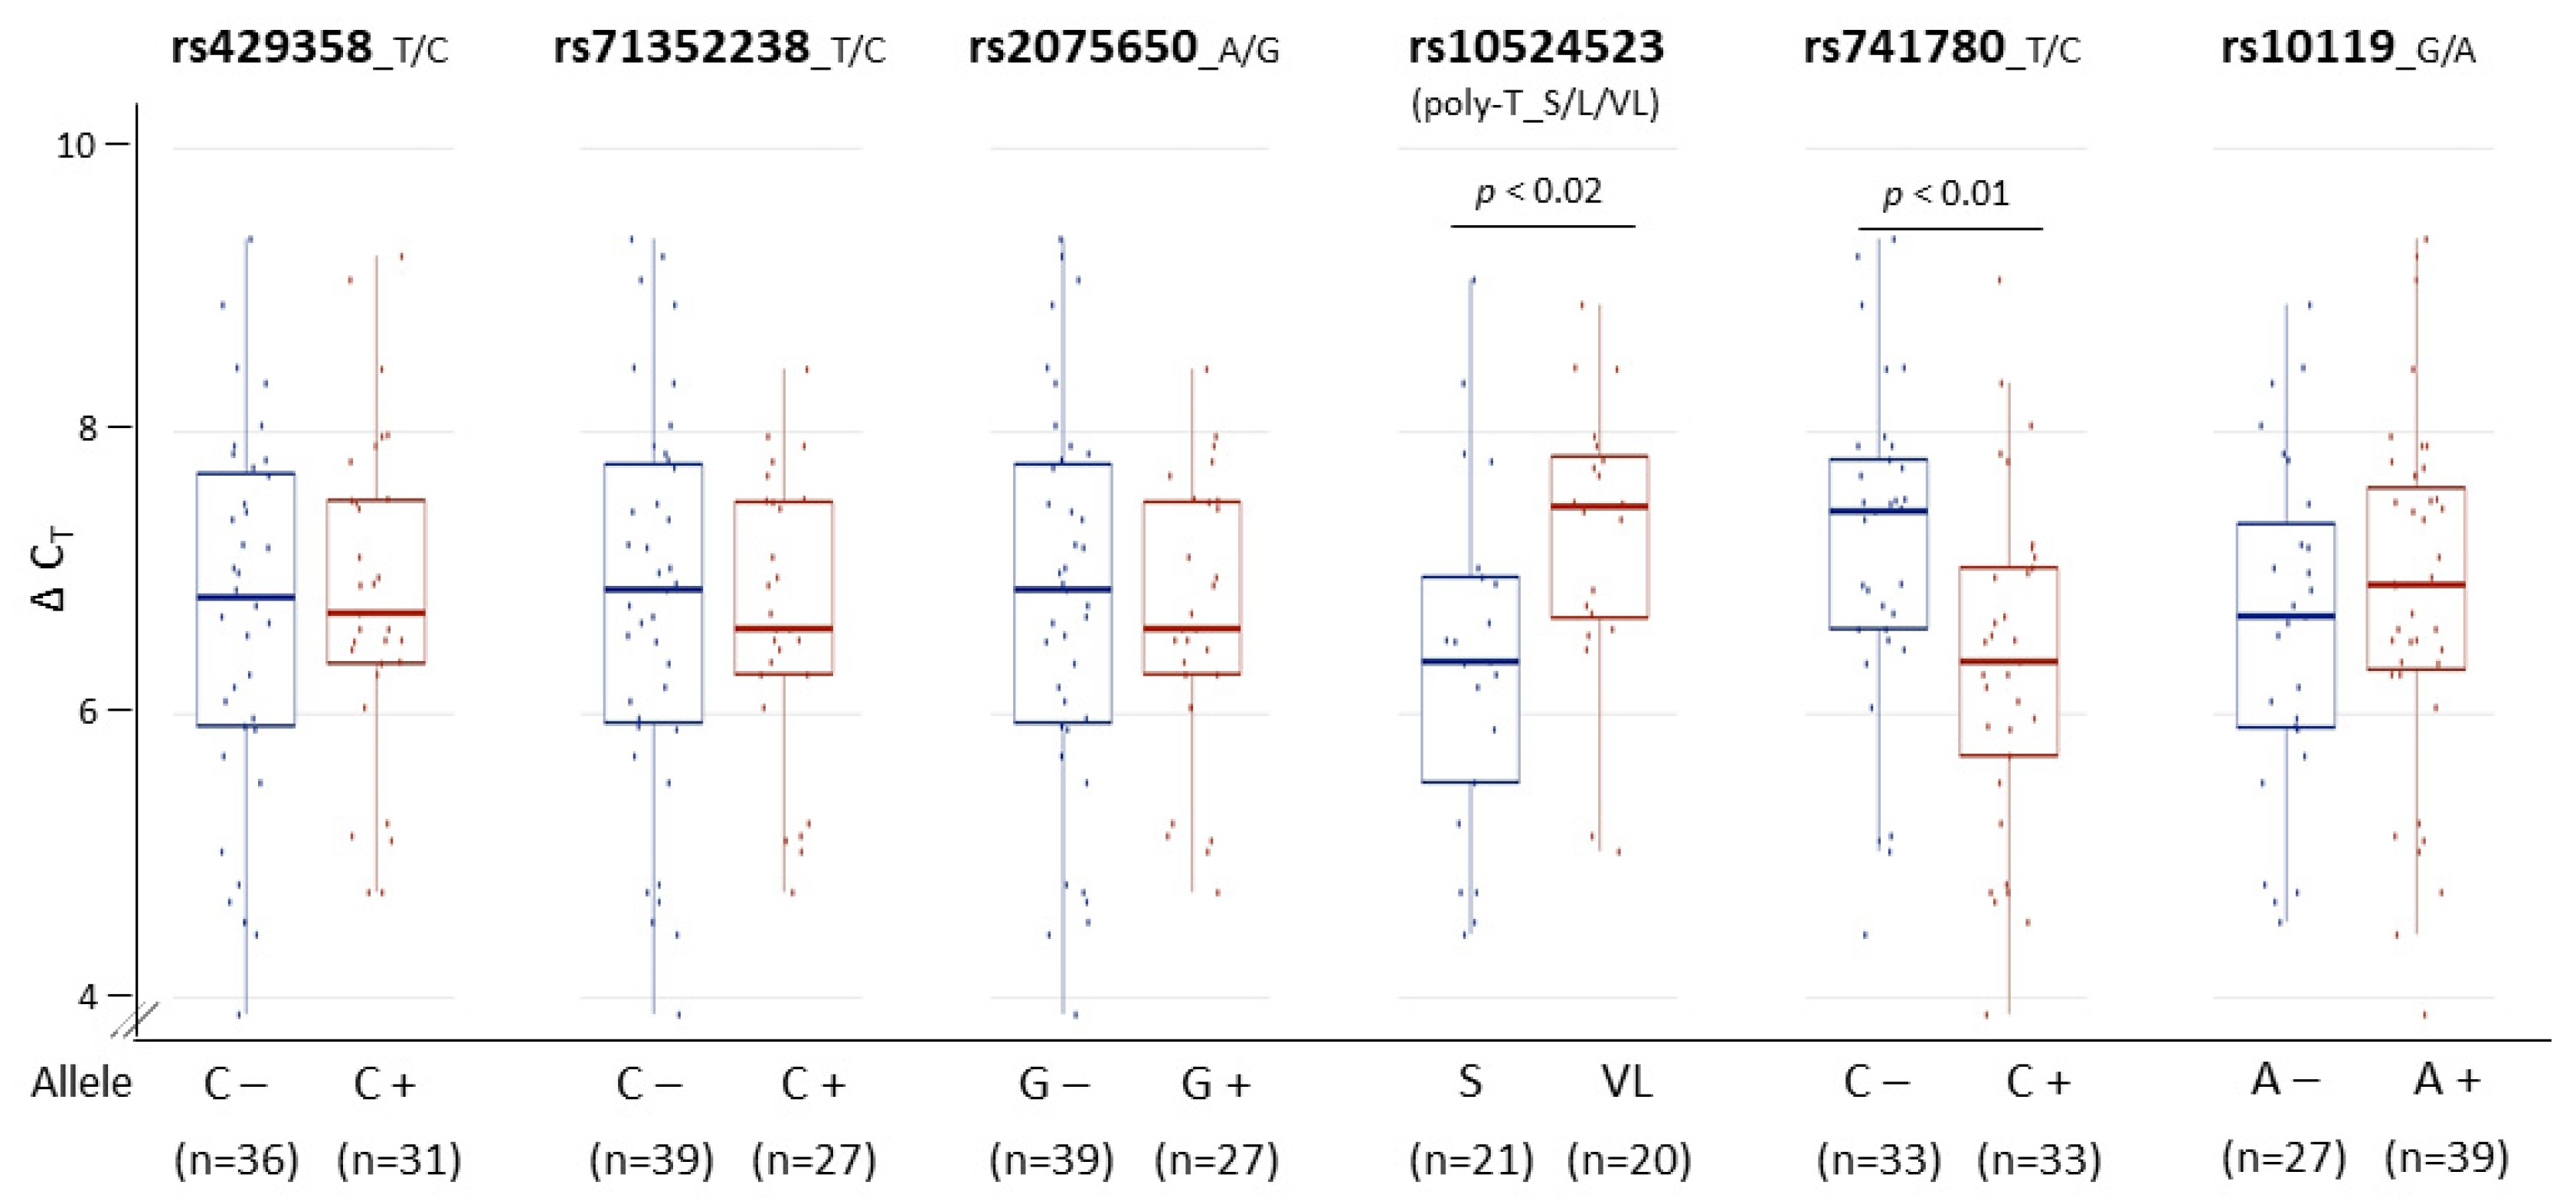
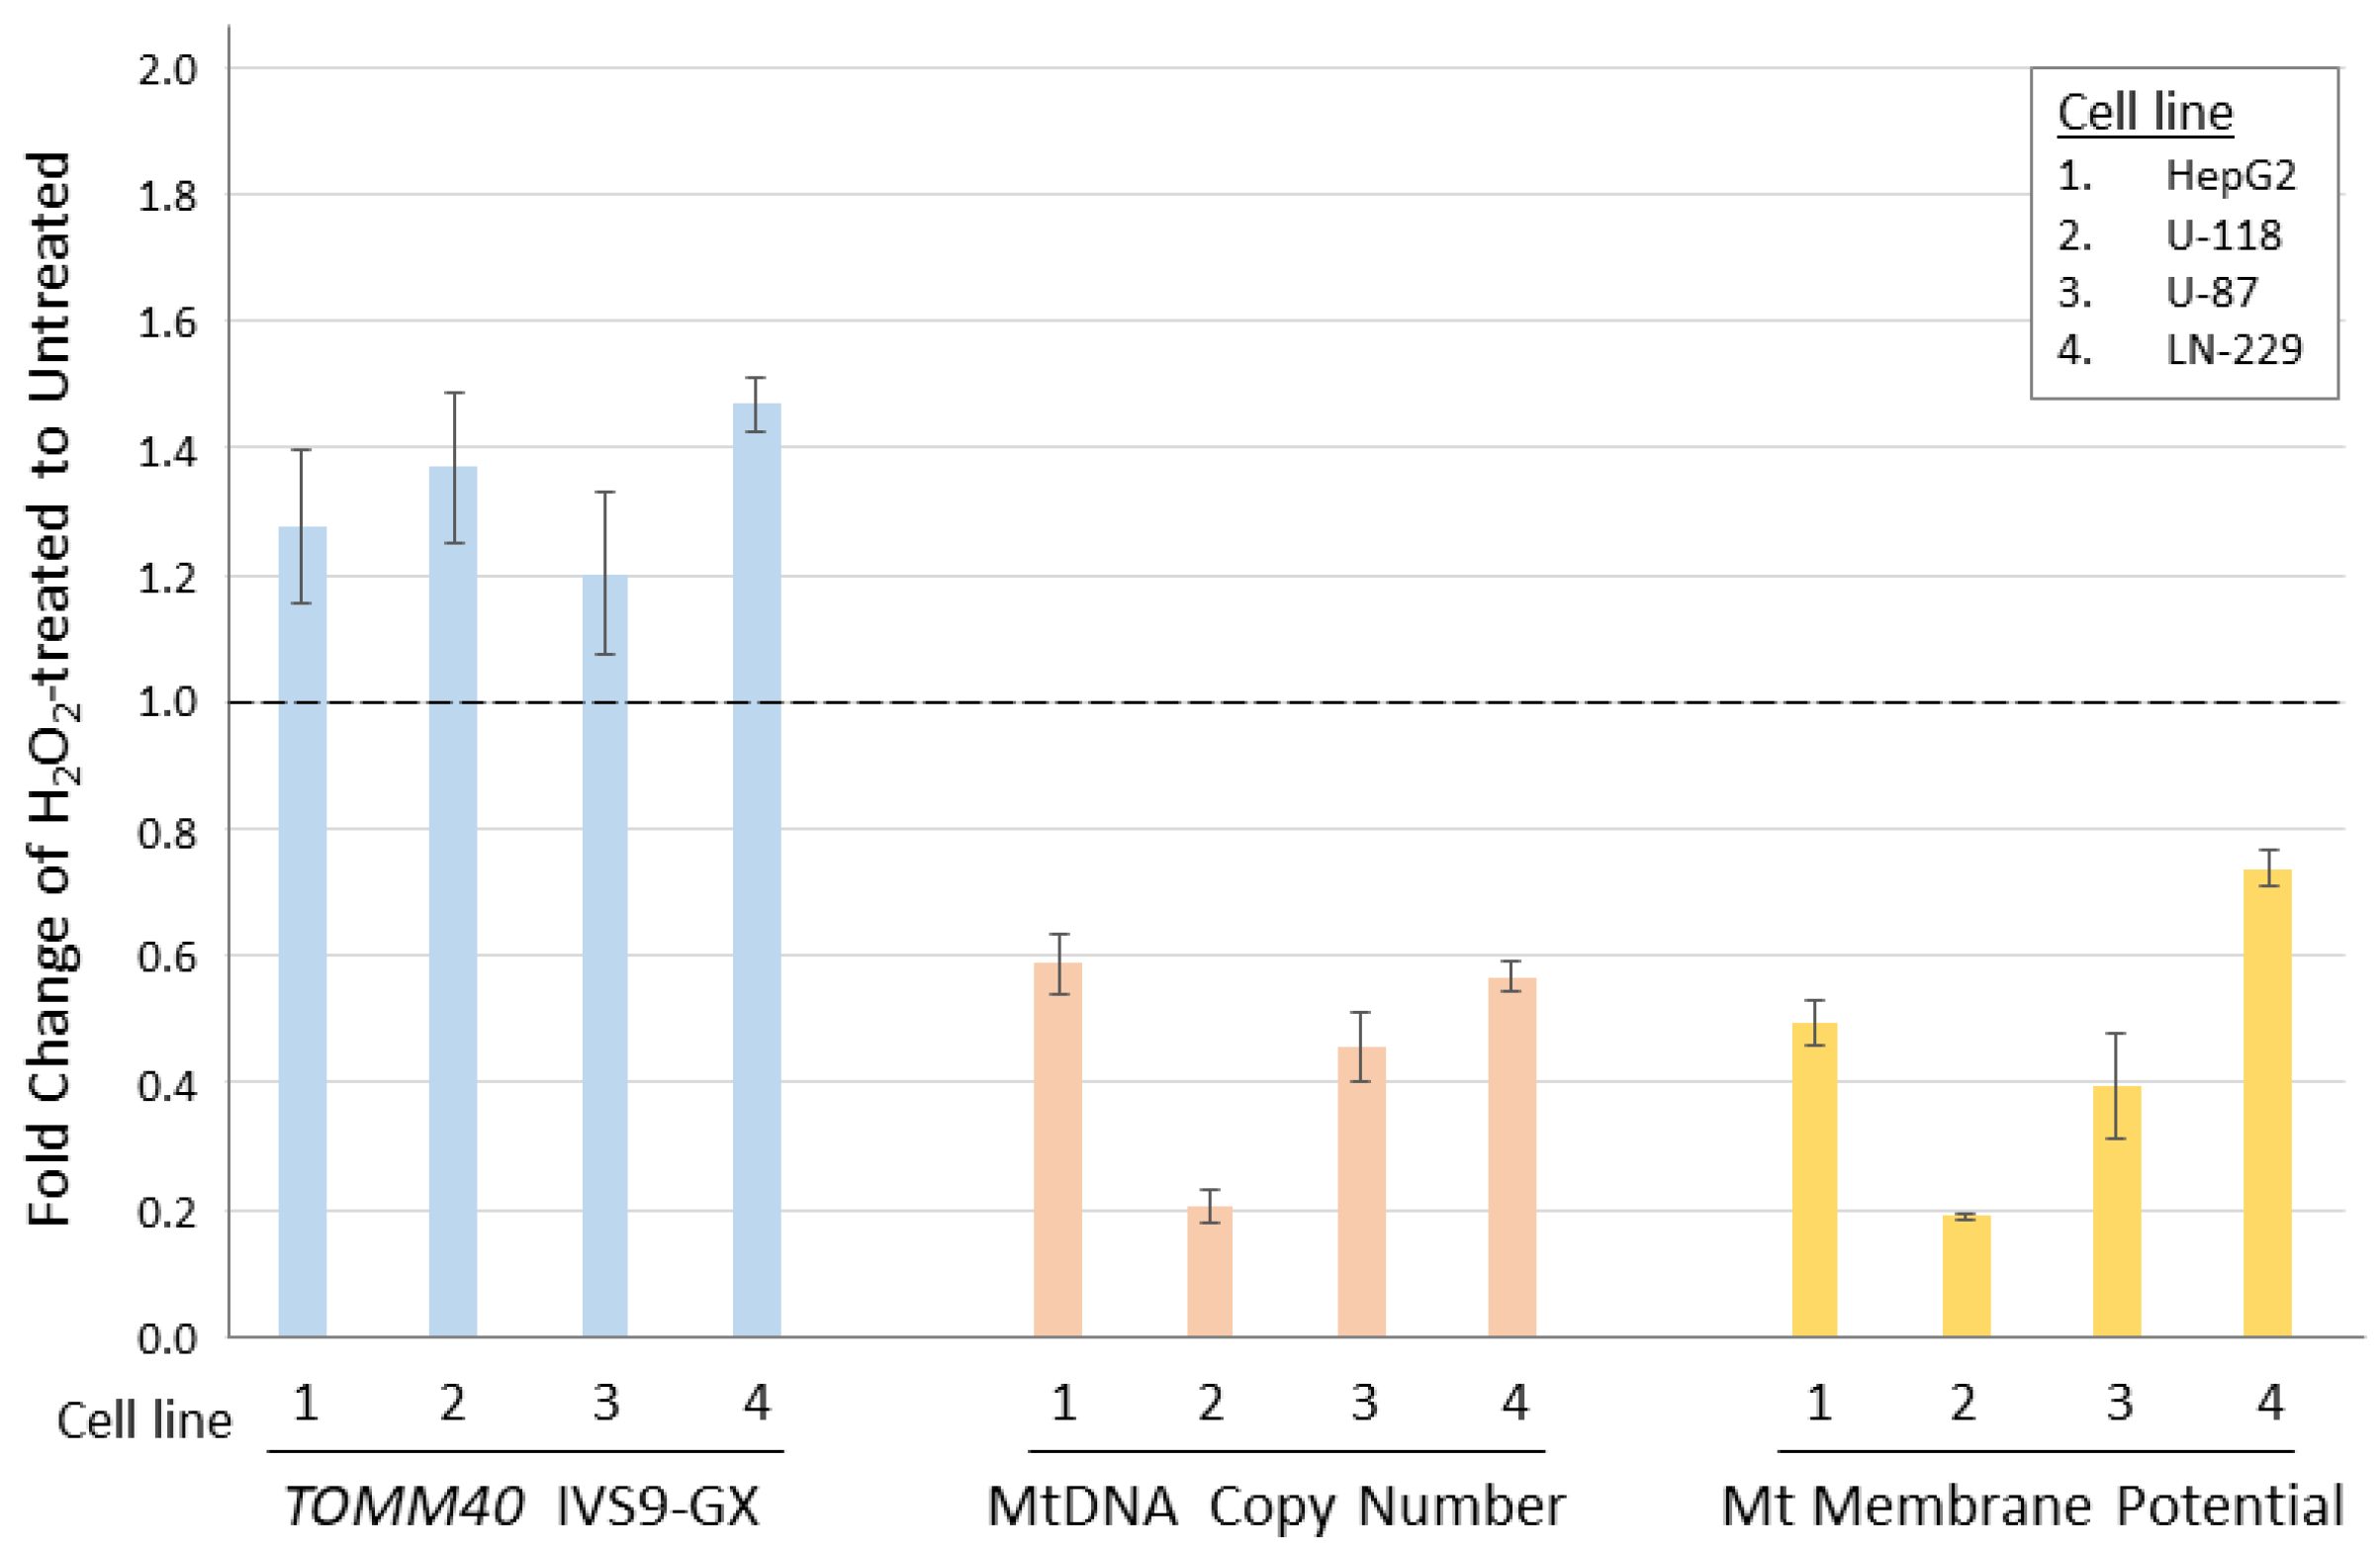
With biologically meaningful RNA measurements in hand, we further examined the relationship between TOMM40 RNA levels and some AD-associated genotypes in human PMB. We first analyzed a set of genetic variants, including the APOE ε4-determing SNP rs429358 and five SNPs (rs71352238, rs2075650, rs10524523, rs741780, and rs10119) scattered across TOMM40 (Figure 2A). For rs10524523, we stratified the “S” and “VL” variants only, excluding the third variant “L”, which is linked specifically with the ε4 variant of rs429358 that was analyzed separately. We then tested for associations between stratified alleles and TOMM40 RNA levels quantified using our IVS9 assay. We observed significant allelic differences in rs10524523 (p < 0.02, t-test) and in rs741780 (p < 0.01, t-test; Figure 5). None of the other four SNPs showed any expression associations with their alleles. Additionally, we performed ex vivo experiments to examine the relationship between TOMM40 RNA levels and selected mitochondria functions. We induced oxidative stress using H2O2 in human cell lines (HepG2, U-118, U-87, and LN-229) and compared TOMM40 RNA levels, MtDNA copy number, and mitochondrial membrane potential. After H2O2 treatment, TOMM40 surrogate RNA levels were increased (≈1.2–1.5-fold higher than the untreated one, which corresponded with a decreased DNA copy number (≈20–60% of the untreated levels) and a decreased membrane potential (≈20–75% of the untreated one; Figure 6). These findings indicate that upregulation of TOMM40 RNA levels corresponds with mitochondrial dysfunction.
4. Discussion
Brain mitochondrial function plays a crucial role in neural plasticity and cognition [43] and is vital to many neural activities. Mitochondrial dysfunction occurs in a variety of psychiatric and neurodegenerative disorders [44], and is a fundamental characteristic of AD [11,12,13,14]. The TOMM40 gene encodes a mitochondrial outer membrane translocase, which plays important roles in importing and sorting proteins for sub-mitochondrial locations. TOMM40 is an essential gene for mitochondrial maintenance, making it a plausible candidate for influencing AD risk via mitochondrial dysfunction.
The possibility that TOMM40 plays a direct role in AD risk has always been overshadowed by APOE. Located 2.1 kb upstream of APOE, the genetic effects of these two genes cannot easily be separated due to the strong LD structure between them [25,45]. Genetic associated signals of TOMM40 in AD have traditionally been dismissed as surrogate signals of APOE [46,47]; however, this viewpoint has gradually shifted to consider TOMM40 as an independent contributor to AD risk and healthy aging. For example, genetic variants in TOMM40 have been consistently linked to longevity and healthy aging [48,49,50,51]. The SNP rs2075650 located in intron 2 of TOMM40 has been considered a proxy of the SNP rs429358 that defines the ε4 allele of APOE [29]. The G allele of rs2075650 has been associated with a range of phenotypes including reduced longevity [52], reduced BMI [53], and increased low-density lipoprotein cholesterol [54,55], as well as an increased risk of AD [56]. Evidence also suggested that the length of rs10524523 (poly-T) within intron 6 of the TOMM40 is linked to different levels of risk and age of onset of cognitive decline [57]. Such epidemiological data strongly support the idea that TOMM40 plays a direct role in cognition and healthy aging. Because age is the most important risk factor for AD, the combined biological consequences of TOMM40 and APOE may represent a molecular mechanism explaining the APOE locus’ strong genetic association with AD. Additionally, the most recent human genome project has revealed that a large number of functional sites in the genome are cis-regulated in nature. Thus, the unique genomic arrangement of the TOMM40-APOE gene cluster raises a possibility that genetic variants of the APOE locus could relate indirectly to mitochondrial function through LD with TOMM40. This concept is also in line with current trending research on the co-regulation of local genes in gene expression through the topological associating domain or 3D genome [58].
When the expression profile of a gene is altered in a disease, it provides credible evidence supporting a direct connection between that gene and the disease. TOMM40 overexpression at both the transcriptional and translational levels in ovarian cancer has been shown to correlate with increased cell proliferation, migration, and invasion [59,60]. TOM40 protein levels are significantly reduced in brains of Parkinson’s disease patients and in α-Syn transgenic mice [61,62,63]. Significant changes were observed in the mRNA levels of mitochondrial dynamic genes such as fission/fusion-related genes and mitophagy-related genes in blood samples of AD patients [39,64]. However, the altered expression profiles (both mRNA and protein) of TOMM40 in AD have not been clearly established. Whether the expression level of TOMM40 is up- or down-regulated in AD brains has not been consistently observed. In one study, TOMM40 mRNA was shown to be downregulated in 6 of 14 AD frontal lobes but upregulated in the remaining eight [39]. Such conflicting results suggest that the quantification of TOMM40 mRNA may not be straightforward and may be complicated by other biological processes.
To determine the source of inconsistent TOMM40 transcription levels observed in the human brain, we revisited the fundamental basics by examining the specificity of the TOMM40 cDNA sequence. We were surprised to find that human genome carries five TOMM40-related pseudogenes, which all share high homology (87–96%) with TOMM40 cDNA. We were even more surprised to find that all five pseudogenes produce RNA transcripts in various human cell lines and PMB tissues. Currently, the biological functions and/or consequences of these TOMM40 pseudogene RNAs are undefined. The TOMM40 pseudogenes are scattered across the human genome with unique flanking DNA sequences; thus, each of them is likely independently regulated. It is plausible that some of these RNAs can serve as templates to produce small peptides, but, to our knowledge, this has never been investigated. Another potential function of these TOMM40 pseudogene RNAs is to regulate the transcription of TOMM40. Carrying highly similar sequences, these RNAs could compete with TOMM40 mRNA for binding to proteins in transcription or post-transcription machineries. Potentially, these pseudogene RNAs could provide an RNA buffer in response to various stress/stimuli, and this buffer effect might minimize severe fluctuations in TOMM40 RNA production. Indirect evidence supporting this concept comes from our experiment of comparing TOMM40 cDNA assays. The commercial TOMM40 assay, which measures both TOMM40 mRNA and pseudogene RNAs, has much tighter transcription levels across the PMB samples when compared to the IVS9 assay that specifically measures TOMM40 RNA only. One explanation is that this commercial assay congests all the TOMM40-related RNAs together, which provide a cushion effect to reduce the variability of single RNA measurement. The estimated fraction of pseudogene RNAs in the total TOMM40-related RNA pool is approximately 10–18% using a single pseudogene assay (P1b/P2) that cross-amplified four out of five pseudogenes. If the transcription levels of all five pseudogenes can be precisely measured, the overall fraction is likely to be significantly higher than this estimation. These results raise an interesting question: why does TOMM40 gene expression need to be rigorously regulated or guarded by such a complex system from a whole genome setting?
Due to the cross-amplification of pseudogene RNAs, the conventional RT-PCR assays cannot provide an accurate measurement of TOMM40 mRNA. This challenge prompted us to develop an alternative approach, which targets the primary RNA transcript of TOMM40 and eliminates undesired co-measurement of pseudogene RNAs. The major difference between the primary transcript and mRNA lies in the RNA splicing. The splicing efficiency depends on the splicing kinetics, transcriptional and splicing regulators, transcription rate, intron length, exon position, RNA structure, and chromatin signatures, including histone marks and DNA methylation [65,66]. It has been shown that the splicing efficiency of pre-mRNA varies greatly across genes [67,68]. Due to the splicing process, actual transcription levels are not the same between the primary transcript and spliced mRNA. However, the level of primary transcript can provide a surrogate measurement for mRNA. Surrogate TOMM40 transcription levels, which were measured by the primary transcript-targeted assays (Ex6-IVS6 and IVS9), had a similar profile with ≈2 ΔCT value separating AD and control PMB samples. This result indicated that both measurements were consistent across samples and were suitable to serve as surrogate measurements of TOMM40 mRNA. Between the two assays, the IVS9 has higher transcription levels (lower ΔCT value) when compared to Ex6-IVS6. This difference could be due to either the slower splicing kinetics of IVS9, or simply the presence of a TOMM40 mRNA transcript (ENST592434) that retains the entire intron 9 in its mRNA structure.
After resolving the complication of pseudogene RNAs co-measurement, we demonstrated that the surrogate transcription level of TOMM40 RNA is roughly 2.5-fold higher in AD compared to the control frontal lobe. Our results are opposite to prior published studies showing that TOMM40 RNA is downregulated in AD blood [35,36,37,38]. Although this opposition could reflect different TOMM40 regulatory pathways between blood and the CNS, it also suggested that the transcription levels of TOMM40 pseudogene RNAs could vary across different tissues. Increased TOMM40 RNA transcription in AD brains could be a consequence of prolonged mitochondrial dysfunction, which triggers a feedback response to upregulate structural proteins (e.g., TOM40) to compensate for the compromised mitochondrial function. The upregulated TOMM40 RNA in AD brains has the same trend as the upregulation of APOE mRNA in AD brains compared to control [40]. The consistent upregulation of both TOMM40 and APOE in AD brains makes the concept of co-regulation of these genes through the same topological associating domain even more appealing. Whether the upregulation of TOMM40 RNA is truly associated with AD risk remains to be further validated with a larger sample size and across different brain regions. Nevertheless, this study provides a new molecular tool for measuring TOMM40 RNA, making future expanded studies feasible.
Our genetic association analyses revealed no difference between TOMM40 RNA transcription levels with either APOE rs429358 variants (C/ε4+ vs. C/ε4−) or TOMM40 rs2075650 variants (G+ vs. G−), two SNPs that have been consistently linked to AD risk through GWAS studies. This lack of association suggested that these two genetic variants may not have a direct impact on the increased TOMM40 RNA levels in AD. On the contrary, the SNPs rs10527523 and rs741780 showed significant allelic differences associated with TOMM40 RNA transcription. Because these two SNPs are located between introns 6 and 8 of the TOMM40 gene, this region of TOMM40 might contain functional regulatory elements that influence the transcription of TOMM40. In the case of rs10524523, we observed a higher transcription level (lower ΔCT value) of TOMM40 RNA in the “S” variant when compared to the “VL” allele. This result is opposite to the study of Linnertz et al., who showed TOMM40 mRNA levels were lower in “S” homozygotes compared with “VL” homozygotes in the AD brain [24]. Again, the inclusion or exclusion of TOMM40 pseudogene RNAs transcription levels could account for these conflicting results.
Mitochondria are involved in several cellular functions and are essential for energy production; they are the main organelles that provide energy for brain cells. Indeed, neurons are particularly sensitive to changes in mitochondrial function [69], and mitochondrial injury can have severe consequences for neuronal function and survival [70]. We studied two mitochondrial function-related phenotypes (copy number and membrane potential) and their associations with TOMM40 RNA transcription levels in human cell lines. MtDNA copy number is a measure of the number of mitochondrial genomes per cell and is a proxy for mitochondrial function [71,72,73]. Significant differences in this copy number have been reported across different brain regions, and these variations were more pronounced in patients affected by neurodegenerative disorders [74]. Studies have also shown that MtDNA levels were decreased by 30–50% in the frontal cortex of AD patients when compared to controls [75,76]. Mitochondrial membrane potential, which is used by ATP synthase to make ATP, serves as an intermediate form of energy storage for cells. Normally, cells maintain stable levels of mitochondrial membrane potential to carry out various cellular functions [77,78,79]. This membrane potential is altered due to physiological activity on a transient basis, but a prolonged alteration could compromise the viability of the cells and cause irreversible damage [80]. Our analyses showed that the increased TOMM40 RNA levels are associated with a lower MtDNA copy number and a lower mitochondrial membrane potential, which together signified a decrease in mitochondrial function. This observation could be explained by a feedback response to restore mitochondria function via upregulation of TOMM40 mRNA. As a translocase of outer mitochondrial membrane [9,10], TOM40 protein plays a role in importing proteins for the assembly of the mitochondrial inner membrane respiratory chain and mitochondrial matrix proteins involved in oxidative respiration. Increased TOMM40 RNA transcription associated with AD could lead to changes in mitochondrial protein import, which might affect maintenance of mitochondrial membrane potential and overall mitochondrial function.
5. Conclusions
Here, we developed a novel assay to measure true TOMM40 RNA transcription levels with high specificity and sensitivity, circumventing the unintentional co-measurement of TOMM40 pseudogene RNAs. This assay enabled us to accurately investigate the RNA transcription profile of TOMM40 associated with AD. The PMB work showed that TOMM40 mRNA is upregulated in AD vs. control frontal lobe. The ex vivo cultured cell line work showed that upregulation of TOMM40 RNA is likely associated with compromised mitochondrial function. Although future work using a larger sample size is needed to replicate these results, this work pioneers a valuable blueprint to assess APOE-independent effects of TOMM40 in AD risk. Our findings define a new paradigm of TOMM40 gene regulation and provide novel insight into the transcriptional pathway of TOMM40. This pathway involves not only the production of multiple TOMM40 mRNA species, but also a pseudogene-imparted transcriptional program. Many epidemiology studies strongly support the idea that TOMM40 contributes to healthy aging. Because age is the most important known risk factor for AD, it raises an interesting question: could the incidence of AD be a byproduct of a compromised longevity pathway that is carefully guarded via TOMM40-imparted mitochondrial function?
Supplementary Materials
The following is available online at https://0-www-mdpi-com.brum.beds.ac.uk/article/10.3390/genes12060871/s1, Figure S1. Allele-specific primers of TOMM40 pseudogenes can cross-amplify other pseudogenes. Figure S2: Conventional TOMM40 cDNA assays can cross-amplify TOMM40 pseudogenes. Table S1. Primers, probes, and TaqMan assays. Table S2. Fractions of TOMM40 pseudogene P1b/P2 RNAs and IVS9 RNA in total TOMM40-related RNA pool, measured by dPCR.
Author Contributions
Conceptualization, E.-G.L. and C.-E.Y.; Methodology, E.-G.L., C.-E.Y., L.L. and S.C.; Formal analysis, E.-G.L., S.C. and J.T.; Resources, E.-G.L., J.T. and L.L.; Data curation, E.-G.L. and S.C.; Writing—original draft preparation, C.-E.Y.; Writing—review and editing, E.-G.L. and J.T.; Visualization, E.-G.L., C.-E.Y. and S.C.; Supervision, E.-G.L. and C.-E.Y.; Project administration, C.-E.Y.; Funding acquisition, C.-E.Y. All authors have read and agreed to the published version of the manuscript.
Funding
This research was funded by Merit Review Awards, BX000933 and BX004823, from the U.S. Department of Veterans Affairs Office of Research and Development Biomedical Laboratory Research Program. The contents do not represent the views of the U.S. Department of Veterans Affairs or the United States Government.
Institutional Review Board Statement
Ethical review and approval were waived for this study, due to that this work used deidentified human biospecimens that have already been collected by other established programs. Previously, all human specimens were obtained from the University of Washington (UW) Alzheimer’s Disease Research Center after approval by the institutional review board of the Veterans Affairs Puget Sound Health Care System (MIRB# 00331).
Informed Consent Statement
Patient consent was waived due to that this work used deidentified human biospecimens that have already been collected by other established programs.
Data Availability Statement
All relevant data are within the manuscript and its Supporting Information files.
Conflicts of Interest
The authors declare no conflict of interest.
References
- Takei, N.; Miyashita, A.; Tsukie, T.; Arai, H.; Asada, T.; Imagawa, M.; Shoji, M.; Higuchi, S.; Urakami, K.; Kimura, H.; et al. Genetic association study on in and around the APOE in late-onset Alzheimer disease in Japanese. Genomics 2009, 93, 441–448. [Google Scholar] [CrossRef] [PubMed] [Green Version]
- Lambert, J.C.; Ibrahim-Verbaas, C.A.; Harold, D.; Naj, A.C.; Sims, R.; Bellenguez, C.; DeStafano, A.L.; Bis, J.C.; Beecham, G.W.; Grenier-Boley, B.; et al. Meta-analysis of 74,046 individuals identifies 11 new susceptibility loci for Alzheimer’s disease. Nat. Genet. 2013, 45, 1452–1458. [Google Scholar] [CrossRef] [Green Version]
- Beecham, G.W.; Hamilton, K.; Naj, A.C.; Martin, E.R.; Huentelman, M.; Myers, A.J.; Corneveaux, J.J.; Hardy, J.; Vonsattel, J.P.; Younkin, S.G.; et al. Genome-wide association meta-analysis of neuropathologic features of Alzheimer’s disease and related dementias. PLoS Genet. 2014, 10, e1004606. [Google Scholar] [CrossRef] [PubMed] [Green Version]
- Yashin, A.I.; Fang, F.; Kovtun, M.; Wu, D.; Duan, M.; Arbeev, K.; Akushevich, I.; Kulminski, A.; Culminskaya, I.; Zhbannikov, I.; et al. Hidden heterogeneity in Alzheimer’s disease: Insights from genetic association studies and other analyses. Exp. Gerontol. 2018, 107, 148–160. [Google Scholar] [CrossRef] [PubMed]
- Sillen, A.; Forsell, C.; Lilius, L.; Axelman, K.; Bjork, B.F.; Onkamo, P.; Kere, J.; Winblad, B.; Graff, C. Genome scan on Swedish Alzheimer’s disease families. Mol. Psychiatry 2005, 11, 182–186. [Google Scholar] [CrossRef]
- Hendrie, H.C.; Murrell, J.; Baiyewu, O.; Lane, K.A.; Purnell, C.; Ogunniyi, A.; Unverzagt, F.W.; Hall, K.; Callahan, C.M.; Saykin, A.J.; et al. APOE epsilon4 and the risk for Alzheimer disease and cognitive decline in African Americans and Yoruba. Int. Psychogeriatr. 2014, 26, 977–985. [Google Scholar] [CrossRef] [Green Version]
- Rajabli, F.; Feliciano, B.E.; Celis, K.; Hamilton-Nelson, K.L.; Whitehead, P.L.; Adams, L.D.; Bussies, P.L.; Manrique, C.P.; Rodriguez, A.; Rodriguez, V.; et al. Ancestral origin of ApoE epsilon4 Alzheimer disease risk in Puerto Rican and African American populations. PLoS Genet. 2018, 14, e1007791. [Google Scholar] [CrossRef] [Green Version]
- Morris, J.C.; Schindler, S.E.; McCue, L.M.; Moulder, K.L.; Benzinger, T.L.S.; Cruchaga, C.; Fagan, A.M.; Grant, E.; Gordon, B.A.; Holtzman, D.M.; et al. Assessment of Racial Disparities in Biomarkers for Alzheimer Disease. JAMA Neurol. 2019. [Google Scholar] [CrossRef]
- Humphries, A.D.; Streimann, I.C.; Stojanovski, D.; Johnston, A.J.; Yano, M.; Hoogenraad, N.J.; Ryan, M.T. Dissection of the Mitochondrial Import and Assembly Pathway for Human Tom40. J. Biol. Chem. 2005, 280, 11535–11543. [Google Scholar] [CrossRef] [Green Version]
- Hoogenraad, N.J.; Ward, L.A.; Ryan, M.T. Import and assembly of proteins into mitochondria of mammalian cells. Biochim. Biophys. Acta 2002, 1592, 97–105. [Google Scholar] [CrossRef] [Green Version]
- Swerdlow, R.H.; Burns, J.M.; Khan, S.M. The Alzheimer’s disease mitochondrial cascade hypothesis: Progress and perspectives. Biochim. Biophys. Acta 2014, 1842, 1219–1231. [Google Scholar] [CrossRef] [PubMed] [Green Version]
- Kwong, J.Q.; Beal, M.F.; Manfredi, G. The role of mitochondria in inherited neurodegenerative diseases. J. Neurochem. 2006, 97, 1659–1675. [Google Scholar] [CrossRef]
- Kapogiannis, D.; Mattson, M.P. Disrupted energy metabolism and neuronal circuit dysfunction in cognitive impairment and Alzheimer’s disease. Lancet Neurol. 2011, 10, 187–198. [Google Scholar] [CrossRef] [Green Version]
- Agrawal, I.; Jha, S. Mitochondrial Dysfunction and Alzheimer’s Disease: Role of Microglia. Front. Aging Neurosci. 2020, 12, 252. [Google Scholar] [CrossRef]
- Hirai, K.; Aliev, G.; Nunomura, A.; Fujioka, H.; Russell, R.L.; Atwood, C.S.; Johnson, A.B.; Kress, Y.; Vinters, H.V.; Tabaton, M.; et al. Mitochondrial abnormalities in Alzheimer’s disease. J. Neurosci. 2001, 21, 3017–3023. [Google Scholar] [CrossRef] [Green Version]
- Zhu, X.; Perry, G.; Moreira, P.I.; Aliev, G.; Cash, A.D.; Hirai, K.; Smith, M.A. Mitochondrial abnormalities and oxidative imbalance in Alzheimer disease. J. Alzheimers Dis. 2006, 9, 147–153. [Google Scholar] [CrossRef]
- Reddy, P.H.; Beal, M.F. Amyloid beta, mitochondrial dysfunction and synaptic damage: Implications for cognitive decline in aging and Alzheimer’s disease. Trends Mol. Med. 2008, 14, 45–53. [Google Scholar] [CrossRef] [Green Version]
- Wang, X.; Su, B.; Zheng, L.; Perry, G.; Smith, M.A.; Zhu, X. The role of abnormal mitochondrial dynamics in the pathogenesis of Alzheimer’s disease. J. Neurochem. 2009, 109, 153–159. [Google Scholar] [CrossRef] [PubMed] [Green Version]
- Zhu, Z.; Yang, Y.; Xiao, Z.; Zhao, Q.; Wu, W.; Liang, X.; Luo, J.; Cao, Y.; Shao, M.; Guo, Q.; et al. TOMM40 and APOE variants synergistically increase the risk of Alzheimer’s disease in a Chinese population. Aging Clin. Exp. Res. 2020. [Google Scholar] [CrossRef]
- Roses, A.D. An inherited variable poly-T repeat genotype in TOMM40 in Alzheimer disease. Arch. Neurol. 2010, 67, 536–541. [Google Scholar] [CrossRef]
- Lutz, M.W.; Crenshaw, D.G.; Saunders, A.M.; Roses, A.D. Genetic variation at a single locus and age of onset for Alzheimer’s disease. Alzheimers Dement. 2010, 6, 125–131. [Google Scholar] [CrossRef] [PubMed] [Green Version]
- Lutz, M.W.; Sundseth, S.S.; Burns, D.K.; Saunders, A.M.; Hayden, K.M.; Burke, J.R.; Welsh-Bohmer, K.A.; Roses, A.D. A Genetics-based Biomarker Risk Algorithm for Predicting Risk of Alzheimer’s Disease. Alzheimers Dement. 2016, 2, 30–44. [Google Scholar] [CrossRef] [PubMed] [Green Version]
- Crenshaw, D.G.; Gottschalk, W.K.; Lutz, M.W.; Grossman, I.; Saunders, A.M.; Burke, J.R.; Welsh-Bohmer, K.A.; Brannan, S.K.; Burns, D.K.; Roses, A.D. Using genetics to enable studies on the prevention of Alzheimer’s disease. Clin. Pharm. 2013, 93, 177–185. [Google Scholar] [CrossRef] [Green Version]
- Linnertz, C.; Anderson, L.; Gottschalk, W.; Crenshaw, D.; Lutz, M.W.; Allen, J.; Saith, S.; Mihovilovic, M.; Burke, J.R.; Welsh-Bohmer, K.A.; et al. The cis-regulatory effect of an Alzheimer’s disease-associated poly-T locus on expression of TOMM40 and apolipoprotein E genes. Alzheimers Dement. 2014, 10, 541–551. [Google Scholar] [CrossRef] [Green Version]
- Yu, C.E.; Seltman, H.; Peskind, E.R.; Galloway, N.; Zhou, P.X.; Rosenthal, E.; Wijsman, E.M.; Tsuang, D.W.; Devlin, B.; Schellenberg, G.D. Comprehensive analysis of APOE and selected proximate markers for late-onset Alzheimer’s disease: Patterns of linkage disequilibrium and disease/marker association. Genomics 2007, 89, 655–665. [Google Scholar] [CrossRef] [PubMed] [Green Version]
- Blue, E.E.; Cheng, A.; Chen, S.; Yu, C.E.; Alzheimer’s Disease Genetics, C. Association of Uncommon, Noncoding Variants in the APOE Region With Risk of Alzheimer Disease in Adults of European Ancestry. JAMA Netw. Open 2020, 3, e2017666. [Google Scholar] [CrossRef]
- Bekris, L.M.; Millard, S.P.; Galloway, N.M.; Vuletic, S.; Albers, J.J.; Li, G.; Galasko, D.R.; DeCarli, C.; Farlow, M.R.; Clark, C.M.; et al. Multiple SNPs within and surrounding the apolipoprotein E gene influence cerebrospinal fluid apolipoprotein E protein levels. J. Alzheimers Dis. 2008, 13, 255–266. [Google Scholar] [CrossRef] [PubMed] [Green Version]
- Bekris, L.M.; Galloway, N.M.; Montine, T.J.; Schellenberg, G.D.; Yu, C.E. APOE mRNA and protein expression in postmortem brain are modulated by an extended haplotype structure. Am. J. Med. Genet. B Neuropsychiatr. Genet. 2009. [Google Scholar] [CrossRef] [Green Version]
- Bekris, L.M.; Lutz, F.; Yu, C.-E. Functional analysis of APOE locus genetic variation implicates regional enhancers in the regulation of both TOMM40 and APOE. J. Hum. Genet. 2012, 57, 18–25. [Google Scholar] [CrossRef] [Green Version]
- Hansson Petersen, C.A.; Alikhani, N.; Behbahani, H.; Wiehager, B.; Pavlov, P.F.; Alafuzoff, I.; Leinonen, V.; Ito, A.; Winblad, B.; Glaser, E.; et al. The amyloid beta-peptide is imported into mitochondria via the TOM import machinery and localized to mitochondrial cristae. Proc. Natl. Acad. Sci. USA 2008, 105, 13145–13150. [Google Scholar] [CrossRef] [Green Version]
- Anandatheerthavarada, H.K.; Devi, L. Mitochondrial translocation of amyloid precursor protein and its cleaved products: Relevance to mitochondrial dysfunction in Alzheimer’s disease. Rev. Neurosci. 2007, 18, 343–354. [Google Scholar] [CrossRef] [PubMed]
- Cenini, G.; Rub, C.; Bruderek, M.; Voos, W. Amyloid beta-peptides interfere with mitochondrial preprotein import competence by a coaggregation process. Mol. Biol. Cell 2016, 27, 3257–3272. [Google Scholar] [CrossRef] [PubMed]
- Schaefer, P.M.; von Einem, B.; Walther, P.; Calzia, E.; von Arnim, C.A. Metabolic Characterization of Intact Cells Reveals Intracellular Amyloid Beta but Not Its Precursor Protein to Reduce Mitochondrial Respiration. PLoS ONE 2016, 11, e0168157. [Google Scholar] [CrossRef]
- Devi, L.; Prabhu, B.M.; Galati, D.F.; Avadhani, N.G.; Anandatheerthavarada, H.K. Accumulation of amyloid precursor protein in the mitochondrial import channels of human Alzheimer’s disease brain is associated with mitochondrial dysfunction. J. Neurosci. 2006, 26, 9057–9068. [Google Scholar] [CrossRef] [PubMed] [Green Version]
- Mise, A.; Yoshino, Y.; Yamazaki, K.; Ozaki, Y.; Sao, T.; Yoshida, T.; Mori, T.; Mori, Y.; Ochi, S.; Iga, J.I.; et al. TOMM40 and APOE Gene Expression and Cognitive Decline in Japanese Alzheimer’s Disease Subjects. J. Alzheimers Dis. 2017, 60, 1107–1117. [Google Scholar] [CrossRef]
- Chong, M.S.; Goh, L.K.; Lim, W.S.; Chan, M.; Tay, L.; Chen, G.; Feng, L.; Ng, T.P.; Tan, C.H.; Lee, T.S. Gene expression profiling of peripheral blood leukocytes shows consistent longitudinal downregulation of TOMM40 and upregulation of KIR2DL5A, PLOD1, and SLC2A8 among fast progressors in early Alzheimer’s disease. J. Alzheimers Dis. 2013, 34, 399–405. [Google Scholar] [CrossRef]
- Lee, T.S.; Goh, L.; Chong, M.S.; Chua, S.M.; Chen, G.B.; Feng, L.; Lim, W.S.; Chan, M.; Ng, T.P.; Krishnan, K.R. Downregulation of TOMM40 expression in the blood of Alzheimer disease subjects compared with matched controls. J. Psychiatr Res. 2012, 46, 828–830. [Google Scholar] [CrossRef]
- Goh, L.K.; Lim, W.S.; Teo, S.; Vijayaraghavan, A.; Chan, M.; Tay, L.; Ng, T.P.; Tan, C.H.; Lee, T.S.; Chong, M.S. TOMM40 alterations in Alzheimer’s disease over a 2-year follow-up period. J. Alzheimers Dis. 2015, 44, 57–61. [Google Scholar] [CrossRef]
- Manczak, M.; Calkins, M.J.; Reddy, P.H. Impaired mitochondrial dynamics and abnormal interaction of amyloid beta with mitochondrial protein Drp1 in neurons from patients with Alzheimer’s disease: Implications for neuronal damage. Hum. Mol. Genet. 2011, 20, 2495–2509. [Google Scholar] [CrossRef]
- Lee, E.G.; Tulloch, J.; Chen, S.; Leong, L.; Saxton, A.D.; Kraemer, B.; Darvas, M.; Keene, C.D.; Shutes-David, A.; Todd, K.; et al. Redefining transcriptional regulation of the APOE gene and its association with Alzheimer’s disease. PLoS ONE 2020, 15, e0227667. [Google Scholar] [CrossRef]
- Livak, K.J.; Schmittgen, T.D. Analysis of relative gene expression data using real-time quantitative PCR and the 2(-Delta Delta C(T)) Method. Methods 2001, 25, 402–408. [Google Scholar] [CrossRef]
- Witek, J.; Mohiuddin, S.S. Biochemistry, Pseudogenes. In StatPearls; StatPearls Publishing: Treasure Island, FL, USA, 2021. [Google Scholar]
- Cheng, A.; Hou, Y.; Mattson, M.P. Mitochondria and neuroplasticity. ASN Neuro 2010, 2, e00045. [Google Scholar] [CrossRef]
- Markham, A.; Bains, R.; Franklin, P.; Spedding, M. Changes in mitochondrial function are pivotal in neurodegenerative and psychiatric disorders: How important is BDNF? Br. J. Pharm. 2014, 171, 2206–2229. [Google Scholar] [CrossRef] [PubMed] [Green Version]
- Roses, A.; Sundseth, S.; Saunders, A.; Gottschalk, W.; Burns, D.; Lutz, M. Understanding the genetics of APOE and TOMM40 and role of mitochondrial structure and function in clinical pharmacology of Alzheimer’s disease. Alzheimers Dement. 2016, 12, 687–694. [Google Scholar] [CrossRef] [PubMed] [Green Version]
- Martin, E.R.; Lai, E.H.; Gilbert, J.R.; Rogala, A.R.; Afshari, A.J.; Riley, J.; Finch, K.L.; Stevens, J.F.; Livak, K.J.; Slotterbeck, B.D.; et al. SNPing away at complex diseases: Analysis of single-nucleotide polymorphisms around APOE in Alzheimer disease. Am. J. Hum. Genet. 2000, 67, 383–394. [Google Scholar] [CrossRef] [Green Version]
- Martin, E.R.; Gilbert, J.R.; Lai, E.H.; Riley, J.; Rogala, A.R.; Slotterbeck, B.D.; Sipe, C.A.; Grubber, J.M.; Warren, L.L.; Conneally, P.M.; et al. Analysis of association at single nucleotide polymorphisms in the APOE region. Genomics 2000, 63, 7–12. [Google Scholar] [CrossRef] [Green Version]
- Zhang, C.; Pierce, B.L. Genetic susceptibility to accelerated cognitive decline in the US Health and Retirement Study. Neurobiol. Aging 2014, 35, 1512.e11–1512.e18. [Google Scholar] [CrossRef]
- Davies, G.; Armstrong, N.; Bis, J.C.; Bressler, J.; Chouraki, V.; Giddaluru, S.; Hofer, E.; Ibrahim-Verbaas, C.A.; Kirin, M.; Lahti, J.; et al. Genetic contributions to variation in general cognitive function: A meta-analysis of genome-wide association studies in the CHARGE consortium (N = 53949). Mol. Psychiatry 2015, 20, 183–192. [Google Scholar] [CrossRef] [Green Version]
- Fortney, K.; Dobriban, E.; Garagnani, P.; Pirazzini, C.; Monti, D.; Mari, D.; Atzmon, G.; Barzilai, N.; Franceschi, C.; Owen, A.B.; et al. Genome-Wide Scan Informed by Age-Related Disease Identifies Loci for Exceptional Human Longevity. PLoS Genet. 2015, 11, e1005728. [Google Scholar] [CrossRef]
- Liu, X.; Song, Z.; Li, Y.; Yao, Y.; Fang, M.; Bai, C.; An, P.; Chen, H.; Chen, Z.; Tang, B.; et al. Integrated genetic analyses revealed novel human longevity loci and reduced risks of multiple diseases in a cohort study of 15,651 Chinese individuals. Aging Cell 2021, 20, e13323. [Google Scholar] [CrossRef] [PubMed]
- Deelen, J.; Beekman, M.; Uh, H.W.; Helmer, Q.; Kuningas, M.; Christiansen, L.; Kremer, D.; van der Breggen, R.; Suchiman, H.E.; Lakenberg, N.; et al. Genome-wide association study identifies a single major locus contributing to survival into old age; the APOE locus revisited. Aging Cell 2011, 10, 686–698. [Google Scholar] [CrossRef]
- Guo, Y.; Lanktree, M.B.; Taylor, K.C.; Hakonarson, H.; Lange, L.A.; Keating, B.J.; Consortium, I.K.S. Gene-centric meta-analyses of 108 912 individuals confirm known body mass index loci and reveal three novel signals. Hum. Mol. Genet. 2013, 22, 184–201. [Google Scholar] [CrossRef] [Green Version]
- Middelberg, R.P.; Ferreira, M.A.; Henders, A.K.; Heath, A.C.; Madden, P.A.; Montgomery, G.W.; Martin, N.G.; Whitfield, J.B. Genetic variants in LPL, OASL and TOMM40/APOE-C1-C2-C4 genes are associated with multiple cardiovascular-related traits. BMC Med. Genet. 2011, 12, 123. [Google Scholar] [CrossRef] [Green Version]
- Sandhu, M.S.; Waterworth, D.M.; Debenham, S.L.; Wheeler, E.; Papadakis, K.; Zhao, J.H.; Song, K.; Yuan, X.; Johnson, T.; Ashford, S.; et al. LDL-cholesterol concentrations: A genome-wide association study. Lancet 2008, 371, 483–491. [Google Scholar] [CrossRef] [Green Version]
- Denny, J.C.; Bastarache, L.; Ritchie, M.D.; Carroll, R.J.; Zink, R.; Mosley, J.D.; Field, J.R.; Pulley, J.M.; Ramirez, A.H.; Bowton, E.; et al. Systematic comparison of phenome-wide association study of electronic medical record data and genome-wide association study data. Nat. Biotechnol. 2013, 31, 1102–1110. [Google Scholar] [CrossRef] [PubMed] [Green Version]
- Roses, A.D.; Lutz, M.W.; Crenshaw, D.G.; Grossman, I.; Saunders, A.M.; Gottschalk, W.K. TOMM40 and APOE: Requirements for replication studies of association with age of disease onset and enrichment of a clinical trial. Alzheimers Dement. 2013, 9, 132–136. [Google Scholar] [CrossRef] [Green Version]
- Zheng, H.; Xie, W. The role of 3D genome organization in development and cell differentiation. Nat. Rev. Mol. Cell Biol. 2019, 20, 535–550. [Google Scholar] [CrossRef] [PubMed]
- Leek, B.F. Abdominal and pelvic visceral receptors. Br. Med. Bull. 1977, 33, 163–168. [Google Scholar] [CrossRef]
- Dowling, P.; Meleady, P.; Dowd, A.; Henry, M.; Glynn, S.; Clynes, M. Proteomic analysis of isolated membrane fractions from superinvasive cancer cells. Biochim. Biophys. Acta 2007, 1774, 93–101. [Google Scholar] [CrossRef]
- Heinemeyer, T.; Stemmet, M.; Bardien, S.; Neethling, A. Underappreciated Roles of the Translocase of the Outer and Inner Mitochondrial Membrane Protein Complexes in Human Disease. DNA Cell Biol. 2019, 38, 23–40. [Google Scholar] [CrossRef] [PubMed]
- Bender, A.; Desplats, P.; Spencer, B.; Rockenstein, E.; Adame, A.; Elstner, M.; Laub, C.; Mueller, S.; Koob, A.O.; Mante, M.; et al. TOM40 mediates mitochondrial dysfunction induced by alpha-synuclein accumulation in Parkinson′s disease. PLoS ONE 2013, 8, e62277. [Google Scholar] [CrossRef] [Green Version]
- Valente, E.M.; Abou-Sleiman, P.M.; Caputo, V.; Muqit, M.M.; Harvey, K.; Gispert, S.; Ali, Z.; Del Turco, D.; Bentivoglio, A.R.; Healy, D.G.; et al. Hereditary early-onset Parkinson’s disease caused by mutations in PINK1. Science 2004, 304, 1158–1160. [Google Scholar] [CrossRef] [Green Version]
- Pakpian, N.; Phopin, K.; Kitidee, K.; Govitrapong, P.; Wongchitrat, P. Alterations in Mitochondrial Dynamic-related Genes in the Peripheral Blood of Alzheimer’s Disease Patients. Curr. Alzheimer Res. 2020, 17, 616–625. [Google Scholar] [CrossRef]
- Carrocci, T.J.; Neugebauer, K.M. Pre-mRNA Splicing in the Nuclear Landscape. Cold Spring Harb. Symp. Quant. Biol. 2019, 84, 11–20. [Google Scholar] [CrossRef] [PubMed]
- Agirre, E.; Oldfield, A.J.; Bellora, N.; Segelle, A.; Luco, R.F. Splicing-associated chromatin signatures: A combinatorial and position-dependent role for histone marks in splicing definition. Nat. Commun. 2021, 12, 682. [Google Scholar] [CrossRef] [PubMed]
- Aslanzadeh, V.; Huang, Y.; Sanguinetti, G.; Beggs, J.D. Transcription rate strongly affects splicing fidelity and cotranscriptionality in budding yeast. Genome Res. 2018, 28, 203–213. [Google Scholar] [CrossRef] [Green Version]
- Abebrese, E.L.; Ali, S.H.; Arnold, Z.R.; Andrews, V.M.; Armstrong, K.; Burns, L.; Crowder, H.R.; Day, R.T., Jr.; Hsu, D.G.; Jarrell, K.; et al. Identification of human short introns. PLoS ONE 2017, 12, e0175393. [Google Scholar] [CrossRef]
- Kann, O.; Kovacs, R. Mitochondria and neuronal activity. Am. J. Physiol. Cell Physiol. 2007, 292, C641–C657. [Google Scholar] [CrossRef]
- Chan, D.C. Mitochondria: Dynamic organelles in disease, aging, and development. Cell 2006, 125, 1241–1252. [Google Scholar] [CrossRef] [Green Version]
- Castellani, C.A.; Longchamps, R.J.; Sun, J.; Guallar, E.; Arking, D.E. Thinking outside the nucleus: Mitochondrial DNA copy number in health and disease. Mitochondrion 2020, 53, 214–223. [Google Scholar] [CrossRef] [PubMed]
- Yang, S.Y.; Castellani, C.A.; Longchamps, R.J.; Pillalamarri, V.K.; O’Rourke, B.; Guallar, E.; Arking, D.E. Blood-derived mitochondrial DNA copy number is associated with gene expression across multiple tissues and is predictive for incident neurodegenerative disease. Genome Res. 2021, 31, 349–358. [Google Scholar] [CrossRef] [PubMed]
- Longchamps, R.J.; Castellani, C.A.; Yang, S.Y.; Newcomb, C.E.; Sumpter, J.A.; Lane, J.; Grove, M.L.; Guallar, E.; Pankratz, N.; Taylor, K.D.; et al. Evaluation of mitochondrial DNA copy number estimation techniques. PLoS ONE 2020, 15, e0228166. [Google Scholar] [CrossRef] [Green Version]
- Filograna, R.; Mennuni, M.; Alsina, D.; Larsson, N.G. Mitochondrial DNA copy number in human disease: The more the better? FEBS Lett. 2020. [Google Scholar] [CrossRef]
- Coskun, P.E.; Beal, M.F.; Wallace, D.C. Alzheimer’s brains harbor somatic mtDNA control-region mutations that suppress mitochondrial transcription and replication. Proc. Natl. Acad. Sci. USA 2004, 101, 10726–10731. [Google Scholar] [CrossRef] [Green Version]
- Rodriguez-Santiago, B.; Casademont, J.; Nunes, V. Is mitochondrial DNA depletion involved in Alzheimer’s disease? Eur. J. Hum. Genet. 2001, 9, 279–285. [Google Scholar] [CrossRef]
- Zamzami, N.; Marchetti, P.; Castedo, M.; Decaudin, D.; Macho, A.; Hirsch, T.; Susin, S.A.; Petit, P.X.; Mignotte, B.; Kroemer, G. Sequential reduction of mitochondrial transmembrane potential and generation of reactive oxygen species in early programmed cell death. J. Exp. Med. 1995, 182, 367–377. [Google Scholar] [CrossRef] [PubMed]
- Yaniv, Y.; Juhaszova, M.; Nuss, H.B.; Wang, S.; Zorov, D.B.; Lakatta, E.G.; Sollott, S.J. Matching ATP supply and demand in mammalian heart: In vivo, in vitro, and in silico perspectives. Ann. N. Y. Acad. Sci 2010, 1188, 133–142. [Google Scholar] [CrossRef] [Green Version]
- Zorov, D.B.; Juhaszova, M.; Sollott, S.J. Mitochondrial reactive oxygen species (ROS) and ROS-induced ROS release. Physiol. Rev. 2014, 94, 909–950. [Google Scholar] [CrossRef] [Green Version]
- Izyumov, D.S.; Avetisyan, A.V.; Pletjushkina, O.Y.; Sakharov, D.V.; Wirtz, K.W.; Chernyak, B.V.; Skulachev, V.P. “Wages of fear”: Transient threefold decrease in intracellular ATP level imposes apoptosis. Biochim. Biophys. Acta 2004, 1658, 141–147. [Google Scholar] [CrossRef] [PubMed] [Green Version]
Figure 1.
Phylogenetic tree evolution and end-point RT-PCR amplification of TOMM40 pseudogenes. (A) Phylogenetic tree structure of TOMM40-related genes and pseudogenes. Numbers above the lines are bootstrap value (or node), and numbers below the lines are substitution rate. (B) Capillary gel electrophoresis images of RT-PCR amplified pseudogenes from total RNA of three human cell lines (HepG2, U-87, and SH-SY5Y). Amplicons for pseudogenes P1, P1b, P2, P3, and P4 are shown. Genomic DNA (lane 1) served as a positive control, TOMM40 cDNA (lane 2) served as a reference for cross-amplification, and RT- RNA (lane 6) served as a negative control.

Figure 2.
Map of the TOMM40 gene, RNA transcripts, and RT-PCR assays. (A) Structure and position of the exons, CpG island (CGI), and genetic variants (SNP). (B) Structure of the six mRNA transcripts defined by the Ensembl database. (C) Targets of the RT-PCR assays used in this study.
Figure 2.
Map of the TOMM40 gene, RNA transcripts, and RT-PCR assays. (A) Structure and position of the exons, CpG island (CGI), and genetic variants (SNP). (B) Structure of the six mRNA transcripts defined by the Ensembl database. (C) Targets of the RT-PCR assays used in this study.

Figure 3.
Comparison between a conventional cDNA assay and primary transcript-targeted cDNA assays. Capillary gel electrophoresis images of the RT-PCR amplified TOMM40 pseudogene amplicons. (A) TOMM40 primer set spans Ex4 and Ex5 that mimics a commercial TaqMan gene expression assay (Thermo Fisher, Waltham, MA, USA, Hs01587378_mH). (B) TOMM40 primer sets targeting primary transcripts of exon 6 to intron 6 (EX6-IVS6) and intron 9 (IVS9). Genomic DNA (lane 1) served as a positive control; no-template control (NTC, lane 2) and RT- RNA (lane 11) served as a negative control.

Figure 4.
TOMM40 RNA transcript levels in human PMB tissues by RT-qPCR quantification. Transcription levels of TOMM40 RNAs are plotted as values of ΔCT (mean of CT triplicates (target)—mean of ACTB CT triplicates) and compared between control (Ctrl) (blue) and AD (red) frontal lobes. In this setting, smaller ΔCT values indicate higher RNA levels. (A) Comparison of the two TOMM40 primary transcript-targeted assays (Ex6-IVS6 vs. IVS9) as the pilot study. (B) Comparison of a commercial TaqMan cDNA assay (Thermo Fisher, assay Hs01587378_mH) and the primary transcript-targeted TaqMan IVS9 assay with expanded samples. Numbers in parentheses denote sample size. The t-test p values are shown where significant differences between Ctrl and AD were detected. Boxplot shows quartiles and median.

Figure 5.
Associations of PMB TOMM40 RNA levels with genetic variants. Transcription levels of PMB TOMM40 RNA were measured by the IVS9 assay and compared across six genetic variants. The t-test p values are shown where significant associations with TOMM40 intron 6 poly-T SNP rs10524523 (p < 0.02) and intron 8 SNP rs741780 (p < 0.01) were detected. For rs10524523, the S group includes S/S homozygotes and S/L heterozygotes, and the VL group includes VL/VL homozygotes and VL/L heterozygotes. Numbers in parentheses denote sample size. Boxplot shows quartiles and median.

Figure 6.
Comparison of TOMM40 RNA levels with mitochondrial functions in human cell lines. TOMM40 RNA levels were measured by the IVS9 assay and mitochondrial function assays including MtDNA copy number and Mt membrane potential were performed. The fold change of H2O2-treated cells was compared to the untreated cells (set as baseline of 1.0). Graph shows the relationship between the three measurements in response to the oxidative stress. Standard deviation error bars are shown.


Table 1.
Demographics of the PMB study samples.
| Subjects | AD | Control |
|---|---|---|
| Sample number—n | 47 | 20 |
| Gender—n female (% female) | 27 (57.4) | 11 (55.0) |
| APOE ε4+—n (%) | 29 (61.7) | 3 (15.0) |
| Age at death—mean (SD) | 87.9 (5.9) | 88.3 (8.5) |
| Age at onset—mean (SD) | 79.0 (8.0) | N/A |
| Disease duration—mean years (SD) | 9.0 (4.4) | N/A |
| Postmortem interval—mean hours (SD) | 5.0 (2.0) | 4.9 (2.3) |
| CERAD Score | ||
| Absent | 0 | 7 |
| Sparse | 0 | 7 |
| Moderate | 11 | 4 |
| Frequent | 36 | 2 |
| Braak Stage | ||
| I | 0 | 6 |
| II | 0 | 11 |
| III | 0 | 3 |
| IV | 0 | 0 |
| V | 15 | 0 |
| VI | 32 | 0 |
SD: standard deviation.
Table 2.
Genomic locations and RNA transcripts of TOMM40-related genes and pseudogenes.
| Gene/Pseudogene | Genomic Sequence (hg38) | RNA Sequence (RefSeq) | |||
|---|---|---|---|---|---|
| Coordinate | Span (bp) | Accession # | Size (nt) | BLASTn ** | |
| TOMM40 | chr19: 44891220-44903689 | 12,470 | NM_001128916 | 1676 | - |
| TOMM40P1 | chr14: 19266948-19268660 | 1713 | NG_022836 | 1713 * | 95.70% |
| TOMM40P1b | chr14: 19131227-19133057 | 1831 | N/A | 1831 * | 95.55% |
| TOMM40P2 | chr22: 15853581-15855410 | 1830 | NG_022885 | 1830 * | 95.88% |
| TOMM40P3 | chr5: 3501872-33503327 | 1456 | NG_021878 | 1456 * | 87.26% |
| TOMM40P4 | chr2: 31723017-131724478 | 1462 | NG_023610 | 1462 * | 95.41% |
| TOMM40L | chr1: 161226060-161230746 | 4687 | NM_032174 | 2790 | 70.17% |
*: Putative RNA size estimated from corresponding genomic locus. **: % identify when compared to TOMM40 mRNA.
Publisher’s Note: MDPI stays neutral with regard to jurisdictional claims in published maps and institutional affiliations. |
© 2021 by the authors. Licensee MDPI, Basel, Switzerland. This article is an open access article distributed under the terms and conditions of the Creative Commons Attribution (CC BY) license (https://creativecommons.org/licenses/by/4.0/).
Share and Cite
MDPI and ACS Style
Lee, E.-G.; Chen, S.; Leong, L.; Tulloch, J.; Yu, C.-E. TOMM40 RNA Transcription in Alzheimer’s Disease Brain and Its Implication in Mitochondrial Dysfunction. Genes 2021, 12, 871. https://0-doi-org.brum.beds.ac.uk/10.3390/genes12060871
AMA Style
Lee E-G, Chen S, Leong L, Tulloch J, Yu C-E. TOMM40 RNA Transcription in Alzheimer’s Disease Brain and Its Implication in Mitochondrial Dysfunction. Genes. 2021; 12(6):871. https://0-doi-org.brum.beds.ac.uk/10.3390/genes12060871
Chicago/Turabian StyleLee, Eun-Gyung, Sunny Chen, Lesley Leong, Jessica Tulloch, and Chang-En Yu. 2021. "TOMM40 RNA Transcription in Alzheimer’s Disease Brain and Its Implication in Mitochondrial Dysfunction" Genes 12, no. 6: 871. https://0-doi-org.brum.beds.ac.uk/10.3390/genes12060871
Note that from the first issue of 2016, this journal uses article numbers instead of page numbers. See further details here.