Article

Sensory Reactivity Phenotype in Phelan–McDermid Syndrome Is Distinct from Idiopathic ASD

1
School of Psychology and Clinical Language Sciences, University of Reading, Berkshire RG6 6BZ, UK
2
Seaver Autism Center for Research and Treatment, Icahn School of Medicine at Mount Sinai, New York, NY 10029, USA
3
Department of Psychiatry, Icahn School of Medicine at Mount Sinai, New York, NY 10029, USA
4
Radiology and Biomedical Imaging, University of California San Francisco, San Francisco, CA 94143, USA
5
School of Psychology, University of Texas at Austin, Austin, TX 78712, USA
6
Ferkauf Graduate School of Psychology, Yeshiva University, Bronx, NY 10461, USA
7
Mindich Child Health and Development Institute, Icahn School of Medicine at Mount Sinai, New York, NY 10029, USA
8
Friedman Brain Institute, Icahn School of Medicine at Mount Sinai, New York, NY 10029, USA
9
Department of Genetics and Genomic Sciences, Icahn School of Medicine at Mount Sinai, New York, NY 10029, USA
10
Department of Neuroscience, Icahn School of Medicine at Mount Sinai, New York, NY 10029, USA
11
Department of Pediatrics, Icahn School of Medicine at Mount Sinai, New York, NY 10029, USA
*
Author to whom correspondence should be addressed.
Submission received: 1 June 2021 / Revised: 22 June 2021 / Accepted: 23 June 2021 / Published: 26 June 2021
(This article belongs to the Special Issue Genomics of Neuropsychiatric Disorders)

Abstract

:
Phelan–McDermid syndrome (PMS) is one of the most common genetic forms of autism spectrum disorder (ASD). While sensory reactivity symptoms are widely reported in idiopathic ASD (iASD), few studies have examined sensory symptoms in PMS. The current study delineates the sensory reactivity phenotype and examines genotype–phenotype interactions in a large sample of children with PMS. Sensory reactivity was measured in a group of 52 children with PMS, 132 children with iASD, and 54 typically developing (TD) children using the Sensory Assessment for Neurodevelopmental Disorders (SAND). The SAND is a clinician-administered observation and corresponding caregiver interview that captures sensory symptoms based on the DSM-5 criteria for ASD. Children with PMS demonstrated significantly greater hyporeactivity symptoms and fewer hyperreactivity and seeking symptoms compared to children with iASD and TD controls. There were no differences between those with Class I deletions or sequence variants and those with larger Class II deletions, suggesting that haploinsufficiency of SHANK3 is the main driver of the sensory phenotype seen in PMS. The syndrome-specific sensory phenotype identified in this study is distinct from other monogenic forms of ASD and offers insight into the potential role of SHANK3 deficiency in sensory reactivity. Understanding sensory reactivity abnormalities in PMS, in the context of known glutamatergic dysregulation, may inform future clinical trials in the syndrome.

1. Introduction

Autism spectrum disorder (ASD) is characterized by difficulties in social communication and repetitive behaviors [1] with a prevalence of approximately 1 in 54 children [2]. Known genetic causes of autism now account for 30% of cases [3,4,5]. Phelan–McDermid syndrome (PMS) is one of the most common genetic forms of autism and is present in up to 2% of affected cases. PMS is caused by microdeletions in the long arm of chromosome 22 which includes the SHANK3 gene or by pathogenic variants in SHANK3 [6,7]. SHANK3 encodes a scaffolding protein in glutamate synapses, with animal models indicating glutamatergic dysregulation in PMS [8,9]. Individuals with PMS have a wide range of symptoms including intellectual disability (ID), delayed or absent speech, hypotonia, medical comorbidities, and dysmorphic features [10]. Up to 80% of children with PMS also meet Diagnostic and Statistical Manual of Mental Disorders (DSM) criteria for ASD [11]. As defined by the DSM-5, sensory reactivity symptoms fall within the Restricted and Repetitive Behavior domain and include hyperreactivity (over-responsiveness), hyporeactivity (under-responsiveness), and seeking out sensory aspects of the environment (seeking) [1]. Hyperreactivity describes a strong and/or aversive reaction to a sensory stimulus, such as covering ears in response to everyday sounds or avoiding wearing clothes of a certain texture. Hyporeactivity describes delayed or absent responses to sensory stimuli such as failure to notice the sound of an alarm or the sight of a car passing by. Sensory seeking refers to a craving and fascination with certain sensory stimuli, such as repeatedly touching specific textures or visually inspecting objects for extended periods of time.
While sensory reactivity symptoms are widely reported in idiopathic forms of ASD (iASD) [12,13] with sensory reactivity differences reported in approximately 60-85% of autistic children [12,14,15], few studies have examined sensory symptoms in PMS [16]. Results from our group using the Short Sensory Profile, a well-validated caregiver questionnaire, found that children with PMS showed more hyporeactivity symptoms, specifically low energy/weak symptoms, and less hyperreactivity, specifically auditory/visual sensory sensitivity, as compared to children with iASD [16]. In addition, high levels of sensory hyporeactivity were identified in individuals with sequence variants in SHANK3, with pain insensitivity reported in 94% of cases. Deep characterization of the sensory reactivity phenotype in PMS holds value for the clinical evaluation and treatment of individuals with PMS and for a better understanding of potential relationships with underlying biological mechanisms related to the SHANK3 gene. More broadly, robust methods to quantify sensory reactivity symptomatology are especially important for individuals who are severely affected, including individuals with PMS, who are often unable to verbally describe their sensory experiences.
From a biological perspective, SHANK3 is known to affect glutamatergic processing. However, the relationship between the potential role of glutamate and sensory phenotypes remains unclear. There are some reports linking GABAergic activity to sensory reactivity. For example, in typically developing children, specific polymorphisms in the GABRB3 gene were significantly associated with tactile reactivity [17]. There is also some evidence of an association between heterozygous Gabrb3 deletion and increased tactile reactivity in male mice [18]. Overall, however, little is known about the role of glutamatergic/GABAergic neurotransmission in the emergence and longer term trajectory of sensory symptoms. Understanding sensory reactivity in a syndrome caused by glutamatergic dysfunction may offer critical information about the relationship between clinical features and underlying neurobiology.
The current study delineates the sensory reactivity phenotype and examines genotype–phenotype interactions in a large sample of children with PMS. The Sensory Assessment for Neurodevelopmental Disorders (SAND) [19] was used to quantify sensory symptoms and examine its utility as a clinical outcome assessment. The SAND is a clinician-administered observation and corresponding caregiver interview that captures sensory symptoms based on DSM-5 criteria for ASD and is appropriate for individuals with varying levels of ability, including those with few to no words [20]. The SAND has been used successfully in other genetic forms of autism [21]; however, it has yet to be examined extensively in PMS. Establishing the utility of the SAND as a clinical outcome measure may have important implications for ongoing clinical trials in PMS.

2. Materials and Methods

2.1. Participants

Sensory reactivity was measured in 52 children with PMS (26 males, M age = 6.65, SD = 2.90), 132 children with iASD (114 males, M age = 6.11, SD = 2.55), and 54 typically developing (TD) children (24 males, M age = 5.39, SD = 2.55), between the ages of 18 months and 12 years old (Table 1). A subset of children with PMS (n = 17) and iASD (n = 30) returned for a 12-week visit to assess the stability of the SAND during a typical clinical trial interval. PMS diagnosis was confirmed using chromosomal microarray or sequencing [11]. ASD was diagnosed according to a consensus diagnosis determined by psychiatric evaluation using the DSM-5, the Autism Diagnostic Observation Schedule, Second Edition [22], and the Autism Diagnostic Interview-Revised [23]. TD participants were screened with the Social Responsiveness Scale, Second Edition, and all scored below clinically significant cutoffs [24]. Appropriate cognitive assessments were determined based on age and language ability and included the Mullen Scales of Early Learning [25], the Stanford–Binet, Fifth Edition (SB-5) [26], or the Differential Ability Scales, Second Edition (DAS-2) [27]. Groups differed significantly in age (p = 0.048) and FSIQ/DQ (p < 0.001). Given the level of intellectual disability common in children with PMS, TD participants could not be matched on IQ; however, a sample of children with iASD also met the criteria for intellectual disability (n = 55, mean FSIQ = 44.57, SD = 12.97, range 20–67). Analyses were run with and without IQ and age as covariates. Moreover, children with iASD and PMS with an IQ below 70 were also compared directly.

2.2. Ethics Declaration

The study was approved by the Mount Sinai Program for the Protection of Human Subjects (Study: 98-0436, Assessment Core for phenotyping approved annually since 1998). Informed written consent was obtained from parents or legal guardians and assent was obtained from participants when appropriate.

2.3. Sensory Evaluation

The Sensory Assessment for Neurodevelopmental Disorders (SAND) [20] is a standardized clinician-administered observation and corresponding caregiver interview validated in children ages 2–12. Children are presented with a series of visual (e.g., spinning disc, light up wand), tactile (e.g., textured balls, hot/cold packs), and auditory stimuli (e.g., unexpected noisemaker, siren buzzer) that probe for sensory behaviors, which are rated by a trained examiner on an algorithm measuring discrete sensory hyperreactivity, hyporeactivity, and seeking behaviors across visual, tactile, and auditory modalities. The corresponding caregiver interview consists of 36 corresponding items and indicates whether a given sensory behavior is present (1) or absent (0). For any domain with behaviors coded “present,” clinicians/caregivers rated the severity of symptoms within that domain: mild (1) or moderate-to-severe (2). Total SAND scores are based on the combination of observed and reported behaviors, including severity scores. Summary scores were calculated for each DSM-5 symptom domain (hyperreactivity, hyporeactivity, seeking), modality (visual, tactile, auditory), and subscale (e.g., visual hyperreactivity, visual hyporeactivity, visual seeking, etc.). Total scores greater than or equal to 16, domain and modality scores greater than or equal to 8, and subscale scores greater than or equal to 5 reflect a clinically significant level of symptoms.

2.4. Analysis

SPSS 27 was used to analyze the data. Descriptive statistics examined the percentage of participants who fell above clinical cutoffs on the SAND. A MANOVA was conducted to test if groups differed by domain (hyperreactivity, hyporeactivity and seeking) and modality (visual, tactile, auditory). A MANCOVA with age and IQ as covariates was run to see if age or IQ had an effect, and a MANOVA was re-run to examine the group with ASD + intellectual disability relative to the PMS group. Tukey multiple comparison corrections were used for all post hoc testing. Finally, to assess stability of SAND scores over a 12-week period, intraclass correlation coefficients (ICC) were calculated.
For genotype–phenotype analyses, participants with PMS were split into two groups based on genotype: Class I (n = 30) included participants with sequence variants in SHANK3, or those with deletions including only SHANK3 or SHANK3 with ACR, RABL2B, and/or ARSA; Class II (n = 22) included all other participants with larger deletions that did not classify for Class I. Mann–Whitney U tests were used to assess differences between groups in SAND scores. Chi-square tests assessed differences in the proportion that surpassed SAND clinical cut-off scores. Effect sizes were measured with Cohen’s d or phi.

3. Results

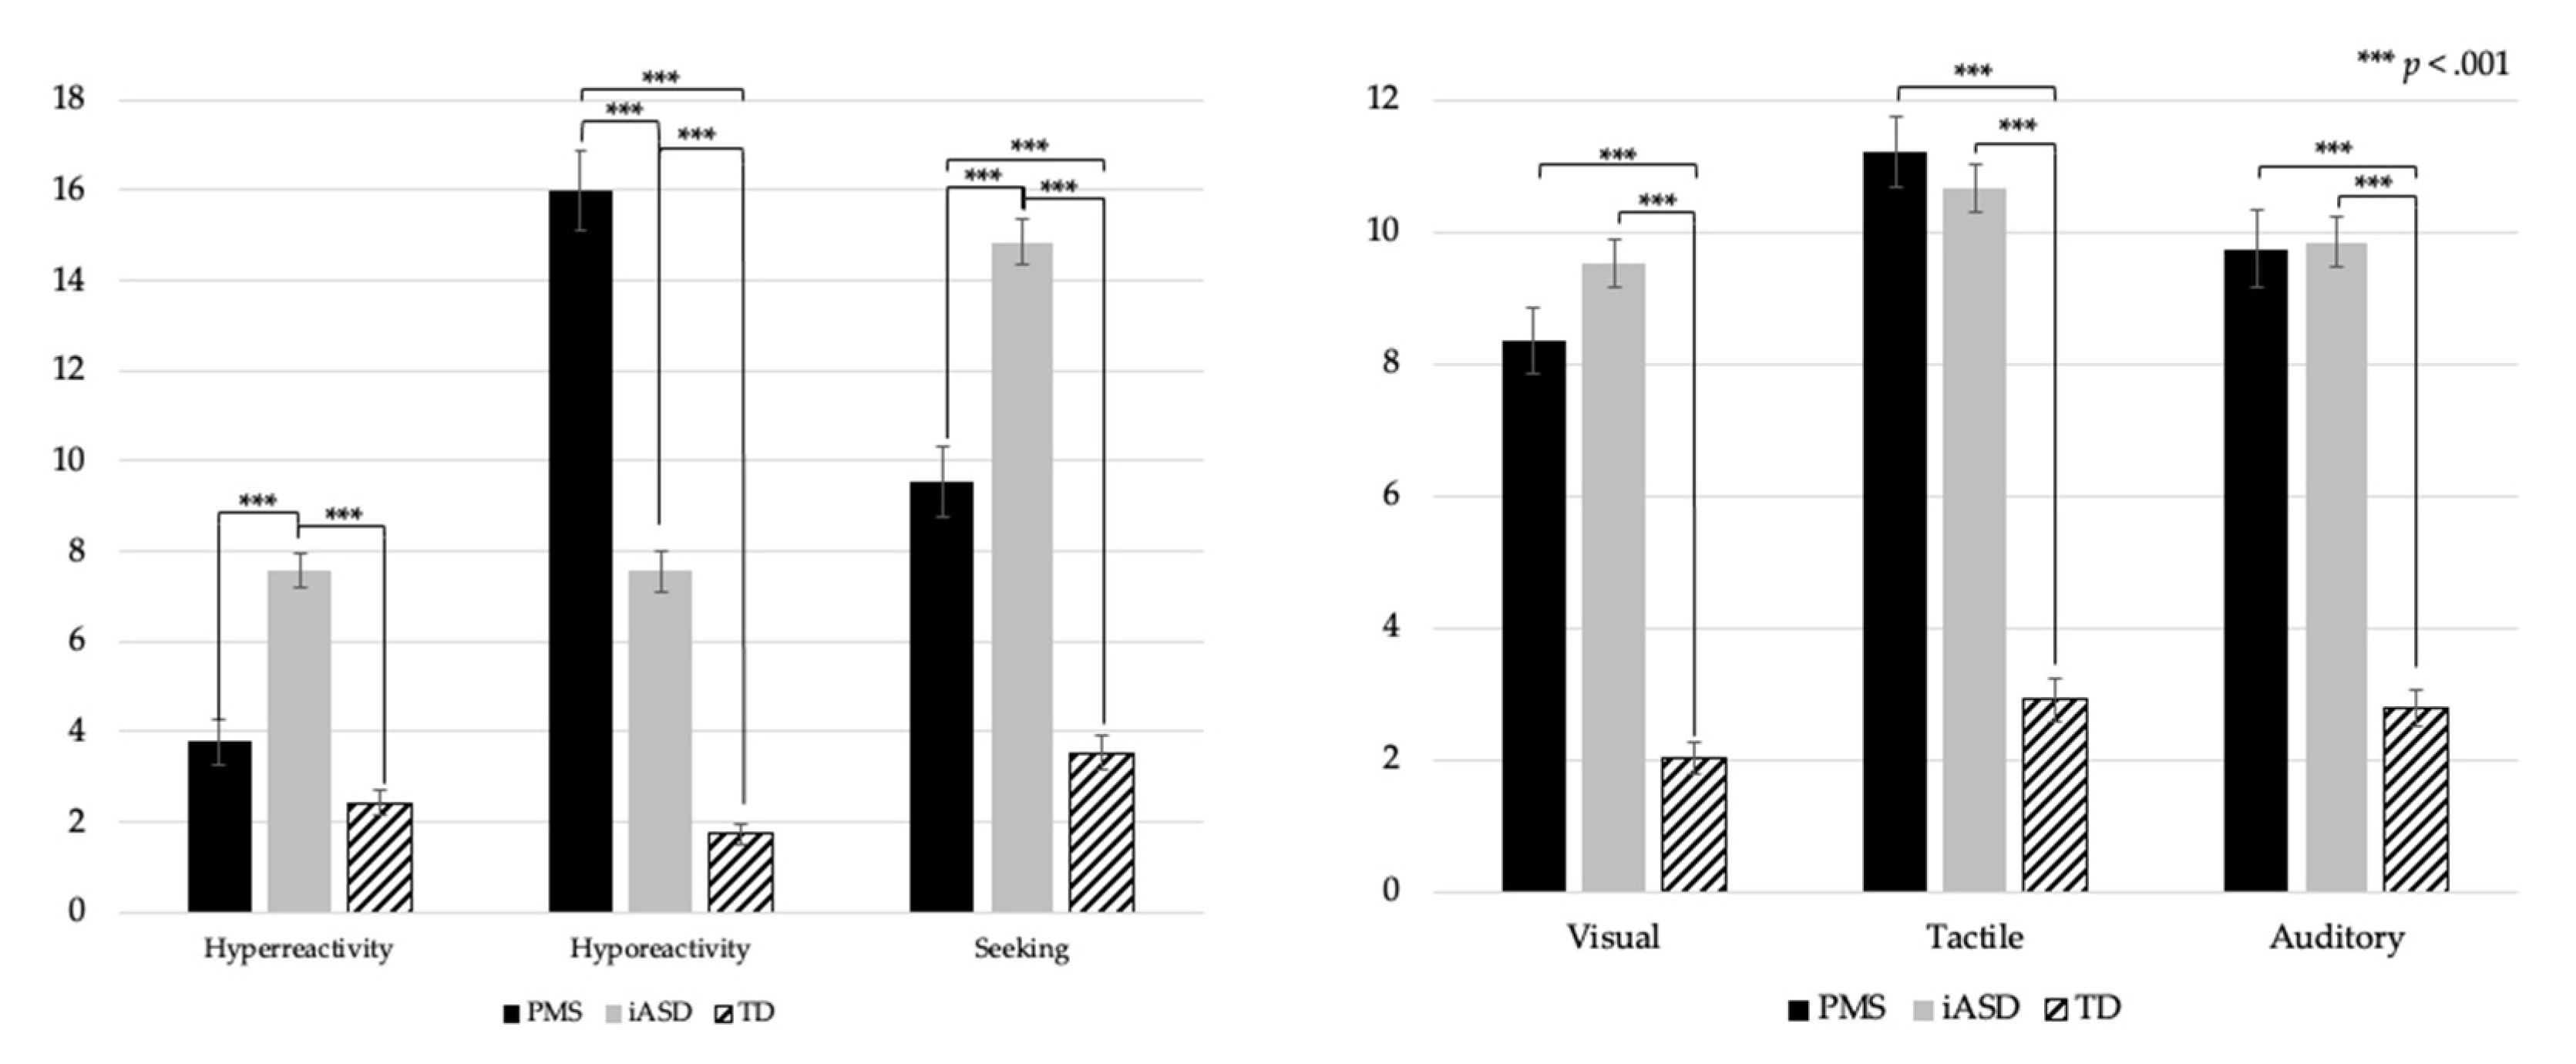
3.1. Group Comparisons on SAND Domain, Modality and Subscale Scores

A MANOVA (Table 2) showed that groups significantly differed on SAND Total Score (F (18) = 28.53, p < 0.0001). Tests of between-subjects effects showed significant differences in each DSM-5 domain: hyperreactivity (F(2) = 45.85, p < 0.0001), hyporeactivity (F (2) = 114.89, p < 0.0001), and seeking (F(2) = 89.07, p < 0.0001). All sensory modalities also significantly differed: visual (F (2) = 81.21, p < 0.0001), tactile (F(2) = 93.46, p < 0.0001), and auditory (F(2) = 71.70, p < 0.0001). Differences between groups were significant for all subscales: visual hyperreactivity (F = 10.75, p < 0.0001), visual hyporeactivity (F (2) = 74.45, p < 0.0001), visual seeking (F(2) = 85.91, p < 0.0001), tactile hyperreactivity (F = 16.70, p < 0.0001), tactile hyporeactivity (F(2) = 71.67, p < 0.0001), tactile seeking (F(2) = 47.79, p < 0.0001), auditory hyperreactivity (F(2) = 40.37, p < 0.0001), auditory hyporeactivity (F(2) = 68.50, p < 0.0001), and auditory seeking (F(2) = 31.75, p < 0.0001).
Post hoc comparisons using Tukey multiple comparison corrections revealed that children in the iASD group significantly differed from children in the TD group in all domains, p < 0.0001 (hyperreactivity, hyporeactivity and seeking), modalities, p < 0.0001 (visual, tactile and auditory), and subscales, p < 0.0001 (Table 2).
The PMS and TD groups differed significantly in hyporeactivity (p < 0.0001) and seeking (p < 0.0001) domains across all three modalities (p’s < 0.0001). PMS and TD groups did not differ on hyperreactivity total scores (p = 0.28) or any hyperreactivity subscales. The PMS and TD groups differed significantly on the auditory (p < 0.0001) and tactile (p < 0.0001) seeking subscales, but not on the visual seeking subscale (p = 0.09) (Table 2). Repetitive non-communicative sounds (auditory) and mouthing of objects (tactile) represented two of the most common seeking behaviors observed in the PMS group.
Children with PMS and iASD significantly differed on all three domains (p < 0.0001) but not on any modality: visual (p = 0.13), tactile (p = 0.61), auditory (p = 0.98). Children with PMS and iASD differed significantly on visual hyporeactivity (p < 0.0001), visual hyperreactivity (p = 0.045), and visual seeking (p < 0.0001) subscales. There were also significant differences for tactile hyporeactivity (p < 0.0001) and tactile hyperreactivity (p < 0.0001) but not for tactile seeking (p = 0.16). There were significant differences on each auditory subscale: hyperreactivity (p < 0.0001), hyporeactivity (p < 0.0001), and seeking (p < 0.0001) (Figure 1 and Table 2).
When examining the percentage of participants who fell in the clinically significant range (Table 3), the PMS and iASD groups showed similar levels of sensory symptoms overall; however, symptoms in the PMS group were largely driven by hyporeactivity (e.g., delayed or absent responses to the sight, sound, and feel of stimuli) and seeking (e.g., mouthing of objects, making repetitive sounds). In the iASD group, high rates of seeking were identified along with relatively equal rates of hyperreactivity and hyporeactivity, likely reflecting the heterogeneity of ASD. With regard to modality, tactile symptoms were most common for both groups, followed by auditory and visual symptoms. There were no significant differences in sensory reactivity scores between males and females with PMS.

3.2. SAND Score Comparisons for Participants with Intellectual Disability

Group comparisons were conducted with children with iASD who also met DSM-5 criteria for ID based on IQ and Vineland scores <70 and compared to children with PMS, who all met the criteria for ID. Similar to comparisons described above, children with PMS showed significantly less hyperreactivity (p < 0.0001) and seeking (p < 0.0001), and more hyporeactivity (p < 0.0001). Children with PMS also showed fewer visual (p = 0.001) and auditory (p = 0.006) symptoms overall and no difference in the number of tactile symptoms (p = 0.22). Specifically, children with PMS had fewer visual hyperreactivity symptoms (p = 0.013), greater visual hyporeactivity symptoms (p < 0.0001), and fewer visual seeking symptoms (p < 0.0001) compared to the iASD + ID group. Children with PMS also showed significantly fewer tactile hyperreactivity symptoms (p = 0.03), greater tactile hyporeactivity symptoms (p < 0.0001), and less tactile seeking symptoms (p = 0.001). Children with PMS and iASD + ID significantly differed on all auditory subscales: hyperreactivity (p < 0.0001), hyporeactivity (p < 0.0001), and seeking (p < 0.0001).

3.3. Stability of SAND Scores

ICCs assessed absolute agreement in SAND scores for the PMS (n = 17) and iASD (n = 30) groups (Table 3) and indicated moderate to high levels of consistency over a 12-week period (Table 4).

3.4. Genotype–Phenotype Associations

The Class I group included 30 participants (7.3 year ± 2.8, 37% female) and the Class II group included 22 participants (5.7 year ± 2.8, 68% female). The analyses revealed that the Class I and Class II groups only differed on the SAND auditory subscales, where the Class I group had significantly higher hyperreactivity (p = 0.011, d = 0.89) and lower hyporeactivity (p = 0.02, d = 0.72) symptoms than the Class II group (Table 5). Similarly, the Class I group was significantly more likely to surpass the clinical threshold for auditory hyperreactivity (p = 0.044, phi = 0.279) and less likely for auditory hyporeactivity (p = 0.033, phi = 0.296) than the Class II group. The groups did not differ on any other SAND scales, and the results from the Mann–Whitney U tests did not undergo correction for multiple comparisons.

4. Discussion

This study demonstrated the utility of a direct observational assessment and corresponding caregiver interview to characterize sensory reactivity symptoms in PMS. Our results indicate that children with PMS not only differ from TD children, but also from children with iASD. Specifically, children with PMS showed more hyporeactivity symptoms and fewer hyperreactivity and seeking symptoms compared to children with iASD. Differences were particularly prominent in the auditory domain. The results were consistent when comparing individuals with PMS to children with iASD who also had ID. While both children with PMS and iASD had higher overall scores on the SAND, on average, compared to TD children, the PMS and TD groups did not differ in the frequency of hyperreactivity. Findings were consistent within the PMS group regardless of sex.
This unique profile, in which children with PMS showed significantly more hyporeactivity symptoms and less hyperreactivity across visual, tactile, and auditory sensory modalities, suggests there may be a link between glutamatergic processing and sensory hyporeactivity. Results are similar to Mieses et al. (2016) [15] where we also found a significant number of hyporeactivity symptoms, specifically on the SSP low energy/weak scale, and fewer auditory hyperreactivity and auditory filtering difficulties in children with PMS compared to an independent iASD group. High rates of tactile hyperactivity, such as pain insensitivity, are also consistent with findings from a Shank3 animal model [28].
Results from 12-week stability data suggest that the SAND may be a useful clinical outcome assessment, with good stability across scales. In addition, hyporeactivity may represent a novel target for treatment in clinical trials within the syndrome. Clinically, practitioners should be aware of safety concerns resulting from sensory hyporeactivity (e.g., under-responsiveness to warning sounds such as sirens; high pain/temperature thresholds; delayed or absent response to a car passing by). The results suggest that interventions targeting sensory processing are warranted, with a particular focus on global hyporeactivity.
For the first time, we also explored genotype–phenotype associations in sensory reactivity symptomotology. Overall, results suggest that haploinsufficiency of SHANK3 is the main driver of the sensory phenotype seen in PMS. These results are in line with previous genotype–phenotype studies where no differences were found in sensory processing as measured by the Short Sensory Profile [29] and the ADI-R sensory interests’ subdomain [11]. However, given the size of our cohort, these results should be interpreted with caution. Future studies should explore auditory processing in PMS in greater depth to determine whether the genotype–phenotype differences in auditory hyperreactivity and hyporeactivity persist in larger samples, which would indicate a greater level of hyporeactivity, and less hyperreactivity, in those with larger deletions. Investigating whether there may be other genes in the 22q13.3 region playing a role in auditory processing would be a meaningful future direction.

5. Conclusions

Using a comprehensive direct assessment of sensory symptomatology, this study established a distinct sensory reactivity phenotype in children with a PMS, characterized by global hyporeactivity across visual, tactile, and auditory modalities, and to a lesser degree, tactile and auditory sensory seeking. This sensory phenotype is distinct from iASD and other monogenic forms of ASD [21,30] and offers insight into the potential role of SHANK3 deficiency in sensory reactivity. Understanding sensory reactivity abnormalities in PMS in the context of known glutamatergic dysregulation may inform pharmacological treatment approaches.

Author Contributions

Conceptualization, T.T. and P.M.S.; methodology, T.T. and P.M.S.; software, T.T. and P.M.S.; validation, T.T. and P.M.S.; formal analysis, T.T., P.M.S., C.L. and T.L.; investigation, T.T., P.M.S., C.L., T.L., M.R., J.G.-J., J.Z. and S.L.; resources, T.T., P.M.S., A.K. and J.D.B.; data curation, T.T., P.M.S., C.L., T.L., M.R., J.G.-J., J.Z. and S.L.; writing—original draft preparation, T.T., P.M.S. and T.L.; writing—review and editing, T.T., P.M.S., C.L., T.L., M.R., J.G.-J., J.Z., S.L., A.K. and J.D.B.; visualization, T.T. and P.M.S.; supervision, T.T. and P.M.S.; project administration, T.T. and PMS; funding acquisition, T.T., P.M.S., A.K. and J.D.B. All authors have read and agreed to the published version of the manuscript.

Funding

This research was funded by the Beatrice and Samuel A. Seaver Foundation, R01NS105845 (AK), and R21MH107839 (JDB).

Institutional Review Board Statement

The study was conducted according to the guidelines of the Declaration of Helsinki, and approved by Program for the Protection of Human Subjects of the Icahn School of Medicine at Mount Sinai (Study: 98-0436, Assessment Core for phenotyping approved annually since 1998).

Informed Consent Statement

Written informed consent was obtained from all parents/legal guardians.

Data Availability Statement

The majority of the dataset used during the current study is included in this published article. The remainder of the dataset is available from the corresponding author on reasonable request and may require ethics review.

Acknowledgments

We are grateful for the generous participation of each family involved in this study and owe special thanks to our colleagues who participated in the clinical phenotyping aspects of this project.

Conflicts of Interest

P.M.S. and T.T. are the inventors of the Sensory Assessment for Neurodevelopmental Disorders. This intellectual property is licensed to Stoelting Co. The funders had no role in the design of the study; in the collection, analyses, or interpretation of data; in the writing of the manuscript, or in the decision to publish the results.

References

  1. American Psychiatric Association. Diagnostic and Statistical Manual of Mental Disorders, 5th ed.; American Psychiatric Publishing: Arlington, VA, USA, 2013. [Google Scholar]
  2. Baio, J.; Wiggins, L.; Christensen, D.L.; Maenner, M.J.; Daniels, J.; Warren, Z.; Kurzius-Spencer, M.; Zahorodny, W.; Robinson, C.; Rosenberg, C.R.; et al. Prevalence of Autism Spectrum Disorder Among Children Aged 8 Years—Autism and Developmental Disabilities Monitoring Network, 11 Sites, United States, 2014. MMWR Surveill. Summ. 2018, 67, 1–23. [Google Scholar] [CrossRef]
  3. Miles, J.H. Autism spectrum disorders—A genetics review. Genet. Med. 2011, 13, 278–294. [Google Scholar] [CrossRef] [PubMed] [Green Version]
  4. Schaefer, G.B.; Mendelsohn, N.J. Clinical genetics evaluation in identifying the etiology of autism spectrum disorders: 2013 guideline revisions. Genet. Med. 2013, 15, 399–407. [Google Scholar] [CrossRef] [Green Version]
  5. Genovese, A.; Butler, M.G. Clinical Assessment, Genetics, and Treatment Approaches in Autism Spectrum Disorder (ASD). Int. J. Mol. Sci. 2020, 21, 4726. [Google Scholar] [CrossRef]
  6. Betancur, C.; Buxbaum, J.D. SHANK3 haploinsufficiency: A common but underdiagnosed highly penetrant monogenic cause of autism spectrum disorders. Mol. Autism 2013, 4, 17. [Google Scholar] [CrossRef] [Green Version]
  7. Leblond, C.S.; Nava, C.; Polge, A.; Gauthier, J.; Huguet, G.; Lumbroso, S.; Giuliano, F.; Stordeur, C.; Depienne, C.; Mouzat, K.; et al. Meta-analysis of SHANK Mutations in Autism Spectrum Disorders: A Gradient of Severity in Cognitive Impairments. PLoS Genet. 2014, 10, e1004580. [Google Scholar] [CrossRef] [PubMed] [Green Version]
  8. Bozdagi, O.; Sakurai, T.; Papapetrou, D.; Wang, X.; Dickstein, D.L.; Takahashi, N.; Kajiwara, Y.; Yang, M.; Katz, A.; Scattoni, M.; et al. Haploinsufficiency of the autism-associated Shank3 gene leads to deficits in synaptic function, social interaction, and social communication. Mol. Autism 2010, 1, 15. [Google Scholar] [CrossRef] [PubMed] [Green Version]
  9. Yang, M.; Bozdagi, O.; Scattoni, M.L.; Wöhr, M.; Roullet, F.I.; Katz, A.M.; Abrams, D.N.; Kalikhman, D.; Simon, H.; Woldeyohannes, L.; et al. Reduced Excitatory Neurotransmission and Mild Autism-Relevant Phenotypes in Adolescent Shank3 Null Mutant Mice. J. Neurosci. 2012, 32, 6525–6541. [Google Scholar] [CrossRef]
  10. Kolevzon, A.; Angarita, B.; Bush, L.; Wang, A.T.; Frank, Y.; Yang, A.; Rapaport, R.; Saland, J.; Srivastava, S.; Farrell, C.; et al. Phelan-McDermid syndrome: A review of the literature and practice parameters for medical assessment and monitoring. J. Neurodev. Disord. 2014, 6, 39. [Google Scholar] [CrossRef]
  11. Soorya, L.; Kolevzon, A.; Zweifach, J.; Lim, T.; Dobry, Y.; Schwartz, L.; Frank, Y.; Wang, A.T.; Cai, G.; Parkhomenko, E.; et al. Prospective investigation of autism and genotype-phenotype correlations in 22q13 deletion syndrome and SHANK3 deficiency. Mol. Autism 2013, 4, 18. [Google Scholar] [CrossRef] [Green Version]
  12. Tomchek, S.D.; Dunn, W. Sensory Processing in Children With and Without Autism: A Comparative Study Using the Short Sensory Profile. Am. J. Occup. Ther. 2007, 61, 190–200. [Google Scholar] [CrossRef] [Green Version]
  13. Tavassoli, T.; Miller, L.J.; Schoen, S.; Nielsen, D.M.; Baron-Cohen, S. Sensory over-responsivity in adults with autism spectrum conditions. Autism 2014, 18, 428–432. [Google Scholar] [CrossRef] [PubMed]
  14. Tavassoli, T.; Bellesheim, K.; Siper, P.M.; Wang, A.T.; Halpern, D.; Gorenstein, M.; Grodberg, D.; Kolevzon, A.; Buxbaum, J. Measuring Sensory Reactivity in Autism Spectrum Disorder: Application and Simplification of a Clinician-Administered Sensory Observation Scale. J. Autism Dev. Disord. 2015, 46, 287–293. [Google Scholar] [CrossRef]
  15. Green, S.A.; Hernandez, L.; Tottenham, N.; Krasileva, K.; Bookheimer, S.Y.; Dapretto, M. Neurobiology of Sensory Overresponsivity in Youth With Autism Spectrum Disorders. JAMA Psychiatry 2015, 72, 778–786. [Google Scholar] [CrossRef] [Green Version]
  16. Mieses, A.M.; Tavassoli, T.; Li, E.; Soorya, L.; Lurie, S.; Wang, A.T.; Siper, P.; Kolevzon, A. Brief Report: Sensory Reactivity in Children with Phelan-McDermid Syndrome. J. Autism Dev. Disord. 2016, 46, 2508–2513. [Google Scholar] [CrossRef] [PubMed]
  17. Tavassoli, T.; Auyeung, B.; Murphy, L.C.; Baron-Cohen, S.; Chakrabarti, B. Variation in the autism candidate gene GABRB3 modulates tactile sensitivity in typically developing children. Mol. Autism 2012, 3, 6. [Google Scholar] [CrossRef] [Green Version]
  18. DeLorey, T.M.; Sahbaie, P.; Hashemi, E.; Li, W.-W.; Salehi, A.; Clark, D.J. Somatosensory and sensorimotor consequences associated with the heterozygous disruption of the autism candidate gene, Gabrb3. Behav. Brain Res. 2011, 216, 36–45. [Google Scholar] [CrossRef] [Green Version]
  19. Siper, P.M.; Tavassoli, T. Sensory Assessment for Neurodevelopmental Disorders; Stoelting Co.: Wood Dale, IL, USA, 2021. [Google Scholar]
  20. Siper, P.M.; Kolevzon, A.; Wang, A.T.; Buxbaum, J.D.; Tavassoli, T. A clinician-administered observation and corresponding caregiver interview capturing DSM-5 sensory reactivity symptoms in children with ASD. Autism Res. 2017. [Google Scholar] [CrossRef] [PubMed]
  21. Siper, P.; Layton, C.; Levy, T.; Lurie, S.; Benrey, N.; Zweifach, J.; Rowe, M.; Tang, L.; Guillory, S.; Halpern, D.; et al. Sensory Reactivity Symptoms Are a Core Feature of ADNP Syndrome Irrespective of Autism Diagnosis. Genes 2021, 12, 351. [Google Scholar] [CrossRef]
  22. Lord, C.; Rutter, M.; DiLavore, P.S.; Risi, S.; Gotham, K.D.B. Autism Diagnostic Observation Schedule, 2nd ed.; ADOS-2 Mannual Part I: Modules 1–4; Western Psychological Services: Torrance, CA, USA, 2012. [Google Scholar]
  23. Lord, C.; Rutter, M.; Le Couteur, A. Autism Diagnostic Interview-Revised: A revised version of a diagnostic interview for caregivers of individuals with possible pervasive developmental disorders. J. Autism Dev. Disord. 1994, 24, 659–685. [Google Scholar] [CrossRef]
  24. Western Psychological Services. Responsiveness Scale, 2nd ed.; Western Psychological Services: Torrance, CA, USA, 2012. [Google Scholar]
  25. Mullen, M. Mullen Scales of Early Learning; American Guidance Services: Circle Pines, MN, USA, 1995. [Google Scholar]
  26. Roid, G.H. Stanford Binet Intelligence Scales, 5th ed.; Riverside Publishing: Itasca, IL, USA, 2003. [Google Scholar]
  27. Elliott, C. Differential Ability Scales, 2nd ed.; Harcourt Assessment: San Antonio, TX, USA, 2007. [Google Scholar]
  28. Han, Q.; Kim, Y.H.; Wang, X.; Liu, D.; Zhang, Z.-J.; Bey, A.L.; Lay, M.; Chang, W.; Berta, T.; Zhang, Y.; et al. SHANK3 Deficiency Impairs Heat Hyperalgesia and TRPV1 Signaling in Primary Sensory Neurons. Neuron 2016, 92, 1279–1293. [Google Scholar] [CrossRef] [PubMed] [Green Version]
  29. Droogmans, G.; Swillen, A.; Van Buggenhout, G. Deep Phenotyping of Development, Communication and Behaviour in Phelan-McDermid Syndrome. Mol. Syndr. 2019, 10, 294–305. [Google Scholar] [CrossRef] [PubMed]
  30. Rais, M.; Binder, D.K.; Razak, K.A.; Ethell, I.M. Sensory Processing Phenotypes in Fragile X Syndrome. ASN Neuro 2018, 10. [Google Scholar] [CrossRef] [PubMed] [Green Version]
Figure 1. SAND domain (Hyperreactivity, Hyporeactivity, Seeking) and modality (Visual, Tactile, Auditory) mean scores for PMS, iASD, and TD groups.
Genes 12 00977 g001
Table 1. Participant demographics. ADOS-2 comparison scores range from 1–10 with higher numbers reflecting greater symptom severity.
M(SD)Male/FemaleAge
(years)
ASD DxADOS-2 Comparison ScoreFull Scale IQ/DQNonverbal IQ/DQVerbal IQ/DQVABS Adaptive Behavior Composite
PMS 26/266.65 (2.90)42/526.63 (2.23)30.20 (16.88)35.74 (19.66)27.52 (19.53)55.14 (12.61)
iASD 114/186.11 (2.55)132/1327.31 (1.60)72.80 (29.99)79.27 (30.17)69.76 (30.66)70.70 (15.39)
TD 24/305.39 (2.55)0/54N/A117.21 (16.06)115.18 (17.70)114.88 (12.84)N/A
IQ and Vineland Adaptive Behavior Composite scores are standard scores (M = 100; SD = 15). Developmental Quotients (DQs) were calculated by dividing age equivalents by chronological age x 100 for participants above the age-normed range on the Mullen Scales of Early Learning who were unable to complete the Stanford-Binet. Abbreviations: ADOS-2: Autism Diagnostic Observation Schedule (Second Edition); IQ: Intellectual quotient; DQ: Developmental quotient; VABS: Vineland Adaptive Behavior Scales; PMS: Phelan–McDermid syndrome; iASD: idiopathic autism spectrum disorder; TD: typically developing controls; N/A: not applicable.
Table 2. Differences in SAND scores between groups. F and p values represent results from the MANOVA.
SAND Subscale GroupMeanSDFp
Hyperreactivity
Total
TD2.431.9045.86<0.001
iASD7.644.51
PMS3.543.19
VisualTD0.240.6410.75<0.001
iASD1.391.92
PMS0.771.32
TactileTD1.061.3416.70<0.001
iASD2.742.17
PMS1.601.87
Auditory TD1.131.3640.37<0.001
iASD3.512.29
PMS1.171.81
Hyporeactivity
Total
TD1.741.65114.89<0.001
iASD7.555.23
PMS16.196.32
VisualTD0.741.0574.45<0.001
iASD3.052.28
PMS5.632.28
TactileTD0.410.8171.67<0.001
iASD2.452.12
PMS4.942.31
AuditoryTD0.590.9268.50<0.001
iASD2.052.45
PMS5.622.85
Seeking
Total
TD3.542.8889.07<0.001
iASD14.805.83
PMS9.565.81
Visual TD1.041.3985.91<0.001
iASD5.042.39
PMS1.902.00
TactileTD1.441.6947.79<0.001
iASD5.442.75
PMS4.672.72
Auditory TD1.061.3831.75<0.001
iASD4.322.85
PMS2.982.68
Table 3. Percentage of participants falling in the clinically significant range on the SAND.
TotalHyperreactivityHyporeactivitySeekingVisualTactileAuditory
PMS92.31%11.54%92.31%65.38%57.69%80.77%69.23%
iASD93.18%44.70%43.18%87.88%65.15%80.30%71.97%
Table 4. Stability of SAND scores over 12 weeks.
DxICC95% CI RangeSig
SAND
TotalPMS0.8790.674–0.956<0.001
iASD0.8340.653–0.920<0.001
HyperreactivityPMS0.7360.296–0.9030.003
iASD0.6650.297–0.8390.002
HyporeactivityPMS0.7750.368–0.9190.003
iASD0.7660.512–0.887<0.001
SeekingPMS0.8210.495–0.936<0.001
iASD0.910.813–0.957<0.001
VisualPMS0.8570.617–0.948<0.001
iASD0.6170.196–0.8170.006
AuditoryPMS0.9270.804–0.973<0.001
iASD0.7660.513–0.888<0.001
TactilePMS0.615−0.109–0.8630.038
iASD0.8370.666–0.921<0.001
Table 5. Genotype–phenotype associations. Mean and standard deviation displayed for SAND scores followed by proportion of participants who surpassed the clinically significant threshold on the SAND for each domain and subscale. * indicates a statistically significant difference.
Scores Proportion Surpassed Clinical Threshold
Domain/SubscaleClass IClass IIpClass IClass IIp
Hyperreactivity3.83 (3.6)3.14 (2.5)0.67916.67%4.55%0.176
Hyporeactivity14.73 (6.2)18.18 (6.0)0.08686.67%100.00%0.075
Seeking10.07 (5.4)8.86 (6.4)0.50470.00%59.09%0.414
Visual7.83 (4.2)8.95 (2.8)0.19946.67%72.73%0.06
Auditory10.93 (3.7)11.59 (4.3)0.41880.00%81.82%0.869
Tactile9.87 (4.9)9.64 (3.3)0.91866.67%72.73%0.64
Visual Hyperreactivity0.80 (1.3)0.73 (1.4)0.7980.00%4.55%0.238
Visual Hyporeactivity5.10 (2.4)6.36 (1.9)0.07366.67%77.27%0.404
Visual Seeking1.93 (2.1)1.86 (1.9)0.97716.67%9.09%0.429
Tactile Hyperreactivity1.27 (1.6)2.05 (2.1)0.1783.33%4.55%0.822
Tactile Hyporeactivity4.83 (1.9)5.09 (2.8)0.56266.67%59.09%0.575
Tactile Seeking4.83 (2.3)4.45 (3.3)0.70260.00%45.45%0.299
Auditory Hyperreactivity1.77 (2.1)0.36 (0.8)0.011 *16.67%0.00%0.044 *
Auditory Hyporeactivity4.80 (3.0)6.73 (2.3)0.02 *53.33%81.82%0.033 *
Auditory Seeking3.30 (2.6)2.55 (2.8)0.2626.67%27.27%0.961
Total28.63 (11.1)30.18 (7.5)0.36490.00%100.00%0.075
Publisher’s Note: MDPI stays neutral with regard to jurisdictional claims in published maps and institutional affiliations.

