Article

Molecular Characterization of the miR156/MsSPL Model in Regulating the Compound Leaf Development and Abiotic Stress Response in Alfalfa

1
College of Animal Science and Technology, Yangzhou University, Yangzhou 225009, China
2
Key Laboratory of Sustainable Utilization of Tropical Biological Resources of Hainan Province, School of Tropical Crops, Hainan University, Haikou 570228, China
3
State Key Laboratory of Grassland Agro-Ecosystems, College of Pastoral Agriculture Science and Technology, Lanzhou University, Lanzhou 730000, China
*
Author to whom correspondence should be addressed.
Submission received: 15 November 2021 / Revised: 4 January 2022 / Accepted: 7 February 2022 / Published: 10 February 2022
(This article belongs to the Special Issue Mining the Excellent Functional Genes of Forage)

Abstract

:
Plant leaf patterns and shapes are spectacularly diverse. Changing the complexity of leaflet numbers is a valuable approach to increase its nutrition and photosynthesis. Alfalfa (Medicago sativa) is the most important forage legume species and has diversified compound leaf patterns, which makes it a model species for studying compound leaf development. However, transcriptomic information from alfalfa remains limited. In this study, RNA-Seq technology was used to identify 3746 differentially expressed genes (DEGs) between multifoliate and trifoliate alfalfa. Through an analysis of annotation information and expression data, SPL, one of the key regulators in modifiable plant development and abiotic stress response, was further analyzed. Here, thirty MsSPL genes were obtained from the alfalfa genome, of which 16 had the putative miR156 binding site. A tissue expression pattern analysis showed that the miR156-targeted MsSPLs were divided into two classes, namely, either tissue-specific or widely expressed in all tissues. All miR156-targeted SPLs strongly showed diversification and positive roles under drought and salt conditions. Importantly, miR156/MsSPL08 was significantly suppressed in multifoliate alfalfa. Furthermore, in the paralogous mutant of MsSPL08 isolated from Medicago truncatula, the phenotypes of mutant plants reveal that miR156/MsSPL08 is involved not only involved the branches but also especially regulates the number of leaflets. The legume is a typical compound leaf plant; the ratio of the leaflet often affects the quality of the forage. This study sheds light on new functions of SPL genes that regulate leaflet number development.

1. Introduction

Each step of biological and developmental progress requires appropriate transformation and expression changes in plants, such as the formation of organs, the division of cells, and the production of metabolites [1,2]. Leaves are the major component of plant architecture, and the main tissue of photosynthesis, thermoregulation, and gas exchange. Plant leaf forms are spectacularly diverse, and can be grouped into simple leaves and compound leaves. Compound leaves exhibit more diversity than simple leaves, particularly because of a specific morphogenetic process [3]. Alfalfa is the most widely cultivated legume for livestock, with leaves having a typical trifoliate pattern [4]. As one of the forages with the highest digestible protein, 70% of the protein is stored in the leaves, and the cellulose content in the leaves is only 1/3 of the stem [5]. Therefore, studying the molecular mechanism of alfalfa multifoliate formation can provide a strong theoretical basis for creating new alfalfa germplasm resources with high protein content.
Generally, the class 1 KNOTTED-LIKE HOMEOBOX (KNOX1) is recognized as a conserved pathway that regulates plant compound leaf differentiation. Additionally, PALM1 (Cys(2)His(2) zinc finger transcription factor) regulates the spatial-temporal expression of SINGLE LEAFLET1 (SGL1), which controls leaflet formation, in Medicago truncatula. CRISPR/Cas9 genome editing suggested that MsPALM1 regulates multifoliate formation in alfalfa [6]. A recent study found a new mechanism for regulating compound leaf patterning in which PINNATE-LIKE PENTAFOLIATA1 (PINNA1) is a determining factor of morphogenetic activity in inverted repeat-lacking clade (IRLC) legume plants [7]. Considering the importance of the complexity of the leaves to the quality of forage plants, further studies are required to explore the precise control mechanisms.
Transcription factors (TFs) are DNA-binding proteins that coordinate precise gene expression, which gives rise to distinct phenotypic outputs by activating and/or repressing the transcription of multiple target genes [8,9]. Among many types kinds of TF families, SPL encodes a special family of TFs that are unique to plants. SPL TFs are defined by containing 76 highly conserved amino acid residues, including two Zn-finger-like structures (Cys-CysHis-Cys and Cys-Cys-Cys-His), and a nuclear localization signal (NLS) motif [8,10]. To date, SPL genes have been recognized in various plant species, which range from the unicellular algae [11], Physcomitrella patens to the highest number, 177 SPL genes [12], identified in cotton [13]. Current studies in higher plants have suggested that SPL genes control diverse aspects of plant development and stimulus responses, including flowering time, fruit development and ripening, root development, vegetative phase transition, leaf initiation rate, trichome distribution on the stem, floral organ development, fertility, and stress responses [2,14,15,16,17,18,19]. In many developmental processes, the role of some SPL genes is post-transcriptionally regulated by miR156 (microRNAs156), as their transcripts carry functional response elements to these highly related miRNAs. All Arabidopsis thaliana SPL miRNA-responsive elements (MREs) are downstream of the SBP-domain and located in a part of the last exon, except for SPL3, SPL4, and SPL5, which lie in the 3′-untranslated region (3′-UTR), and all of them promote flowering time and vegetative phase transition [2,20,21]. In Arabidopsis, miR156 acts by repressing the expression of 10 SPL genes, which results in gain-of-function and loss-of-function phenotypes that divide the genes into the following three functionally distinct groups: the vegetative phase transition (SPL2, SPL9-11, SPL13, and SPL15); the floral meristem identity transition (SPL3-4 and SPL5), and certain physiological processes (SPL16) [22]. Si et al. tested the function of OsSPL13, which is recognized as a quantitative trait locus. A functional analysis showed that OsSPL13 enhanced rice grain length and yield, and bioinformatics analysis results suggested that it has an OsmiR156 complementary site located in the 3′ UTR [23]. The ideal plant architecture 1 (IPA1) quantitative trait locus encodes OsSPL14 and is regulated by OsmiR156 in rice. A functional analysis indicated that the OsSPL14 gene may help increase rice grain yield by increasing lodging resistance, enhancing grain yield per panicle, and reducing unproductive tillers [24]. Although the amount of functional and regulatory data on SPL genes is increasing, the physiological and biological characteristics of many members still need further clarification.
Recently, a chromosome-level genome assembly has been generated for cultivated alfalfa, which offers the capability of comprehensively analyzing the SPL gene family in this species. However, an overall analysis of MsSPL genes has not been performed in alfalfa, except by Ruimin Gao, who found seven SPLs regulated by miR156 in alfalfa through a next-generation RNA sequencing method [25]. Given the importance of SPL genes in the regulation of plant traits and abiotic stress adaptation, we systematically evaluated the SPL genes at the genome-wide level by using a rigorous method. Furthermore, M. truncatula was used as a model to verify the function of MsSPL08 in regulating multifoliate leaf development. The results provide valuable information for accelerating SPL gene research in this important forage crop.

2. Materials and Methods

2.1. Plant Material and Abiotic Stress Treatment

Two first-generation backcross populations were constructed from a cross between multifoliate alfalfa “PL34HQ”, and trifoliate alfalfa “Huaiyin”. A single F1 plant from the cross was used as the female parent, trifoliate alfalfa “Huaiyin” as a recurrent parent to create the BC1 backcross populations. Then choose the offspring with multifoliate trait as the female parent, “Huaiyin” alfalfa as a father to create the BC2 backcross populations. Finally, we obtained two genetic strains: multifoliate (pinnate pentafoliate leaves in most cases) and trifoliate alfalfa, which were used as RNA sequencing materials. The leaflets were collected from the apical meristem of five vegetative growth stage plants in May 2019 (active stage of physiological activity), then mix them as one biological replicate. Three biological replicates were applied for each leaf type, all sampled leaflets were rizol Kit (Invitrogen, Gaithersburg, MD, USA) immediately frozen in liquid nitrogen and stored at −80 °C for RNA isolation. A M. truncatula mtspl mutant (ecotype R108: NF10482-4) was isolated from a tobacco (Nicotiana tabacum) Tnt1 retrotransposon-tagged mutant collection by forward genetic screening [26]. The MtSPL4 gene has one exon with 423 nucleotides. The MtSPL4 gene was tested using the following primers designed based on MtSPL4: NF10482_F: TTCACCTGTGTTCTTGTGCAT, NF10482_R: TGGGACATTTGATCACTACTCTT, LTR6-R: GCTACCAACCAAACCAAGTCAA.
Alfalfa seeds (cultivar Gannong No. 9) were sterilized in 1.0% (v/v) sodium hypochlorite and germinated at 25 °C for 5 days. Then the uniform seedlings were cultivated into the sand culture at 25 °C, 50% relative humidity, and 16-h light/8-h dark conditions. After 30 days of cultivating, the uniform growth seedlings were classified into two groups: one was keeping the culture conditions as control, the other one was subjected to 20% PEG-6000 and 300 mM NaCl for 1, 2, and 4 days. Three biological replicates were applied for each time point. After treatment, the young root was immediately frozen in liquid nitrogen and stored at −80 °C for RNA isolation.

2.2. RNA Isolation, Illumina Library Construction, and Sequencing

Total RNA from each sample was separately isolated for Trizol Kit (Invitrogen, Gaithersburg, MD, USA). In total, six RNA samples were obtained, representing the two leaf types from five single plants. RNA was quantified and quality-checked for each sample using one percent of agarose gels and Agilent 2100 Bioanalyzer (Agilent Technologies, Santa Clara, CA, USA). Furthermore, the cDNA libraries were constructed according to the manufacturer’s instructions of the NEBNext UltraTM RNA Library Prep Kit for Illumina (NEB, Shanghai, China). The cDNA library was sequenced using the HiseqXTen platform at Novogene (Beijing, China). FastQC raw data were processed using Trimmomatic (Version 0.39) to obtain clean reads by removing reads containing N base and adapter, low-quality bases from reads 3′ to 5′and 5′ to 3′ (Q value < 20), and the bases whose tail mass value is less than 20 (the window size is 5 bp).

2.3. Bioinformatics Analysis of RNA-Seq Data

The genome assembly and annotation files (Version 3) of alfalfa from the figshare were used as the reference [6]. The TPM (Transcripts Per Million) method was used to calculate expression patterns through StringTie software (version 1.3.3b). Differentially expressed genes (DEGs) were conducted using the DESeq2 R package, and the q-Value < 0.05, FoldChange > 2 were defined as DEGs. The DEGs Gene Ontology (GO) and the Kyoto Encyclopedia (KEGG) enrichment analyses were implemented using the clusterProfiler (q-Value < 0.05). The software of HISAT2 was used to map the clean reads onto the cultivated alfalfa (cultivar XinJiangDaYe) genome.

2.4. Identification of Alfalfa SPL Genes

Alfalfa genome data were derived from the Figshare website (https://figshare.com/articles/dataset/genome_fasta_sequence_and_annotation_files/12327602, accessed on 9 July 2021). Initially, the conserved SBP domain (PF03110) based on Hidden Markov Model (HMM) was retrieved from the PFAM database (http://pfam.xfam.org/, accessed on 9 July 2021) and was employed to search the alfalfa protein sequence with the threshold of e  <  1 × 10⁻⁵. Furthermore, a TBLASTN homology search was performed against the alfalfa genome using Arabidopsis, rice, and M.truncatula SPL proteins, to identify additional SPLs. For the SPL with splice variants, only the primary one was kept and redundant sequences were removed using the CD-HIT tool (http://weizhongli-lab.org/cd-hit/, accessed on 9 July 2021). The protein length, molecular weight, grand average of hydropathy (GRAVY), and theoretical isoelectric point (pI) of each MsSPL protein were calculated within the ExPasy program (http://www.expasy.org/, accessed on 12 July 2021).

2.5. SPL Gene Bioinformatics Analysis in Alfalfa

The physical location of the MsSPL was displayed to chromosomes using TBtools software. The exon/intron structures of MsSPLs were analyzed in the GSDS 2.0 (http://gsds.gao-lab.org/, accessed on 12 July 2021). Conserved motifs of MsSPL proteins were identified using the MEME (http://meme-suite.org/tools/meme, Version 5.2.0) (accessed on 12 July 2021), with the maximum number of the motif is ten. The SPL protein sequences of MtSPLs (24), AtSPLs (16), and OsSPLs (19) were downloaded from the Phytozome 12 database (https://phytozome.jgi.doe.gov/pz/portal.html, accessed on 12 July 2021). Multiple protein sequence alignment was conducted using the ClustalW program. An unrooted phylogenetic tree was constructed with the maximum likelihood method and 1000 bootstrap by MEGA 7.0 software. Collinear blocks were evaluated by MCScan. The syntenic relationship between the MsSPL genes and SPL genes from A. thaliana, Oryza sativa, M. truncatula, and Glycine max were determined by using TBtools [27]. Furthermore, the synonymous substitution rate (Ks) and nonsynonymous substitution rate (Ka) ratios were calculated by the software of TBtools. The divergence date (T) of collinear gene pairs was estimated using the formula T = Ks/2λ, where λ was 1.5 × 10⁻⁸ in dicots [28].

2.6. Prediction of the miR156 Target Site and Promoter Cis-Element

The MtmiR156 sequences were obtained from the miRBase (http://www.mirbase.org/, accessed on 20 July 2021). Then the psRNATarget server (http://plantgrn.noble.org/psRNATarget/, accessed on 20 July 2021) was employed to predict potentially targeted by miR156 in alfalfa CDS and 3′ UTRs regions of all MsSPLs for complementary sequences, with the maximum expectation of three.
The 2.0 kb upstream sequence of the predicated MsSPL genes were used to analyze the putative stress or hormone-responsive cis-acting regulatory elements in PlantCARE online database [29].

2.7. Expression Analysis of MsSPLs in Different Tissues

The MsSPL genes transcriptional data of 6 tissues, including PES (post-elongation stem internodes), flowers, leaf, nitrogen-fixing root nodules, ES (elongating stem internodes), and root, were obtained from LegumeIP V3 (http://plantgrn.noble.org/LegumeIP/gdp/12/gene, accessed on 20 July 2021) to reveal their function in alfalfa growth and development [30].

2.8. RNA Isolation and qRT-PCR Verification

Total RNA was isolated using Sangon UNIQ-10 column Trizol total RNA extraction kit (TaKaRa, Dalian, China). cDNA synthesis, qRT-PCR reactions, and data analysis were performed according to previous studies [31], the actin gene used to evaluate the relative fold differences based on the comparative Ct method. The gene-specific primers were designed by the Primer3 software (Table S1).

2.9. Statistical Analysis

In the initial sampling portion of the entire experiment, we used three independent biological replicates. RNAseq analysis, SPL genes identify and bioinformatics analysis described in the Section 2 part. In addition, the significance between control and treatment groups were evaluated using Duncan’s multiple range test in SPSS 20. Graphs were generated with Photoshop 7.

3. Results

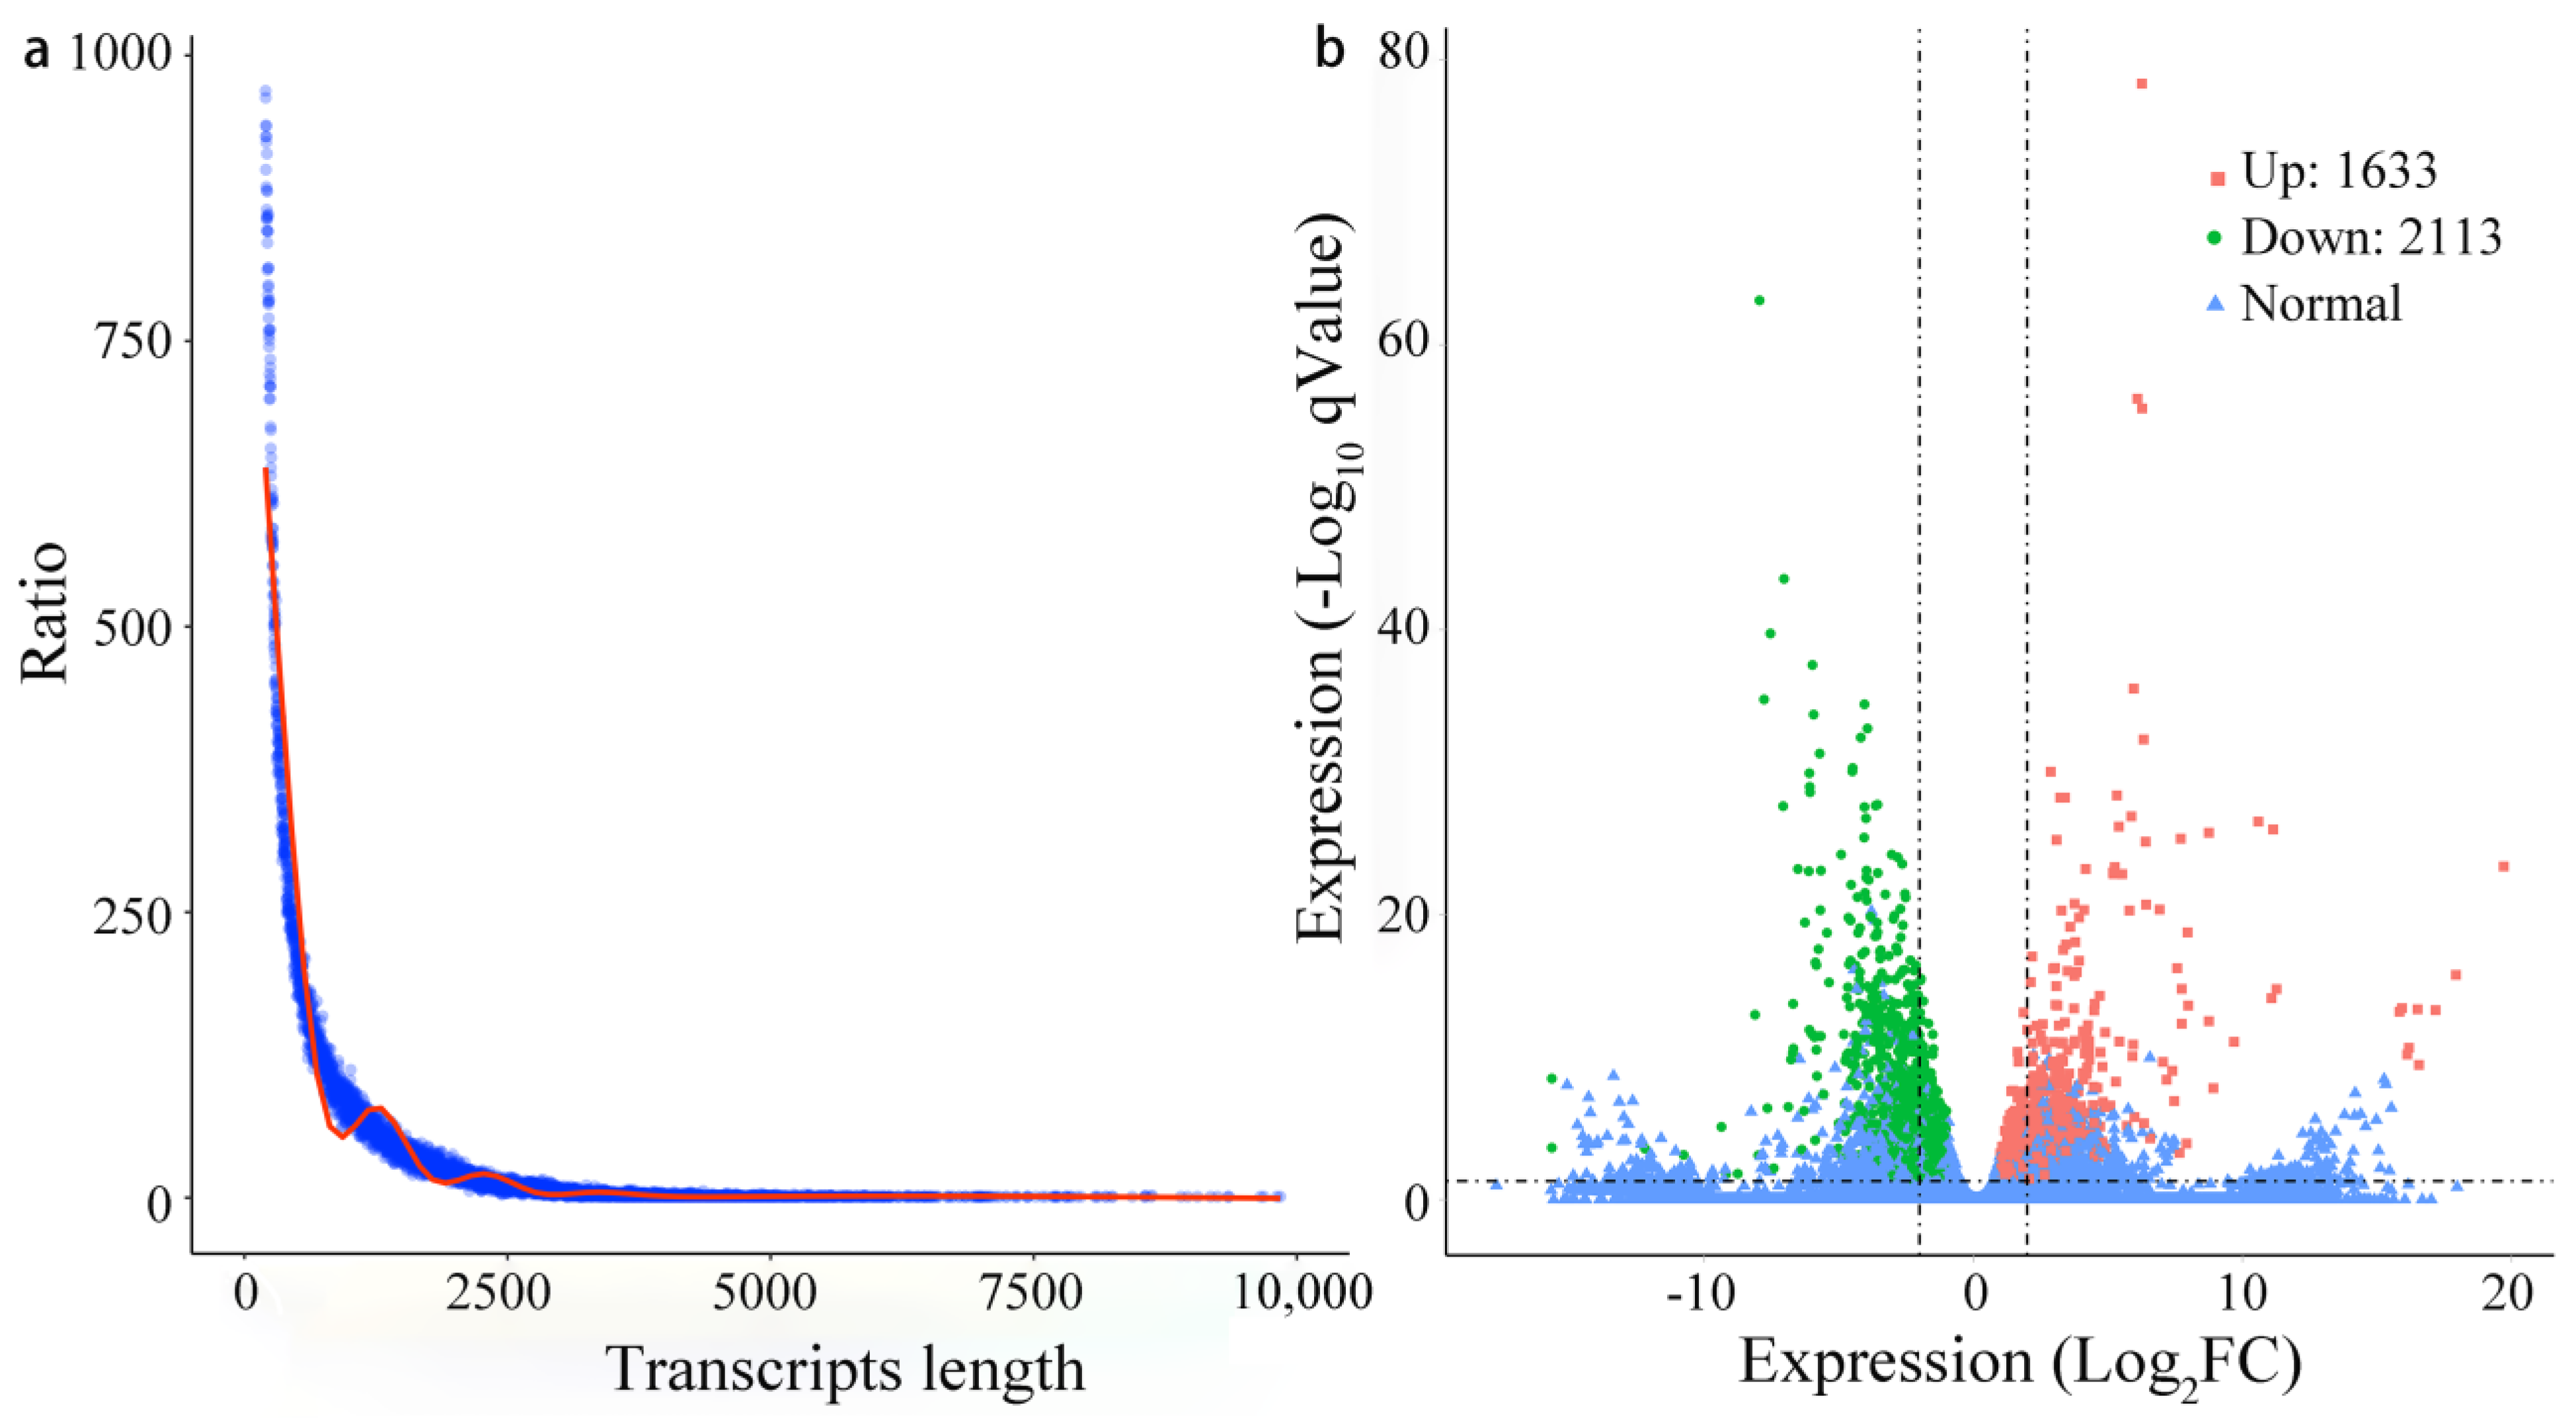
3.1. Illumina Sequencing, Mapping, and Annotation

To deeply understand the compound leaf development of alfalfa at the transcriptome level, after filtering out low-quality reads, approximately 0.245 billion clean reads were generated. The GC content of clean data ranged from 43.84% to 45.09%, and the Q30 ranged from 92.70% to 97.19%, with an average of 93.90% from six RNA samples (Table 1). Overall, the average total mapped, multi mapped and uniquely mapped clean read ratios were 91.89%, 58.12%, and 33.77%, respectively (Table 1). In total, 164,632 genes with 251,850 transcripts were detected with a maximum of 13,074 bp, and the mean length was 757.78 bp with an N50 of 1135 kb (Figure 1a). The functional annotation of all genes aligned with six commonly used public databases, which revealed that the number of genes ranged from 88,116 (53.52%, KEGG) to 163,176 (99.12%, NR), and 44,239 (27%) genes were annotated in all six databases (Table S2).

3.2. Functional Annotation and Transcription Factor Identification

Among 3746 DEGs, 1633 DEGs were upregulated and 2113 DEGs were downregulated between multifoliate and trifoliate alfalfa (Figure 1b). A GO classification summarized all DEGs into three main categories including 64 functional groups (Figure S1). In the biological process (BP) category, “rhythmic process” (105) and “response to stimulus” (1130) were highly represented groups. Within the cellular component (CC) category, the “extracellular region” (321) was the most abundant group, followed by “nucleoid” (8). For the molecular function (MF) category, “catalytic activity” (1772), “nutrient reservoir activity” (34), and “transporter activity” (244) were the top 3 highly represented groups. All genes were further assigned to the KEGG and KOG databases. A total of 495 genes were assigned to 184 KEGG pathways, and the top 30 significant enrichment pathways are displayed in Figure 2a. “Fructose and mannose metabolism” (26, 5.25%) was the most significantly enriched pathway, followed by “Cysteine and methionine metabolism” (28, 5.66%), “Biosynthesis of amino acids” (36, 7.27%), and “Ubiquinone and another terpenoid-quinone biosynthesis” (12, 2.42%). Furthermore, 2028 genes were annotated in 23 individual KOG functional classes, with “Amino acid transport and metabolism” (162, 7.99%) being the most significant enrichment term, followed by “Lipid transport and metabolism” (149, 7.35%), “Carbohydrate transport and metabolism” (179, 8.83%), and “Inorganic ion transport and metabolism” (103, 5.08%) (Figure 2b).
TFs are master regulators of gene expression by binding to their promoter regions. A total of 227 DEGs were identified as TFs and classified into 29 gene families (Figure S2). Among the recognized TFs, bHLH has the most members at 19, followed by the ERF (ethylene response factor: 17) (17), NAC (NAM, ATAF, and CUC: 15), MYB_related (V-myb myeloblastosis viral oncogene homologue: 14), and GATA (14) families. Compared with upregulated TFs, most of them were downregulated, such as ERF, DBB (double B-box), and Dof (DNA binding with one finger), which were all downregulated, and NAC and SPL, which had only one and two members, respectively, were upregulated. Among the various TF members, SPL genes are post-transcriptionally regulated by miR156 and play roles in plant morphology and development. This study found that the expression of SPLs was significantly suppressed in multifoliate alfalfa. Thus, the genome-wide characterization of the SPL genes in alfalfa was further analyzed.

3.3. Identification of MsSPL Genes in Alfalfa

A total of 30 SPL putative genes were identified in alfalfa after removing redundant sequences. Furthermore, a uniform nomenclature was assigned to these genes based on the order of their chromosomal locations (Table 2). Among the 16 SPL genes in Arabidopsis, AtSPL15 and AtSPL16 no orthologues in alfalfa; AtSPL2 has the maximum orthologues (five); AtSPL13 has four paralogues; AtSPL1, AtSPL6, and AtSPL14 have three paralogues; AtSPL2, AtSPL10, AtSPL11, and AtSPL12 have two paralogues; and remaining genes have one (Table 2). Among the 30 MsSPL proteins, the relative molecular weights varied from 16.58 kDa (MsSPL08) to 113.32 kDa (MsSPL08), and from 141 (MsSPL08) to 1025 (MsSPL05 and MsSPL07) amino acids (aa) in length, with 21 members showing a pI > 7 and the remaining showing a pI < 7. The GRAVY index of all MsSPLs below zero indicated that all of the deduced polypeptides were hydrophilic.

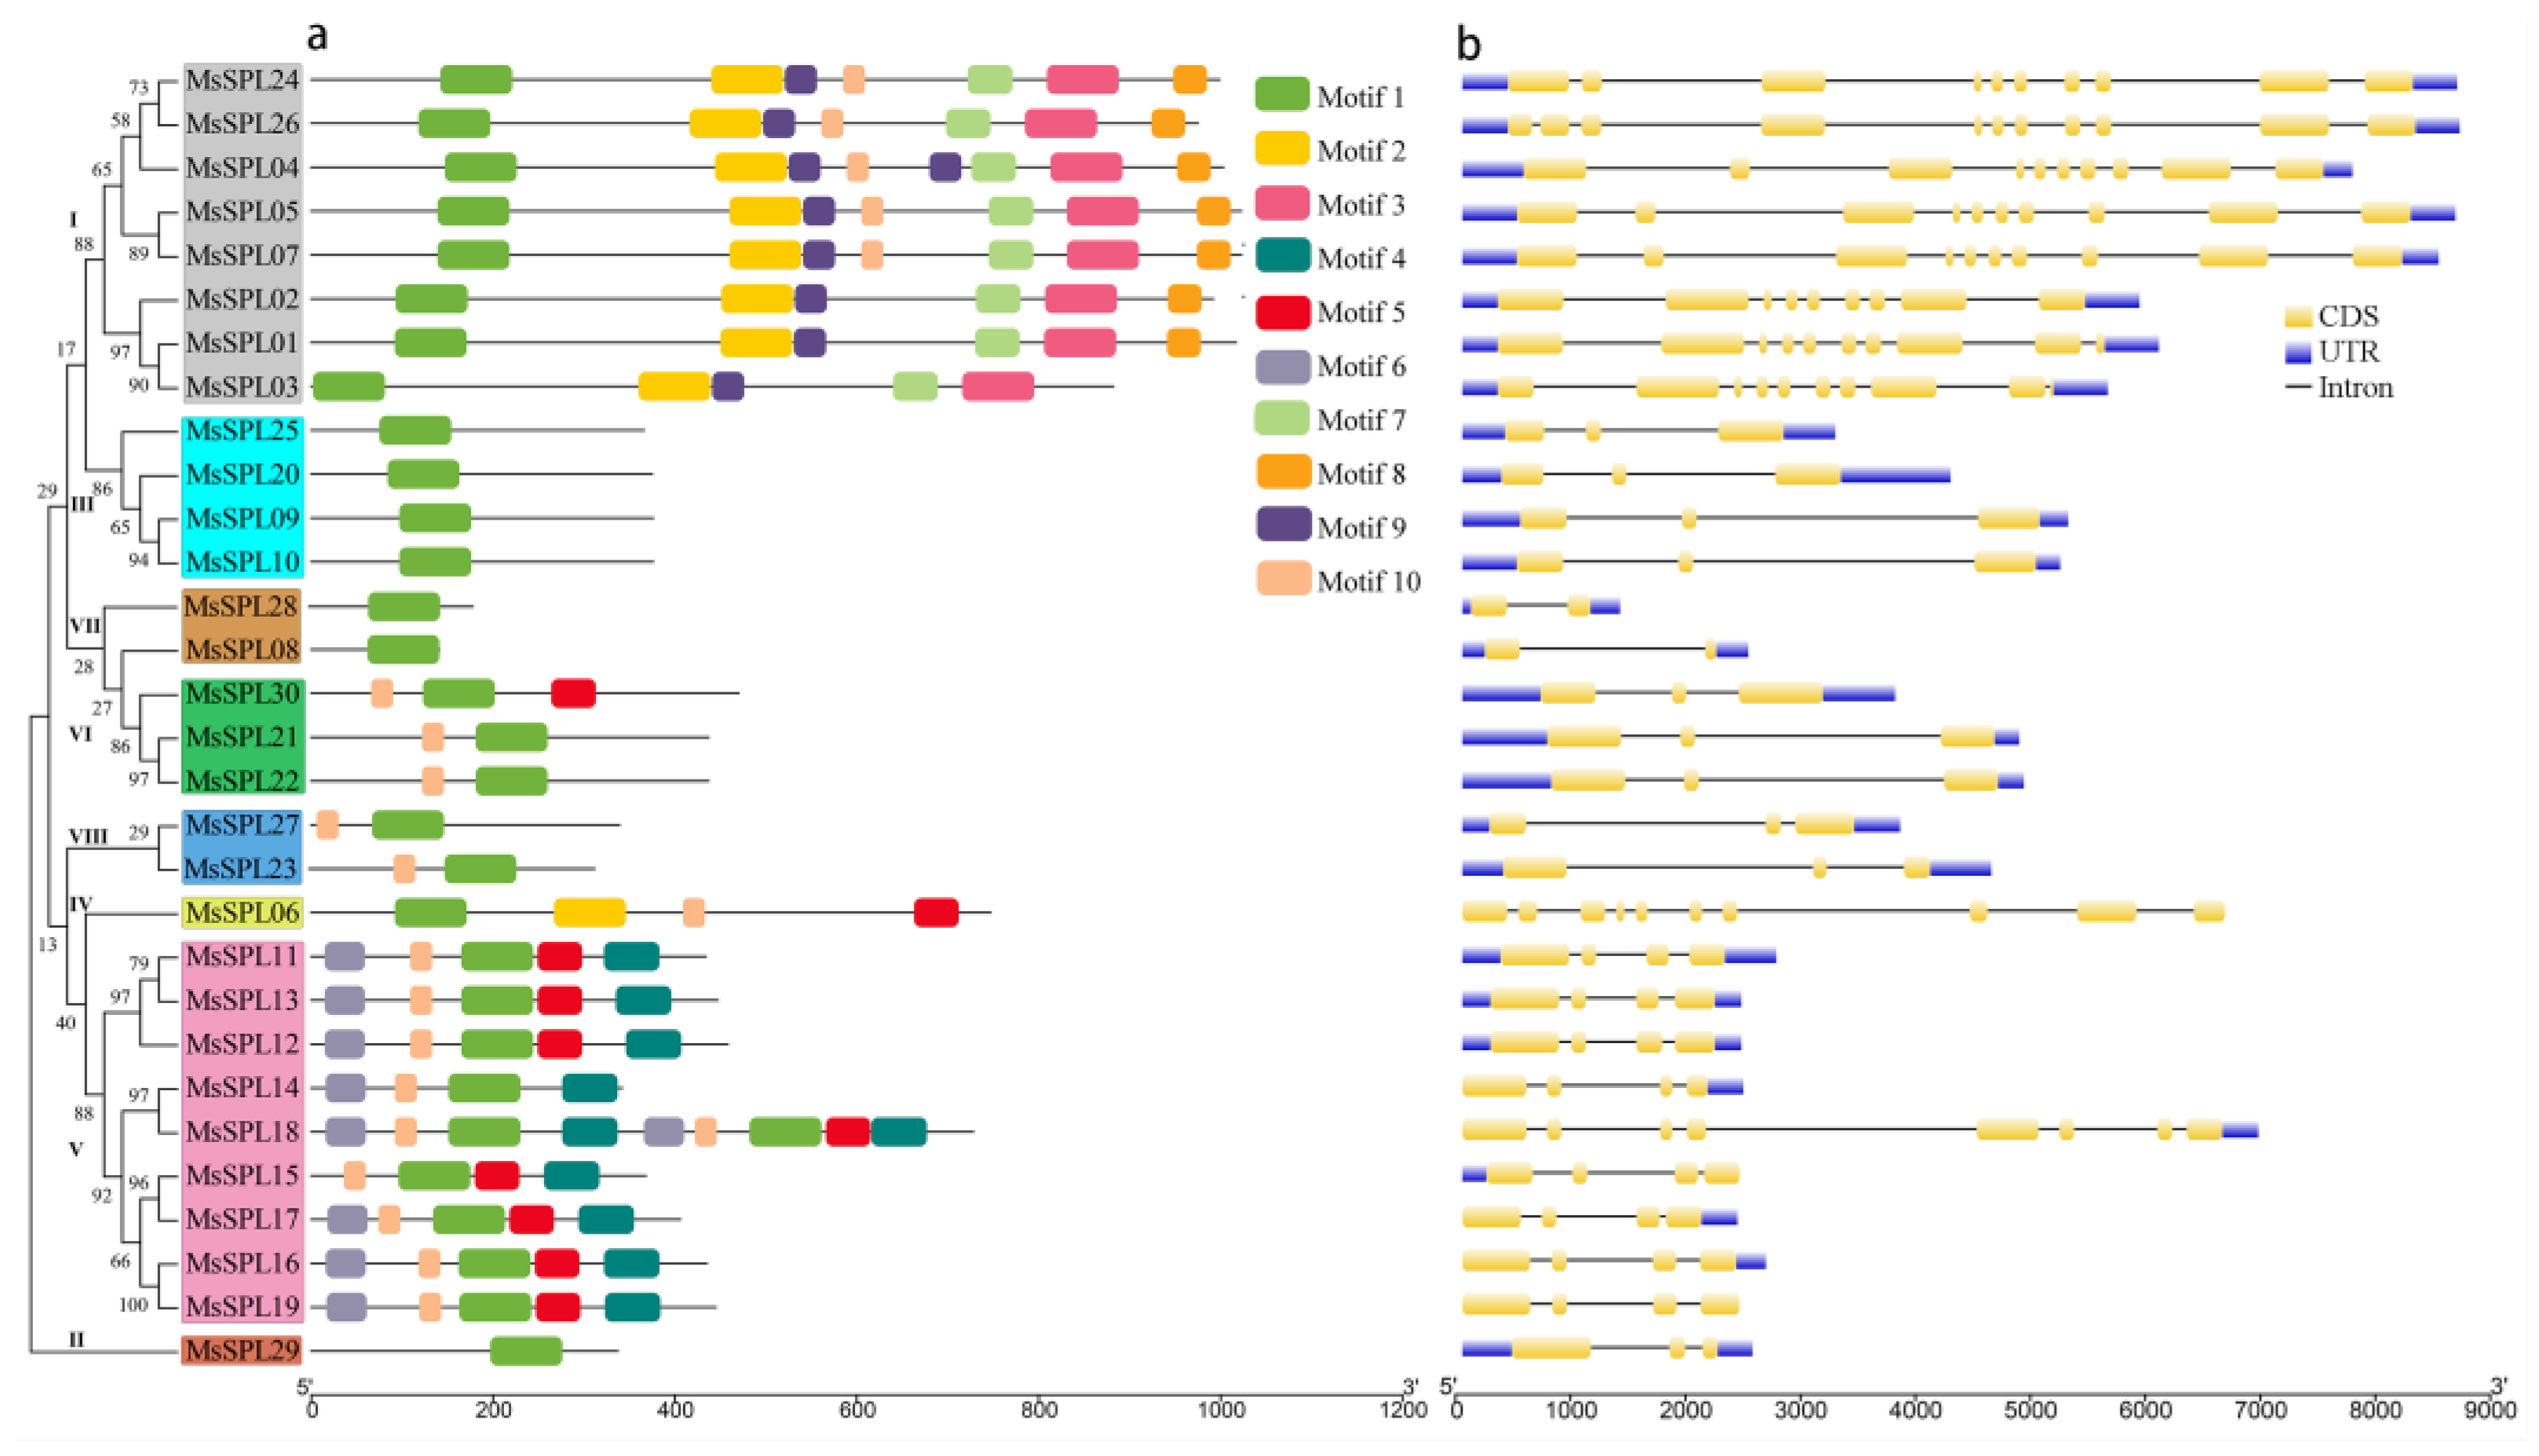
3.4. Phylogenetic, Gene Structure, Conserved Motif, and Domain Analyses

To study the evolutionary correlations of MsSPLs, an unrooted phylogenetic tree was created using the full-length SPL proteins of M. truncatula, Arabidopsis, alfalfa, and rice by the maximum likelihood algorithm in MEGA 7.0, which divided the 30 MsSPL proteins into eight distinct groups (Figure 3). As expected, the SPL proteins from legumes generally exhibited closer relationships, than those from rice (monocot). Except for subfamily VI SPLs from dicots, the remaining subfamilies contained four species. The phylogenetic analysis suggests that the SPL genes have the conserved characteristics of dicots and monocots.
To examine the diversity in the MsSPLs, 10 conserved motifs were predicted (Figure 4a). The number of conserved motifs in 30 MsSPL proteins varied from 1 to 9. Generally, the MsSPL proteins that shared similar motif compositions tended to cluster together. All MsSPLs contained motif 1, which represented two Zn-finger-like structures, and NLS. In addition, some groups were found to share specific motifs. For instance, motifs 3, 7, 8, and 9 are found exclusively in Group I, and groups II, III, and VII only contain only motif 1.
Gene structural features are known to play a crucial role in the evolution of gene families. We analyzed the intron/exon distribution, and the results showed that the number of introns in the MsSPL genes ranged from one to ten (Figure 4b). Additionally, we found that nearly 66.7% of the MsSPL genes had fewer than four introns. Compared with other groups, Group I contained more introns, which ranged from eight to ten.

3.5. Multiple Sequence Alignment and Prediction of the miR156 Target Site of MsSPLs

The detailed domain structures of all MsSPLs and five previously reported protein sequences were determined. As a result, the specific SBP domain is shared by the MsSPL members (Figure S3a). The MsSPL genes shared 76 highly conserved amino acid residues, including two Zn finger-like structures and one NLS. Compared with C3H, C2HC was more conserved in all MsSPLs.
The previous study has isolated a miR156 precursor from alfalfa by PCR (MsmiR156d: CACGAGTGAGAGAAGACAGT). BLAST search results showed that the isolated sequence was similar to miR156d precursor in M. truncatula [16]. Then we compared the sequence of miRNA156 among different species, the result solidly confirms that plant miRNA156 are evolutionarily conserved Thus, ten mtr-miR156 (mtr-miR156a-j) genes were obtained from the M. truncatula genome to predicate miR156 target site of MsSPLs. Furthermore, a multiple sequence alignment was performed, which produced five types of mature miRNA sequences as shown in Figure S3b. A comparison of the miR156 mature sequences to the MsSPL transcript sequences indicated that 16 out of 30 MsSPL are complementary to the miR156 mature sequences, with a maximum of one to three mismatches which suggests that miR156 may specifically target these genes in alfalfa. Among 16 MsSPL genes specifically targeted by miR156, 15 MsSPL genes contained target sites in their coding regions, and MsSPL08 contained a miR156 target site in the 3′-UTR. MsSPL18 has two miR156 target sites. The miR156-targeted SPL genes from 11 target OsSPL and 10 target AtSPL genes were distributed into six out of eight groups (I-VIII), and most of them clustered into Group V.

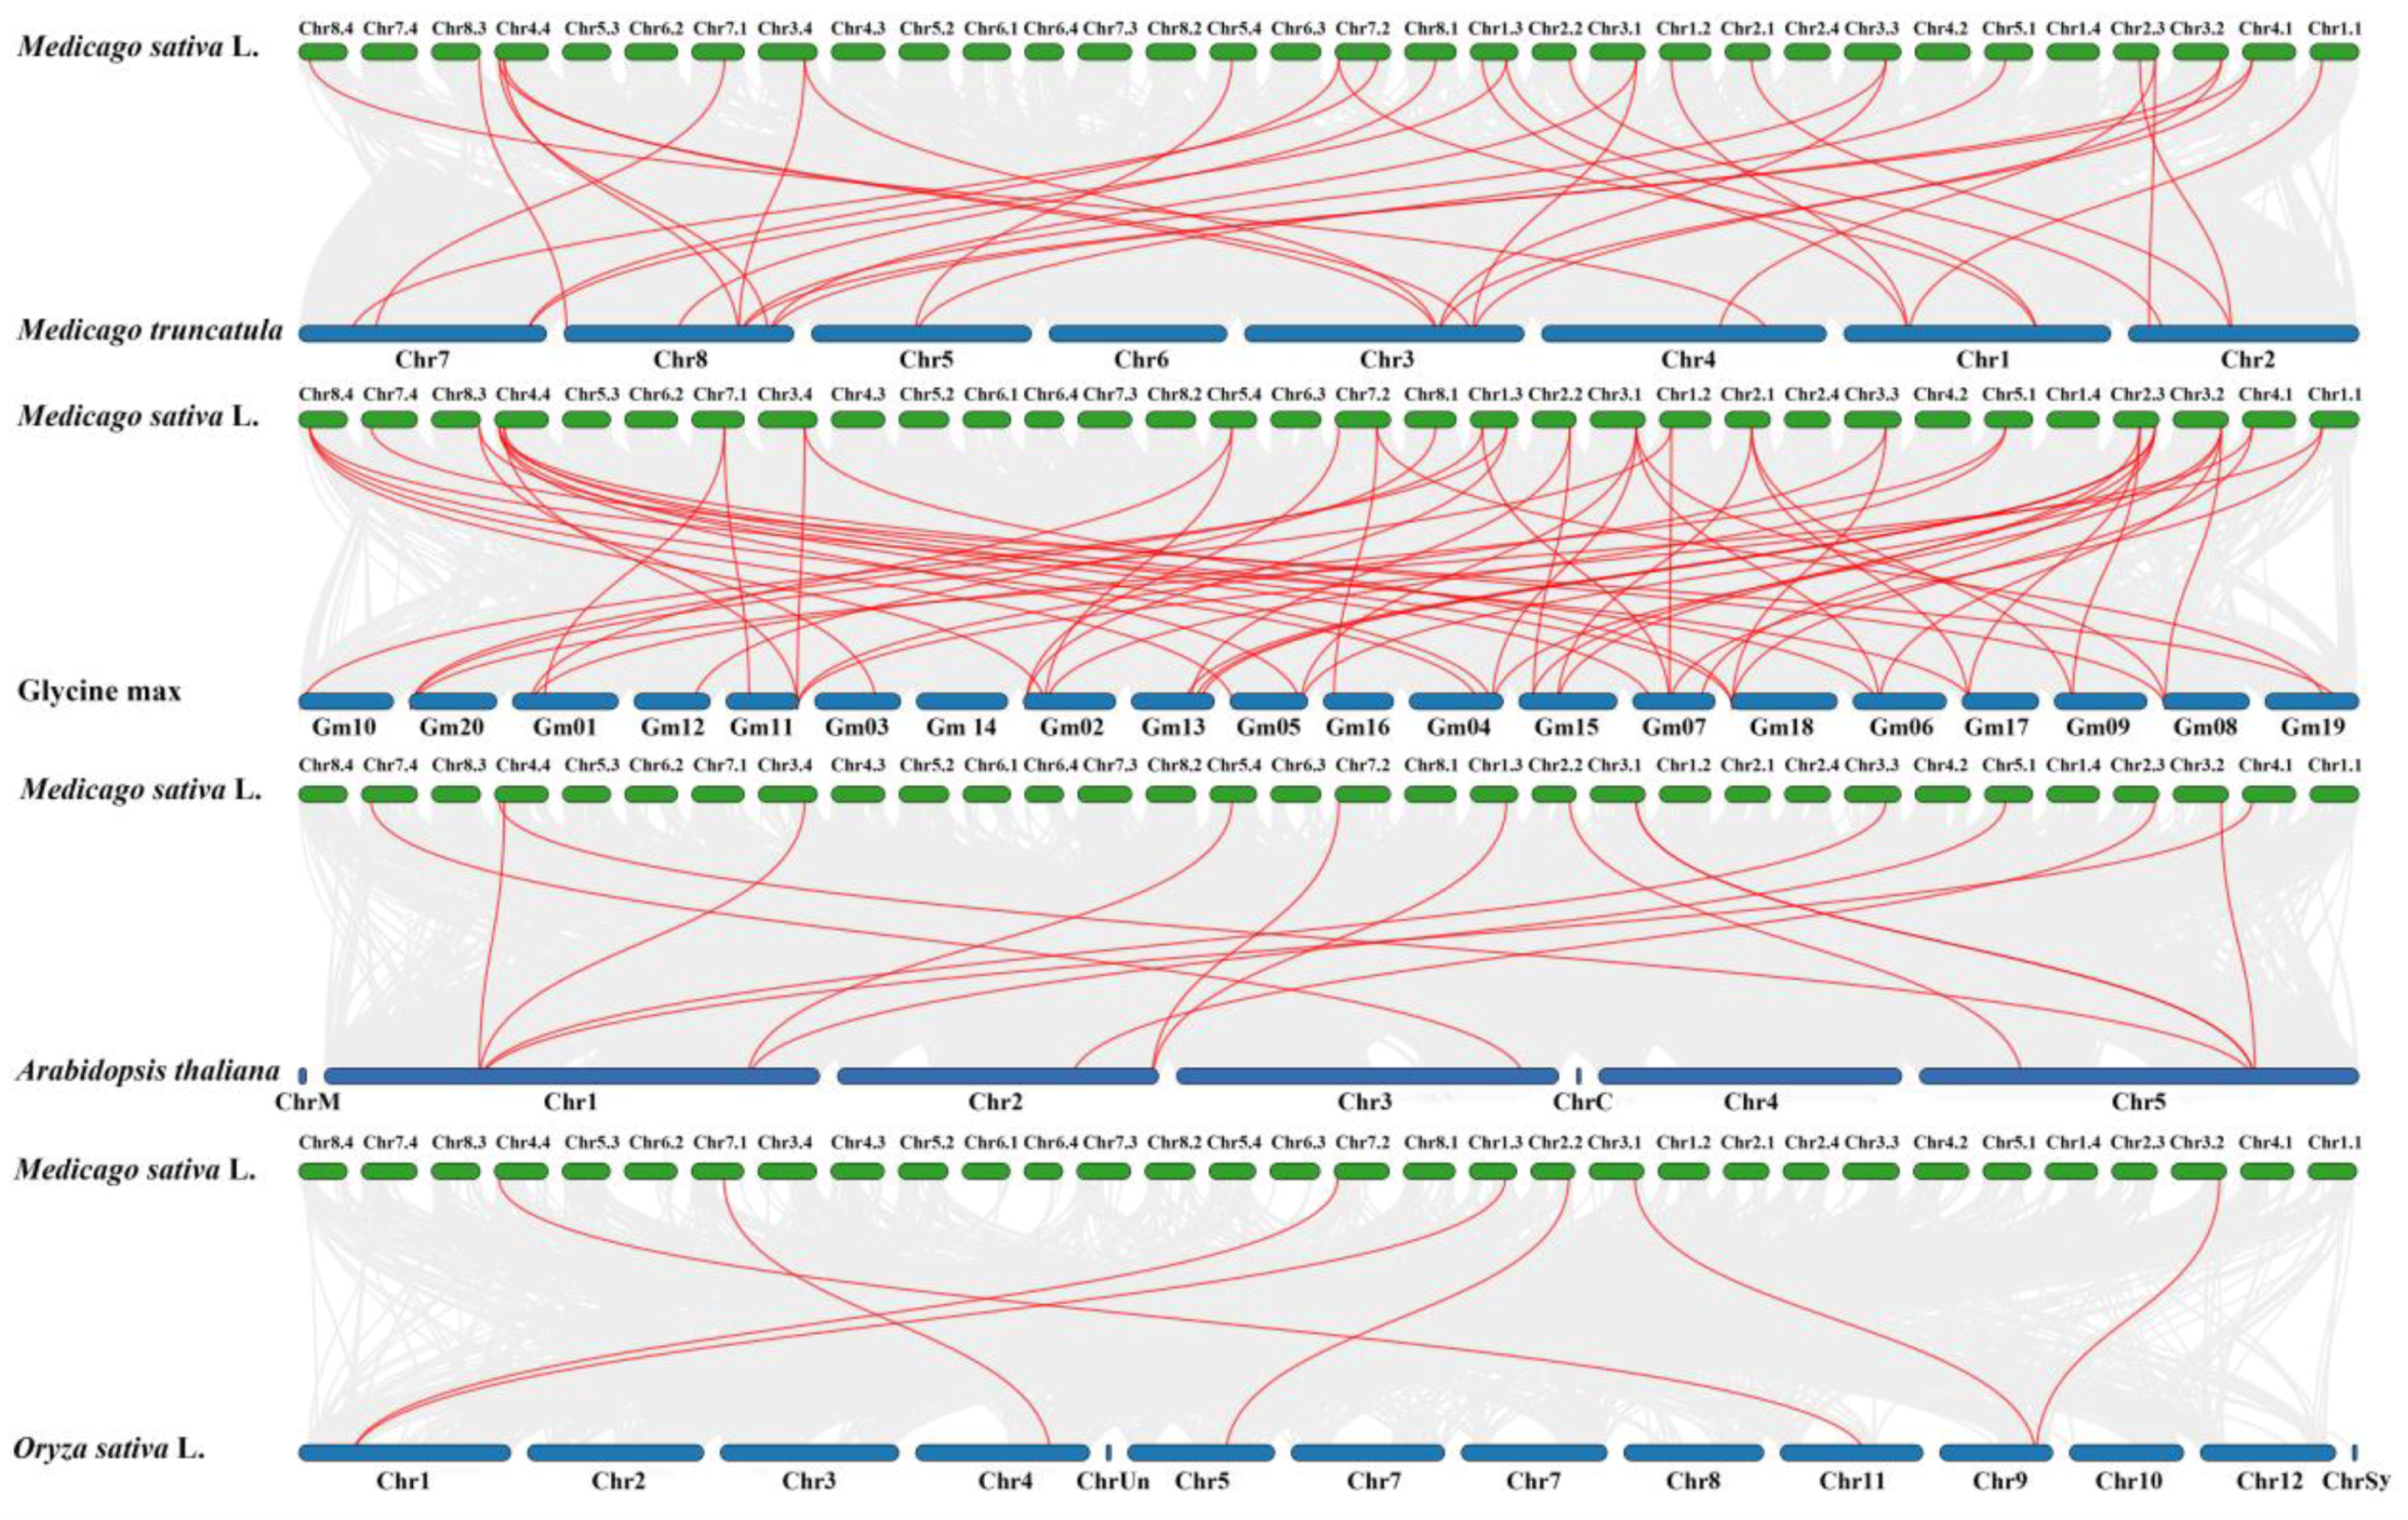
3.6. Chromosomal Distributions, Synteny, and Evolutionary Analyses of the MsSPL

The physical positions of 30 MsSPL genes were mapped onto 22 allelic chromosomes, which represented an unbalanced distribution (Figure 5). Chromosome 4 contained the largest number of MsSPL genes (7; ~23.33%), whereas no gene was distributed on chromosome 6. Recently, a study showed that a round of whole-genome duplication (WGD) events were estimated to occur approximately 58 Myr ago in the alfalfa genome [6]. Among the 30 MsSPL genes, one gene pair of MsSPL12/MsSPL13 displayed tandem duplications and 14 segmentally duplicated pairs located on duplicated segments on 5 chromosomes (Figure 5).
To explore the evolutionary clues for the MsSPL genes, three dicot plants (M. truncatula, A. thaliana, and G. max) and one monocot plant (O.sativa) were used to construct four comparative syntenic graphs (Figure 6). In total, 24 MsSPL gene members showed syntenic relationships with those in G. max (24), M. truncatula (23), A. thaliana (15), and O.sativa (7). The numbers of MsSPL orthologous genes in G. max, M. truncatula, A. thaliana, and O.sativa were 33, 17, 8, and 5, respectively. Compared to monocots, MsSPL consisted of more syntenic gene pairs with dicots. Furthermore, as shown in the interactive Venn diagram of MsSPL throughout the different species, MsSPL04, MsSPL06, MsSPL09, MsSPL10, MsSPL20, and MsSPL24 had syntenic SPL gene pairs in all four species (Figure S4). These results indicate that the MsSPL genes were highly conserved and that the MsSPL genes were closer to the legume than to other plants. Additionally, some orthologous gene pairs were specifically mapped between alfalfa and legumes plants, including MsSPL01, MsSPL02, MsSPL03, MsSPL05, MsSPL07, MsSPL25, MsSPL28, MsSPL29, and MsSPL30, which may show that these orthologous pairs formed after the divergence of legume plants. These results indicated that MsSPL genes were closer to the legume than to others.
Furthermore, the Ka, Ks, Ka/Ks, and duplication event data of the orthologous gene pairs were estimated through Nei and Gojobori’s method (Table S3). All MsSPL orthologous gene pairs had Ka/Ks < 0.8, which suggests that the MsSPL genes might have experienced strong purifying selective pressure during evolution. The latest duplication event occurred between MsSPL12/13, which might occur ~0.11 million years ago, and all duplication events occurred after WGD events.

3.7. Cis-element Analysis of the Promoter

Previous studies have shown that SPL is involved in plant growth processes and abiotic stress responses. To further forecast the potential regulatory mechanisms of MsSPL, five hormone-related, four abiotic stress-related, and four tissue development-related elements were discovered and are displayed in Figure 7. The numbers in MsSPL04 and MsSPL30 are the greatest, and have the most cis-elements (16). MsSPL07 contains only two abscisic acid responsiveness elements. Notably, all of the MsSPL genes contained at least one plant hormone-responsive element, including 27 (90%), 18 (60%), 16 (53%), 16 (53%) and 14 (47%) MsSPLs that had one or more abscisic acid responsive, auxin responsive, salicylic acid responsive and gibberellin responsive elements. The hormone-related elements were broadly distributed, which indicates that these genes may be regulated by phytohormones. Additionally, abiotic stress-related elements were enriched in the promoter region, and 47% and 33% of the members contained at least one MYB binding site involved in drought-induced ability (MBS) and low-temperature response (LTR) elements, which speculates that the expressions of these MsSPLs largely participates in signal perception and abiotic stress responses. Furthermore, some plant growth and development-related elements, including the differentiation of palisade mesophyll cells, seed-specific regulation, meristem expression, and endosperm expression elements, were also identified. The expression of MsSPLs with different cis-elements illustrates that MsSPL may play vital roles in regulating alfalfa growth and stress response.

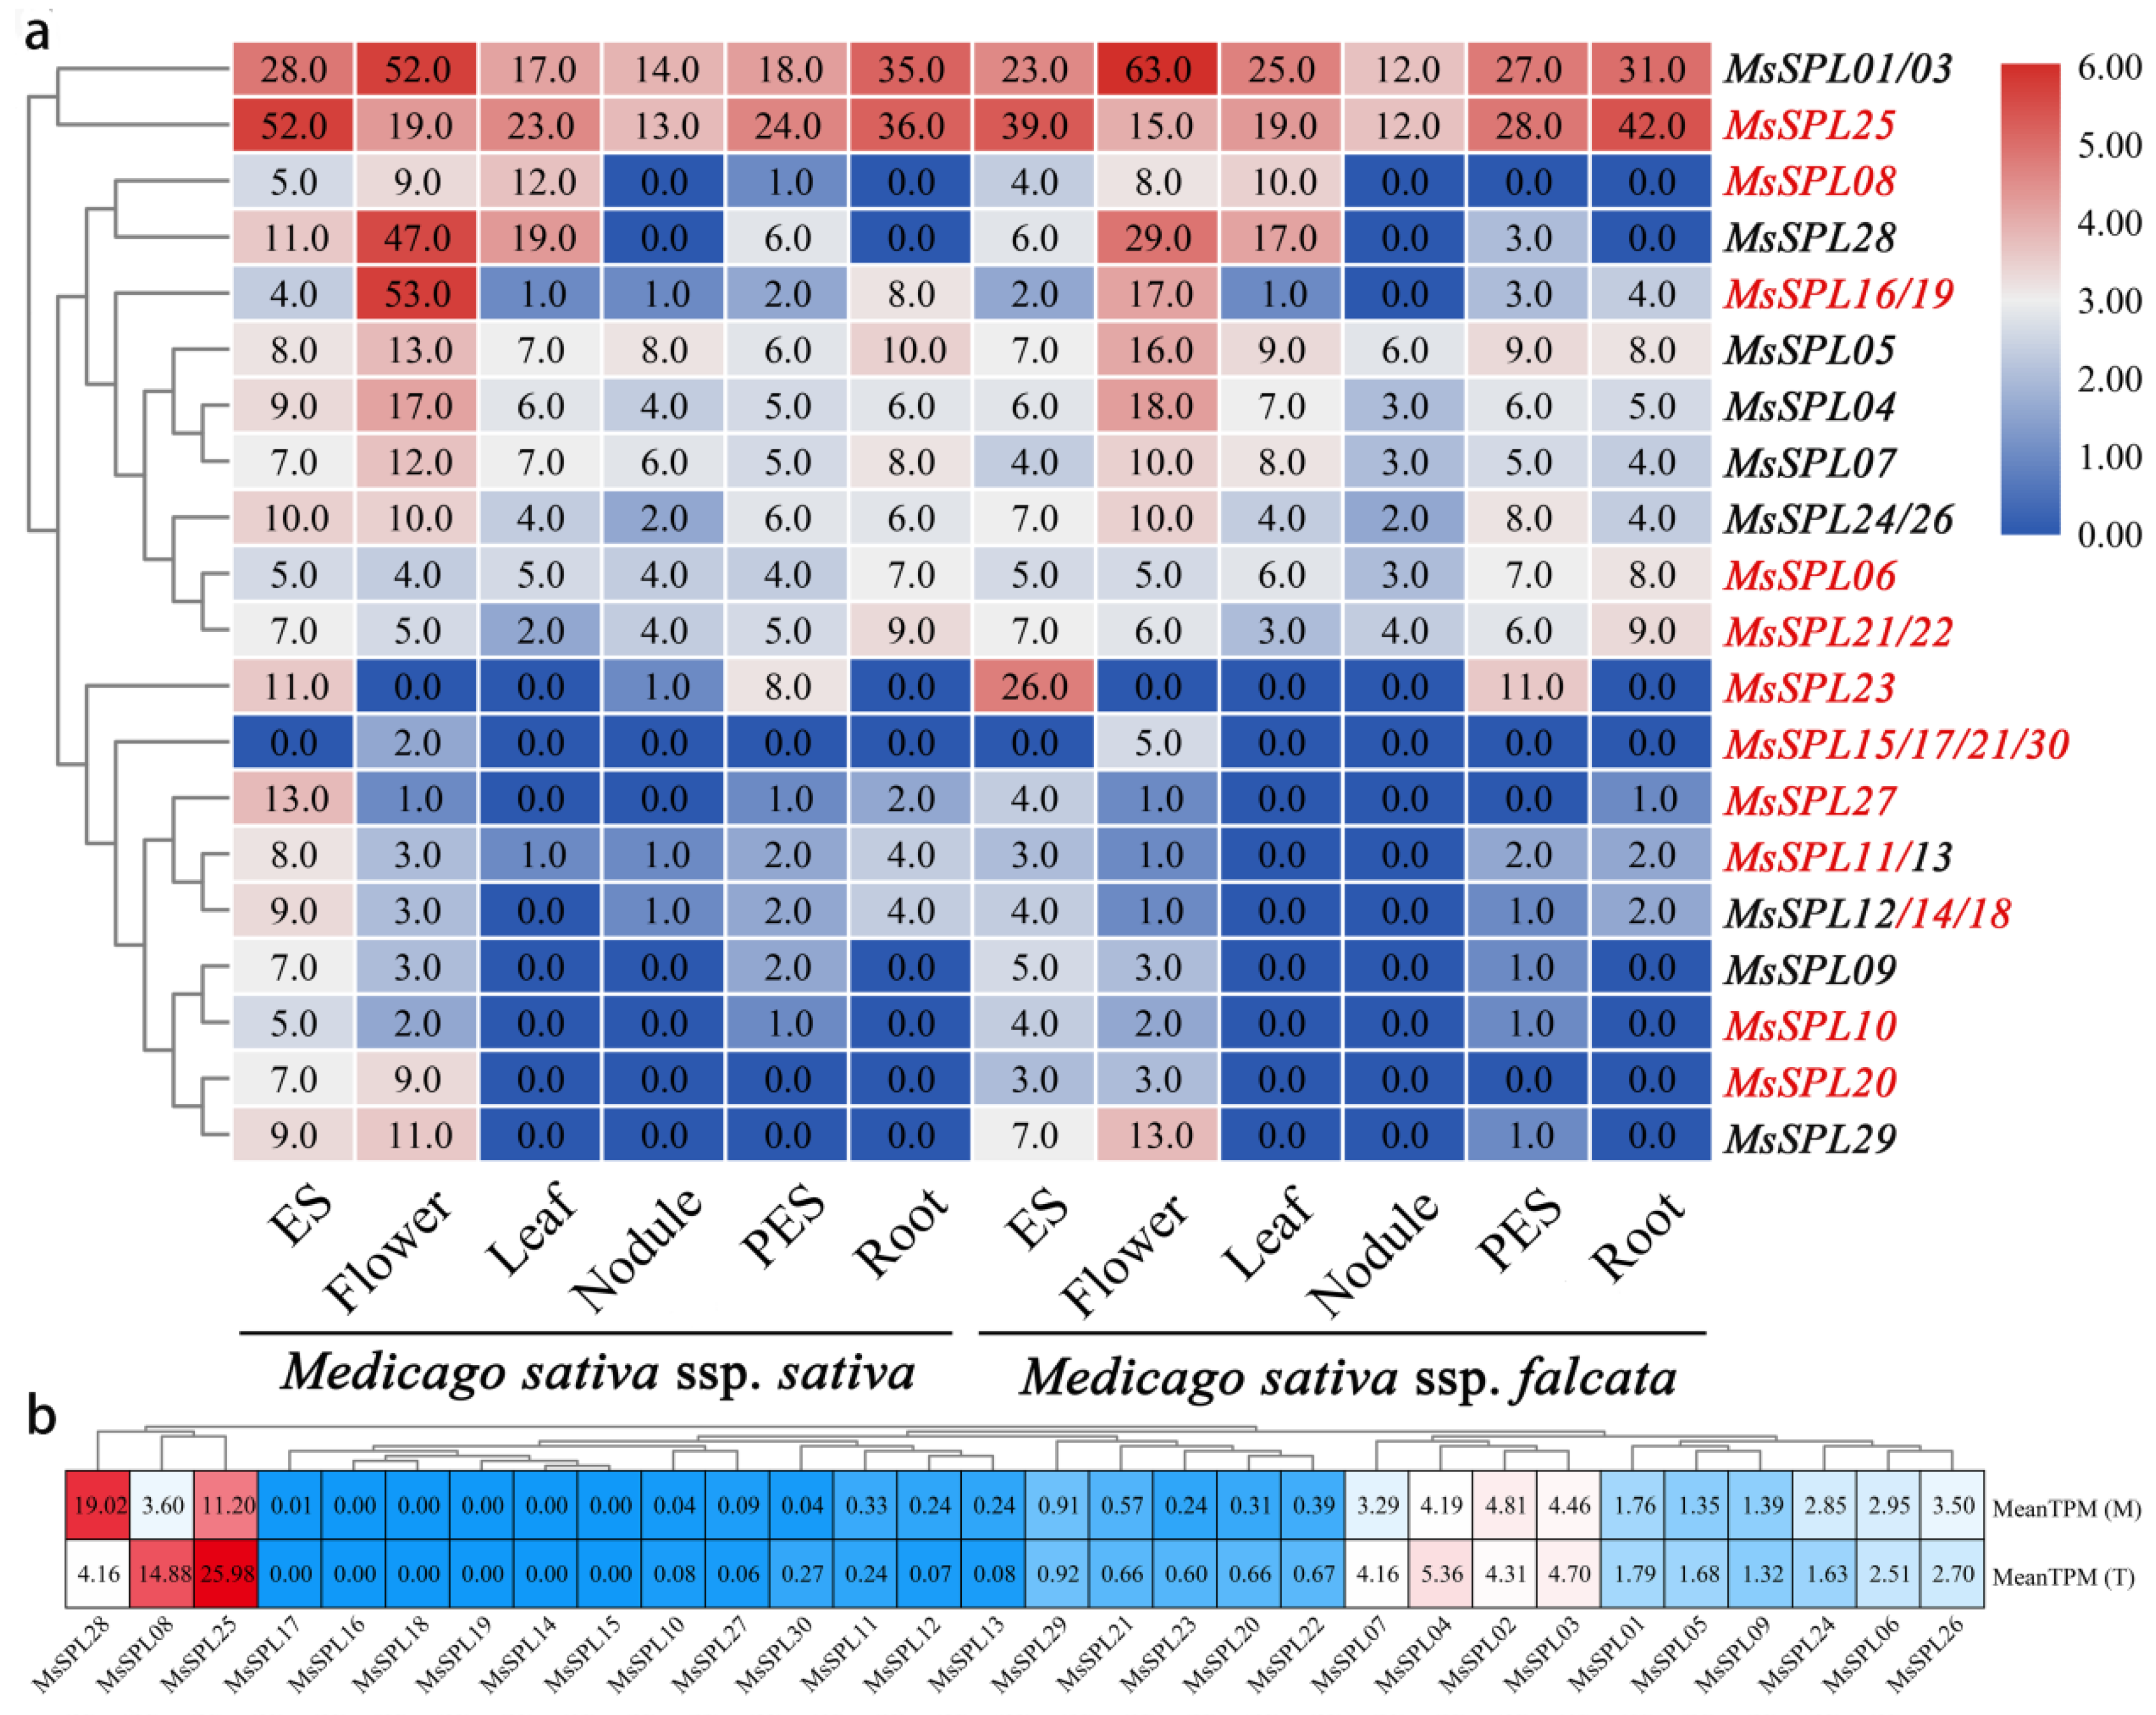
3.8. Transcriptome and qRT-PCR Analysis Revealed Diverse Expression Patterns of MsSPL

Expression profiles were mined from a comprehensive profiling study of different alfalfa tissues [30]. As shown in Figure 8a, all MsSPLs were expressed in at least one tissue, and nearly half of them exhibited tissue specificity. According to expression profiles of MsSPL members, which were divided into two groups. The first group were widely expressed across six tissues, with expression levels ranging from 0 to 63, except for MsSPL08, MsSPL16, and MsSPL19 were not detected in roots and nodules. The second group showed relatively low expression levels in most tissues, which were highly induced in a specific tissue; for example, most MsSPLs were expressed in flowers and elongating stem internodes, but not detected in leaf, nodule and root tissues, including MsSPL09, MsSPL10, MsSPL20 and MsSPL29. To explore the functions of MsSPLs in the regulation of leaflet development, a compare transcriptome between multifoliate and trifoliate alfalfa were conducted as shown in Figure 8b. Most of MsSPLs were not, or only lightly induced in multifoliate alfalfa, but the expression levels of MsSPL08 and MsSPL25 were significantly suppressed, and MsSPL28 was significantly induced in multifoliate alfalfa.
To verify the functions of miR156 target MsSPL in response to drought (Figure S5a) and salt (Figure S5b) stresses, 16 MsSPLs were used to examine the expression profiles under PEG and salt treatments by using qRT-PCR. All miR156 target MsSPLs responded to PEG and salt stresses, but the response intensities and speeds were different. The majority of genes were upregulated on the fourth day of the PEG and NaCl treatments. Under drought conditions, all genes were upregulated, except for two (MsSPL16 and MsSPL19) that were downregulated on the 1st day, and MsSPL23 was downregulated on the 2nd day. After NaCl treatment for one day, three of the MsSPL genes (MsSPL08, MsSPL10, and MsSPL11) were significantly upregulated. After NaCl treatment for two and four days, most of them were greatly upregulated.

3.9. Paralogous of MsSPL08 Isolation and Functional Analysis in M. truncatula

The cDNA sequences of MsSPL08 were compared among M. truncatula SPLs (MtSPL) to identify the paralogous gene. A multiple sequence alignment showed that MsSPL08 has a high identity with the MtSPL4 protein sequence, which shows a 93% similarity and similar gene structure (Figure 9a,b). M. truncatula with a good collinearity with alfalfa, has long been considered as a model species for the studies of legume biology [32]. A significant level of sequence conservation was reported between alfalfa and M. truncatula allowing estimates of gene function between two species. As the sequence conservation between alfalfa and M. truncatula is high, we chose M. truncatula as a model to explore the possible functions of the miR156-targeted MsSPL8 in compound leaf development. The expression profiles of MsSPL08 and MtSPL4 in different tissues showed that MsSPL08 and MtSPL4 play important roles in regulating aboveground tissue development (Figure 9c,d).
To determine the biological funct–ions of MsSPL08 in compound leaf formation in alfalfa, a Tnt1 retrotransposon-tagged MtSPL4 mutant line was obtained. The mutant plants had more than three leaflets, increased lateral branches, a reduced plant height, and a delayed flowering time (Figure 9e), which reveals that MtSPL4 plays important roles in compound leaf development, stem elongation, and branching. Compared with two cotyledons and one true leaf of wild-type seedlings, the mutant had three cotyledons and a trifoliate form of the true leaf (Figure 9f). The mutant had a different type of leaflet, and the number varied from one to seven, with 30.5% of the leaves exhibiting four or five leaflets in adult plants (Figure 9g).

4. Discussion

Alfalfa is referred to as “the queen of forage crops” because of its high biomass, biological nitrogen fixation, choice nutritional profiles, stress-tolerance and reliable sources of protein and minerals for livestock [31,33]. Increasing the leaf/stem ratio is an effective way to improve its rumen digestibility. However, the regulatory mechanism controlling leaflet formation in this species remains limited. After four years of backcross breeding, we obtained a BC2 population with 27.04% multifoliate rate at budding period. The single plant with the highest main branch multifoliate rate was 88%, the pinnate pentafoliate was the most stable leaflet type in BC2 population. To acquire more accurate information on the transcript functions, we compared the transcriptome profiles of the multifoliate (pinnate pentafoliate type) and trifoliate alfalfa genotypes. The enrichment results showed that the DEGs were mainly annotated to major metabolic and biosynthesis processes such as fructose and mannose metabolism, cysteine and methionine metabolism, ubiquinone, and another terpenoid-quinone biosynthesis, and amino acid biosynthesis.
The development of plant leaves is regulated by transcriptional regulators, plant hormones, and the mechanical properties of the tissue [34]. Among them, TFs are master regulators in response to various developmental processes and abiotic stresses in plants. Here, 227 TFs were differentially expressed, and most of them were suppressed. Previous studies have found that manipulating the expression of TF often drastically changes plant phenotypes [35]. Among many types of TF families, SPL is unique to plants [2]. The role of some SPL genes is post-transcriptionally regulated by miR156, as their transcripts carry functional response elements to these highly related miRNAs, which have emerged as essential regulators of various biological processes, such as phase change, leaf development, tillering/branching, stem growth, and response to stresses [36]. The chromosome-level genome assembly was completed, which offers detailed information to comprehensively analyse the SPL genes in this major legume forage. Through genome-wide identification, 30 MsSPL genes were acquired from the alfalfa genome. A phylogenetic investigation showed that the relationship of MsSPL is closer to M. truncatula and Arabidopsis than to rice, which suggests that eudicot SPL genes may diverge from a common ancestor [37,38]. Numerous SPLs have been identified in green plants, and the highest number of 59 SPLs have been recognized in Gossypium hirsutum and Brassica juncea [13], while, only 15 SPLs were identified in Solanum lycopersicon [39]. The number of MsSPLs is greater than that in some species such as Citrus sinensis [15], Cucumis sativus [15], Arabidopsis [16] and O.sativa [19], and close to Populus trichocarpa [27], Gossypium raimondii [29], and M. truncatula [22], which indicates that more SPLs contained in these species were attributed to WGD events. Similarly, a WGD event played a significant role in the alfalfa genome ~58 Mya ago, which allowed SPL gene expansion in alfalfa [6]. Motif composition and gene structure analyses indicated that MsSPL gene clusters in the same group shared similar motifs and exon/intron organization. Furthermore, a high divergence of motif was noticed among MsSPL proteins. For example, motifs 3 and 9 were unique to Group 1, whereas motifs 4 and 6 were only for Group 8 as compared to other SPLs, which suggests that the function of MsSPL genes may show diversity because of diversification [10,37,38]. In total, 16 identified MsSPLs identified have miR156 target sites, and the results showed that most of them are located in the coding region, except for MsSPL08 in the 3′-UTR. Similarly, these results were also found in Arabidopsis, Hordeum vulgare, and rice [36,40], which shows the conservation of miR156-mediated posttranscriptional regulation in different plant species [21,41,42].
In nature, leaves are an important agronomic trait, where photosynthesis converts carbon dioxide and water into carbohydrates; therefore, a high leaf/stem ratio breeding variety will increase its nutrient accumulation [43]. Leaf patterns are highly variable among different species, and even between different varieties. Among different leaf patterns and shapes, compound leaves are spectacularly diverse [44]. We analyzed the molecular mechanism by which these factors modulate leaf development to yield a substantial diversity of leaf forms in multifoliate (pinnate pentafoliate type). We found that miR156-targeted MsSPL08 was highly expressed in leaves, stems, and flowers, but was suppressed in nodules and roots. While, compared with trifoliate alfalfa, the expression of MsSPL08 was downregulate in multifoliate alfalfa. To further verify whether MsSPL08 functions in leaflet differentiation, we choose M. truncatula as a model to carry out further research. The compound leaf composition ranged from one to seven simple leaflets, and the plant height was decreased, but the stem number was increased in M. truncatula mutant plants. Importantly, the mutant exhibits multifoliate traits in the seedling stage, such as three cotyledons, the true leaf is composed of three leaflets, and the serrations of the leaf edge disappear. Compared with multifoliate alfalfa, MtSPL4 mutant plants displayed a more variable phenotype, we speculate that alfalfa is autotetraploid (2n = 4X = 32) plant, the genomes is more complex and high similarity of their subgenomes. Additionally, compound leaf development is also flexibly tuned among different species in a spatiotemporal manner. The precise regulation network of how MsSPL08 involved in leaf patterning is also an open question.
miR156 has agronomic relevance for plant growth and stress tolerance among a wide variety of plant miRNAs. Previously studies have shown that miR156-targeted SPL play important role in improving biomass production and abiotic stress tolerance in legumes [36,45,46]. Similarly, we find that MsSPL08 was also significantly induced by drought and salt stress. These observations show that the miR156/SPL module may contribute to genetic variability through the regulation of plant development and abiotic stress responses. The phenotypic changes and stress response were similar to those of the miR156-overexpressing alfalfa genotypes, including delayed flowering, reduced stem length, and increased shoot branching, and played a positive role in abiotic stress tolerance [14,47,48,49]. This observation suggests that the miR156/SPL module is integrated with the plant developmental and stress response. So far, still not clear how does miR156 integrate biological stress and regulate growth. The detailed relationship between abiotic stress response and development needs further study.

5. Conclusions

In this study, RNA-Seq technology was utilized to generate a comprehensive transcriptome between multifoliate and trifoliate alfalfa. Then, the RNA-Seq results were used to recognize the sequences associated with the important regulating pant trait gene SPL. Overall, 30 MsSPL were identified in alfalfa. Phylogenetic, gene structure and evolutionary analyses suggest that the functions of MsSPL genes may show diversity after the diversification of dicots and monocots. Based on different tissue expression profiles, MsSPLs can be divided into widely expressed and tissue-specific expressed groups. In this case, 16 miR156-targeted MsSPLs strongly implied diversification and positive roles under drought and salt conditions. Tthe transcripts of MsSPL08 were significantly suppressed in multifoliate alfalfa. Furthermore, we used M. truncatula as a model to study the possible roles of miR156-targeted MsSPL08 in regulating alfalfa compound leaf development. The phenotypes of mutant plants revealed that miR156/MsSPL08 not only was involved in the development of multifoliate but also contributed to branches.

Supplementary Materials

The following are available online at https://0-www-mdpi-com.brum.beds.ac.uk/article/10.3390/genes13020331/s1, Figure S1: GO enrichment analysis of the DEGs. Figure S2: The expression pattern distribution of DEGs identified as TFs between multifoliate and trifoliate alfalfa. Figure S3: Multiple alignments of the MsSPL protein sequences. (a) The highly conserved SBP-domain, including two Zn-finger-like structures (C2HC and C3H) and an NLS. (a) The alignment of miR156 sequences with the target sites in MsSPL genes. Figure S4: The venn diagram of syntenic SPL genes throughout diverse species. Figure S5: The relative expression ratios of 16 miR156 target MsSPL genes under drought (a) and salt conditions (b). * p < 0.05 and ** p < 0.01. Table S1: The qRT-PCR primers used in this study. Table S2: BLAST analysis of the non-redundant genes against public databases. Table S3: The Ka, Ks and dates of the duplication evens in the paralogous MsSPL gene pairs.

Author Contributions

X.M.: Methodology, Software, Validation, Formal analysis, Investigation, Data curation, Visualization, Writing—original draft. K.L.: Conceptualization, Supervision, Investigation. W.L.: Conceptualization, Formal analysis. K.Z.: Methodology, Resources. J.L.: Methodology, Resources. Z.W.: Conceptualization, Funding acquisition, Project administration. All authors have read and agreed to the published version of the manuscript.

Funding

This research was supported by the Shanghai Science and Technology Promoting Agriculture Project (Hu Nongke Tweet (2020) No. 1-2), the Postdoctoral Research Funding Program of Jiangsu Province (2021K197B), the National 863 Program (2008AA10Z149), the National Natural Science Foundation of China (30972136), and the Natural Science Foundation of Gansu (20JR10RA622).

Informed Consent Statement

Not applicable.

Data Availability Statement

Not applicable.

Conflicts of Interest

The authors declare no conflict of interest.

References

  1. Bourgaud, F.; Gravot, A.; Milesi, S.; Gontier, E. Production of plant secondary metabolites: A historical perspective. Plant Sci. 2001, 161, 839–851. [Google Scholar] [CrossRef]
  2. Wang, J.-W. The Multifaceted Roles of miR156-targeted SPL Transcription Factors in Plant Developmental Transitions. In Plant Transcription Factors; Elsevier: Amsterdam, The Netherlands, 2016; pp. 281–293. [Google Scholar]
  3. Warman, L.; Moles, A.; Edwards, W. Not so simple after all: Searching for ecological advantages of compound leaves. Oikos 2010, 120, 813–821. [Google Scholar] [CrossRef]
  4. Mielmann, A. The utilisation of lucerne (Medicago sativa): A review. Br. Food J. 2013, 115, 590–600. [Google Scholar] [CrossRef]
  5. Hojilla-Evangelista, M.P.; Selling, G.W.; Hatfield, R.; Digman, M. Extraction, composition, and functional properties of dried alfalfa (Medicago sativa L.) leaf protein. J. Sci. Food Agric. 2017, 97, 882–888. [Google Scholar] [CrossRef] [PubMed]
  6. Chen, H.; Zeng, Y.; Yang, Y.; Huang, L.; Tang, B.; Zhang, H.; Hao, F.; Liu, W.; Li, Y.; Liu, Y.; et al. Allele-aware chromosome-level genome assembly and efficient transgene-free genome editing for the autotetraploid cultivated alfalfa. Nat. Commun. 2020, 11, 2494. [Google Scholar] [CrossRef]
  7. He, L.; Liu, Y.; He, H.; Liu, Y.; Qi, J.; Zhang, X.; Li, Y.; Mao, Y.; Zhou, S.; Zheng, X.; et al. A molecular framework underlying the compound leaf pattern of Medicago truncatula. Nat. Plants 2020, 6, 511–521. [Google Scholar] [CrossRef] [PubMed]
  8. Birkenbihl, R.P.; Jach, G.; Saedler, H.; Huijser, P. Functional Dissection of the Plant-specific SBP-Domain: Overlap of the DNA-binding and Nuclear Localization Domains. J. Mol. Biol. 2005, 352, 585–596. [Google Scholar] [CrossRef] [Green Version]
  9. Hobert, O. Gene Regulation by Transcription Factors and MicroRNAs. Science 2008, 319, 1785–1786. [Google Scholar] [CrossRef]
  10. Yamasaki, K.; Kigawa, T.; Inoue, M.; Tateno, M.; Yamasaki, T.; Yabuki, T.; Aoki, M.; Seki, E.; Matsuda, T.; Nunokawa, E.; et al. A Novel Zinc-binding Motif Revealed by Solution Structures of DNA-binding Domains of Arabidopsis SBP-family Transcription Factors. J. Mol. Biol. 2004, 337, 49–63. [Google Scholar] [CrossRef]
  11. Kropat, J.; Tottey, S.; Birkenbihl, R.P.; Depège, N.; Huijser, P.; Merchant, S. A regulator of nutritional copper signaling in Chlamydomonas is an SBP domain protein that recognizes the GTAC core of copper response element. Proc. Natl. Acad. Sci. USA 2005, 102, 18730–18735. [Google Scholar] [CrossRef] [Green Version]
  12. Riese, M.; Höhmann, S.; Saedler, H.; Münster, T.; Huijser, P. Comparative analysis of the SBP-box gene families in P. patens and seed plants. Gene 2007, 401, 28–37. [Google Scholar] [CrossRef] [PubMed] [Green Version]
  13. Cai, C.; Guo, W.; Zhang, B. Genome-wide identification and characterization of SPL transcription factor family and their evolution and expression profiling analysis in cotton. Sci. Rep. 2018, 8, 762. [Google Scholar] [CrossRef] [PubMed]
  14. Arshad, M.; Feyissa, B.A.; Amyot, L.; Aung, B.; Hannoufa, A. MicroRNA156 improves drought stress tolerance in alfalfa (Medicago sativa) by silencing SPL13. Plant Sci. 2017, 258, 122–136. [Google Scholar] [CrossRef]
  15. Aung, B.; Gruber, M.Y.; Amyot, L.; Omari, K.W.; Bertrand, A.; Hannoufa, A. Ectopic expression of LjmiR156 delays flowering, enhances shoot branching, and improves forage quality in alfalfa. Plant Biotechnol. Rep. 2015, 9, 379–393. [Google Scholar] [CrossRef]
  16. Aung, B.; Gruber, M.Y.; Amyot, L.; Omari, K.; Bertrand, A.; Hannoufa, A. MicroRNA156 as a promising tool for alfalfa improvement. Plant Biotechnol. J. 2015, 13, 779–790. [Google Scholar] [CrossRef]
  17. E Silva, G.F.F.; Silva, E.M.; da Silva Azevedo, M.; Guivin, M.A.C.; Ramiro, D.A.; Figueiredo, C.R.; Carrer, H.; Peres, L.E.P.; Nogueira, F.T.S. microRNA156-targeted SPL/SBP box transcription factors regulate tomato ovary and fruit development. Plant J. 2014, 78, 604–618. [Google Scholar] [CrossRef]
  18. Liu, N.; Tu, L.; Wang, L.; Hu, H.; Xu, J.; Zhang, X. MicroRNA 157-targeted SPL genes regulate floral organ size and ovule production in cotton. BMC Plant Biol. 2017, 17, 7. [Google Scholar] [CrossRef] [Green Version]
  19. Yu, N.; Cai, W.-J.; Wang, S.; Shan, C.-M.; Wang, L.-J.; Chen, X.-Y. Temporal Control of Trichome Distribution by MicroRNA156-Targeted SPL Genes in Arabidopsis thaliana. Plant Cell 2010, 22, 2322–2335. [Google Scholar] [CrossRef] [Green Version]
  20. Cardon, G.H.; Hohmann, S.; Nettesheim, K.; Saedler, H.; Huijser, P. Functional analysis of the Arabidopsis thaliana SBP-box gene SPL3: A novel gene involved in the floral transition. Plant J. 1997, 12, 367–377. [Google Scholar] [CrossRef]
  21. Gandikota, M.; Birkenbihl, R.P.; Höhmann, S.; Cardon, G.H.; Saedler, H.; Huijser, P. The miRNA156/157 recognition element in the 3′ UTR of the Arabidopsis SBP box gene SPL3 prevents early flowering by translational inhibition in seedlings. Plant J. 2007, 49, 683–693. [Google Scholar] [CrossRef] [Green Version]
  22. Xu, M.; Hu, T.; Zhao, J.; Park, M.-Y.; Earley, K.W.; Wu, G.; Yang, L.; Poethig, R.S. Developmental Functions of miR156-Regulated SQUAMOSA PROMOTER BINDING PROTEIN-LIKE (SPL) Genes in Arabidopsis thaliana. PLoS Genet. 2016, 12, e1006263. [Google Scholar] [CrossRef] [PubMed] [Green Version]
  23. Si, L.; Chen, J.; Huang, X.; Gong, H.; Luo, J.; Hou, Q.; Zhou, T.; Lu, T.; Zhu, J.; Shangguan, Y.; et al. OsSPL13 controls grain size in cultivated rice. Nat. Genet. 2016, 48, 447–456. [Google Scholar] [CrossRef] [PubMed]
  24. Jiao, Y.; Wang, Y.; Xue, D.; Wang, J.; Yan, M.; Liu, G.; Dong, G.; Zeng, D.; Lu, Z.; Zhu, X.; et al. Regulation of OsSPL14 by OsmiR156 defines ideal plant architecture in rice. Nat. Genet. 2010, 42, 541–544. [Google Scholar] [CrossRef] [PubMed]
  25. Gao, R.; Austin, R.S.; Amyot, L.; Hannoufa, A. Comparative transcriptome investigation of global gene expression changes caused by miR156 overexpression in Medicago sativa. BMC Genom. 2016, 17, 658. [Google Scholar] [CrossRef] [PubMed] [Green Version]
  26. Tadege, M.; Wen, J.; He, J.; Tu, H.; Kwak, Y.; Eschstruth, A.; Cayrel, A.; Endre, G.; Zhao, P.X.; Chabaud, M.; et al. Large-scale insertional mutagenesis using the Tnt1 retrotransposon in the model legume Medicago truncatula. Plant J. 2008, 54, 335–347. [Google Scholar] [CrossRef]
  27. Chen, C.; Chen, H.; Zhang, Y.; Thomas, H.R.; Frank, M.H.; He, Y.; Xia, R. TBtools: An Integrative Toolkit Developed for Interactive Analyses of Big Biological Data. Mol. Plant 2020, 13, 1194–1202. [Google Scholar] [CrossRef]
  28. Blanc, G.; Wolfe, K. Widespread Paleopolyploidy in Model Plant Species Inferred from Age Distributions of Duplicate Genes. Plant Cell 2004, 16, 1667–1678. [Google Scholar] [CrossRef] [Green Version]
  29. Lescot, M.; Déhais, P.; Thijs, G.; Marchal, K.; Moreau, Y.; van de Peer, Y.; Rouzé, P.; Rombauts, S. PlantCARE, a database of plant cis-acting regulatory elements and a portal to tools for in silico analysis of promoter sequences. Nucleic Acids Res. 2002, 30, 325–327. [Google Scholar] [CrossRef]
  30. O’Rourke, J.A.; Fu, F.; Bucciarelli, B.; Yang, S.S.; Samac, D.A.; Lamb, J.F.S.; Monteros, M.J.; Graham, M.A.; Gronwald, J.W.; Krom, N.; et al. The Medicago sativa gene index 1.2: A web-accessible gene expression atlas for investigating expression differences between Medicago sativa subspecies. BMC Genom. 2015, 16, 1–17. [Google Scholar] [CrossRef] [Green Version]
  31. Min, X.; Jin, X.; Zhang, Z.; Wei, X.; Ndayambaza, B.; Wang, Y.; Liu, W. Genome-Wide Identification of NAC Transcription Factor Family and Functional Analysis of the Abiotic Stress-Responsive Genes in Medicago sativa L. J. Plant Growth Regul. 2019, 39, 324–337. [Google Scholar] [CrossRef]
  32. Zhu, H.; Choi, H.-K.; Cook, D.R.; Shoemaker, R.C. Bridging Model and Crop Legumes through Comparative Genomics. Plant Physiol. 2005, 137, 1189–1196. [Google Scholar] [CrossRef] [PubMed] [Green Version]
  33. Cornacchione, M.V.; Suarez, D.L. Evaluation of Alfalfa (Medicago sativa L.) Populations’ Response to Salinity Stress. Crop Sci. 2016, 57, 137–150. [Google Scholar] [CrossRef] [Green Version]
  34. Bar, M.; Ori, N. Leaf development and morphogenesis. Development 2014, 141, 4219–4230. [Google Scholar] [CrossRef] [PubMed] [Green Version]
  35. Riaño-Pachón, D.M.; Ruzicic, S.; Dreyer, I.; Mueller-Roeber, B. PlnTFDB: An integrative plant transcription factor database. BMC Bioinform. 2007, 8, 42. [Google Scholar] [CrossRef] [Green Version]
  36. Jeyakumar, J.M.J.; Ali, A.; Wang, W.-M.; Thiruvengadam, M. Characterizing the Role of the miR156-SPL Network in Plant Development and Stress Response. Plants 2020, 9, 1206. [Google Scholar] [CrossRef]
  37. Wang, H.; Lu, Z.; Xu, Y.; Kong, L.; Shi, J.; Liu, Y.; Fu, C.; Wang, X.; Wang, Z.-Y.; Zhou, C.; et al. Genome-wide characterization of SPL family in Medicago truncatula reveals the novel roles of miR156/SPL module in spiky pod development. BMC Genom. 2019, 20, 552. [Google Scholar] [CrossRef]
  38. Preston, J.C.; Hileman, L.C. Functional Evolution in the Plant SQUAMOSA-PROMOTER BINDING PROTEIN-LIKE (SPL) Gene Family. Front. Plant Sci. 2013, 4, 80. [Google Scholar] [CrossRef] [Green Version]
  39. Kavas, M.; Kizildoğan, A.K.; Abanoz, B. Comparative genome-wide phylogenetic and expression analysis of SBP genes from potato (Solanum tuberosum). Comput. Biol. Chem. 2017, 67, 131–140. [Google Scholar] [CrossRef]
  40. Tripathi, R.K.; Goel, R.; Kumari, S.; Dahuja, A. Genomic organization, phylogenetic comparison, and expression profiles of the SPL family genes and their regulation in soybean. Dev. Genes Evol. 2017, 227, 101–119. [Google Scholar] [CrossRef]
  41. Cardon, G.; Höhmann, S.; Klein, J.; Nettesheim, K.; Saedler, H.; Huijser, P. Molecular characterisation of the Arabidopsis SBP-box genes. Gene 1999, 237, 91–104. [Google Scholar] [CrossRef]
  42. Xie, K.; Wu, C.; Xiong, L. Genomic organization, differential expression, and interaction of SQUAMOSA promoter-binding-like transcription factors and microRNA156 in rice. Plant Physiol. 2006, 142, 280–293. [Google Scholar] [CrossRef] [PubMed] [Green Version]
  43. Du, F.; Guan, C.; Jiao, Y. Molecular Mechanisms of Leaf Morphogenesis. Mol. Plant 2018, 11, 1117–1134. [Google Scholar] [CrossRef] [PubMed] [Green Version]
  44. Bar, M.; Ori, N. Compound leaf development in model plant species. Curr. Opin. Plant Biol. 2015, 23, 61–69. [Google Scholar] [CrossRef] [PubMed]
  45. Ma, Y.; Xue, H.; Zhang, F.; Jiang, Q.; Yang, S.; Yue, P.; Wang, F.; Zhang, Y.; Li, L.; He, P.; et al. The miR156/SPL module regulates apple salt stress tolerance by activating MdWRKY100 expression. Plant Biotechnol. J. 2020, 19, 311–323. [Google Scholar] [CrossRef] [PubMed]
  46. Zheng, C.; Ye, M.; Sang, M.; Wu, R. A Regulatory Network for miR156-SPL Module in Arabidopsis thaliana. Int. J. Mol. Sci. 2019, 20, 6166. [Google Scholar] [CrossRef] [PubMed] [Green Version]
  47. Feyissa, B.A.; Arshad, M.; Gruber, M.Y.; Kohalmi, S.E.; Hannoufa, A. The interplay between miR156/SPL13 and DFR/WD40–1 regulate drought tolerance in alfalfa. BMC Plant Biol. 2019, 19, 1–19. [Google Scholar] [CrossRef] [Green Version]
  48. Feyissa, B.A.; Renaud, J.; Nasrollahi, V.; Kohalmi, S.E.; Hannoufa, A. Transcriptome-IPMS analysis reveals a tissue-dependent miR156/SPL13 regulatory mechanism in alfalfa drought tolerance. BMC Genom. 2020, 21, 1–18. [Google Scholar] [CrossRef]
  49. Matthews, C.; Arshad, M.; Hannoufa, A. Alfalfa response to heat stress is modulated by microRNA156. Physiol. Plant. 2019, 165, 830–842. [Google Scholar] [CrossRef]
Figure 1. (a) Length distribution of the assembled genes. (b) Volcano plots display log2 converted fold changes and FDR values of the DEGs.
Genes 13 00331 g001
Figure 2. KEGG (a) and KOG (b) pathway enrichment scatter diagram of DEGs between multifoliate and trifoliate alfalfa. The size and color of the dots represent the gene number and the range of the −log10 (q-Value), respectively.
Genes 13 00331 g002
Figure 3. Unrooted phylogenetic tree representing the relationships among M. sativa, Arabidopsis, M. truncatula, and O.sativa. The different color background indicates the different subgroups.
Genes 13 00331 g003
Figure 4. The architectures of the conserved protein motifs (a) and gene structures (b) of the SPL genes in alfalfa.
Genes 13 00331 g004
Figure 5. Chromosome distribution and collinearity investigation of MsSPL genes in alfalfa. Gray background indicates all syntenic blocks, red and blue lines indicate segmental and tandem duplications, respectively.
Genes 13 00331 g005
Figure 6. Synteny analyses MsSPL genes with four representative plant species. Red lines highlight syntenic SPL gene pairs within alfalfa and other plant genomes.
Genes 13 00331 g006
Figure 7. The cis-elements identify. The 2000 bp promoter sequences of MsSPL were analyzed by PlantCARE.
Genes 13 00331 g007
Figure 8. The expression pattern of MsSPL genes in various alfalfa tissues. (a) Heat map showing the expression change in PES (post-elongation stem internodes), flowers, leaf, nodule, ES (elongating stem internodes), and root. (b) The expression pattern of MsSPL genes between multifoliate and trifoliate alfalfa.
Genes 13 00331 g008
Figure 9. Paralogous of MsSPL08 isolation and functional analysis. (a) MsSPL08 and MtSPL4 multiple sequence alignment, and (b) gene structure comparison. Transcript levels of MsSPL08 (c) and MtSPL4 (d) in alfalfa and M. truncatula. (e) The aboveground phenotype of wild type and mutant plant. (f,g) Seedling leaflet number comparison between wild type and mutant plant, the red triangle indicate the cotyledon and true leaf.
Genes 13 00331 g009
Table 1. Data quality of RNA-Seq and mapping information.
LibrariesRaw DataClean DataMapped Reads (M)
Raw ReadsRaw Bases (Mbp)Clean ReadsClean Bases (Mbp)Average Read Length (bp)Q30 Bases Ratio (%)GC Count (%)Total Mapped (%)Mutiple Mapped (%)Uniquely Mapped (%)
T140,751,582 6112.74 3,9151,7105738.75 146.5893.78%44.99%90.10%54.27%35.83%
T241,100,934 6165.14 3,9622,3845650.63 142.6197.19%44.17%91.42%57.70%33.72%
T339,494,852 5924.23 3,7603,1465377.32 14392.58%43.84%93.24%58.61%34.63%
M144,693,794 6704.07 4,2885,1646120.67 142.7292.96%44.52%91.86%59.18%32.68%
M243,172,140 6475.82 4,1189,9565880.61 142.7792.70%44.15%94.86%61.61%33.25%
M346,502,916 6975.44 4,4872,2386447.54 143.6994.16%45.09%89.87%57.35%32.52%
Note: Q30 the probability that the base was miscalled is 0.1%, GC content the percentage of guanine and cytosine out of four bases. T: trifoliate, M: Multifoliate.
Table 2. MsSPL genes identified in alfalfa and their sequence characteristics.
Gene NameAccession IDProtein Length (aa)Protein MW (kDa)Protein GRAVY apIbArabidopsis Ortholog LocusM. truncatula Ortholog Locus
MsSPL01MS.gene026366.t11017113.32−0.5587.71ATSPL14Medtr1g035010.1
MsSPL02MS.gene040800.t1992110.44−0.5717.61ATSPL14Medtr1g035010.1
MsSPL03MS.gene061710.t188297.83−0.5647.52ATSPL14Medtr1g035010.1
MsSPL04MS.gene20896.t11003111.77−0.4796.28ATSPL1Medtr1g086250.1
MsSPL05MS.gene98509.t11025113.06−0.3567.12ATSPL12Medtr2g046550.1
MsSPL06MS.gene96180.t174783.81−0.2676.75ATSPL7Medtr2g020620.1
MsSPL07MS.gene062030.t11025113.03−0.3597.28ATSPL12Medtr2g046550.1
MsSPL08MS.gene047335.t114116.58−1.2947.2ATSPL3Medtr2g014200.1
MsSPL09MS.gene06231.t137641.68−0.6797.03ATSPL13BMedtr3g099080.1
MsSPL10MS.gene055507.t137641.65−0.6557.09ATSPL13BMedtr3g099080.1
MsSPL11MS.gene75620.t143448.02−0.8328.61ATSPL2Medtr3g085180.1
MsSPL12MS.gene77585.t145850.72−0.7728.54ATSPL2Medtr3g085180.1
MsSPL13MS.gene045290.t144749.63−0.8288.62AT SPL2Medtr3g085180.1
MsSPL14MS.gene09220.t134238.34−0.7968.44ATSPL11Medtr8g080690.1
MsSPL15MS.gene09219.t136841.73−0.7677.88AT SPL10Medtr8g080680.1
MsSPL16MS.gene09218.t143548.61−0.6275.31ATSPL11Medtr8g080670.1
MsSPL17MS.gene023425.t140646.03−0.7687.35ATSPL10Medtr8g080680.1
MsSPL18MS.gene09027.t172882.29−0.7758.33AT SPL2Medtr8g080680.1
MsSPL19MS.gene09028.t144549.57−0.6375.73ATSPL2Medtr8g080670.1
MsSPL20MS.gene030453.t137541.52−0.7888.57ATSPL13BMedtr8g096780.1
MsSPL21MS.gene071085.t143749.48−0.7076.6AtSPL6Medtr5g046670.1
MsSPL22MS.gene029630.t143749.45−0.7066.55AtSPL6Medtr5g046670.1
MsSPL23MS.gene36181.t131434.69−0.7258.55ATSPL5Medtr7g444860.1
MsSPL24MS.gene28650.t1999110.7−0.3936.08ATSPL1Medtr7g110320.1
MsSPL25MS.gene99828.t136640.84−0.8468.62ATSPL13BMedtr7g028740.1
MsSPL26MS.gene072658.t1975107.92−0.4076.38ATSPL1Medtr7g110320.1
MsSPL27MS.gene04608.t133936.68−0.7078.92AtSPL9Medtr7g092930.1
MsSPL28MS.gene36036.t118020.58−1.1879.2AT SPL4Medtr8g463140.1
MsSPL29MS.gene000259.t133737.43−0.9718.61AT SPL8Medtr8g005960.1
MsSPL30MS.gene063508.t147053.66−0.5646.54AtSPL6Medtr4g109770.1
Note: a Grand average of hydropathy (GRAVY). b Theoretical isoelectric point (pI).
Publisher’s Note: MDPI stays neutral with regard to jurisdictional claims in published maps and institutional affiliations.

