
Optimizing the Phenylalanine Cut-Off Value in a Newborn Screening Program

 ,
,
Abstract
:1. Introduction
2. Materials and Methods
2.1. Subjects
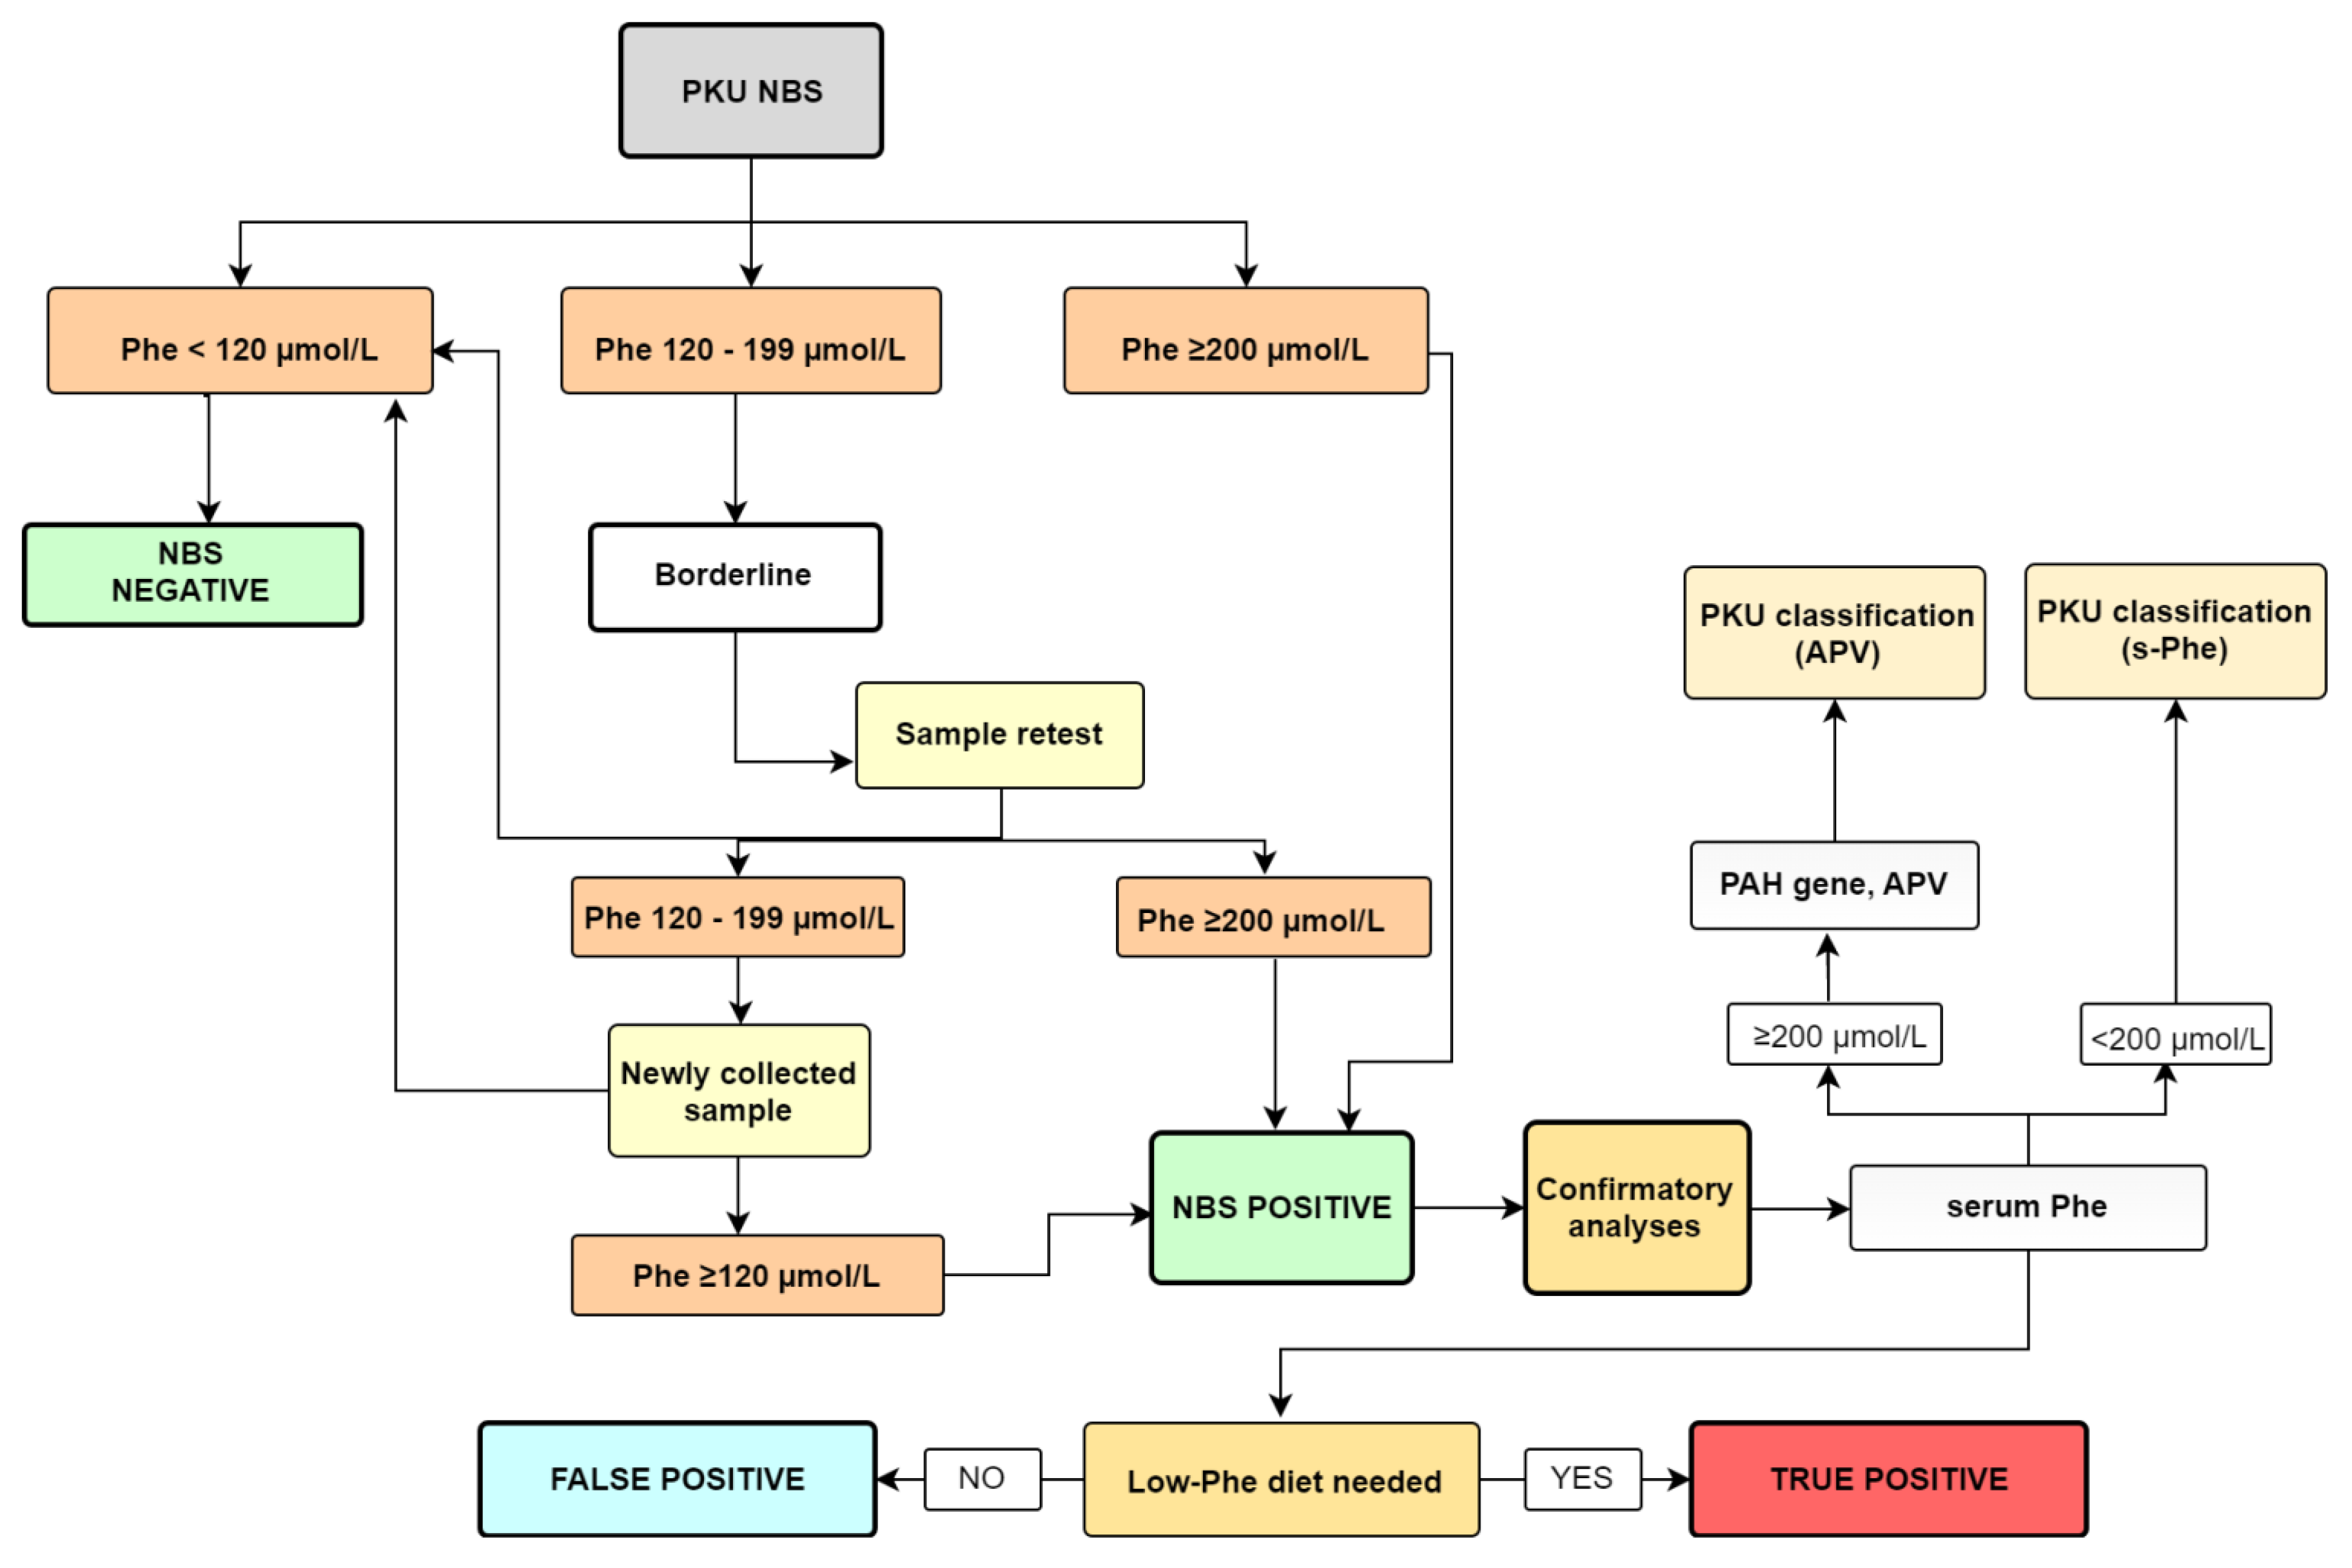
2.2. Specimen Collection, Methods, and Screening Protocol
2.3. Confirmation Analyses and PKU Classification
2.3.1. Fluorimetric Method—S-Phe
2.3.2. Genetic Confirmation
2.3.3. True Positive/False Positive
2.4. Adjustment of the Cut-Off Value
3. Results
3.1. The First Part of the Study
3.1.1. Detailed Description of 16 Patients
3.1.2. Adjustment of the Cut-Off Value
3.2. The Second Part of the Study
4. Discussion
5. Conclusions
Author Contributions
Funding
Institutional Review Board Statement
Informed Consent Statement
Data Availability Statement
Acknowledgments
Conflicts of Interest
References
- Kaufman, S. The Phenylalanine Hydroxylating System. Adv. Enzymol. Relat. Areas Mol. Biol. 2006, 67, 77–264. [Google Scholar] [CrossRef]
- Groselj, U.; Tansek, M.Z.; Kovac, J.; Hovnik, T.; Podkrajsek, K.T.; Battelino, T. Five novel mutations and two large deletions in a population analysis of the phenylalanine hydroxylase gene. Mol. Genet. Metab. 2012, 106, 142–148. [Google Scholar] [CrossRef] [PubMed]
- Blau, N.; Van Spronsen, F.J.; Levy, H.L. Phenylketonuria. Lancet 2010, 376, 1417–1427. [Google Scholar] [CrossRef]
- Maxim, L.D.; Niebo, R.; Utell, M.J. Screening tests: A review with examples. Inhal. Toxicol. 2014, 26, 811–828. [Google Scholar] [CrossRef] [PubMed]
- MacLeod, E.L.; Ney, D.M. Nutritional management of phenylketonuria. Ann. Nestle 2010, 68, 58–69. [Google Scholar] [CrossRef] [PubMed] [Green Version]
- Shoraka, H.R.; Haghdoost, A.A.; Baneshi, M.R.; Bagherinezhad, Z.; Zolala, F. Global prevalence of classic phenylketonuria based on neonatal screening program data: Systematic review and meta-analysis. Korean J. Pediatr. 2020, 63, 34–43. [Google Scholar] [CrossRef]
- Groselj, U.; Tansek, M.Z.; Battelino, T. Fifty years of phenylketonuria newborn screening-A great success for many, but what about the rest? Mol. Genet. Metab. 2014, 113, 8–10. [Google Scholar] [CrossRef]
- Battelino, T.; Kržišnik, C.; Pavlin, K. Early detection and follow up of children with phenylketonuria in Slovenia. Zdr. Vestn 1994, 63, 25–28. [Google Scholar]
- Šmon, A.; Grošelj, U.; Žerjav Tanšek, M.; Biček, A.; Oblak, A.; Zupančič, M.; Kržišnik, C.; Repič Lampret, B.; Murko, S.; Hojker, S.; et al. Newborn screening in Slovenia. Zdr. Varst. 2015, 54, 86–90. [Google Scholar] [CrossRef] [Green Version]
- Grošelj, U.; Tanšek, M.Ž.; Podkrajšek, K.T.; Battelino, T. Genetske in klinične značilnosti bolnikov s fenilketonurijo v Sloveniji. Zdr. Vestn. 2013, 82, 767–777. [Google Scholar]
- Borrajo, G.J.C. Newborn Screening for Phenylketonuria: Latin American Consensus Guidelines. J. Inborn Errors Metab. Screen. 2016, 4, 1–5. [Google Scholar] [CrossRef]
- Koracin, V.; Mlinaric, M.; Baric, I.; Brincat, I.; Djordjevic, M.; Drole Torkar, A.; Fumic, K.; Kocova, M.; Milenkovic, T.; Moldovanu, F.; et al. Current Status of Newborn Screening in Southeastern Europe. Front. Pediatr. 2021, 9, 648939. [Google Scholar] [CrossRef] [PubMed]
- Levy, H.L. Newborn screening by tandem mass spectrometry: A new era. Clin. Chem. 1998, 44, 2401–2402. [Google Scholar] [CrossRef] [PubMed] [Green Version]
- Repič Lampret, B.; Remec, Ž.I.; Drole Torkar, A.; Žerjav Tanšek, M.; Šmon, A.; Koračin, V.; Čuk, V.; Perko, D.; Ulaga, B.; Jelovšek, A.M.; et al. Expanded newborn screening program in Slovenia using tandem mass spectrometry and confirmatory next generation sequencing genetic testing. Zdr. Varst. 2020, 95, 256–263. [Google Scholar] [CrossRef] [PubMed]
- NAVODILO ZA IZVAJANJE RAZŠIRJENEGA PRESEJANJA NOVOROJENCEVV SLOVENIJI. Available online: https://www.redkebolezni.si/assets1191/wp-content/uploads/2016/05/Redke-bolezni_Protokol-razsirjenega-presejanja-novorojencev-marec-2019.pdf?x50514 (accessed on 22 October 2021).
- Oblak, A.; Zaletel, K. Presejalno testiranje novorojencev–izkušnje v Slovenskem prostoru. In Proceedings of the Zbornik Predavanj Raziskovalnega Srečanja 9. JESENOVČEVI DNEVI-Raziskovalni Dnevi Laboratorijske Biomedicine; Skitek, M., Černe, D., Eds.; Fakulteta za farmacijo, Univerza v Ljubljani: Ljubljana, Slovenia, 2017; pp. 58–69. [Google Scholar]
- Garbade, S.F.; Shen, N.; Himmelreich, N.; Haas, D.; Trefz, F.K.; Hoffmann, G.F.; Burgard, P.; Blau, N. Allelic phenotype values: A model for genotype-based phenotype prediction in phenylketonuria. Genet. Med. 2019, 21, 580–590. [Google Scholar] [CrossRef] [PubMed]
- Allelic Phenotype Values (APV) and Phenotype Association of PAHVariations. Available online: http://www.biopku.org/home/docs/APV.pdf (accessed on 16 October 2021).
- Pourfarzam, M.; Zadhoush, F. Newborn screening for inherited metabolic disorders; news and views. J. Res. Med. Sci. 2013, 18, 801–808. [Google Scholar]
- MacReady, R.; Hussey, M. Newborn phenylketonuria detection program in Massachussets. Am. J. Public Health Nations Health 1964, 54, 2075–2091. [Google Scholar] [CrossRef] [PubMed] [Green Version]
- Vittozzi, L.; Burgard, P.; Cornel, M.; Hoffmannn, G.F.; Lindner, M.; Loeber, J.G.; Rigter, T.; Rupp, K.; Taruscio, D.; Weinreich, S. Executive Report to the European Commission on Newborn Screening in the European Union Table of Contents. Available online: https://isns-neoscreening.org/wp-content/uploads/2016/06/Executive-Report-to-EC-FINAL.pdf (accessed on 16 November 2021).
- Zerjav Tansek, M.; Groselj, U.; Angelkova, N.; Anton, D.; Baric, I.; Djordjevic, M.; Grimci, L.; Ivanova, M.; Kadam, A.; Kotori, V.; et al. Phenylketonuria screening and management in southeastern Europe-Survey results from 11 countries. Orphanet J. Rare Dis. 2015, 10, 68. [Google Scholar] [CrossRef] [Green Version]
- Waisbren, S.E.; Albers, S.; Amato, S.; Ampola, M.; Brewster, T.G.; Demmer, L.; Eaton, R.B.; Greenstein, R.; Korson, M.; Larson, C.; et al. Effect of Expanded Newborn Screening for Biochemical Genetic Disorders on Child Outcomes and Parental Stress. J. Am. Med. Assoc. 2003, 290, 2564–2572. [Google Scholar] [CrossRef] [Green Version]
- Schmidt, J.L.; Castellanos-Brown, K.; Childress, S.; Bonhomme, N.; Oktay, J.S.; Terry, S.F.; Kyler, P.; Davidoff, A.; Greene, C. The impact of false-positive newborn screening results on families: A qualitative study. Genet. Med. 2012, 14, 76–80. [Google Scholar] [CrossRef] [Green Version]
- Lipstein, E.A.; Perrin, J.M.; Waisbren, S.E.; Prosser, L.A. Impact of false-positive newborn metabolicscreening results on early health care utilization. Genet Med. 2009, 1, 716–721. [Google Scholar] [CrossRef] [PubMed] [Green Version]
- Tu, W.J.; He, J.; Chen, H.; Shi, X.D.; Li, Y. Psychological effects of true positive results in expanded newborn screening in China. PLoS ONE 2012, 7, e36235. [Google Scholar] [CrossRef] [Green Version]
- Bahn, C. Raising the Bar on Newborn Screening Test Performance. Available online: https://news.mayocliniclabs.com/2019/08/29/raising-the-bar-on-newborn-screening-test-performance/ (accessed on 13 September 2021).
- Mandour, I.; El Gayar, D.; Amin, M.; Farid, T.M.; Ali, A.A. Amino acid and acylcarnitine profiles in premature neonates: A pilot study. Indian J. Pediatr. 2013, 80, 736–744. [Google Scholar] [CrossRef] [PubMed]
- Clark, R.H.; Kelleher, A.S.; Chace, D.H.; Spitzer, A.R. Gestational Age and Age at Sampling Influence Metabolic Profiles in Premature Infants. Pediatrics 2014, 134, e37–e46. Available online: http://pediatrics.aappublications.org/content/134/1/e37.abstract (accessed on 15 September 2021). [CrossRef] [PubMed] [Green Version]
- Gucciardi, A.; Zaramella, P.; Costa, I.; Pirillo, P.; Nardo, D.; Naturale, M.; Chiandetti, L.; Giordano, G. Analysis and Inter-Pretation of Acylcarnitine Profiles in Dried Blood Spot and Plasma of Preterm and Full-term Newborns. Pediatr. Res. 2015, 77, 36–47. Available online: http://0-www-scopus-com.brum.beds.ac.uk/inward/record.url?eid=2-s2.0-84924386570&partnerID=tZOtx3y1 (accessed on 15 September 2021). [CrossRef] [PubMed]
- Meyburg, J. Acylcarnitine Profiles of Preterm Infants Over the First Four Weeks of Life. Pediatr. Res. 2002, 52, 720–723. [Google Scholar] [CrossRef] [PubMed]
- APHL. Association of Public Health Laboratories Overview of Cutoff Determinations and Risk Assessment Methods Used in Dried Blood Spot Newborn Screening- Role of Cutoffs and Other Methods of Data Analysis. 2019, pp. 1–23. Available online: https://www.aphl.org/programs/newborn_screening/Documents/Overview%20on%20Cutoff%20Determinations%20and%20RIsk%20Assessment%20Methods_final.pdf (accessed on 23 January 2022).
- Loeber, J.G.; Platis, D.; Zetterström, R.H.; Schielen, P.J.C.I. Neonatal screening in Europe revisited: An ISNS-perspective on the current state and developments since 2010. Medecine/Sciences 2021, 37, 441–456. [Google Scholar] [CrossRef] [PubMed]
- Collaborative Laboratory Integrated Reports (CLIR). Available online: https://clir.mayo.edu (accessed on 5 January 2022).


| Patient | DBS-Phe (µmol/L) | DBS-Phe (µmol/L)— New Sample | S-Phe (µmol/L) | Genotype (PAH Gene) | APV Allele1/ Allele2 | * PKU Classification | Diet | TP |
|---|---|---|---|---|---|---|---|---|
| 1 | 500 | nd | 569 | NM_000277.1:c[143T>C(;)913-7A>G] | 2.1/0 | cPKU | yes | yes |
| 2 | 420 | nd | 1118 | NM_000277.2:c[143T>C(;)1222C>T] | 2.1/0 | cPKU | yes | yes |
| 3 | 550 | nd | 802 | NM_000277.2:c[842C>T(;)1222C>T] | 0.8/0 | cPKU | yes | yes |
| 4 | 490 | nd | 751 | NM_000277.3:c[473G>A];[473G>A] | 0/0 | cPKU | yes | yes |
| 5 | 580 | nd | 983 | NM_000277.3:c[473G>A];[473G>A] | 0/0 | cPKU | yes | yes |
| 6 | 290 | nd | 593 | NM_000277.1:c[442-5C>G(;)842C>T] | 6.2/0.8 | mPKU | yes | yes |
| 7 | 310 | nd | 241 | NM_000277.2:c[58C>T(;)165T>G] | 0/8.1 | MHP | no | no |
| 8 | 180 | 200 | 229 | NM_000277.3:c[473G>A(;)827T>C] | 0/10 | MHP | no | no |
| 9 | 260 | nd | 250 | NM_000277.3:c[1208C>T(;)1222C>T] | 9.3/0 | MHP | no | no |
| 10 | 150 | 120 | 247 | NM_000277.3:c[678G>C(;)734T>C] | nd/9.9 | MHP | no | no |
| 11 | 150 | 170 | 194 | / | / | MHP | no | no |
| 12 | 130 | 180 | 131 | / | / | MHP | no | no |
| 13 | 130 | 120 | 92 | / | / | / | no | no |
| 14 | 130 | 130 | 130 | / | / | MHP | no | no |
| 15 | 180 | 160 | 144 | / | / | MHP | no | no |
| 16 | 710 | nd | 417 | / | / | GALD | / | / |
| Number of newborns | 37,784 | ||||||||
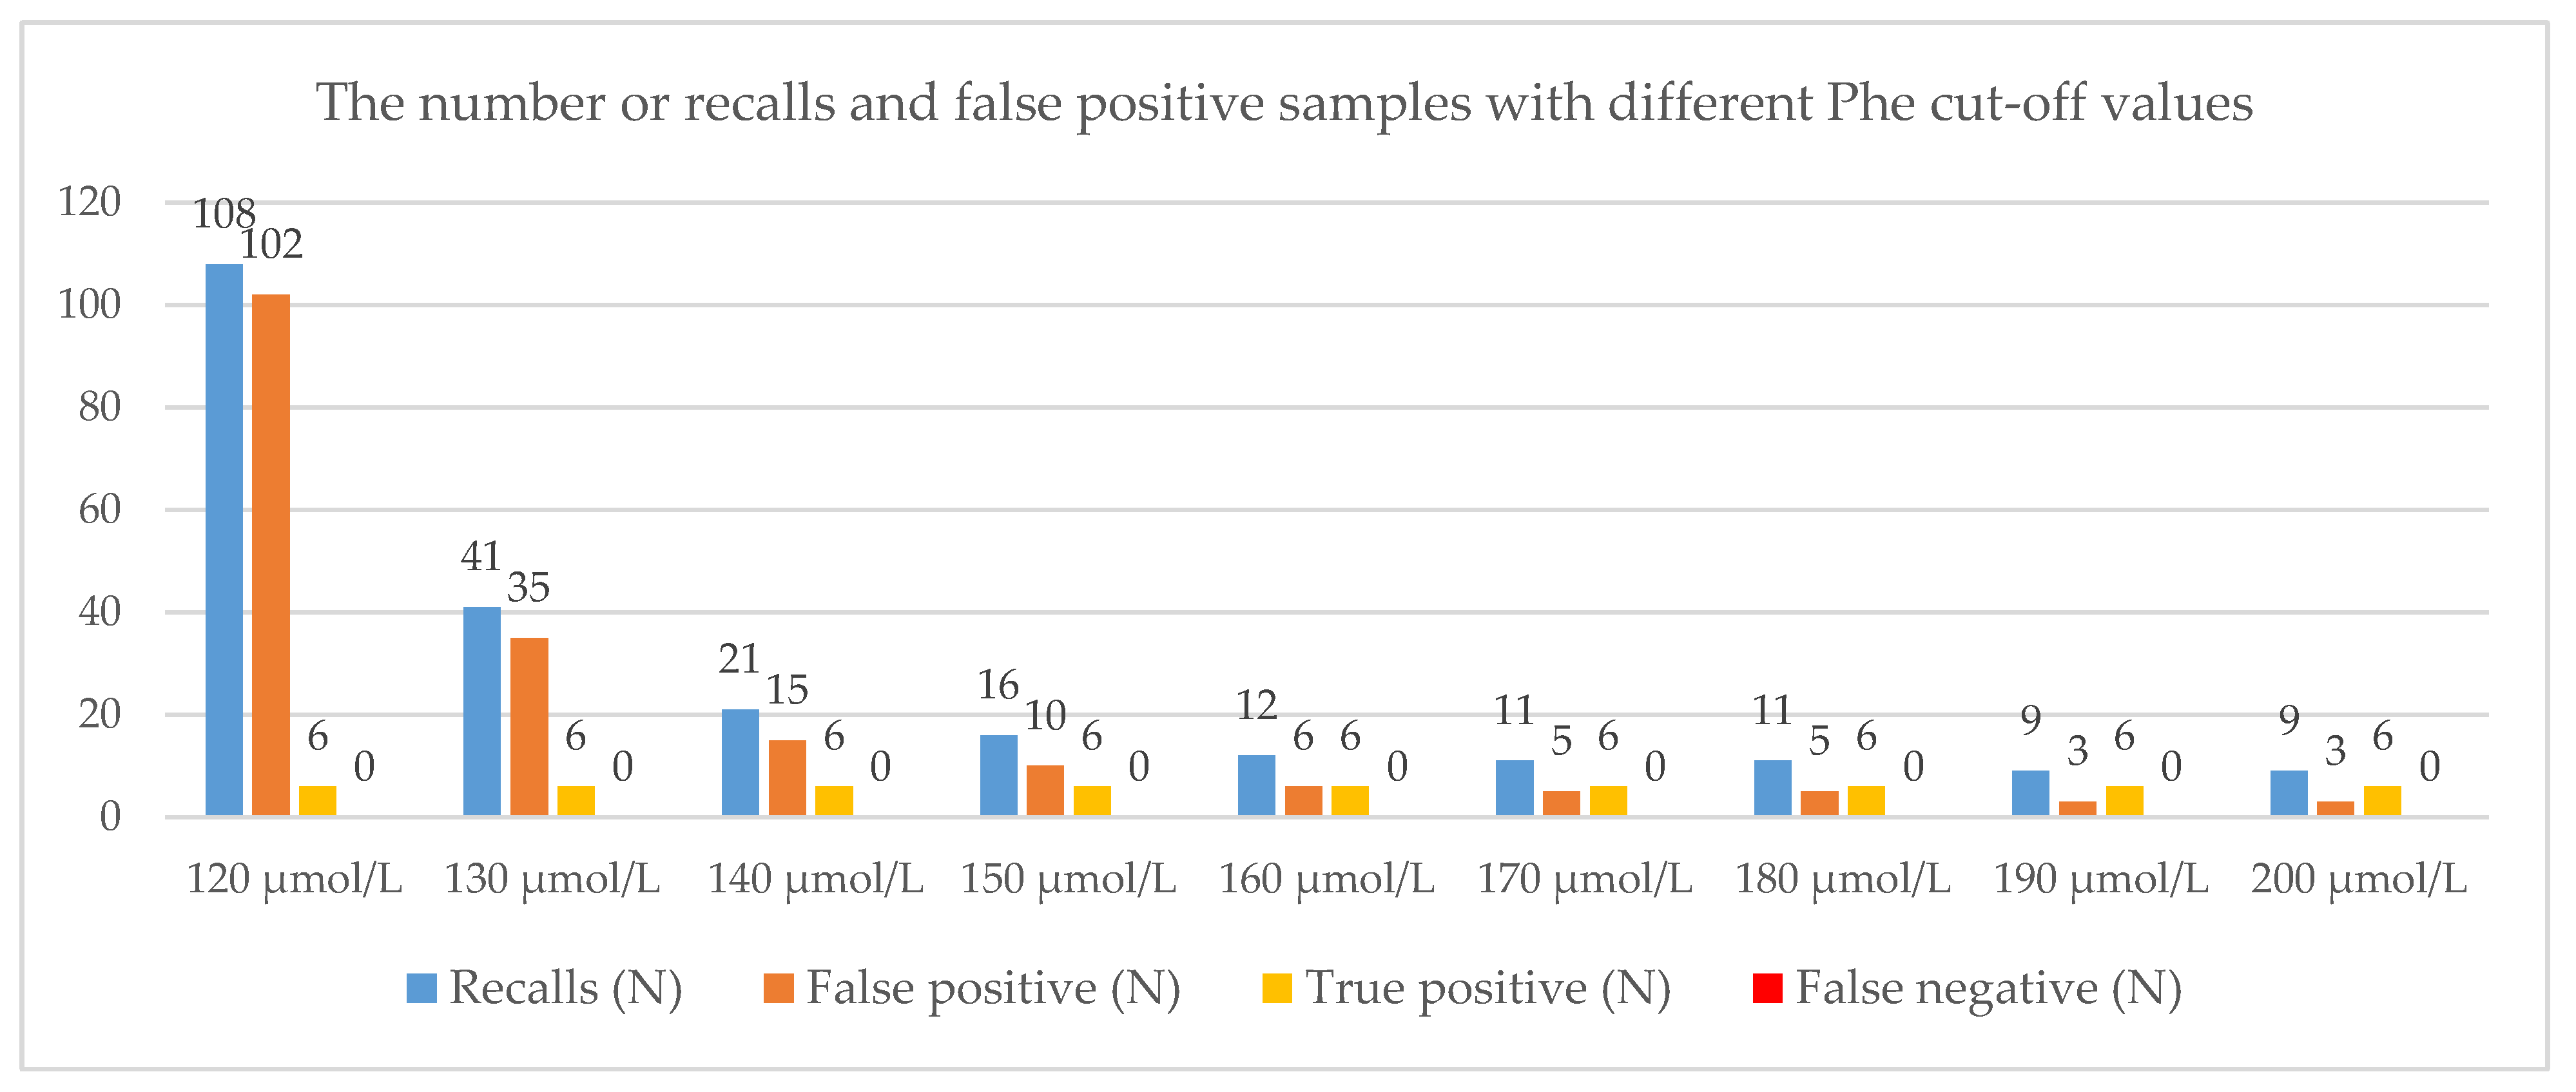
| Phe cut-off value (µmol/L) | 120 | 130 | 140 | 150 | 160 | 170 | 180 | 190 | 200 |
| Recalls (N) | 108 | 41 | 21 | 16 | 12 | 11 | 11 | 9 | 9 |
| False positive (N) | 102 | 35 | 15 | 10 | 6 | 5 | 5 | 3 | 3 |
| True positive (N) | 6 | 6 | 6 | 6 | 6 | 6 | 6 | 6 | 6 |
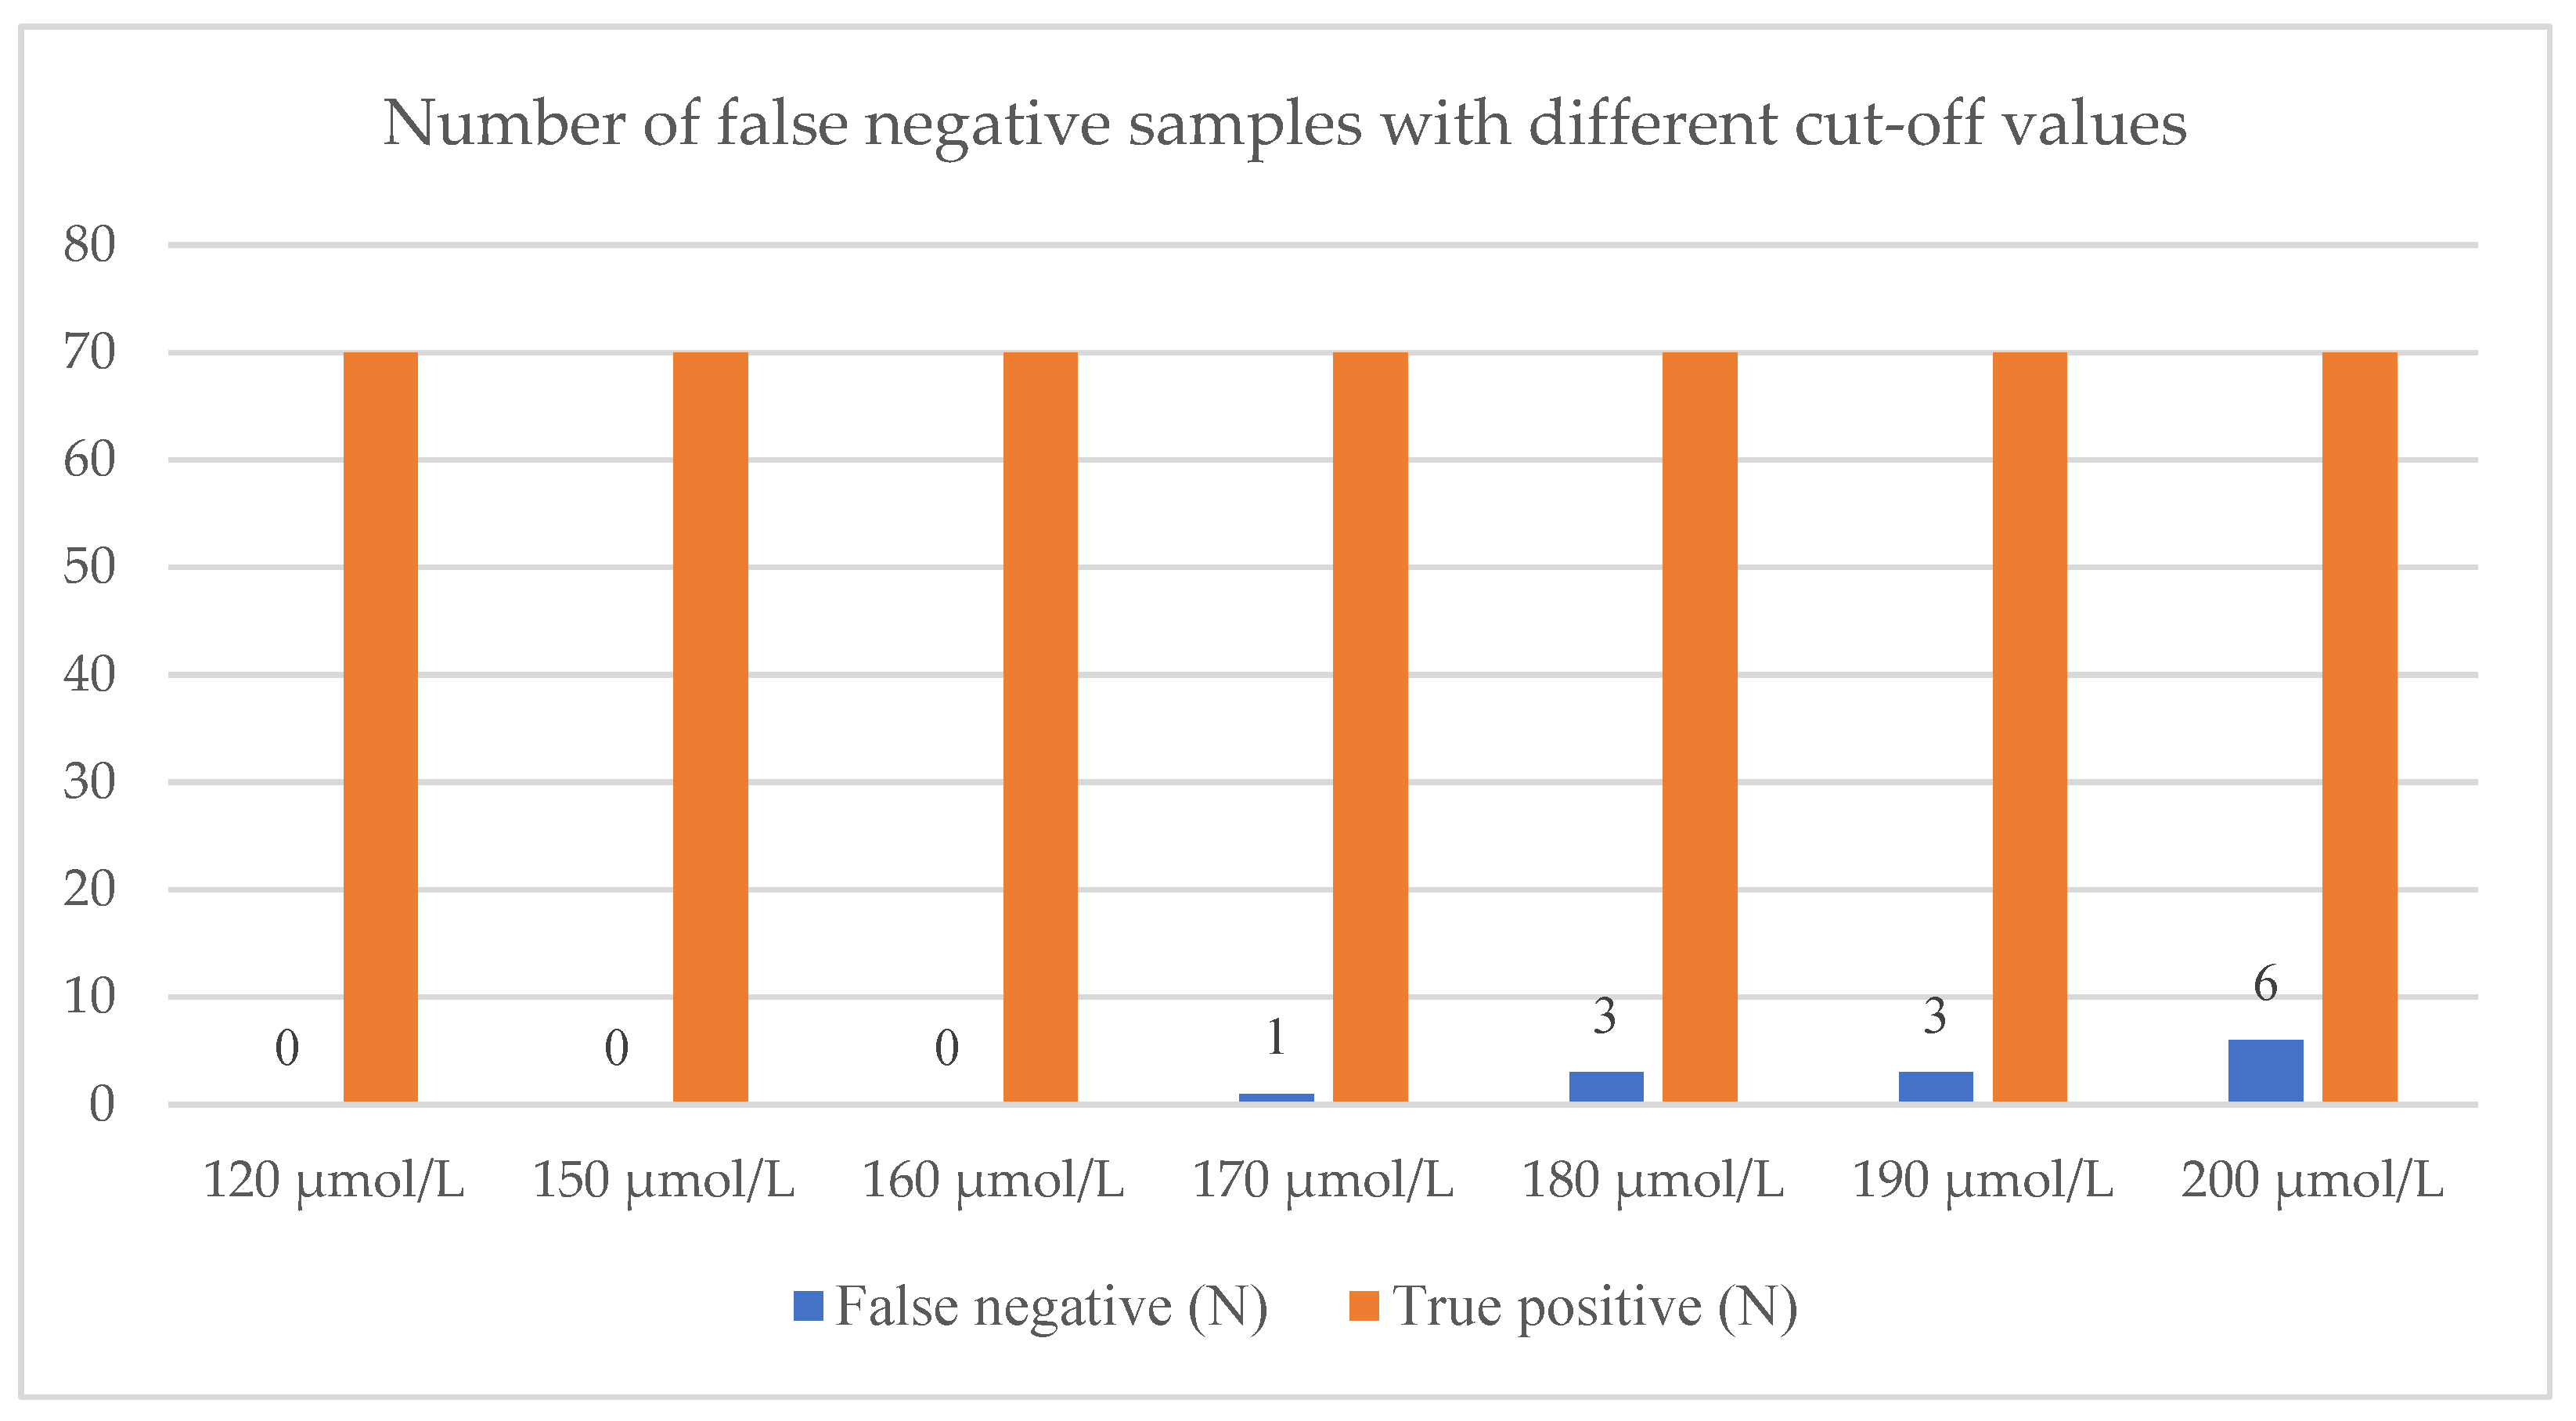
| False negative (N) | 0 | 0 | 0 | 0 | 0 | 0 | 0 | 0 | 0 |
| True negative (N) | 37,676 | 37,743 | 37,763 | 37,768 | 37,772 | 37,773 | 37,773 | 37,775 | 37,775 |
| Detection rate (%) | 0.019 | 0.019 | 0.019 | 0.019 | 0.019 | 0.019 | 0.019 | 0.019 | 0.019 |
| Sensitivity (%) | 100 | 100 | 100 | 100 | 100 | 100 | 100 | 100 | 100 |
| Specificity (%) | 99.73 | 99.91 | 99.96 | 99.97 | 99.98 | 99.99 | 99.99 | 99.99 | 99.99 |
| Positive predictive value (%) | 5.56 | 14.63 | 28.57 | 37.50 | 50.00 | 54.55 | 54.55 | 66.67 | 66.67 |
| Negative predictive value (%) | 100 | 100 | 100 | 100 | 100 | 100 | 100 | 100 | 100 |
Publisher’s Note: MDPI stays neutral with regard to jurisdictional claims in published maps and institutional affiliations. |
© 2022 by the authors. Licensee MDPI, Basel, Switzerland. This article is an open access article distributed under the terms and conditions of the Creative Commons Attribution (CC BY) license (https://creativecommons.org/licenses/by/4.0/).
Share and Cite
Perko, D.; Repic Lampret, B.; Remec, Z.I.; Zerjav Tansek, M.; Drole Torkar, A.; Krhin, B.; Bicek, A.; Oblak, A.; Battelino, T.; Groselj, U. Optimizing the Phenylalanine Cut-Off Value in a Newborn Screening Program. Genes 2022, 13, 517. https://0-doi-org.brum.beds.ac.uk/10.3390/genes13030517
Perko D, Repic Lampret B, Remec ZI, Zerjav Tansek M, Drole Torkar A, Krhin B, Bicek A, Oblak A, Battelino T, Groselj U. Optimizing the Phenylalanine Cut-Off Value in a Newborn Screening Program. Genes. 2022; 13(3):517. https://0-doi-org.brum.beds.ac.uk/10.3390/genes13030517
Chicago/Turabian StylePerko, Dasa, Barbka Repic Lampret, Ziga Iztok Remec, Mojca Zerjav Tansek, Ana Drole Torkar, Blaz Krhin, Ajda Bicek, Adrijana Oblak, Tadej Battelino, and Urh Groselj. 2022. "Optimizing the Phenylalanine Cut-Off Value in a Newborn Screening Program" Genes 13, no. 3: 517. https://0-doi-org.brum.beds.ac.uk/10.3390/genes13030517