Article

Transcriptome Analysis Reveals Altered Expression of Genes Involved in Hypoxia, Inflammation and Immune Regulation in Pdcd10-Depleted Mouse Endothelial Cells

1
Division of Medical Genetics, Fondazione IRCCS-Casa Sollievo della Sofferenza, 71013 Foggia, Italy
2
Next Generation Diagnostic s.r.l., 80078 Pozzuoli, Italy
3
Vascular Biology Unit, FIRC Institute of Molecular Oncology Foundation (IFOM), 20139 Milan, Italy
4
Armenise/Harvard Laboratory of Integrative Genomics, Telethon Institute of Genetics and Medicine (TIGEM), 80078 Pozzuoli, Italy
5
Department of Translational Medicine, University of Naples “Federico II”, 80126 Naples, Italy
6
School for Advanced Studies, Genomics and Experimental Medicine Program, University of Naples “Federico II”, 80126 Naples, Italy
*
Author to whom correspondence should be addressed.
Submission received: 22 March 2022 / Revised: 18 May 2022 / Accepted: 20 May 2022 / Published: 27 May 2022
(This article belongs to the Special Issue Genomics of Stroke)

Abstract

:
Cerebral cavernous malformations (CCM) are capillary malformations affecting the central nervous system and commonly present with headaches, epilepsy and stroke. Treatment of CCM is symptomatic, and its prevention is limited. CCM are often sporadic but sometimes may be multifocal and/or affect multiple family members. Heterozygous pathogenic variants in PDCD10 cause the rarest and apparently most severe genetic variant of familial CCM. We carried out an RNA-Seq and a Q-PCR validation analysis in Pdcd10-silenced and wild-type mouse endothelial cells in order to better elucidate CCM molecular pathogenesis. Ninety-four differentially expressed genes presented an FDR-corrected p-value < 0.05. A functionally clustered dendrogram showed that differentially expressed genes cluster in cell proliferation, oxidative stress, vascular processes and immune response gene-ontology functions. Among differentially expressed genes, the major cluster fell in signaling related to inflammation and pathogen recognition, including HIF1α and Nos2 signaling and immune regulation. Validation analysis performed on wild-type, Pdcd10-null and Pdcd10-null reconstituted cell lines was consistent with RNA-Seq data. This work confirmed previous mouse transcriptomic data in endothelial cells, which are recognized as a critical tissue for CCM formation and expands the potential molecular signatures of PDCD10-related familial CCM to alterations in inflammation and pathogen recognition pathways.

1. Introduction

Cerebral cavernous malformations (CCM) are common vascular malformations derived from capillaries and small vessels of the central nervous system (CNS) [1]. Major clinical manifestations include intracranial haemorrhage, seizures and headache. Given the clinical unpredictability of CCM, surgery, stereotactic radiosurgery, pain medications and pharmacological prevention of seizures are the only therapeutic resources after neuroimaging detection of an otherwise unexpected lesion or, more commonly, after abrupt or subacute manifestations. Disease prevalence is estimated at 0.16–0.5% in the general population and often occurs sporadically [2]. More rarely, CCM may be multifocal and/or aggregate in families (familial CCM—FCCM) [3]. FCCM are caused by heterozygous, deleterious variants in either one of three genes encoding for interacting proteins, comprising Krev1 Interaction Trapped 1 (KRIT1; CCM1; MIM#604214), Malcavernin (alias MGC4607; CCM2; MIM#607929) and Programmed Cell Death 10 (PDCD10; CCM3; MIM#609118). Loss-of function is the prevalent molecular mechanism in FCCM. Genotype–phenotype correlations in FCCM are poor, and molecular data have limited clinical applications to date. More recently, the identification of a deleterious variant in either one of the known genes was considered mandatory for clinical trial enrolment in FCCM [4]. A better understanding of the biological diversity underpinning clinical variability in FCCM will improve prognostication, management planning and treatment approaches for future patients.
Alterations of PDCD10 are the rarest genetic cause of FCCM and tend to associate with a more aggressive phenotype with an earlier age of onset [5]. The encoded protein is identified as a key molecule for intracranial angiogenesis and endothelial cell homeostasis in both in vitro studies and animal disease models. In particular, studies in isolated endothelial cells show that Pdcd10-mediated pathways include Notch signaling, VEGF signaling and the ERK/MAPK pathway [6,7]. Zebrafish models reveal that Pdcd10 plays an essential role in early embryonic angiogenesis and cardiovascular development [8,9,10,11]. Furthermore, the murine Pdcd10 model shows that the Pdcd10 protein takes part in different intracellular signaling, which affects cell junction, apoptosis and stress responses [12]. Despite the many collected biochemical in vitro and in vivo data on PDCD10, the molecular pathogenesis of PDCD10-related FCCM remains only partially understood, and this lack of knowledge impacts the development of tailored patient’s management.
Here, we explored the consequences of Pdcd10 silencing in mouse endothelial cells (ECs) by employing a transcriptomic analysis. This study allowed us to identify novel Pdcd10-controlled molecular pathways and offered the possibility of providing novel insights into FCCM pathogenesis and therapeutic targets.

2. Materials and Methods

2.1. Cell Lines

An immortalized mouse aortic EC line was generously gifted by Prof. Francesca Boccafoschi (Health Science Department, University of Piemonte Orientale, Novara, Italy). Cells were cultured in D-MEM with Glutamax supplemented with 20% FBS, 1% penicillin (100 U/mL) and streptomycin (100 μg/mL) (Thermo Fisher Scientific, Waltham, MA, USA) and grown in a 5% CO2 incubator at 37 °C. For validation studies, immortalized mouse lung-derived endothelial cell lines of either wild-type or knocked out for Pdcd10 (here named as EC-Ctrl, Pdcd10iEC-KO, respectively) and endothelial cell lines from Pdcd10 knockout mice, to which the human PDCD10 (here named as Pdcd10iEC-KO+Pdcd10) were re-added, were cultured as described in [13]. In brief, to generate Pdcd10−/− cells re-expressing mGFP-tagged PDCD10, Pdcd10−/− were transduced with the recombinant lentivirus Lenti ORF clone mGFP-tagged PDCD10 (OriGene Technologies Inc., Rockville, MD, USA). The human PDCD10 aminoacid sequence presents a single substitution (p.V192I) compared to the Pdcd10 mouse protein. The Lenti ORF clone mGFP-tagged PDCD10 vector was already used in mouse cells as reported in [13]. The recombinant lentiviruses were resuspended in serum-free MCDB-131 medium and added to the cells for 1 h at 37 °C. To increase the number of the cells, the cells were then passaged four times.

2.2. RNA Interference

Stealth RNAi duplexes designed against Pdcd10 (Thermo Fisher Scientific, Waltham, MA, USA) or stealth RNAi negative control (Thermo Fisher Scientific, Waltham, MA, USA) were transfected in EC cells (here named as siPdcd10-ECs and siCNT-ECs, respectively) using Lipofectamine RNAiMAX (Thermo Fisher Scientific, Waltham, MA, USA) and according to the manufacturer’s protocol.

2.3. Western Blotting

The EC line was plated in six-well culture dishes at a density of 1 × 10⁵ cells/mL and then transfected with the indicated Stealth RNAi duplexes. After 48 h, cells were lysed in 1x D-PBS, 0.025% NP-40 and protease- and phospho-inhibitors (Roche, Pasadena, CA, USA). Total cell lysates were analyzed by 10% SDS-PAGE page electrophoresis, transferred to nitrocellulose membrane and blotted with anti-Pdcd10 (Proteintech Cat#10294-2-AP, RRID: AB_2162153) and anti-β-Actin (Santa Cruz Biotechnology Cat#sc-47778 HRP, RRID:AB_2714189) [14,15,16] antibodies. The specificity of the anti-Pdcd10 antibody was determined through Pdcd10 silencing by comparing the control and silenced cell line. Horseradish peroxidase-conjugated anti-rabbit Ab (Bio-Rad Cat# 1706515, RRID:AB_2617112) was used as a secondary antibody [17,18].

2.4. RNA Extraction

Total RNA was extracted using a mini RNase kit reagent (Qiagen, Hilden, Germany). The quality of nucleic acids was assessed using Nanodrop ND1000 (EuroClone, Milan, Italy). The RNA quantity was evaluated by Qubit RNA BR Assay Kit (Thermo Fisher Scientific, Waltham, MA, USA). The RNA integrity was assessed by the RNA Integrity Number (RIN) using the Agilent RNA 6000 Nano Kit on the BioAnalyzer 2100 (Agilent, Boulder, CO, USA). All analyzed samples displayed a RIN above 9.50.

2.5. Library Preparation

Total RNA of siPdcd10-EC and siCNT-EC lines from three replicas of each cell type was quantified using the Qubit 2.0 fluorimetric Assay (Thermo Fisher Scientific, Waltham, MA, USA). A poly-A enriched library was generated with the TruSeq RNA-Seq Library Preparation Kit v2 (#RS-122-2001, Illumina, San Diego, CA, USA) according to the manufacturer’s instructions. Library quality control was performed using the Agilent 2100 Bioanalyzer. Indexed libraries were sequenced at the CRS4 Next Generation Sequencing facility with the HiSeq 3000 instrument to generate ~40 M 50 bp single-end reads per sample. Read and library quality was assessed by running FastQC (RRID:SCR_014583) and RSeQC (RRID:SCR_005275) [19] on FASTQ and aligned BAM generated with STAR. Transcript abundance was estimated with Kallisto [20], and differentially expressed genes (DEGs) were identified using DeSeq2 (RRID:SCR_015687) [21] R package with an FDR corrected p-value < 0.05. Enrichment analysis was performed with ToppCluster (RRID:SCR_001503) [22].

2.6. Quantitative PCR (qPCR)

Total RNA from siPdcd10-EC and siCNT-EC and from Pdcd10iEC-KO, EC-Ctrl and Pdcd10iEC-KO+Pdcd10 was reverse transcribed using the RT2 First Strand Kit (Qiagen, Hilden, Germany), according to the manufacturer’s instructions. Oligos for the quantitative real-time PCR (Q-PCR) were designed using the Primer express program (RRID:SCR_014326) [23] with default parameters (Table S1). Gapdh and Actin were used as reference genes. The reactions were run in triplicate in 10 μL of final volume with 10 ng of sample cDNA, 0.3 mM of each primer and 1XPower SYBR Green PCR Master Mix (Thermo Fisher Scientific-Applied Biosystems, Carlsbad, CA, USA). Reactions were set up in a 384-well plate format with a Biomeck 2000 (Beckmann Coulter, Carlsbad, CA, USA) and run in an ABI Prism7900HT (Thermo Fisher, Scientific-Applied Biosystems, Carlsbad, CA, USA) with default amplification conditions. Raw Ct values were obtained using SDS 2.4 (Applied Biosystems, Carlsbad, CA, USA). Calculations were carried out by the comparative Ct method as reported in [24]. Significance was determined by a two-tailed unpaired t-test for means [24].

2.7. Bioinformatics Workflow

The raw data were analyzed by Next Generation Diagnostics srl, which is the proprietary of the full-length mRNA-seq pipeline (v1.0) comprising quality control, alignment to the reference and counting steps [25]. The raw expression data were normalized, analyzed and visualized by Rosalind HyperScale architecture (RRID:SCR_006233) [21] (Hennig, C. Cran-package fpc. released on 6 December 2020 https://cran.r-project.org/web/packages/fpc/index.html) (OnRamp BioInformatics, Inc.; San Diego, CA, USA).
Clustering of genes for the final heatmap of differentially expressed genes was carried out using the PAM (Partitioning Around Medoids) method using the fpc R library (https://cran.r-project.org/web/packages/fpc/index.html published 6 December 2020). Enrichment analysis for Gene Onthology was conducted using the topGO package [26].
Several database sources were referenced for enrichment analysis, including Interpro, NCBI, MSigDB, REACTOME and WikiPathways. Enrichment was calculated relative to a set of background genes relevant to the experiment. The top 50 biological process terms for Elim p-value were analyzed with Revigo [27].
All datasets sequencing data were deposited to Gene Expression Omnibus (GEO) (https://0-www-ncbi-nlm-nih-gov.brum.beds.ac.uk/geo/query/acc.cgi?acc=GSE186523; ID number: GSE186523 released on 1 October 2022).

2.8. Confocal Microscopy

For immunocytochemical analysis, EC-Ctrl and Pdcd10iEC-KO cells were plated in 12-well culture dishes at a density of 1 × 55 cells/mL and then fixed in 4% paraformaldehyde and incubated with 0.5% Triton-X100 in phosphate-buffered saline for 1 h. After, the cells were counterstained with anti-PECAM1 antibody (1:50; 551,262; BD Pharmingen) for 2 h at room temperature, followed by incubation with Alexa Fluor goat anti-mouse IgG (1:500 dilution, #A11011 Thermo Fisher Scientific, Waltham, MA, USA), for 2 h at room temperature finally with 4,6-diamidino-2-phenylindole (DAPI, Molecular Probes, #D1306).
Confocal microscopy was performed using a confocal microscope (TCS SP5, Leica, Wetzlar, Germany), with the ImageJ software (NIH, New York, NY, USA) used for image analysis.

2.9. Statistical Analysis

Statistical analysis of immunoblotting and Q-PCR assays were performed using an unpaired, two-tailed Student’s t-test (Excel software) (* p < 0.05, ** p < 0.01).

3. Results

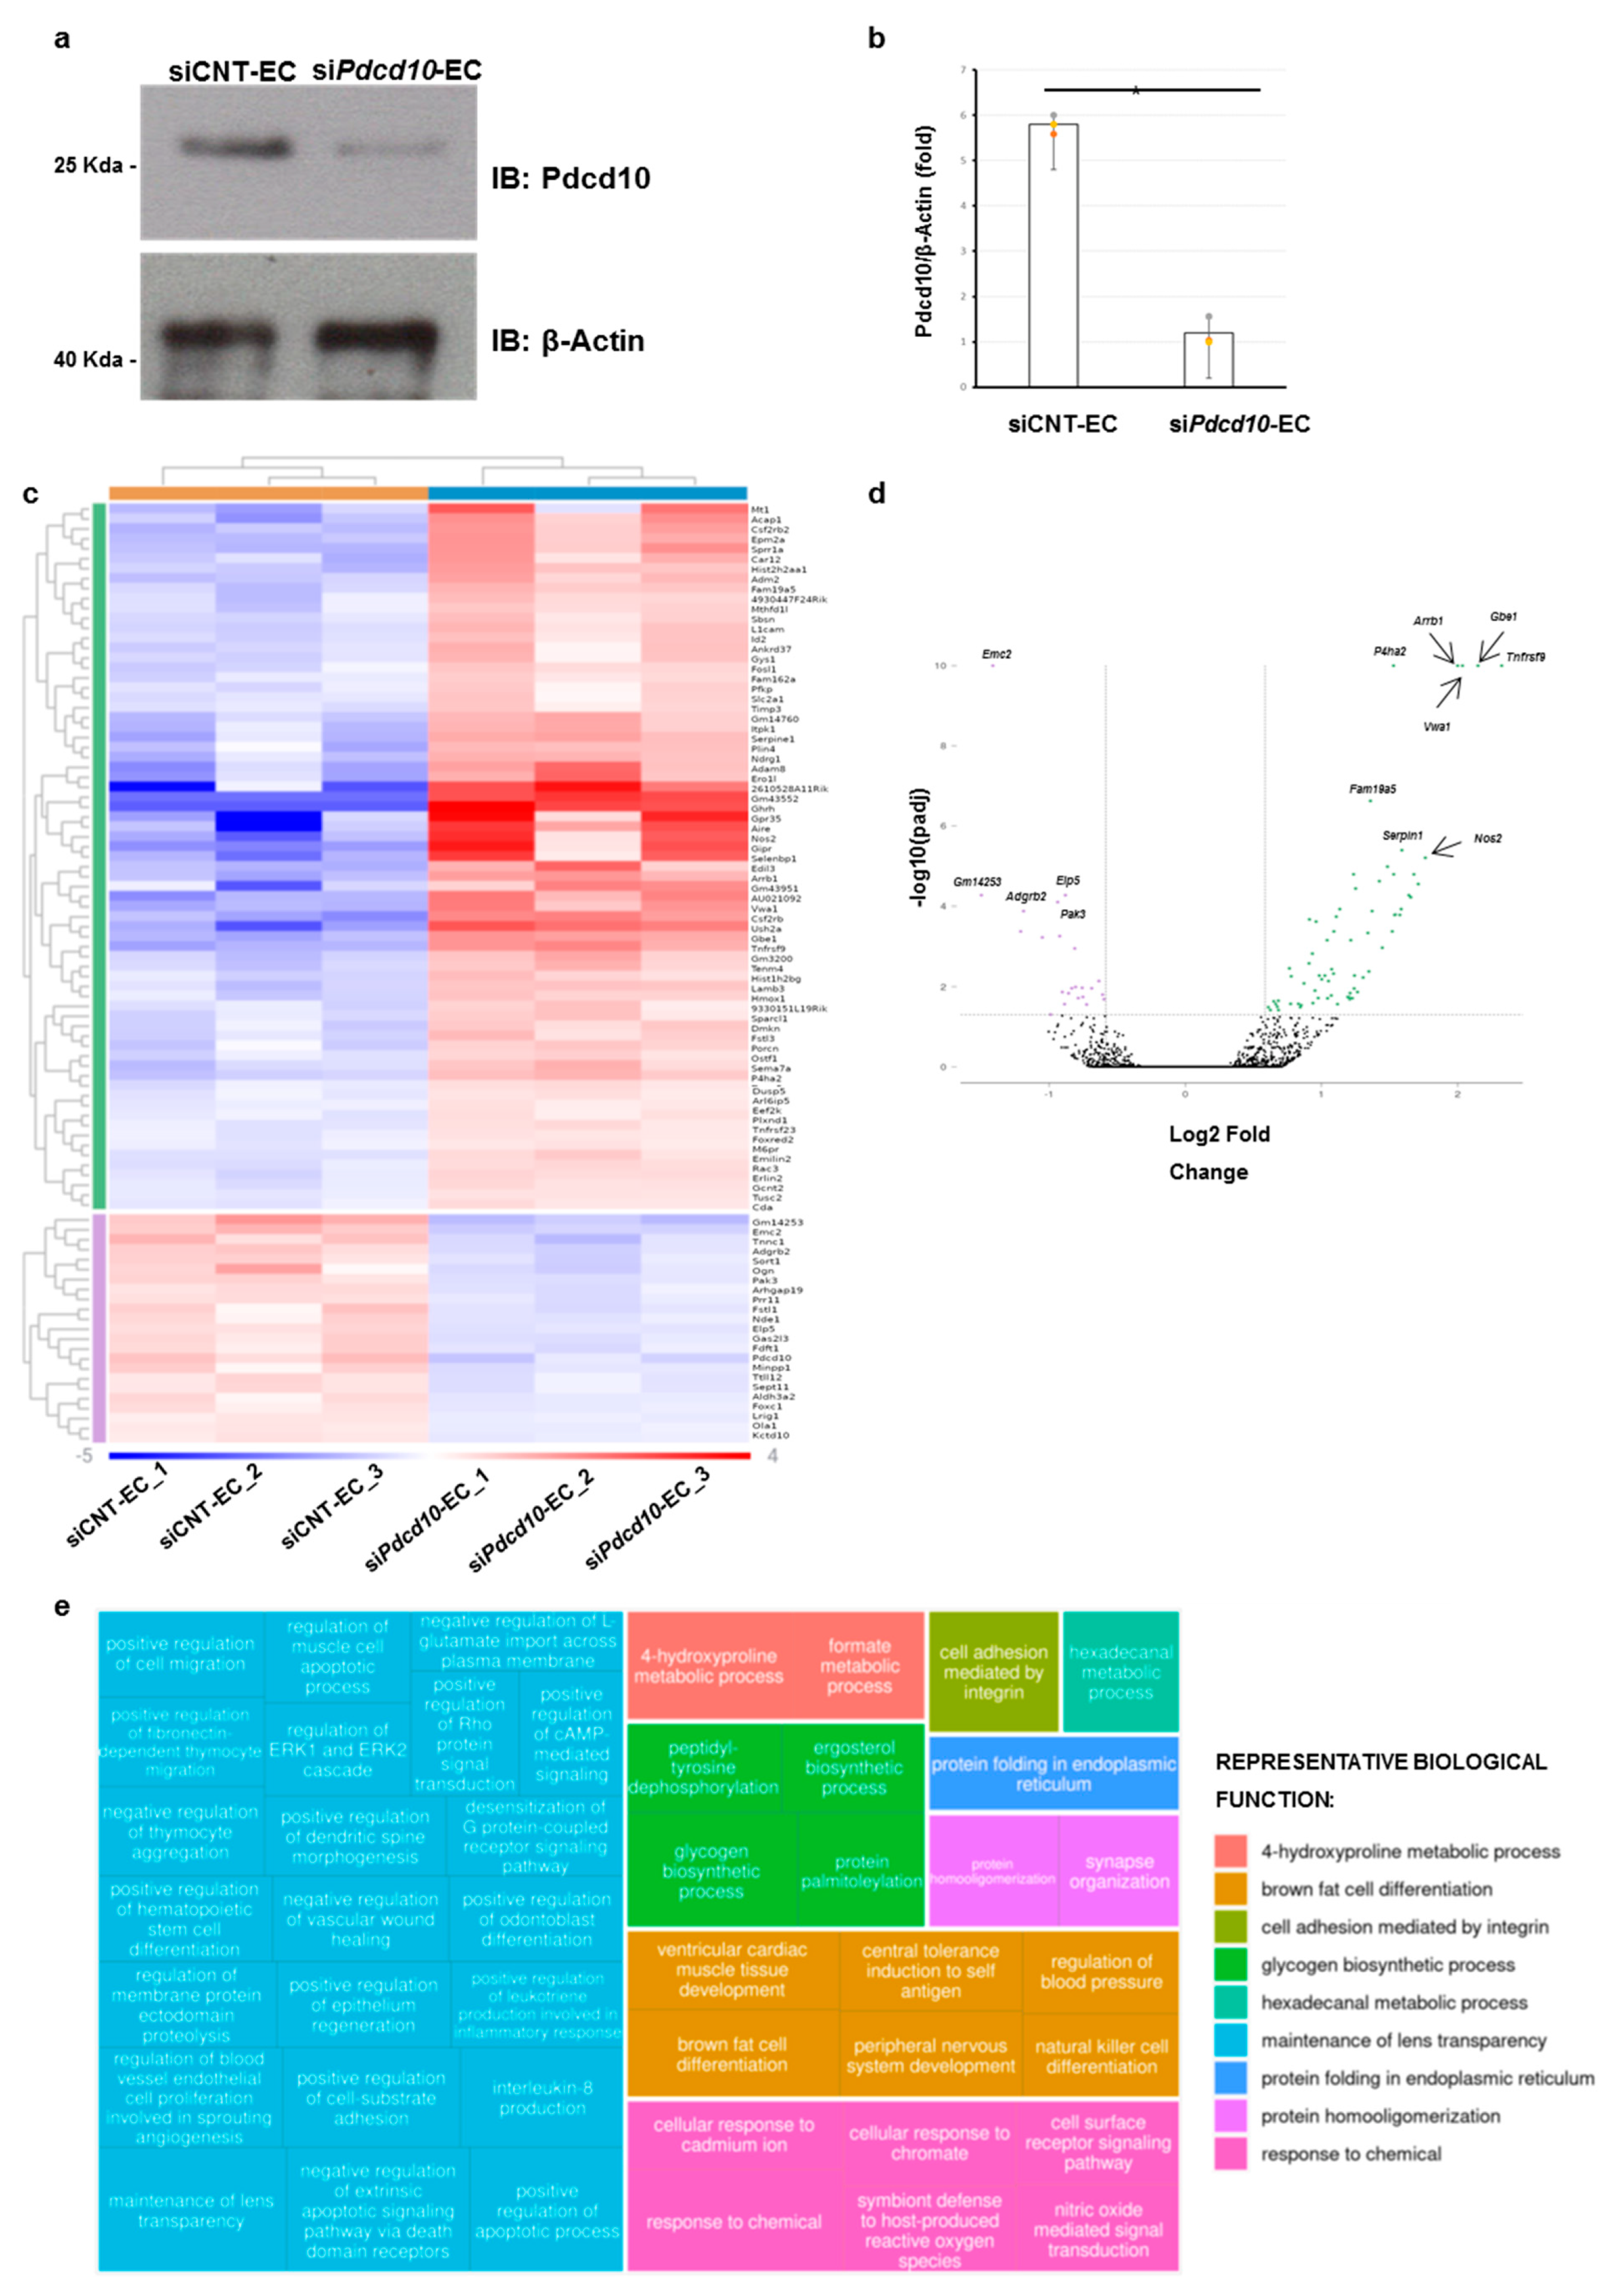
3.1. Pdcd10-Related Transcriptomic Profile

In order to identify novel molecular pathways potentially altered by Pdcd10 silencing, we carried out RNA-sequencing (RNA-seq) analysis in wild-type (i.e., siCNT-EC) and Pdcd10-silenced lines (i.e., siPdcd10-EC) from aortic murine immortalized ECs. An in vitro culture of mouse ECs were previously used for exploring the molecular pathogenesis of FCCM, as these cells can be considered the counterpart of human endothelial tissue [28]. We first silenced Pdcd10 in the EC line by the transfection of specific Stealth RNAi for Pdcd10. We found a reduction of ~80% protein level in siPdcd10-EC compared to siCNT-EC by Western blot assay (Figure 1a,b).
Transcriptome analysis revealed 94 DEGs with an adjusted p-value (pAdj) < 0.05. The expression of 94 DEGs differed significantly by at least 1.5-fold change (71 upregulated genes vs. 23 downregulated genes) (Figure 1c, Table 1 and Table S2). Figure 1d represent the volcano plot illustrating the 94 DEGs with a -log10(p-adj) threshold of at least 1.3. Among the most upregulated genes in siPdcd10-EC, we identified the TNF Receptor Superfamily Member 9 gene (Tnfrsf9, Entrez Gene ID (E_ID): 21942; log fold change (LogFc) = 2.323), the 1,4-alpha-Glucan Branching Enzyme 1 (Gbe1, E_ID: 74185; LogFc = 2.15), the Arrestin beta 1 gene (Arrb1, E_ID: 109689; LogFc = 2.000), the Von Willebrand Factor A Domain Containing 1 gene (Vwa1, E_ID: 246228; LogFc = 2.035) and the Prolyl 4-Hydroxylase Subunit alpha 2 (P4ha2, E_ID: 18452; LogFc = 1.5289) mainly involved in cytokine and immunological systems. Among the downregulated genes, the ER Membrane Protein Complex Subunit 2 (Emc2, E_ID: 66736; LogFc = −1.413), the Adhesion G Protein-Coupled Receptor B2 (Adgrb2, E_ID: 230775; LogFc = −1.05) and the P21 (RAC1) Activated Kinase 3 (Pak3, E_ID: 18481; LogFc = −0.93717), which are predominantly associated with angiogenesis and immunological systems, showed the most significant values (Table 1).

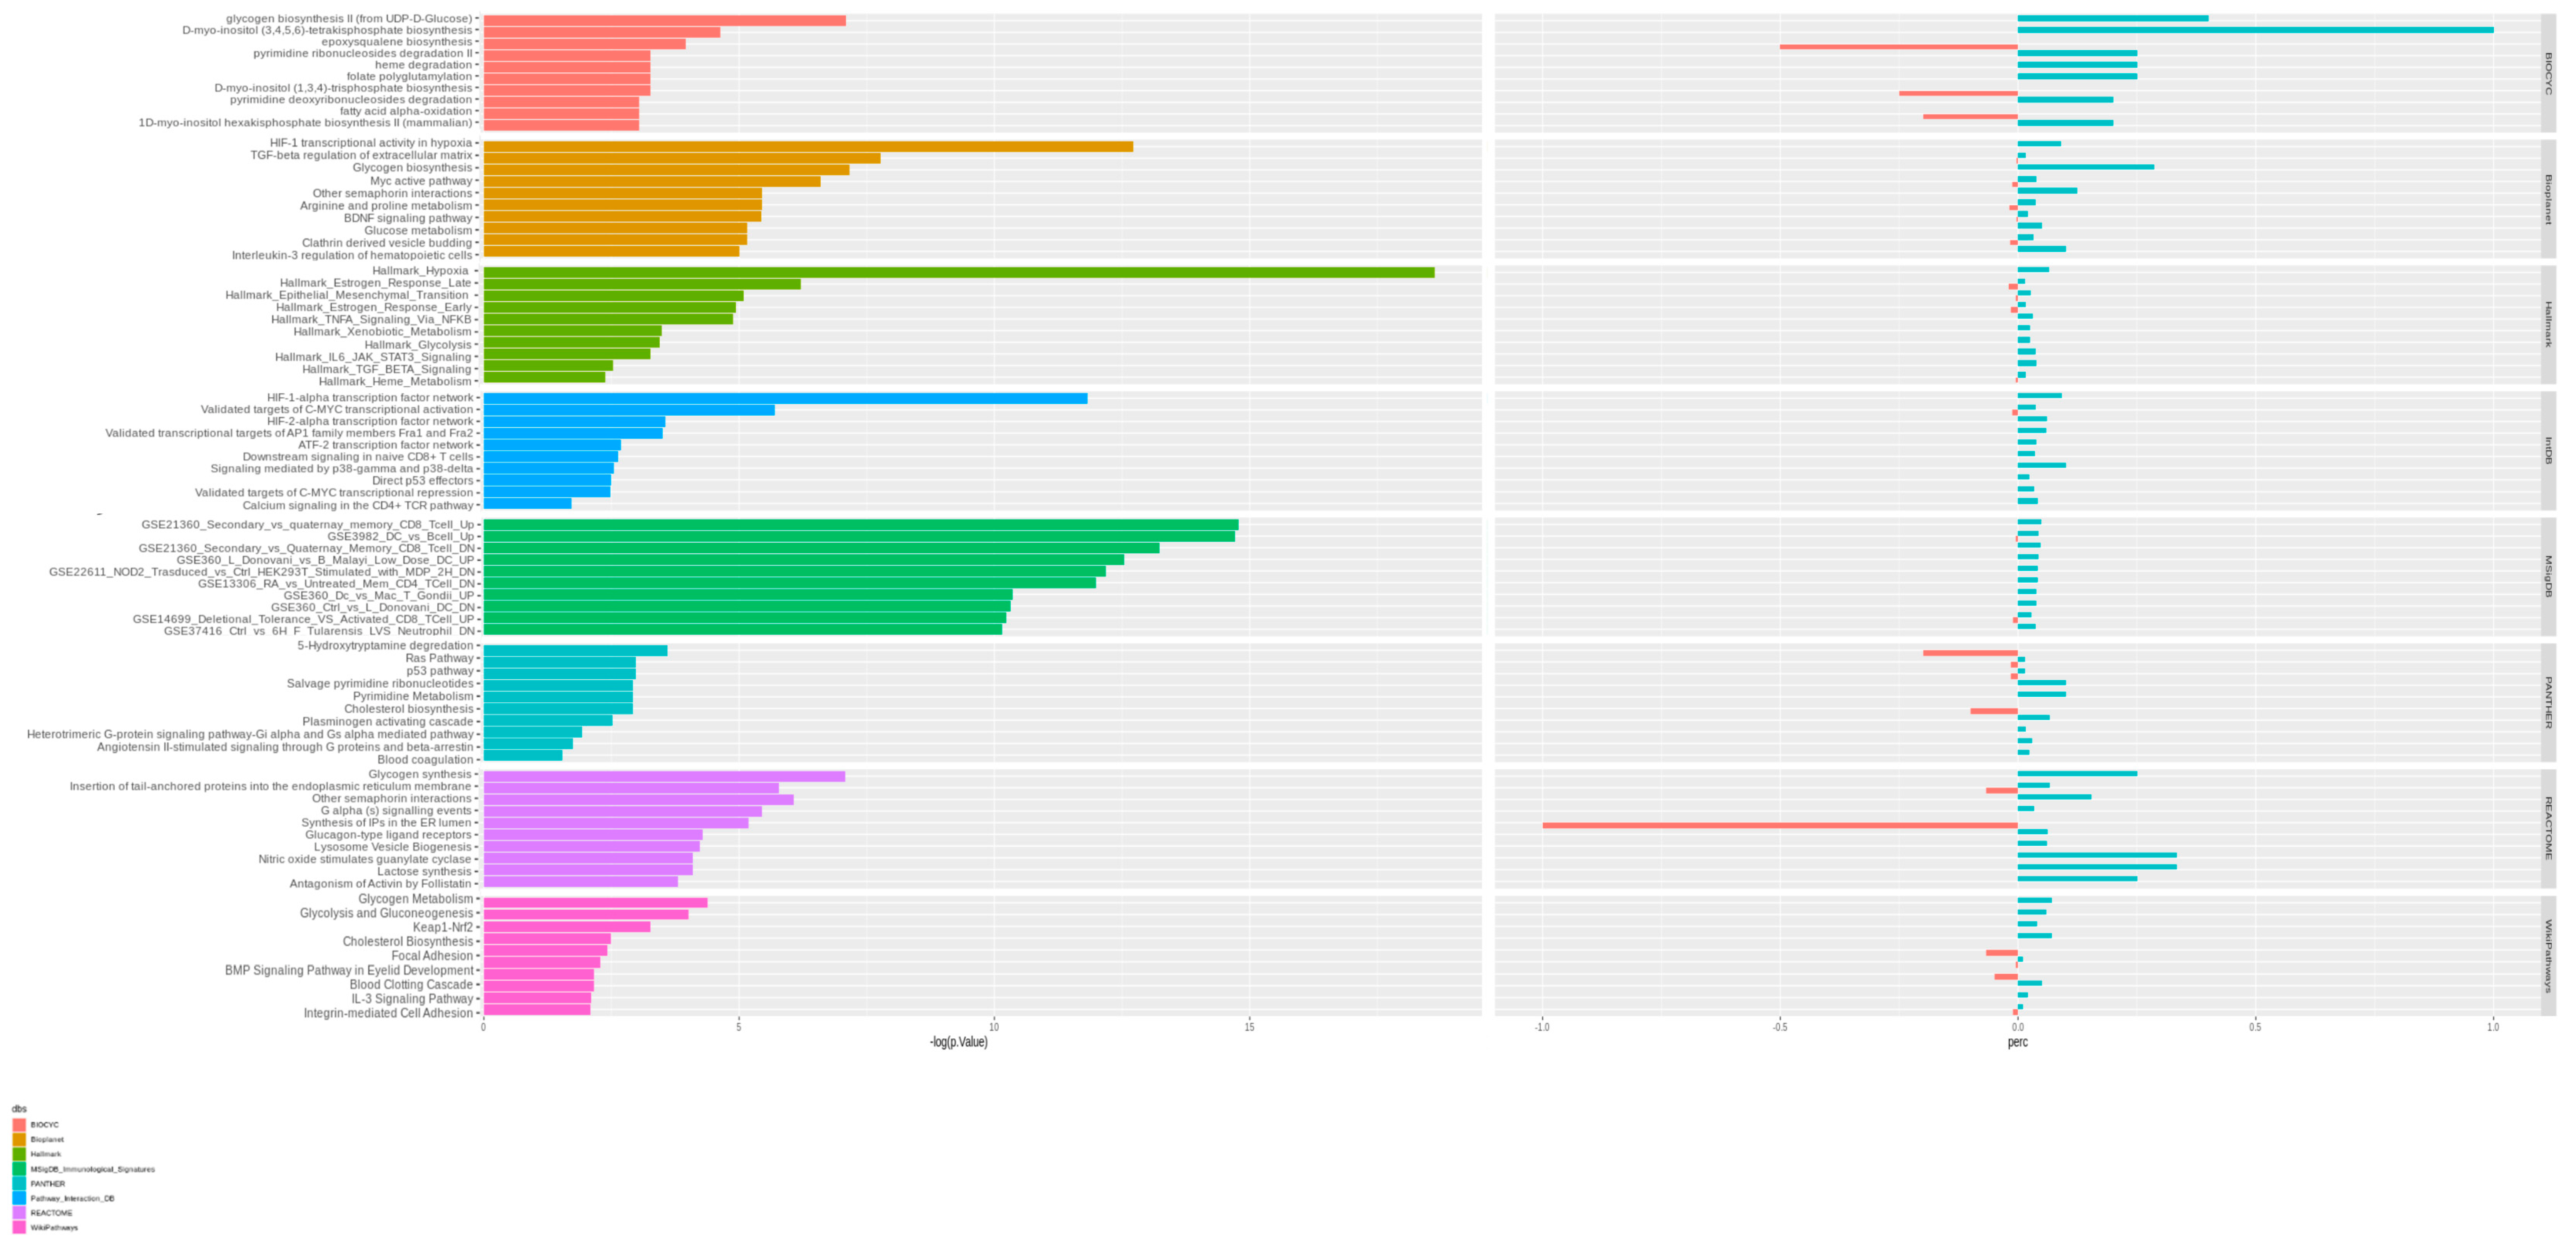
3.2. Pathway Analysis of Differentially Expressed Genes

Gene set functional enrichment analysis using the Rosalind HyperScale web platform identified a number of differently represented biological functions. The top enriched gene ontology functions were related to the 4-hydroxyproline metabolic process, brown fat cell differentiation, cell adhesion mediated by integrin, glycongen biosynthetic process, hexadecanal metabolic process, maintenance of lens transparency, protein folding in the endoplasmic reticulum, protein homooligomeritation and response to chemical (Figure 1e).
Enrichment pathway analysis identified 21 significantly enriched pathways (Figure 2, Table 2 and Table S3). The most significantly altered pathways involve hypoxia (p-Adj = 3.0 × 10⁻⁷, associated with 13 DEGs), HIF-1α transcriptional activity (p-Adj = 0.00020, associated with 6 DEGs), Nod2 signaling (p-Adj = 0.00352, associated with 8 DEGs) and selected immunological signatures related to the memory CD8 T-cells (p-Adj = 0.00071, associated with 9 DEGs), IL12-CD8 associated T-cells (p-Adj = 0.01271, associated with 7 DEGs) and the dendritic cell-elicited B-cells activation (p-Adj = 0.04286, associated with 6 DEGs) (Figure 2, Table 2, Table 3 and Table S3).
Among the other significant enrichment pathways there are glycogen biosynthesis (p-Adj = 0.01995, associated with 2 DEGs), estrogen response (p-Adj = 0.03626, associated with 7 DEGs), endothelial-to-mesenchymal transition (End-MT, p-Adj = 0.05306, associated with 6 DEGs) and TNFα signaling (p-Adj = 0.05306, associated with 6 DEGs) (Figure 2, Table 2 and Table S3).

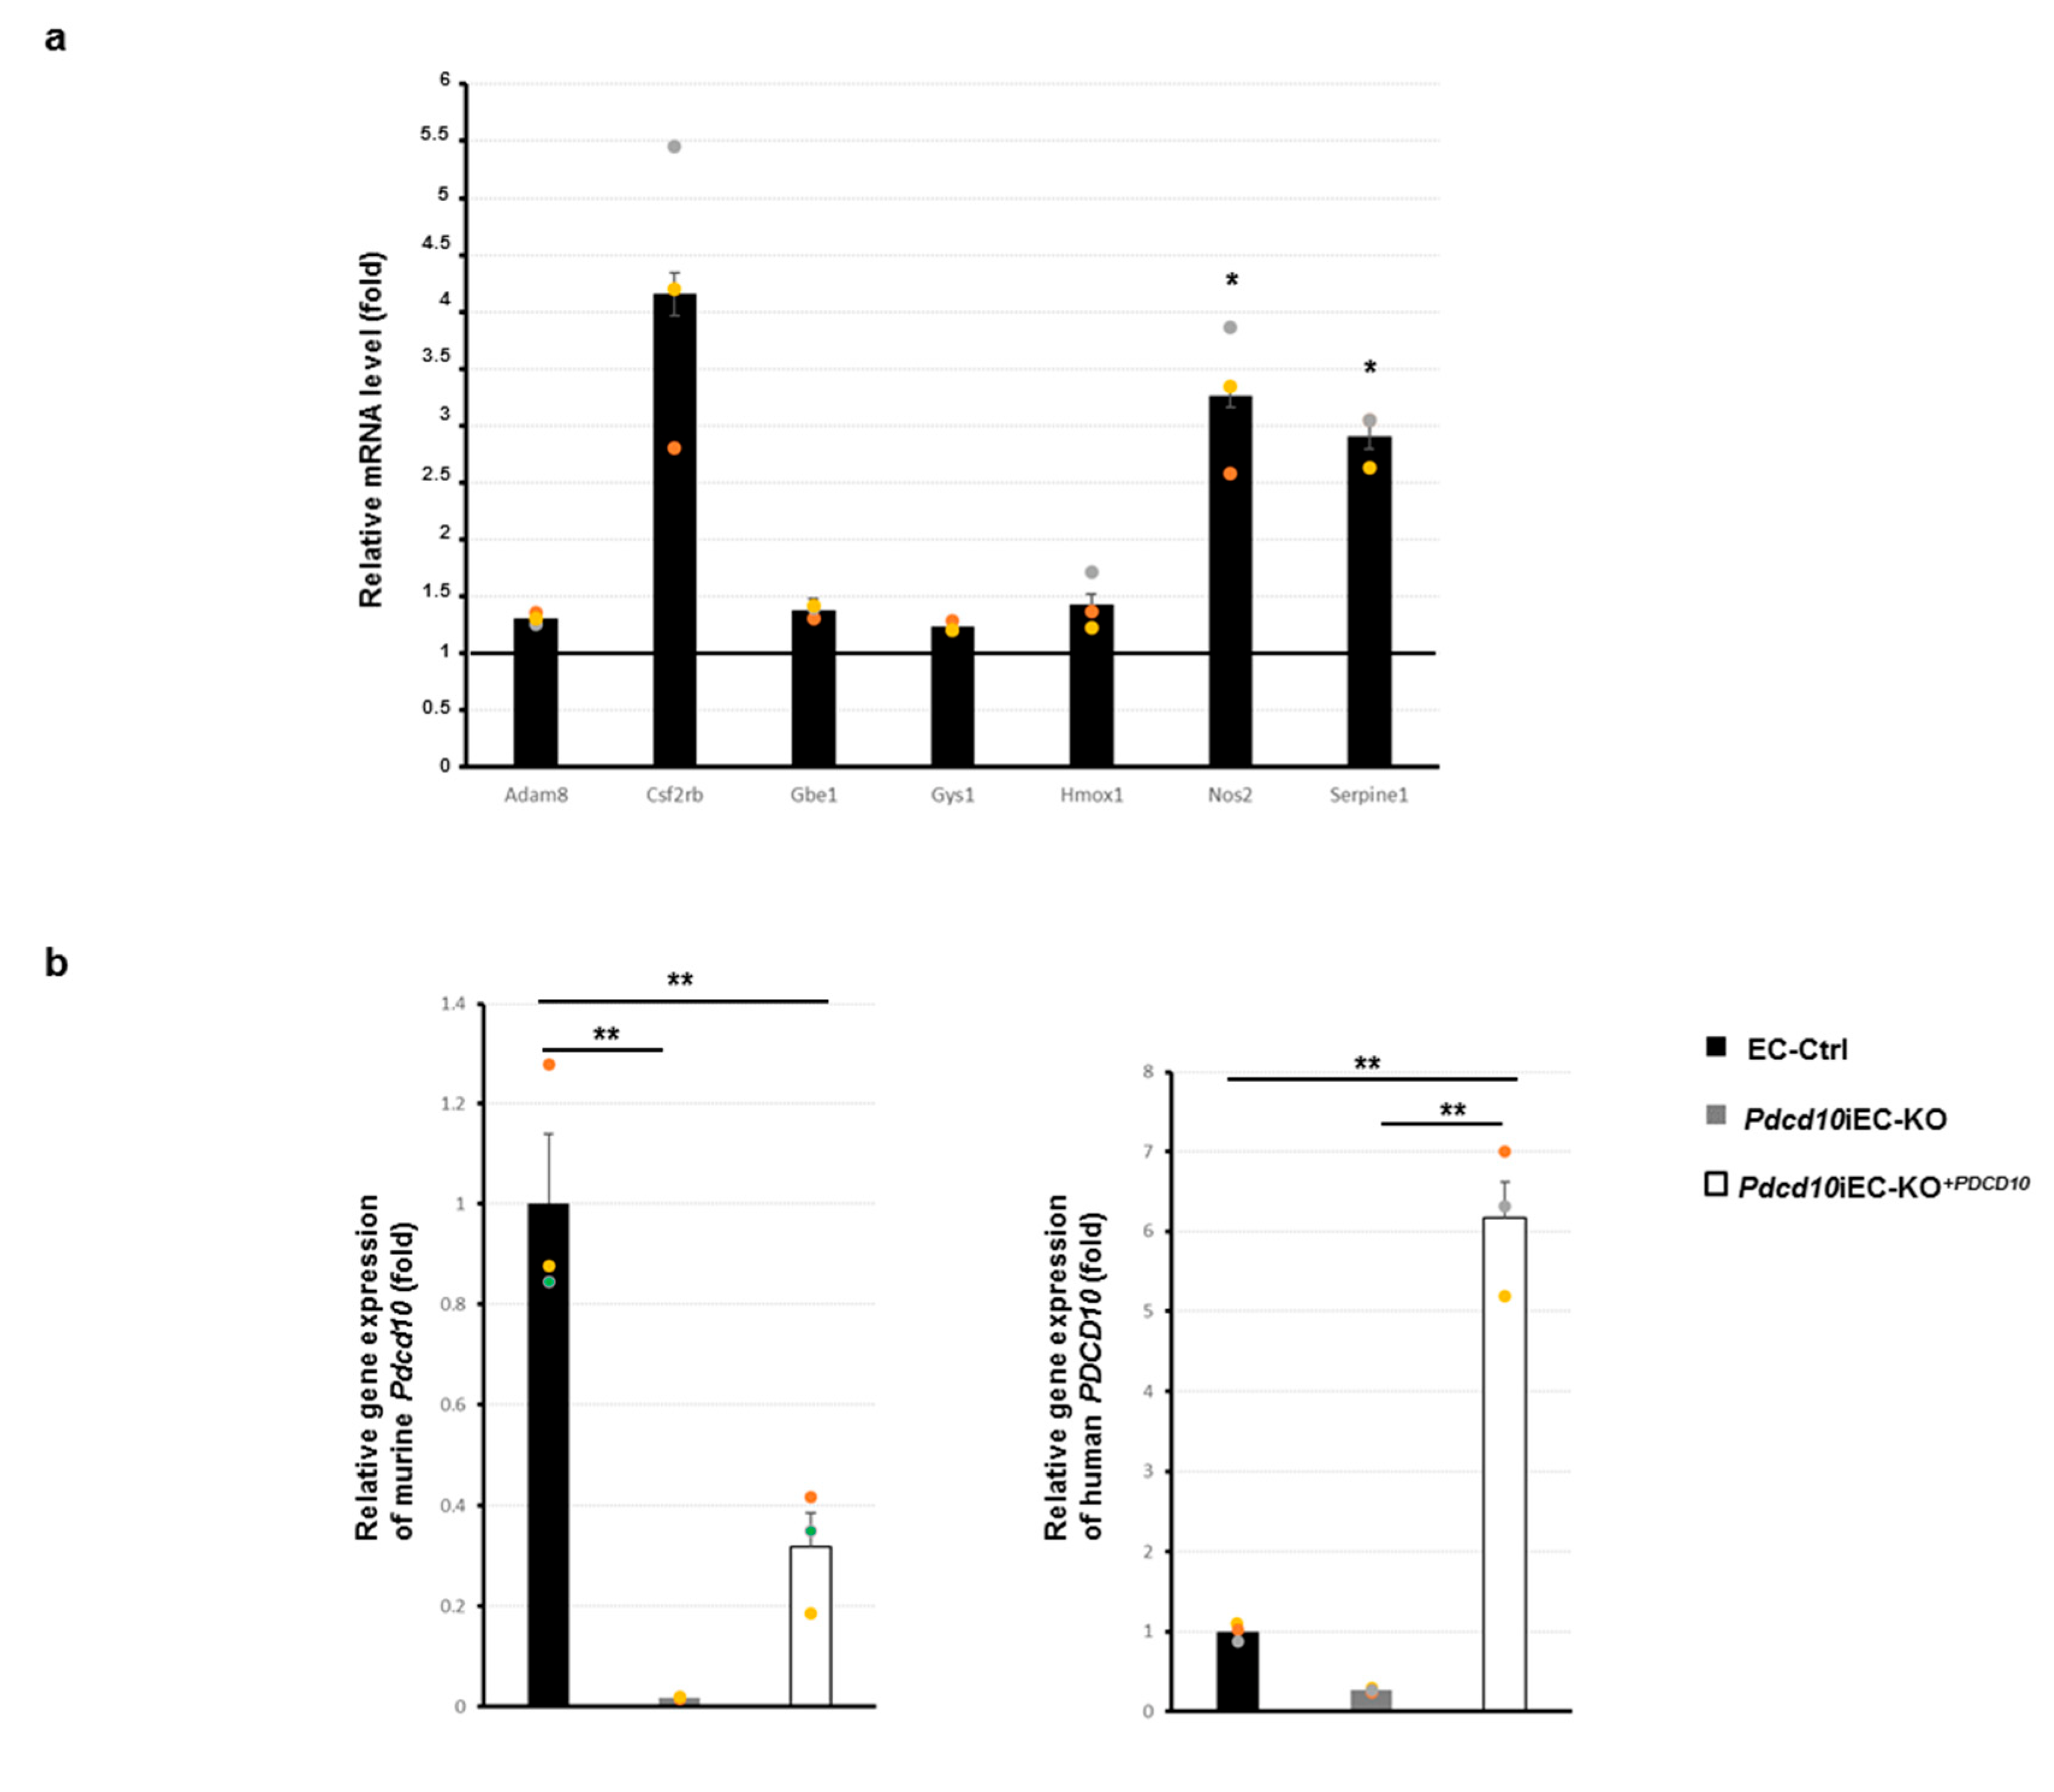
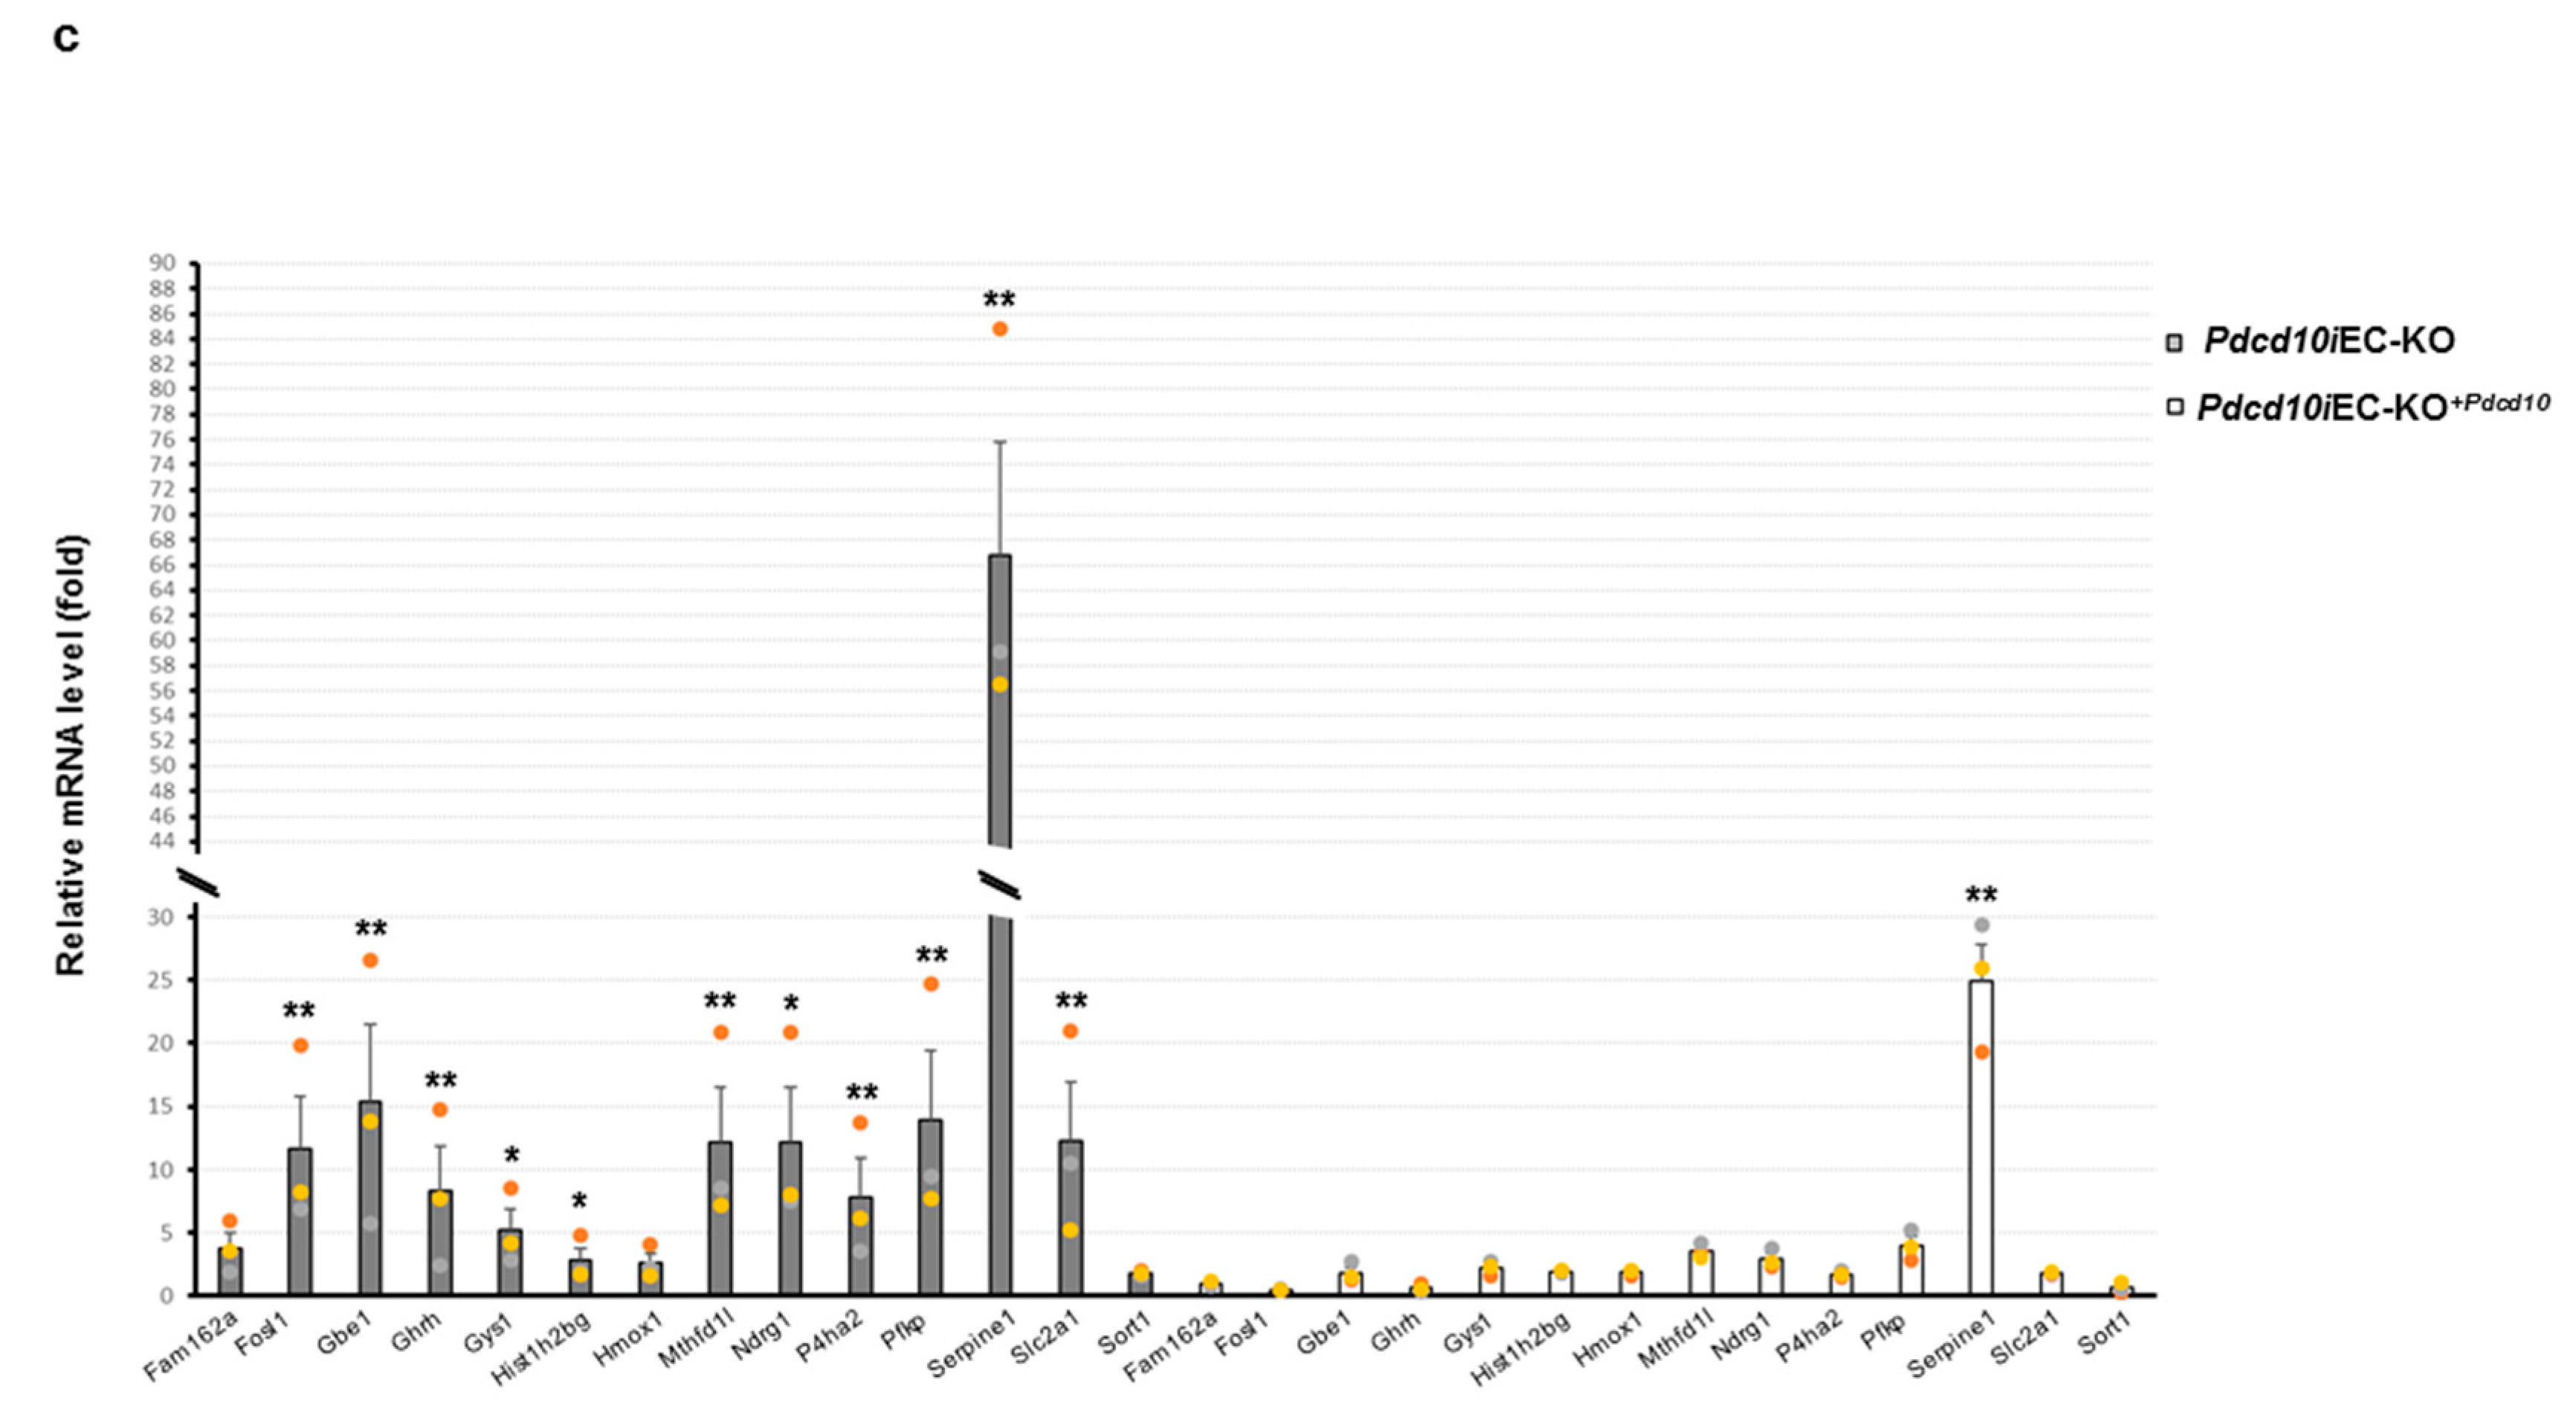
3.3. Validation Study of Differentially Expressed Genes in Mouse Endothelial Cells

To validate the transcriptomic data, we performed Q-PCR analysis in the lung-derived siPdcd10-EC line. We confirmed the upregulation of a set of genes prioritized based on their functional classification that was significantly perturbed in siPdcd10-EC lines, including ADAM Metallopeptidase Domain 8 (Adam8), Colony Stimulating Factor 2 Receptor Subunit beta(Csf2rb), Gbe1, Glycogen Synthase 1 (Gys1), Heme Oxygenase 1 (Hmox1), Nitric Oxide Synthase 2 (Nos2) and Serpin Family E Member 1 (Serpin1), compared to control cell line (Figure 3a). Csf2rb, Hmox1, Nos2 and Serpin1 resulted the most upregulated genes. Transcriptome data were also validated by an independent Q-PCR assay performed on mRNA from either Pdcd10iEC-KO and EC-Ctrl lines and from Pdcd10iEC-KO+Pdcd10, in which the human PDCD10 was over-expressed [13] (Figure 3b). Through analysis of different biological pathways databases, we selected a set of the most representative biological processes (Table S3). Firstly, we stained the Pdcd10iEC-KO and EC-Ctrl cells with the endothelial cell marker PECAM1 in order to verify the endothelial profile (Supplementary Figure S1). Then, we measured the expression of a set of DEGs associated with the main significant deregulated pathways, including hypoxia, HIF-1α, NOD2 and immunological-associated signaling, for which the functional association with PDCD10/Pdcd10 has not been established yet. We showed an upregulation of all tested genes in Pdcd10iEC-KO compared with EC-Ctrl lines, of which 11 resulted upregulated. Furthermore, we also addressed a rescue by a reduction of gene expression in Pdcd10iEC-KO+Pdcd10 cells (Figure 3c). Among them, Serpin 1 resulted more upregulated than the other analyzed genes.

4. Discussion

Here, we carried out a transcriptome profiling analysis in mouse endothelial Pdcd10 silenced cells and validated our findings in ECs obtained from Pdcd10 knockdown mice and from Pdcd10 knockdown mice re-expressing the human PDCD10 in a subset of selected genes by choosing the genes associated with enriched signaling. Novel findings included pathway alterations of hypoxia, HIF-1α, NOD2 signaling, specific immunological pathways, glycogen biosynthesis, End-MT and TNFα signaling.
PDCD10 encodes for an evolutionarily conserved protein physiologically involved in different intracellular signaling pathways such as cell junction, angiogenesis, apoptosis, End-MT and stress responses [12,28]. PDCD10 is highly expressed in the neurovascular unit, and this explains the organ-specific manifestations of FCCM due to heterozygous loss-of-function variants in PDCD10. While current management of FCCM is symptomatic, the growing insights into the FCCM molecular pathogenesis are opening the path to innovative therapies aimed at preventing complications. From this perspective, there are two drug-repurposing clinical trials exploring the efficacy of propranolol and atorvastatin in reducing disease manifestations in adults with CCM [4,29]. Hopefully, a deeper understanding of the subcellular and cellular mechanisms leading to CCM formation and rupture in FCCM will ease the identification of further candidate targets for known and novel molecules.
In order to highlight novel potential genetic targets, several transcriptomic studies related to both coding and noncoding RNA were conducted on CCM patients’ tissues without molecular characterization [30,31,32,33]. These studies showed dysregulation of several signaling which clustered in neuronal activity, angiogenesis, extracellular matrix signaling and vascular integrity. Abou-Fadel and co-authors provided a combination of proteomic and transcriptomic analysis from silencing CCM genes in endothelial cells and from Ccm1 and Ccm2-knockout zebrafish embryos, revealing a unique portrait detailing alterations in angiogenesis and endothelial permeability [34].
To date, three RNA-Seq analyses aiming to profile the molecular role of PDCD10 in CCM pathogenesis were reported. The first one consisted of a transcriptomic study from brain lesions of Pdcd10 knockdown mice and identified alterations in neurological signal transduction, postsynaptic signaling and oxidative stress [35]. A combination of transcriptomic analysis derived from mouse and C. elegans endothelial Pdcd10-silenced cells revealed a set of genes related to integrin-signaling and vesicle transportation [36]. Recently, Orsenigo and co-authors reported an in-depth single-cell RNA sequencing in a Pdcd10-mouse model mapping the transcriptional diversity of endothelial cells in vascular lesions [37]. The amount of transcriptomic data reported, if confirmed and accurately validated in other cell lines and/or disease models, will surely stimulate the development of novel therapeutic strategies.
In the present study, we first confirmed alterations in pathways identified as abnormal in previous RNA-Seq studies in different tissues and including oxidative stress, integrin-signaling, vesicle transportation, angiogenesis and vascular integrity [28,36,37,38,39]. Our investigations also identified the involvement of novel pathways, including hypoxia and HIF-1α signaling, NOD2-related pathway and immune response.

4.1. Hypoxia and HIF-1α Signaling

Many DEGs in this study were related to the hypoxia regulatory network, which is one of the most crucial pathways implicated in the control of the immune response, tissue homeostasis and endothelial signaling in the vasculature. HIF-1α is the key regulator of tissue response to hypoxia [40]. HIF-1α is critical for the development of atherosclerosis through cell-specific responses by acting on endothelial cells, vascular smooth muscle cells and macrophages. HIF-1α controls different pathophysiological processes, including vascular dysfunction, atherosclerosis, myocardial infarction and stroke. In our study, DEGs with at least a 1.5-fold increase in expression linked to hypoxia included cytokines/growth factors (N-Myc Downstream Regulated 1 (Ndrg1), Hmox1, Inhibitor of DNA Binding 2 (Id2), Family With Sequence Similarity 162 Member A (Fam162A), Solute Carrier Family 2 Member 1 (Slc2a1)), receptors (Gbe, Gys1) and other signaling proteins (Serpine1, Nos2, Solute Carrier Family 2 Member 1 (Slca1), Selenium Binding Protein 1 (Selenbp1), Phosphofructokinase, Platelet (Pfkp), Endoplasmic Reticulum Oxidoreductase 1alpha (Ero1l), Prolyl 4-Hydroxylase Subunit alpha2 (P4ha2), Carbonic Anhydrase 12 (Car12), Gys1, Fam162A, and Glucosaminyl (N-Acetyl) Transferase 2 (Gcnt2)). Among them, Serpine1, which encodes for a member of the serine proteinase inhibitor superfamily, is interesting as it contributes to innate antiviral immunity, and its expression is influenced by HIF-1α as a result of stimulation of cellular migration and cell-adhesion markers expression. Both these mechanisms, if altered, might affect permeability, which appears defective in FCCM patients’ cell lines [41].

4.2. NOD2 Signaling

Our transcriptomic data also reported a significant transcriptional activation of Nod2-associated genes. NOD2/Nod2 is an intracellular pattern recognition receptor that stimulates the host immune response. A variety of extracellular stimuli can activate distinct signaling pathways that converge to initiate NOD2/Nod2 expression. Specific cell wall components of bacteria and fungi can trigger the innate immune signaling cascade and then lead to NOD2/Nod2 expression. Following activation, NOD2/Nod2 stimulates pro-inflammatory pathways such as NF-κB and MAPK signaling [42] and thereby contributes to host defence via the production of inflammatory cytokines, antimicrobial molecules [43] and mucins [44]. More specifically, NOD2/Nod2 acts as an immune sensor in the gut microbiota balance and the related microbiota–host interaction. Research into the role of the gut microbiome in modulating brain function has rapidly increased over the past 10 years. Increasing clinical and preclinical evidence implicates the microbiome as a possible key susceptibility factor for neurological disorders, such as Alzheimer’s disease, autism spectrum disorder, multiple sclerosis, Parkinson’s disease and stroke [45]. Interestingly, a recent study showed that CCM lesions arise from an excess of MEKK3 signaling downstream of TLR4 stimulation by the gut microbiome. This suggests the existence of a gut–brain disease axis in FCCM [46,47].
We demonstrated dysregulation of several genes which converge to NOD2/Nod2 signaling and include Csfr2b, Ndrg1, Car12, Csf2rb2, Semaphoring A7 (SemaA7), Fam162A and Slc2a1 [48,49,50,51]. In light of the recent discoveries of a possible role of the microbiota in the pathogenesis of CCM, our preliminary findings could be interpreted as a link between CCM formation and altered gut-microbiota interactions via Nod2 pathway dysfunction in PDCD10-related FCCM.

4.3. Immunological Signatures

Human T cells, CD4+ T and CD8+ T cells coordinate adaptive immune responses and are essential for establishing protective immunity and maintaining immune homeostasis through the production of cytokines and effector molecules. CD4+ T cells secrete cytokines to recruit and activate other immune cells, while CD8+ T cells acquire cytotoxic functions to directly kill infected cells [52]. The CNS is recognized as immune-privileged. However, recent advances highlight interactions between the peripheral immune system and CNS in controlling infections and tissue homeostasis [53,54]. One study suggested the role of inflammation in the CCM pathogenesis by revealing a robust inflammatory cell infiltration in CCM [55]. In our work, DEG analysis identified genes involved in the immune and inflammation response, such as Adam8, Gys1 and Elastin Microfibril Interfacer 2 (Emilin2).
ADAM8 was described as a promoter of macrophage infiltration upon inflammation [56]. GYS1 might be a novel therapeutic strategy for chronic inflammatory arthritis since its expression deregulation was associated with chronic inflammation in patient cell lines [57]. Finally, EMILIN2 stimulates the production of a number of cytokines involved in angiogenesis and inflammation [58]. Overall, the significant overexpression of these genes in our study suggests a relationship between Pdcd10 expression and the immune and inflammatory responses. These findings suggest that the immunological profile may be closely implicated in the CCM pathogenesis at least in PDCD10-related FCCM.

5. Conclusions

This work first confirmed previous studies showing gene expression alterations of oxidative stress, integrin-signaling, vesicle transportation, angiogenesis and vascular integrity in selected tissues of the Pdcd10-knockdown mouse model. Our findings reinforce the significance of these data and localize them in ECs, which are considered critical tissue for CMM formation. We also documented the involvement of novel pathways, including hypoxia, HIF-1α and Nod2 signaling, as well as immune response. Hopefully, these findings, if supported by further investigations and confirmed in other disease models, will contribute to the identification of a more personalized approach to disease prevention and treatment.

Supplementary Materials

The following supporting information can be downloaded at: https://0-www-mdpi-com.brum.beds.ac.uk/article/10.3390/genes13060961/s1, Figure S1: immunofluorescence analyses of PECAM 1 protein; Table S1: sequences of mouse primers used in this study for qRT-PCR study; Table S2: all differential expressed genes; Table S2: biological process annotation clustering by different databases.

Author Contributions

Conceptualization C.F.; methodology G.N. and L.D.F.; validation G.N., M.M. and L.M.; formal analysis L.D.F. and C.F.; writing—original draft preparation M.C. and C.F.; writing—review and editing M.C., C.F., L.M., E.D., D.C. and A.P.; supervision M.C.; project administration C.F.; funding acquisition L.M. All authors have read and agreed to the published version of the manuscript.

Funding

This work was supported by the Ricerca Corrente 2018–2021 Program from the Italian Ministry of Health to LM. The funders had no role in study design, data collection and analysis, decision to publish or preparation of the manuscript.

Institutional Review Board Statement

This study was conducted according to the guidelines of the Declaration of Helsinki and approved by the Institutional Review Board (or Ethics Committee) of Fondazione IRCCS-Casa Sollievo della Sofferenza (approval no. 2021/13/CE).

Informed Consent Statement

Not applicable.

Data Availability Statement

Not applicable.

Acknowledgments

The authors thank the Francesca Boccafoschi (Health Science Department, University of Piemonte Orientale, Novara, Italy) for providing the immortalized mouse aortic EC line.

Conflicts of Interest

Davide Cacchiarelli is the founder, shareholder and consultant of Next Generation Diagnostic srl. The other authors declare no conflict of interest. The funders had no role in the design of the study; in the collection, analyses or interpretation of the data; in the writing of the manuscript or in the decision to publish the results.

References

  1. Idiculla, P.S.; Gurala, D.; Palanisamy, M.; Vijayakumar, R.; Dhandapani, S.; Nagarajan, E. Cerebral Venous Thrombosis: A Comprehensive Review. Eur. Neurol. 2020, 83, 369–379. [Google Scholar] [CrossRef] [PubMed]
  2. Akers, A.; Al-Shahi Salman, R.; Awad, A.; Dahlem, K.; Flemming, K.; Hart, B.; Kim, H.; Jusue-Torres, I.; Kondziolka, D.; Lee, C.; et al. Synopsis of Guidelines for the Clinical Management of Cerebral Cavernous Malformations: Consensus Recommen-dations Based on Systematic Literature Review by the Angioma Alliance Scientific Advisory Board Clinical Experts Panel. Neurosurgery 2017, 80, 665–680. [Google Scholar] [CrossRef] [PubMed] [Green Version]
  3. Labauge, P.; Denier, C.; Bergametti, F.; Tournier-Lasserve, E. Genetics of cavernous angiomas. Lancet Neurol. 2007, 6, 237–244. [Google Scholar] [CrossRef]
  4. Lanfranconi, S.; Scola, E.; Bertani, G.A.; Zarino, B.; Pallini, R.; d’Alessandris, G.; Mazzon, E.; Marino, S.; Carriero, M.R.; Scelzo, E.; et al. Propranolol for familial cerebral cavernous malformation (Treat_CCM): Study protocol for a randomized controlled pilot trial. Trials 2020, 21, 401. [Google Scholar] [CrossRef]
  5. Shenkar, R.; Shi, C.; Rebeiz, T.; Stockton, R.A.; McDonald, D.A.; Mikati, A.G.; Zhang, L.; Austin, C.; Akers, A.L.; Gallione, C.J.; et al. Exceptional aggressiveness of cerebral cavernous malformation disease associated with PDCD10 mutations. Genet. Med. 2015, 17, 188–196. [Google Scholar] [CrossRef] [Green Version]
  6. Cuttano, R.; Rudini, N.; Bravi, L.; Corada, M.; Giampietro, C.; Papa, E.; Morini, M.F.; Maddaluno, L.; Baeyens, N.; Adams, R.H.; et al. KLF 4 is a key determinant in the development and progression of cerebral cavernous malformations. EMBO Mol. Med. 2016, 8, 6–24. [Google Scholar] [CrossRef]
  7. Zhou, Z.; Tang, A.T.; Wong, W.Y.; Bamezai, S.; Goddard, L.M.; Shenkar, R.; Zhou, S.; Yang, J.; Wright, A.C.; Foley, M.; et al. Cerebral cavernous malformations arise from endothelial gain of MEKK3-KLF2/4 signalling. Nature 2016, 532, 122–126. [Google Scholar] [CrossRef] [Green Version]
  8. He, Y.; Zhang, H.; Yu, L.; Gunel, M.; Boggon, T.J.; Chen, H.; Min, W. Stabilization of VEGFR2 Signaling by Cerebral Cavernous Malformation 3 Is Critical for Vascular Development. Sci. Signal. 2010, 3, ra26. [Google Scholar] [CrossRef] [Green Version]
  9. Voss, K.; Stahl, S.; Hogan, B.M.; Reinders, J.; Schleider, E.; Schulte-Merker, S.; Felbor, U. Functional analyses of human and zebrafish 18-amino acid in-frame deletion pave the way for domain mapping of the cerebral cavernous malformation 3 protein. Hum. Mutat. 2009, 30, 1003–1011. [Google Scholar] [CrossRef]
  10. Yoruk, B.; Gillers, B.S.; Chi, N.C.; Scott, I.C. Ccm3 functions in a manner distinct from Ccm1 and Ccm2 in a zebrafish model of CCM vascular disease. Dev. Biol. 2012, 362, 121–131. [Google Scholar] [CrossRef] [Green Version]
  11. Zheng, X.; Xu, C.; Di Lorenzo, A.; Kleaveland, B.; Zou, Z.; Seiler, C.; Chen, M.; Cheng, L.; Xiao, J.; He, J.; et al. CCM3 signaling through sterile 20–like kinases plays an essential role during zebrafish cardiovascular development and cerebral cavernous malformations. J. Clin. Investig. 2010, 120, 2795–2804. [Google Scholar] [CrossRef] [PubMed]
  12. Detter, M.R.; Snellings, D.A.; Marchuk, D.A. Cerebral Cavernous Malformations Develop Through Clonal Expansion of Mu-tant Endothelial. Cells Circ. Res. 2018, 123, 1143–1151. [Google Scholar] [CrossRef] [PubMed]
  13. Malinverno, M.; Maderna, C.; Abu Taha, A.; Corada, M.; Orsenigo, F.; Valentino, M.; Pisati, F.; Fusco, C.; Graziano, P.; Giannotta, M.; et al. Endothelial cell clonal expansion in the development of cerebral cavernous malformations. Nat. Commun. 2019, 10, 2761. [Google Scholar] [CrossRef] [PubMed] [Green Version]
  14. Wei, Y.; Chiang, W.C.; Sumpter, R., Jr.; Mishra, P.; Levine, B. Prohibitin 2 Is an Inner Mitochondrial Membrane Mitophagy Receptor. Cell 2017, 168, 224–238. [Google Scholar] [CrossRef] [PubMed] [Green Version]
  15. Song, M.; Franco, A.; Fleischer, J.A.; Zhang, L.; Dorn, G.W. Abrogating Mitochondrial Dynamics in Mouse Hearts Accelerates Mitochondrial Senescence. Cell Metab. 2017, 26, 872–883.e5. [Google Scholar] [CrossRef] [Green Version]
  16. Fusco, C.; Nardella, G.; Augello, B.; Boccafoschi, F.; Palumbo, O.; Fusaro, L.; Notarangelo, A.; Barbano, R.; Parrella, P.; Annicchiarico, G.; et al. Pro-Fibrotic Phenotype in a Patient with Segmental Stiff Skin Syndrome via TGF-beta Signaling Overactivation. Int. J. Mol. Sci. 2020, 21, 5141. [Google Scholar] [CrossRef]
  17. García-Fernández, E.; Koch, G.; Wagner, R.M.; Fekete, A.; Stengel, S.T.; Schneider, J.; Mielich-Süß, B.; Geibel, S.; Markert, S.; Stigloher, C.; et al. Membrane Microdomain Disassembly Inhibits MRSA Antibiotic Resistance. Cell 2017, 171, 1354–1367. [Google Scholar] [CrossRef]
  18. Aprile, M.; Cataldi, S.; Ambrosio, M.R.; D’Esposito, V.; Lim, K.; Dietrich, A.; Bluher, M.; Savage, D.B.; Formisano, P.; Ciccodicola, A.; et al. PPARgammaDelta5, a Naturally Occurring Dominant-Negative Splice Isoform, Impairs PPARgamma Function and Adipocyte Differentiation. Cell Rep. 2018, 25, 1577–1592. [Google Scholar] [CrossRef] [Green Version]
  19. Wang, L.; Wang, S.; Li, W. RSeQC: Quality control of RNA-seq experiments. Bioinformatics 2012, 28, 2184–2185. [Google Scholar] [CrossRef] [Green Version]
  20. Bray, N.L.; Pimentel, H.; Melsted, P.; Pachter, L. Near-optimal probabilistic RNA-seq quantification. Nat. Biotechnol. 2016, 34, 525–527. [Google Scholar] [CrossRef]
  21. Love, M.I.; Huber, W.; Anders, S. Moderated estimation of fold change and dispersion for RNA-seq data with DESeq. Genome Biol. 2014, 15, 550. [Google Scholar] [CrossRef] [PubMed] [Green Version]
  22. Kaimal, V.; Bardes, E.E.; Tabar, S.C.; Jegga, A.G.; Aronow, B.J. ToppCluster: A multiple gene list feature analyzer for com-parative enrichment clustering and network-based dissection of biological systems. Nucleic Acids. Res. 2010, 38, W96–W102. [Google Scholar] [CrossRef] [Green Version]
  23. Rozen, S.; Skaletsky, H. Primer3 on the WWW for general users and for biologist programmers. Methods Mol. Biol. 2000, 132, 365–386. [Google Scholar] [PubMed] [Green Version]
  24. Livak, K.J.; Schmittgen, T.D. Analysis of relative gene expression data using real-time quantitative PCR and the 2(-Delta Delta C(T)) Method. Methods 2001, 25, 402–408. [Google Scholar] [CrossRef] [PubMed]
  25. Dobin, A.; Gingeras, T.R. Mapping RNA-seq Reads with STAR. Curr. Protoc. Bioinform. 2015, 51, 11–14. [Google Scholar] [CrossRef] [Green Version]
  26. Alexa, A.; Rahnenfuhrer, J.; Lengauer, T. Improved scoring of functional groups from gene expression data by decorrelating GO graph structure. Bioinformatics 2006, 22, 1600–1607. [Google Scholar] [CrossRef] [Green Version]
  27. Supek, F.; Bošnjak, M.; Škunca, N.; Smuc, T. REVIGO Summarizes and Visualizes Long Lists of Gene Ontology Terms. PLoS ONE 2011, 6, e21800. [Google Scholar] [CrossRef] [Green Version]
  28. Maddaluno, L.; Rudini, N.; Cuttano, R.; Bravi, L.; Giampietro, C.; Corada, M.; Ferrarini, L.; Orsenigo, F.; Papa, E.; Boulday, G.; et al. EndMT contributes to the onset and progression of cerebral cavernous malformations. Nature 2013, 498, 492–496. [Google Scholar] [CrossRef]
  29. Mabray, M.C.; Caprihan, A.; Nelson, J.; McCulloch, C.E.; Zafar, A.; Kim, H.; Hart, B.L.; Morrison, L. Effect of Simvastatin on Permeability in Cerebral Cavernous Malformation Type 1 Patients: Results from a Pilot Small Randomized Controlled Clinical Trial. Transl. Stroke Res. 2020, 11, 319–321. [Google Scholar] [CrossRef]
  30. Kar, S.; Bali, K.K.; Baisantry, A.; Geffers, R.; Samii, A.; Bertalanffy, H. Genome-Wide Sequencing Reveals MicroRNAs Downregulated in Cerebral Cavernous Malformations. J. Mol. Neurosci. 2017, 61, 178–188. [Google Scholar] [CrossRef]
  31. Subhash, S.; Kalmbach, N.; Wegner, F.; Petri, S.; Glomb, T.; Dittrich-Breiholz, O.; Huang, C.; Bali, K.K.; Kunz, W.S.; Samii, A.; et al. Transcriptome-wide Profiling of Cerebral Cavernous Malformations Patients Reveal Important Long noncoding RNA molecular signatures. Sci. Rep. 2019, 9, 18203. [Google Scholar] [CrossRef] [PubMed] [Green Version]
  32. Koskimäki, J.; Polster, S.P.; Li, Y.; Romanos, S.; Srinath, A.; Zhang, D.; Carrión-Penagos, J.; Lightle, R.; Moore, T.; Lyne, S.B.; et al. Common transcriptome, plasma molecules, and imaging signatures in the aging brain and a Mendelian neurovascular disease, cerebral cavernous malformation. GeroScience 2020, 42, 1351–1363. [Google Scholar] [CrossRef] [PubMed]
  33. Scimone, C.; Donato, L.; Alibrandi, S.; Esposito, T.; Alafaci, C.; D’Angelo, R.; Sidoti, A. Transcriptome analysis provides new molecular signatures in sporadic Cerebral Cavernous Malformation endothelial cells. Biochim. Biophys. Acta Mol. Basis Dis. 2020, 1866, 165956. [Google Scholar] [CrossRef] [PubMed]
  34. Abou-Fadel, J.; Zhang, J. Systems Wide Analysis of CCM Signaling Complex Alterations in CCM-Deficient Models Using Omics Approaches. Methods Mol. Biol. 2020, 2152, 325–344. [Google Scholar] [CrossRef]
  35. Koskimaki, J.; Zhang, D.; Li, Y.; Saadat, L.; Moore, T.; Lightle, R.; Polster, S.P.; Carrion-Penagos, J.; Lyne, S.B.; Zeineddine, H.A.; et al. Transcriptome clarifies mechanisms of lesion genesis versus progression in models of Ccm3 cerebral cavernous malfor-mations. Acta Neuropathol. Commun. 2019, 7, 132. [Google Scholar] [CrossRef]
  36. Koskimäki, J.; Girard, R.; Li, Y.; Saadat, L.; Zeineddine, H.A.; Lightle, R.; Moore, T.; Lyne, S.; Avner, K.; Shenkar, R.; et al. Comprehensive transcriptome analysis of cerebral cavernous malformation across multiple species and genotypes. JCI Insight 2019, 4, e126167. [Google Scholar] [CrossRef] [Green Version]
  37. Orsenigo, F.; Conze, L.L.; Jauhiainen, S.; Corada, M.; Lazzaroni, F.; Malinverno, M.; Sundell, V.; Cunha, S.I.; Brännström, J.; Globisch, M.A.; et al. Mapping endothelial-cell diversity in cerebral cavernous malformations at single-cell resolution. eLife 2020, 9, e61413. [Google Scholar] [CrossRef]
  38. Ma, X.; Zhao, H.; Shan, J.; Long, F.; Chen, Y.; Chen, Y.; Zhang, Y.; Han, X.; Ma, D. PDCD10 Interacts with Ste20-related Kinase MST4 to Promote Cell Growth and Transformation via Modulation of the ERK Pathway. Mol. Biol. Cell 2007, 18, 1965–1978. [Google Scholar] [CrossRef] [Green Version]
  39. Bravi, L.; Malinverno, M.; Pisati, F.; Rudini, N.; Cuttano, R.; Pallini, R.; Martini, M.; Larocca, L.M.; Locatelli, M.; Levi, V.; et al. Endothelial Cells Lining Sporadic Cerebral Cavernous Malformation Cavernomas Undergo Endothelial-to-Mesenchymal Transition. Stroke 2016, 47, 886–890. [Google Scholar] [CrossRef]
  40. Lim, C.S.; Kiriakidis, S.; Paleolog, E.M.; Davies, A.H. Increased activation of the hypoxia-inducible factor pathway in varicose veins. J. Vasc. Surg. 2012, 55, 1427–1439. [Google Scholar] [CrossRef] [Green Version]
  41. Mikati, A.G.; Khanna, O.; Zhang, L.; Girard, R.; Shenkar, R.; Guo, X.; Shah, A.; Larsson, H.B.W.; Tan, H.; Li, L.; et al. Vascular Permeability in Cerebral Cavernous Malformations. J. Cereb. Blood Flow Metab. 2015, 35, 1632–1639. [Google Scholar] [CrossRef] [PubMed]
  42. Theivanthiran, B.; Batra, S.; Balamayooran, G.; Cai, S.; Kobayashi, K.; Flavell, R.A.; Jeyaseelan, S. NOD2 Signaling Contributes to Host Defense in the Lungs against Escherichia coli Infection. Infect. Immun. 2012, 80, 2558–2569. [Google Scholar] [CrossRef] [PubMed] [Green Version]
  43. Tukhvatulin, A.I.; Dzharullaeva, A.S.; Tukhvatulina, N.M.; Shcheblyakov, D.V.; Shmarov, M.M.; Dolzhikova, I.V.; Stan-hope-Baker, P.; Naroditsky, B.S.; Gudkov, A.V.; Logunov, D.Y.; et al. Powerful Complex Immunoadjuvant Based on Synergistic Effect of Combined TLR4 and NOD2 Activation Significantly Enhances Magnitude of Humoral and Cellular Adaptive Immune Responses. PLoS ONE 2016, 11, e0155650. [Google Scholar] [CrossRef] [PubMed]
  44. Ramanan, D.; Tang, M.S.; Bowcutt, R.; Loke, P.; Cadwell, K. Bacterial Sensor Nod2 Prevents Inflammation of the Small Intestine by Restricting the Expansion of the Commensal Bacteroides vulgatus. Immunity 2014, 41, 311–324. [Google Scholar] [CrossRef] [PubMed] [Green Version]
  45. Cryan, J.F.; O’Riordan, K.J.; Sandhu, K.; Peterson, V.; Dinan, T.G. The gut microbiome in neurological disorders. Lancet Neurol. 2020, 19, 179–194. [Google Scholar] [CrossRef]
  46. Tang, A.T.; Choi, J.P.; Kotzin, J.J.; Yang, Y.; Hong, C.; Hobson, N.; Girard, R.; Zeineddine, H.A.; Lightle, R.; Moore, T.; et al. Endothelial TLR4 and the microbiome drive cerebral cavernous malformations. Nature 2017, 545, 305–310. [Google Scholar] [CrossRef]
  47. Tang, A.T.; Sullivan, K.R.; Hong, C.C.; Goddard, L.M.; Mahadevan, A.; Ren, A.; Pardo, H.; Peiper, A.; Griffin, E.; Tanes, C.; et al. Distinct cellular roles for PDCD10 define a gut-brain axis in cerebral cavernous malformation. Sci. Transl. Med. 2019, 11, eaaw3521. [Google Scholar] [CrossRef]
  48. Kabesch, M.; Depner, M.; Dahmen, I.; Weiland, S.K.; Vogelberg, C.; Niggemann, B.; Lau, S.; Illig, T.; Klopp, N.; Wahn, U.; et al. Original article: Polymorphisms in eosinophil pathway genes, asthma and atopy. Allergy 2007, 62, 423–428. [Google Scholar] [CrossRef]
  49. Oh, Y.M.; Park, H.B.; Shin, J.H.; Lee, J.E.; Park, H.Y.; Kho, D.H.; Lee, J.S.; Choi, H.; Okuda, T.; Kokame, K.; et al. Ndrg1 is a T-cell clonal anergy factor negatively regulated by CD28 costimulation and interleukin-2. Nat. Commun. 2015, 6, 8698. [Google Scholar] [CrossRef] [Green Version]
  50. Siracusa, M.C.; Saenz, S.A.; Hill, D.A.; Kim, B.S.; Headley, M.B.; Doering, T.A.; Wherry, E.J.; Jessup, H.K.; Siegel, L.A.; Kam-bayashi, T.; et al. TSLP promotes interleukin-3-independent basophil haematopoiesis and type 2 inflammation. Nature 2011, 477, 229–233. [Google Scholar] [CrossRef]
  51. Morioka, S.; Perry, J.S.A.; Raymond, M.H.; Medina, C.B.; Zhu, Y.; Zhao, L.; Serbulea, V.; Onengut-Gumuscu, S.; Leitinger, N.; Kucenas, S.; et al. Efferocytosis induces a novel SLC program to promote glucose uptake and lactate release. Nature 2018, 563, 714–718. [Google Scholar] [CrossRef] [PubMed]
  52. Kaech, S.M.; Cui, W. Transcriptional control of effector and memory CD8+ T cell differentiation. Nat. Rev. Immunol. 2012, 12, 749–761. [Google Scholar] [CrossRef] [PubMed]
  53. Korn, T.; Kallies, A. T cell responses in the central nervous system. Nat. Rev. Immunol. 2017, 17, 179–194. [Google Scholar] [CrossRef] [PubMed]
  54. Manglani, M.; McGavern, D.B. New advances in CNS immunity against viral infection. Curr. Opin. Virol. 2018, 28, 116–126. [Google Scholar] [CrossRef] [PubMed]
  55. Shi, C.; Shenkar, R.; Kinloch, A.; Henderson, S.G.; Shaaya, M.; Chong, A.S.; Clark, M.R.; Awad, I.A. Immune complex for-mation and in situ B-cell clonal expansion in human cerebral cavernous malformations. J. Neuroimmunol. 2014, 15, 67–75. [Google Scholar] [CrossRef] [PubMed]
  56. Zhang, W.; Wan, M.; Ma, L.; Liu, X.; He, J. Protective effects of ADAM8 against cisplatin-mediated apoptosis in non-small-cell lung cancer. Cell Biol. Int. 2013, 37, 47–53. [Google Scholar] [CrossRef] [PubMed]
  57. Shi, M.; Wang, J.; Xiao, Y.; Wang, C.; Qiu, Q.; Lao, M.; Yu, Y.; Li, Z.; Zhang, H.; Ye, Y.; et al. Glycogen Metabolism and Rheumatoid Arthritis: The Role of Glycogen Synthase 1 in Regulation of Synovial Inflammation via Blocking AMP-Activated Protein Kinase Activation. Front. Immunol. 2018, 9, 1714. [Google Scholar] [CrossRef]
  58. Andreuzzi, E.; Capuano, A.; Pellicani, R.; Poletto, E.; Doliana, R.; Maiero, S.; Fornasarig, M.; Magris, R.; Colombatti, A.; Cannizzaro, R.; et al. Loss of Multimerin-2 and EMILIN-2 Expression in Gastric Cancer Associate with Altered Angiogenesis. Int. J. Mol. Sci. 2018, 19, 3983. [Google Scholar] [CrossRef] [Green Version]
Figure 1. RNA-seq data. (a) Total lysates were obtained from siPdcd10-ECs compared to siCNT-EC, separated on 10% SDS-gel and subjected to immunoblotting with indicated antibodies. (b) Relative levels of protein intensity related to Pdcd10/β-Actin was quantified by densitometry using Image J analysis software, and the mean of each quantification was reported in the graph. Graphs show averages calculated on three different biological experiments represented by three points (green, yellow and orange). Scale bars represent standard errors. Values are expressed as mean ± SEM (* p < 0.05, n = 3). (c) Heatmap of gene ontology enrichment analysis of functional differences between siPdcd10-EC and siCNT-EC lines. The statistical significance in the heatmap was calculated and presented based on the -log10 false discovery rate (FDR) corrected p-values (blue indicates significant upregulated genes; red indicates significant downregulated genes). The colored scale bar below shows the color scaling with FDR values. The horizontal or vertical bars (violet, blue, orange and green) represented the different clusters of genes coming from a gene ontology analysis generated by Rosalind analysis. On the right-hand side of the Heatmap, a list of DEGs was reported. (d) Volcano plot showing the differentially expressed genes (violet points represent downregulated genes, green points represent upregulated genes, and the adjusted p-value threshold plotted on the Y-axis is 1.3). (e) Treemap representing over-represented biological functions, grouped into processes. Sizes of rectangles are proportional to the number of genes involved in a specific biological process. On the right of the Treemap, the more representative biological function for each cluster is indicated.
Genes 13 00961 g001
Figure 2. Enriched pathways. Bar plot (left) reporting the main significantly enriched biological processes extracted by different ReviGO databases, enrichment score > 3. Stacked bar plot (right) accounting for proportions of upregulated and downregulated genes for each biological process. The top 10 pathways by p-value were extracted from the main databases. For each pathway, the percentage of significant genes contained in the term was calculated.
Genes 13 00961 g002
Figure 3. RNA-seq validation analysis. (a) Q-PCR results of a set of DEGs in siPdcd10-ECs and siCNT-EC. The fold change value relates to the mean expression levels of siCNT-EC, which were set as value 1. The mean expression levels of siCNT-EC derived from three biological replicates; each of these was run in three technical replicates. Graphs show averages calculated on three different biological experiments represented by three points (green, yellow and orange); each point characterized the mean of three technical replicates. Error bars represent standard errors. Values are expressed as mean +/− SEM (** p < 0.01, n = 3). (b) Q-PCR of Pdcd10 expression level of mouse (left) and human (right) gene results came from Pdcd10iEC-KO, EC-Ctrl, and Pdcd10iEC-KO+Pdcd10 cell lines. (c) Q-PCR of some DEGs came from Pdcd10iEC-KO, EC-Ctrl and Pdcd10iEC-KO+Pdcd10 lines were reported. Graphs show averages calculated on three different biological experiments represented by three points (green, yellow and orange); each point characterized the mean of three technical replicates. The fold change value relates to the mean expression levels of EC-Ctrl, which were set as value 1. The mean expression levels of EC-Ctrl derived from three biological replicates; each of these was run in three technical replicates. Values are expressed as mean +/− SEM (** p < 0.01, * p < 0.05, n = 3).
Genes 13 00961 g003aGenes 13 00961 g003b
Table 1. Differential expressed genes (Log Fold Change < 0.05).
SymbolGeneIDDescriptionEnsembl_gene_idLog Fold Changep-Valuep-Adj
Tnfrsf921942tumor necrosis factor receptor superfamily_ member 9ENSMUSG000000289652.3232.1 × 10−286.9 × 10⁻²⁴
Gbe174185glucan (1_4-alpha-)_ branching enzyme 1ENSMUSG000000227072.1496.6 × 10−271.0 × 10⁻²²
Arrb1109689arrestin_ beta 1ENSMUSG000000189092.0004.6 × 10−215.1 × 10⁻¹⁷
P4ha218452procollagen-proline_ 2-oxoglutarate 4-dioxygenase (proline 4-hydroxylase)_ alpha II polypeptideENSMUSG000000189061.5291.8 × 10−171.5 × 10⁻¹³
Vwa1246228von Willebrand factor A domain containing 1ENSMUSG000000421162.0353.4 × 10−162.2 × 10⁻¹²
Emc266736ER membrane protein complex subunit 2ENSMUSG00000022337−1.4134.9 × 10−162.6 × 10⁻¹²
Fam19a5106014family with sequence similarity 19_ member A5ENSMUSG000000548631.3605.0 × 10−112.3 × 10⁻⁷
Epm2a13853epilepsy_ progressive myoclonic epilepsy_ type 2 gene alphaENSMUSG000000554931.5909.7 × 10−104.0 × 10⁻⁶
Csf2rb12983colony stimulating factor 2 receptor_ beta_ low-affinity (granulocyte-macrophage)ENSMUSG000000717131.7631.7 × 10−96.2 × 10⁻⁶
Hist2h2aa115267histone cluster 2_ H2aa1ENSMUSG000000642201.4843.1 × 10−91.0 × 10⁻⁵
Lamb316780laminin_ beta 3ENSMUSG000000266391.2365.8 × 10−91.6 × 10⁻⁵
Serpine118787serine (or cysteine) peptidase inhibitor_ clade E_ member 1ENSMUSG000000374111.5305.4 × 10−91.6 × 10⁻⁵
Adam811501a disintegrin and metallopeptidase domain 8ENSMUSG000000254731.6796.3 × 10−91.6 × 10⁻⁵
Ndrg117988N-myc downstream regulated gene 1ENSMUSG000000051251.4251.0 × 10−82.3 × 10⁻⁵
Gipr381853gastric inhibitory polypeptide receptorENSMUSG000000304061.7111.2 × 10−82.8 × 10⁻⁵
Tenm423966teneurin transmembrane protein 4ENSMUSG000000480781.2511.7 × 10−83.6 × 10⁻⁵
Elp554351elongator acetyltransferase complex subunit 5ENSMUSG00000018565−0.8813.0 × 10−85.3 × 10⁻⁵
Ghrh14601growth hormone releasing hormoneENSMUSG000000276431.6422.8 × 10−85.3 × 10⁻⁵
Gm14253628707programmed cell death 10 pseudogeneENSMUSG00000082321−1.4983.0 × 10−85.3 × 10⁻⁵
Nos218126nitric oxide synthase 2_ inducibleENSMUSG000000208261.6553.8 × 10−85.9 × 10⁻⁵
Selenbp120341selenium binding protein 1ENSMUSG000000688741.6553.7 × 10−85.9 × 10⁻⁵
Pak318481p21 protein (Cdc42/Rac)-activated kinase 3ENSMUSG00000031284−0.9375.3 × 10−87.9 × 10⁻⁵
Fstl383554follistatin-like 3ENSMUSG000000203251.1348.3 × 10−81.1 × 10⁻⁴
Gm43552NULLpredicted gene 43552ENSMUSG000001058351.5858.4 × 10−81.1 × 10⁻⁴
Pdcd1056426programmed cell death 10ENSMUSG00000027835−1.1881.0 × 10−71.3 × 10⁻⁴
Itpk1217837inositol 1_3_4-triphosphate 5/6 kinaseENSMUSG000000579631.3729.9 × 10−81.3 × 10⁻⁴
Ero1l50527ERO1-like (S. cerevisiae)ENSMUSG000000218311.5431.3 × 10−71.5 × 10⁻⁴
Edil313612EGF-like repeats and discoidin I-like domains 3ENSMUSG000000344881.5371.4 × 10−71.6 × 10⁻⁴
AU021092239691expressed sequence AU021092ENSMUSG000000516691.5761.4 × 10−71.6 × 10−4
Hmox115368heme oxygenase 1ENSMUSG000000054131.1091.6 × 10−71.7 × 10⁻⁴
Erlin2244373ER lipid raft associated 2ENSMUSG000000314830.9121.9 × 10−72.0 × 10⁻⁴
Emilin2246707elastin microfibril interfacer 2ENSMUSG000000240530.9602.3 × 10−72.3 × 10⁻⁴
Aire11634autoimmune regulator (autoimmune polyendocrinopathy candidiasis ectodermal dystrophy)ENSMUSG000000007311.5204.4 × 10−74.1 × 10⁻⁴
Id215902inhibitor of DNA binding 2ENSMUSG000000206441.0914.2 × 10−74.1 × 10⁻⁴
Tnnc121924troponin C_ cardiac/slow skeletalENSMUSG00000091898−1.2094.3 × 10−74.1 × 10⁻⁴
Adm2223780adrenomedullin 2ENSMUSG000000541361.3414.9 × 10−74.5 × 10⁻⁴
Gas2l3237436growth arrest-specific 2 like 3ENSMUSG00000074802−0.9236.1 × 10−75.4 × 10⁻⁴
Adgrb2230775adhesion G protein-coupled receptor B2ENSMUSG00000028782−1.0506.8 × 10−75.8 × 10⁻⁴
Sema7a20361sema domain_ immunoglobulin domain (Ig)_ and GPI membrane anchor_ (semaphorin) 7AENSMUSG000000382641.2158.4 × 10−76.9 × 10⁻⁴
Sbsn282619suprabasinENSMUSG000000460561.0418.4 × 10−76.9 × 10⁻⁴
Ush2a22283Usher syndrome 2A (autosomal recessive_ mild)ENSMUSG000000266091.4471.3 × 10−61.0 × 10⁻³
Prr11270906proline rich 11ENSMUSG00000020493−0.8121.4 × 10−61.1 × 10⁻³
Ostf120409osteoclast stimulating factor 1ENSMUSG000000247250.9331.9 × 10−61.5 × 10⁻³
Timp321859tissue inhibitor of metalloproteinase 3ENSMUSG000000200440.9093.5 × 10−62.6 × 10⁻³
Tnfrsf2379201tumor necrosis factor receptor superfamily_ member 23ENSMUSG000000376130.7644.7 × 10−63.4 × 10⁻³
Gys114936glycogen synthase 1_ muscleENSMUSG000000038651.0755.1 × 10−63.6 × 10⁻³
Sprr1a20753small proline-rich protein 1AENSMUSG000000503591.3485.9 × 10−64.1 × 10⁻³
Dmkn73712dermokineENSMUSG000000609621.0886.8 × 10−64.7 × 10⁻³
Plin457435perilipin 4ENSMUSG000000028311.2427.8 × 10−65.2 × 10⁻³
Sparcl113602SPARC-like 1ENSMUSG000000293091.0258.1 × 10−65.2 × 10⁻³
Mthfd1l270685methylenetetrahydrofolate dehydrogenase (NADP+ dependent) 1-likeENSMUSG000000406750.9848.2 × 10−65.2 × 10⁻³
Gcnt214538glucosaminyl (N-acetyl) transferase 2_ I-branching enzymeENSMUSG000000213600.7788.7 × 10−65.5 × 10⁻³
Acap1216859ArfGAP with coiled-coil_ ankyrin repeat and PH domains 1ENSMUSG000000015881.3069.5 × 10−65.9 × 10⁻³
Hist1h2bg319181histone cluster 1_ H2bgENSMUSG000000583851.0021.0 × 10−56.5 × 10⁻³
Kctd10330171potassium channel tetramerisation domain containing 10ENSMUSG00000001098−0.6351.2 × 10−57.2 × 10⁻³
Porcn53627porcupine homolog (Drosophila)ENSMUSG000000311691.0511.2 × 10−57.2 × 10⁻³
Fam162a70186family with sequence similarity 162_ member AENSMUSG000000039550.8721.4 × 10−58.2 × 10⁻³
Arhgap1971085Rho GTPase activating protein 19ENSMUSG00000025154−0.8061.8 × 10−51.0 × 10⁻²
Sept1152398septin 11ENSMUSG00000058013−0.7571.9 × 10−51.0 × 10⁻²
Fdft114137farnesyl diphosphate farnesyl transferase 1ENSMUSG00000021273−0.8341.9 × 10−51.0 × 10⁻²
Foxc117300forkhead box C1ENSMUSG00000050295−0.6872.0 × 10−51.1 × 10⁻²
Car1276459carbonic anyhydrase 12ENSMUSG000000323731.2402.0 × 10−51.1 × 10⁻²
Fosl114283fos-like antigen 1ENSMUSG000000249120.9522.4 × 10−51.2 × 10⁻²
Fstl114314follistatin-like 1ENSMUSG00000022816−0.9032.6 × 10−51.3 × 10⁻²
Mt117748metallothionein 1ENSMUSG000000317651.2642.6 × 10−51.3 × 10⁻²
2610528A11Rik70045RIKEN cDNA 2610528A11 geneENSMUSG000000960011.2102.9 × 10−51.4 × 10⁻²
Minpp117330multiple inositol polyphosphate histidine phosphatase 1ENSMUSG00000024896−0.8572.9 × 10−51.4 × 10⁻²
Lrig116206leucine-rich repeats and immunoglobulin-like domains 1ENSMUSG00000030029−0.6073.2 × 10−51.5 × 10⁻²
L1cam16728L1 cell adhesion moleculeENSMUSG000000313911.0723.4 × 10−51.6 × 10⁻²
Ttll12223723tubulin tyrosine ligase-like family_ member 12ENSMUSG00000016757−0.7523.9 × 10−51.8 × 10⁻²
Gpr3564095G protein-coupled receptor 35ENSMUSG000000262711.1933.8 × 10−51.8 × 10⁻²
Gm14760654474glyceraldehyde-3-phosphate dehydrogenase pseudogeneENSMUSG000000812211.2043.9 × 10−51.8 × 10⁻²
Nde167203nuclear distribution gene E homolog 1 (A nidulans)ENSMUSG00000022678−0.7864.3 × 10−51.9 × 10⁻²
4930447F24Rik76873RIKEN cDNA 4930447F24 geneENSMUSG000001022240.9764.2 × 10−51.9 × 10⁻²
Csf2rb212984colony stimulating factor 2 receptor_ beta 2_ low-affinity (granulocyte-macrophage)ENSMUSG000000717141.2274.4 × 10−51.9 × 10⁻²
Ankrd37654824ankyrin repeat domain 37ENSMUSG000000509141.0454.5 × 10−51.9 × 10⁻²
Ola167059Obg-like ATPase 1ENSMUSG00000027108−0.5984.8 × 10−52.0 × 10⁻²
Gm43951NULLpredicted gene_ 43951ENSMUSG000001078771.2084.8 × 10−52.0 × 10⁻²
Plxnd167784plexin D1ENSMUSG000000301230.6835.3 × 10−52.2 × 10⁻²
Foxred2239554FAD-dependent oxidoreductase domain containing 2ENSMUSG000000165520.6505.6 × 10−52.3 × 10⁻²
9330151L19Rik414085RIKEN cDNA 9330151L19 geneENSMUSG000000970610.9376.3 × 10−52.5 × 10⁻²
Rac3170758RAS-related C3 botulinum substrate 3ENSMUSG000000180120.8316.7 × 10−52.6 × 10⁻²
Dusp5240672dual specificity phosphatase 5ENSMUSG000000347650.7736.7 × 10−52.6 × 10⁻²
Arl6ip565106ADP-ribosylation factor-like 6 interacting protein 5ENSMUSG000000351990.6656.9 × 10−52.7 × 10⁻²
Sort120661sortilin 1ENSMUSG00000068747−0.8877.1 × 10−52.7 × 10⁻²
Gm3200100041204glyceraldehyde-3-phosphate dehydrogenase pseudogeneENSMUSG000000973881.1187.1 × 10−52.7 × 10⁻²
Aldh3a211671aldehyde dehydrogenase family 3_ subfamily A2ENSMUSG00000010025−0.7257.3 × 10−52.7 × 10⁻²
Slc2a120525solute carrier family 2 (facilitated glucose transporter)_ member 1ENSMUSG000000286450.8517.7 × 10−52.8 × 10⁻²
Tusc280385tumor suppressor candidate 2ENSMUSG000000100540.6758.5 × 10−53.1 × 10⁻²
M6pr17113mannose-6-phosphate receptor_ cation dependentENSMUSG000000074580.6108.9 × 10−53.2 × 10⁻²
Pfkp56421phosphofructokinase_ plateletENSMUSG000000211960.8448.9 × 10−53.2 × 10⁻²
Cda72269cytidine deaminaseENSMUSG000000287550.6841.0 × 10−43.8 × 10⁻²
Eef2k13631eukaryotic elongation factor-2 kinaseENSMUSG000000350640.6241.0 × 10−43.8 × 10⁻²
Ogn18295osteoglycinENSMUSG00000021390−0.9891.4 × 10−44.9 × 10⁻²
Table 2. Enriched significant pathways (FDR-adjusted p-Value ≤ 0.05). FOOTNOTE: N.: number.
Term Namep-ValueFDR-Adjusted p-ValueN. of Genes that Are Also in This Filter or ClusterN. of Upregulated GenesN. of Downregulated Genes
HYPOXIA8.2 × 10−93.0 × 10−713130
HIF-1-α transcription factor network7.4 × 10−60.00020660
GSE21360_SECONDARY_VS_QUATERNARY_MEMORY_CD8_TCELL_UP3.8 × 10−70.00071990
GSE3982_DC_VS_BCELL_UP4.1 × 10−70.00071981
GSE21360_SECONDARY_VS_QUATERNARY_MEMORY_CD8_TCELL_DN1.8 × 10−60.00208880
GSE22611_NOD2_TRANSDUCED_VS_CTRL_HEK293T_STIMULATED_WITH_MDP_2H_DN5.1 × 10−60.00352880
GSE37416_CTRL_VS_6H_F_TULARENSIS_LVS_NEUTROPHIL_DN3.9 × 10−50.01260770
GSE360_CTRL_VS_L_DONOVANI_DC_DN3.3 × 10−50.01260770
GSE15930_NAIVE_VS_72H_IN_VITRO_STIM_IL12_CD8_TCELL_DN6.4 × 10−50.01271752
Glycogen biosynthesis II (from UDP-D-Glucose)0.000830.01995220
ESTROGEN_RESPONSE_LATE0.002010.03626734
GSE25677_MPL_VS_R848_STIM_BCELL_UP0.000310.04286660
GSE36078_UNTREATED_VS_AD5_INF_MOUSE_LUNG_DC_UP0.000430.04286651
GSE43955_1H_VS_42H_ACT_CD4_TCELL_WITH_TGFB_IL6_DN0.000440.04286660
GSE17721_CpG_VS_GARDIQUIMOD_1H_BMDC_UP0.000420.04286642
GSE3982_MAC_VS_BCELL_UP0.000390.04286660
GSE17301_CTRL_VS_48H_ACD3_ACD28_IFNA2_STIM_CD8_TCELL_UP0.000400.04286642
EPITHELIAL_MESENCHYMAL_TRANSITION0.006200.05306651
ESTROGEN_RESPONSE_EARLY0.007220.05306633
TNFA_SIGNALING_VIA_NFKB0.007580.05306660
Table 3. List of significant genes associated with Hypoxia and HFI-1 pathways.
PathwayGeneDescriptionAliases
HypoxiaGbe1glucan (1,4-alpha), branching enzyme 12310045H19RIK, 2810426P10RIK, D16ERTD536E
Serpine1serine (or cysteine) peptidase inhibitor, clade E, member 1PAI-1, PAI1, PLANH1
Car12carbonic anhydrase 122310047E01RIK, AI314958, CA-XII, CA12
Fam162afamily with sequence similarity 162, member A2310056P07RIK, HGTD-P
Gcnt2glucosaminyl (N-acetyl) transferase 2, I-branching enzyme5330430K10RIK, IGNT, IGNTA, IGNTB, IGNTC
Selenbp1selenium binding protein 1LP56, LPSB, SBP56
P4ha2procollagen-proline, 2-oxoglutarate 4-dioxygenase (proline 4-hydroxylase), alphaII polypeptideAA407196, C76437, P4HL
Hmox1heme oxygenase 1D8WSU38E, HO-1, HO1, HEMOX, HMOX, HSP32
Slc2a1solute carrier family 2 (facilitated glucose transporter), member 1GLUT-1, GLUT1
Ero1lERO1-like (S. cerevisiae)ERO1-L
Ndrg1N-myc downstream-regulated gene 1CAP43, CMT4D, DRG1, HMSNL, NMSL, NDR1, NDRL, PROXY1, RTP, TDD5
Gys1glycogen synthase 1, muscleGYS3, MGS
Pfkpphosphofructokinase, platelet1200015H23RIK, 9330125N24RIK, ATP-PFK, PFK-C, PFK-P
HIF-1-alphaNos2nitric oxide synthase 2, inducibleMAC-NOS, NOS-II, NOS-2, NOS2A, I-NOS, INOS
Hmox1heme oxygenase 1D8WSU38E, HO-1, HO1, HEMOX, HMOX, HSP32
Serpine1serine (or cysteine) peptidase inhibitor, clade E, member 1PAI-1, PAI1, PLANH1
Id2inhibitor of DNA binding 2AI255428, C78922, IDB2, BHLHB26
Ndrg1N-myc downstream-regulated gene 1CAP43, CMT4D, DRG1, HMSNL, NMSL, NDR1, NDRL, PROXY1, RTP, TDD5
Slc2a1solute carrier family 2 (facilitated glucose transporter), member 1GLUT-1, GLUT1
Publisher’s Note: MDPI stays neutral with regard to jurisdictional claims in published maps and institutional affiliations.

