What Is the Giant Wall Gecko Having for Dinner? Conservation Genetics for Guiding Reserve Management in Cabo Verde

 , , ,
, , ,  , and
, and 
Abstract
:1. Introduction
2. Materials and Methods
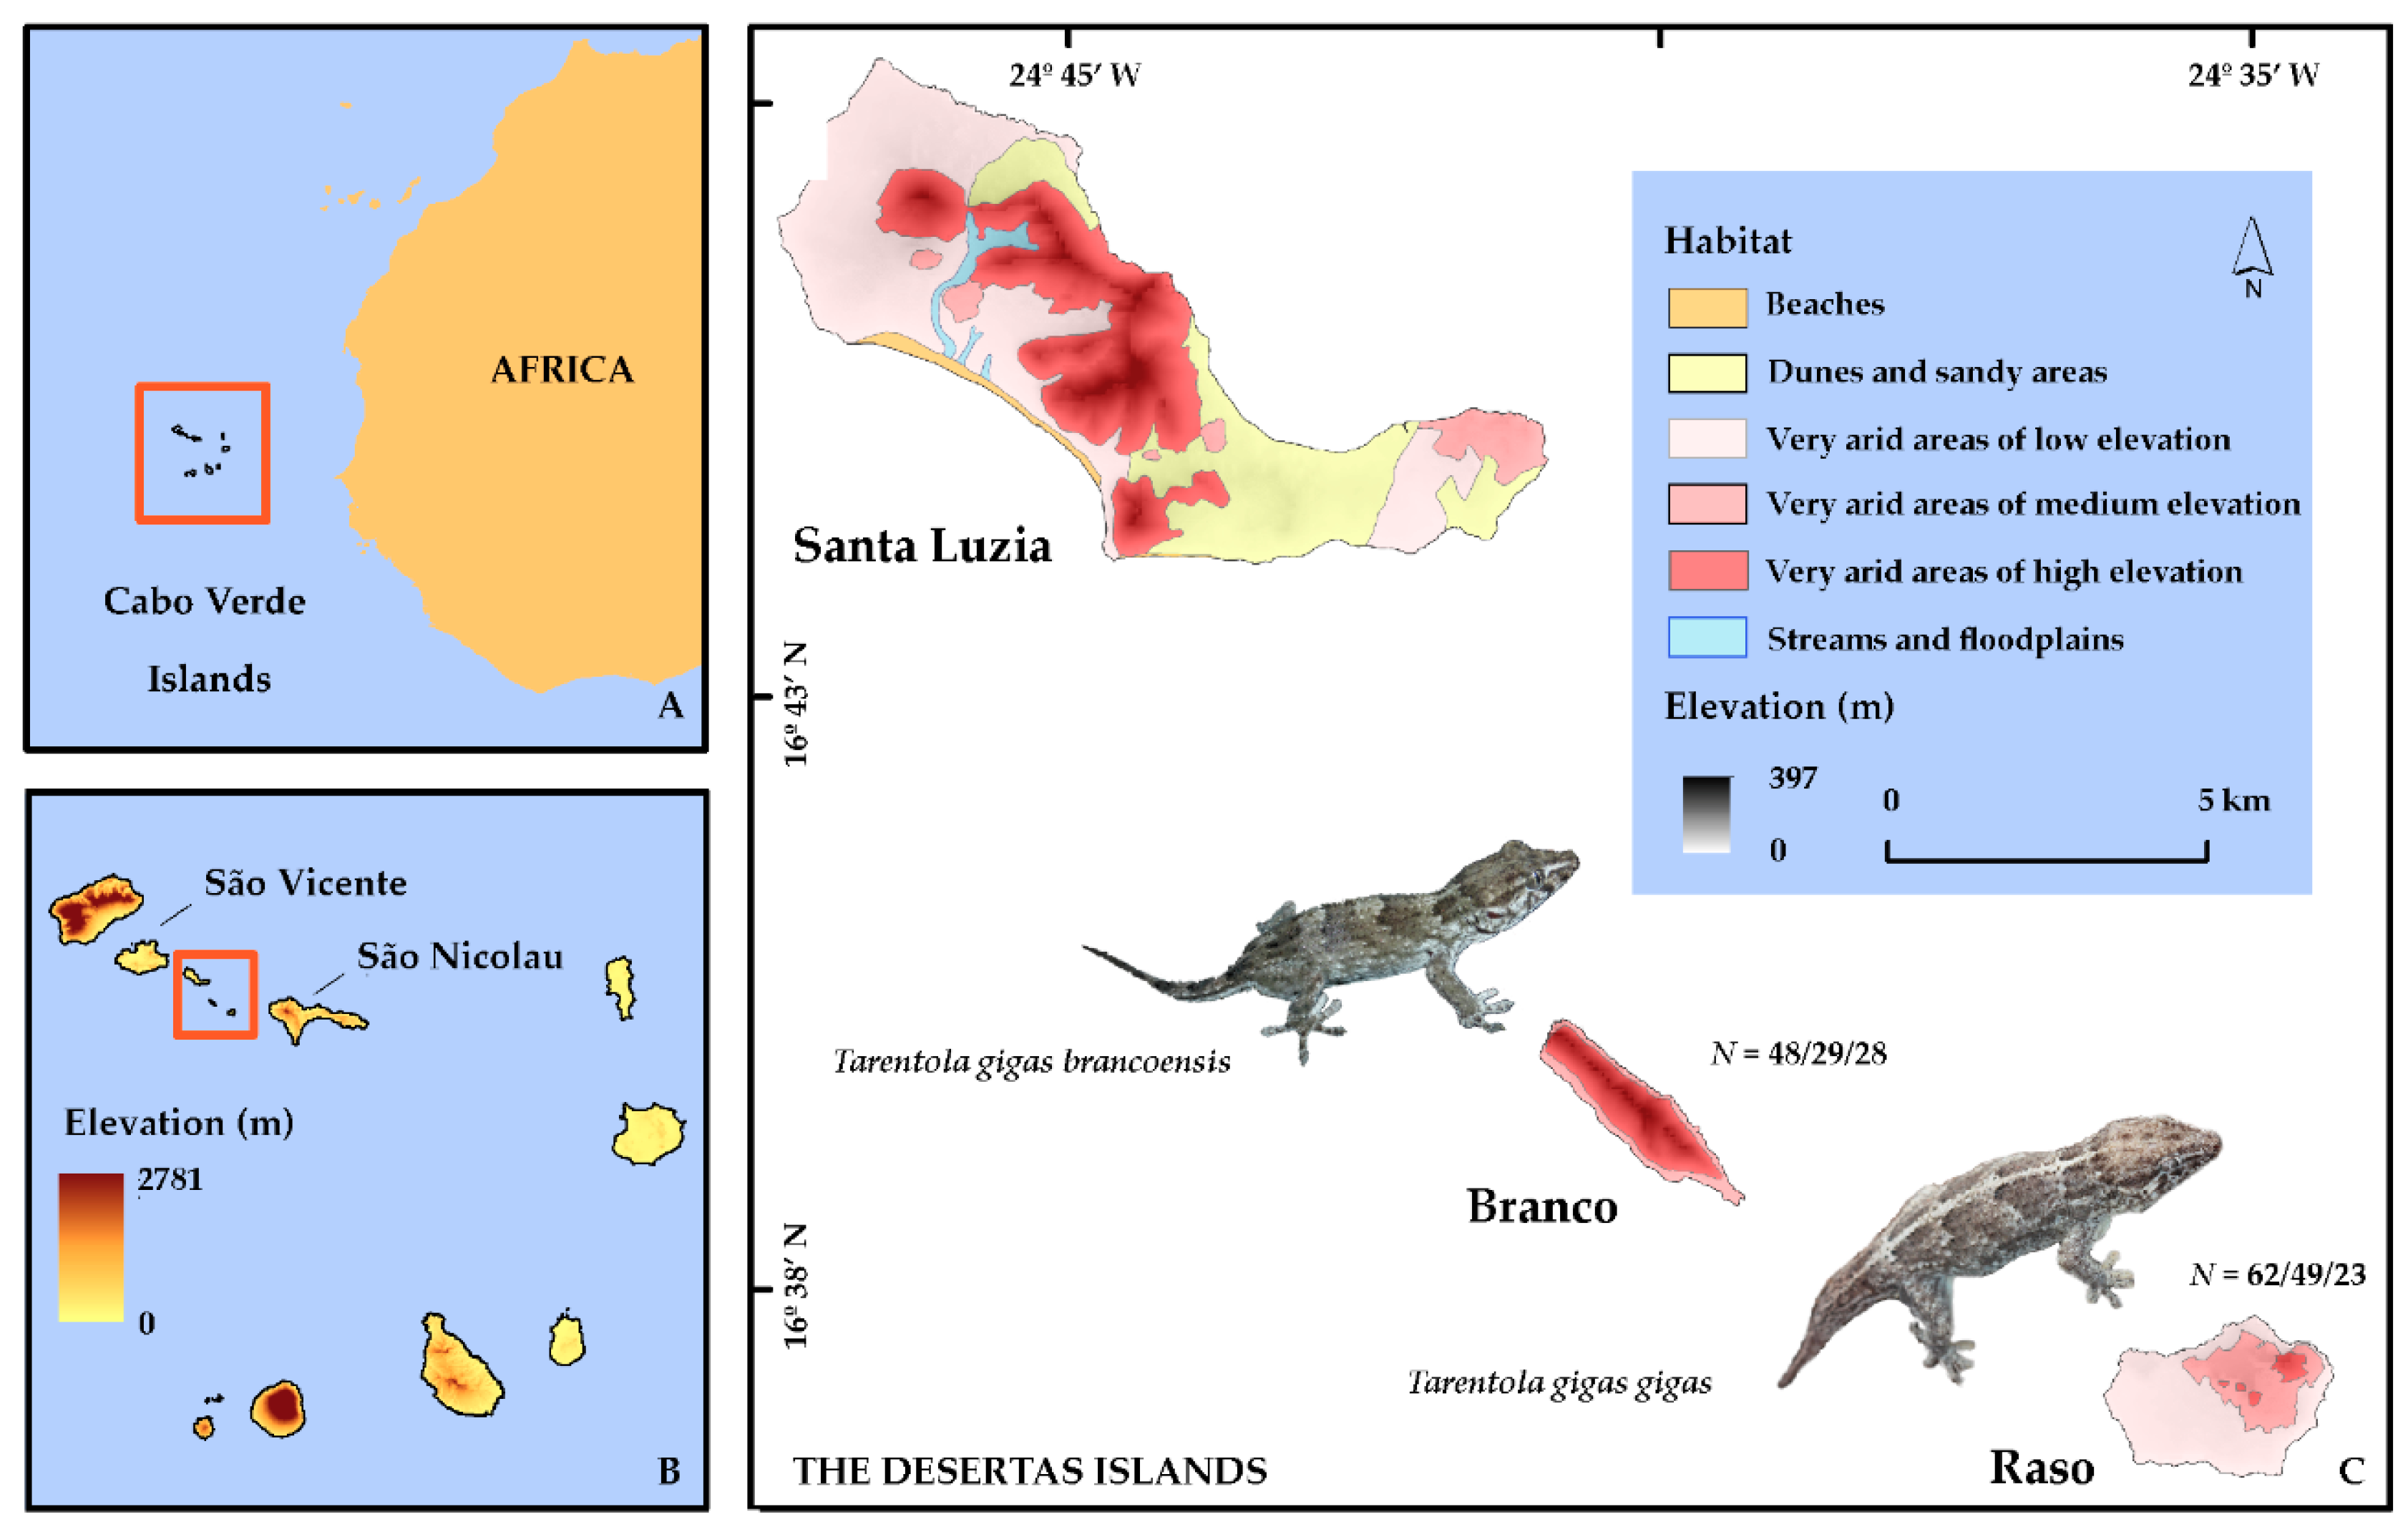
2.1. Study Area
2.2. Study Species
2.3. Sampling
2.4. DNA Extraction and Amplification
2.5. Library Preparation
2.6. Bioinformatics
2.7. Data Analysis
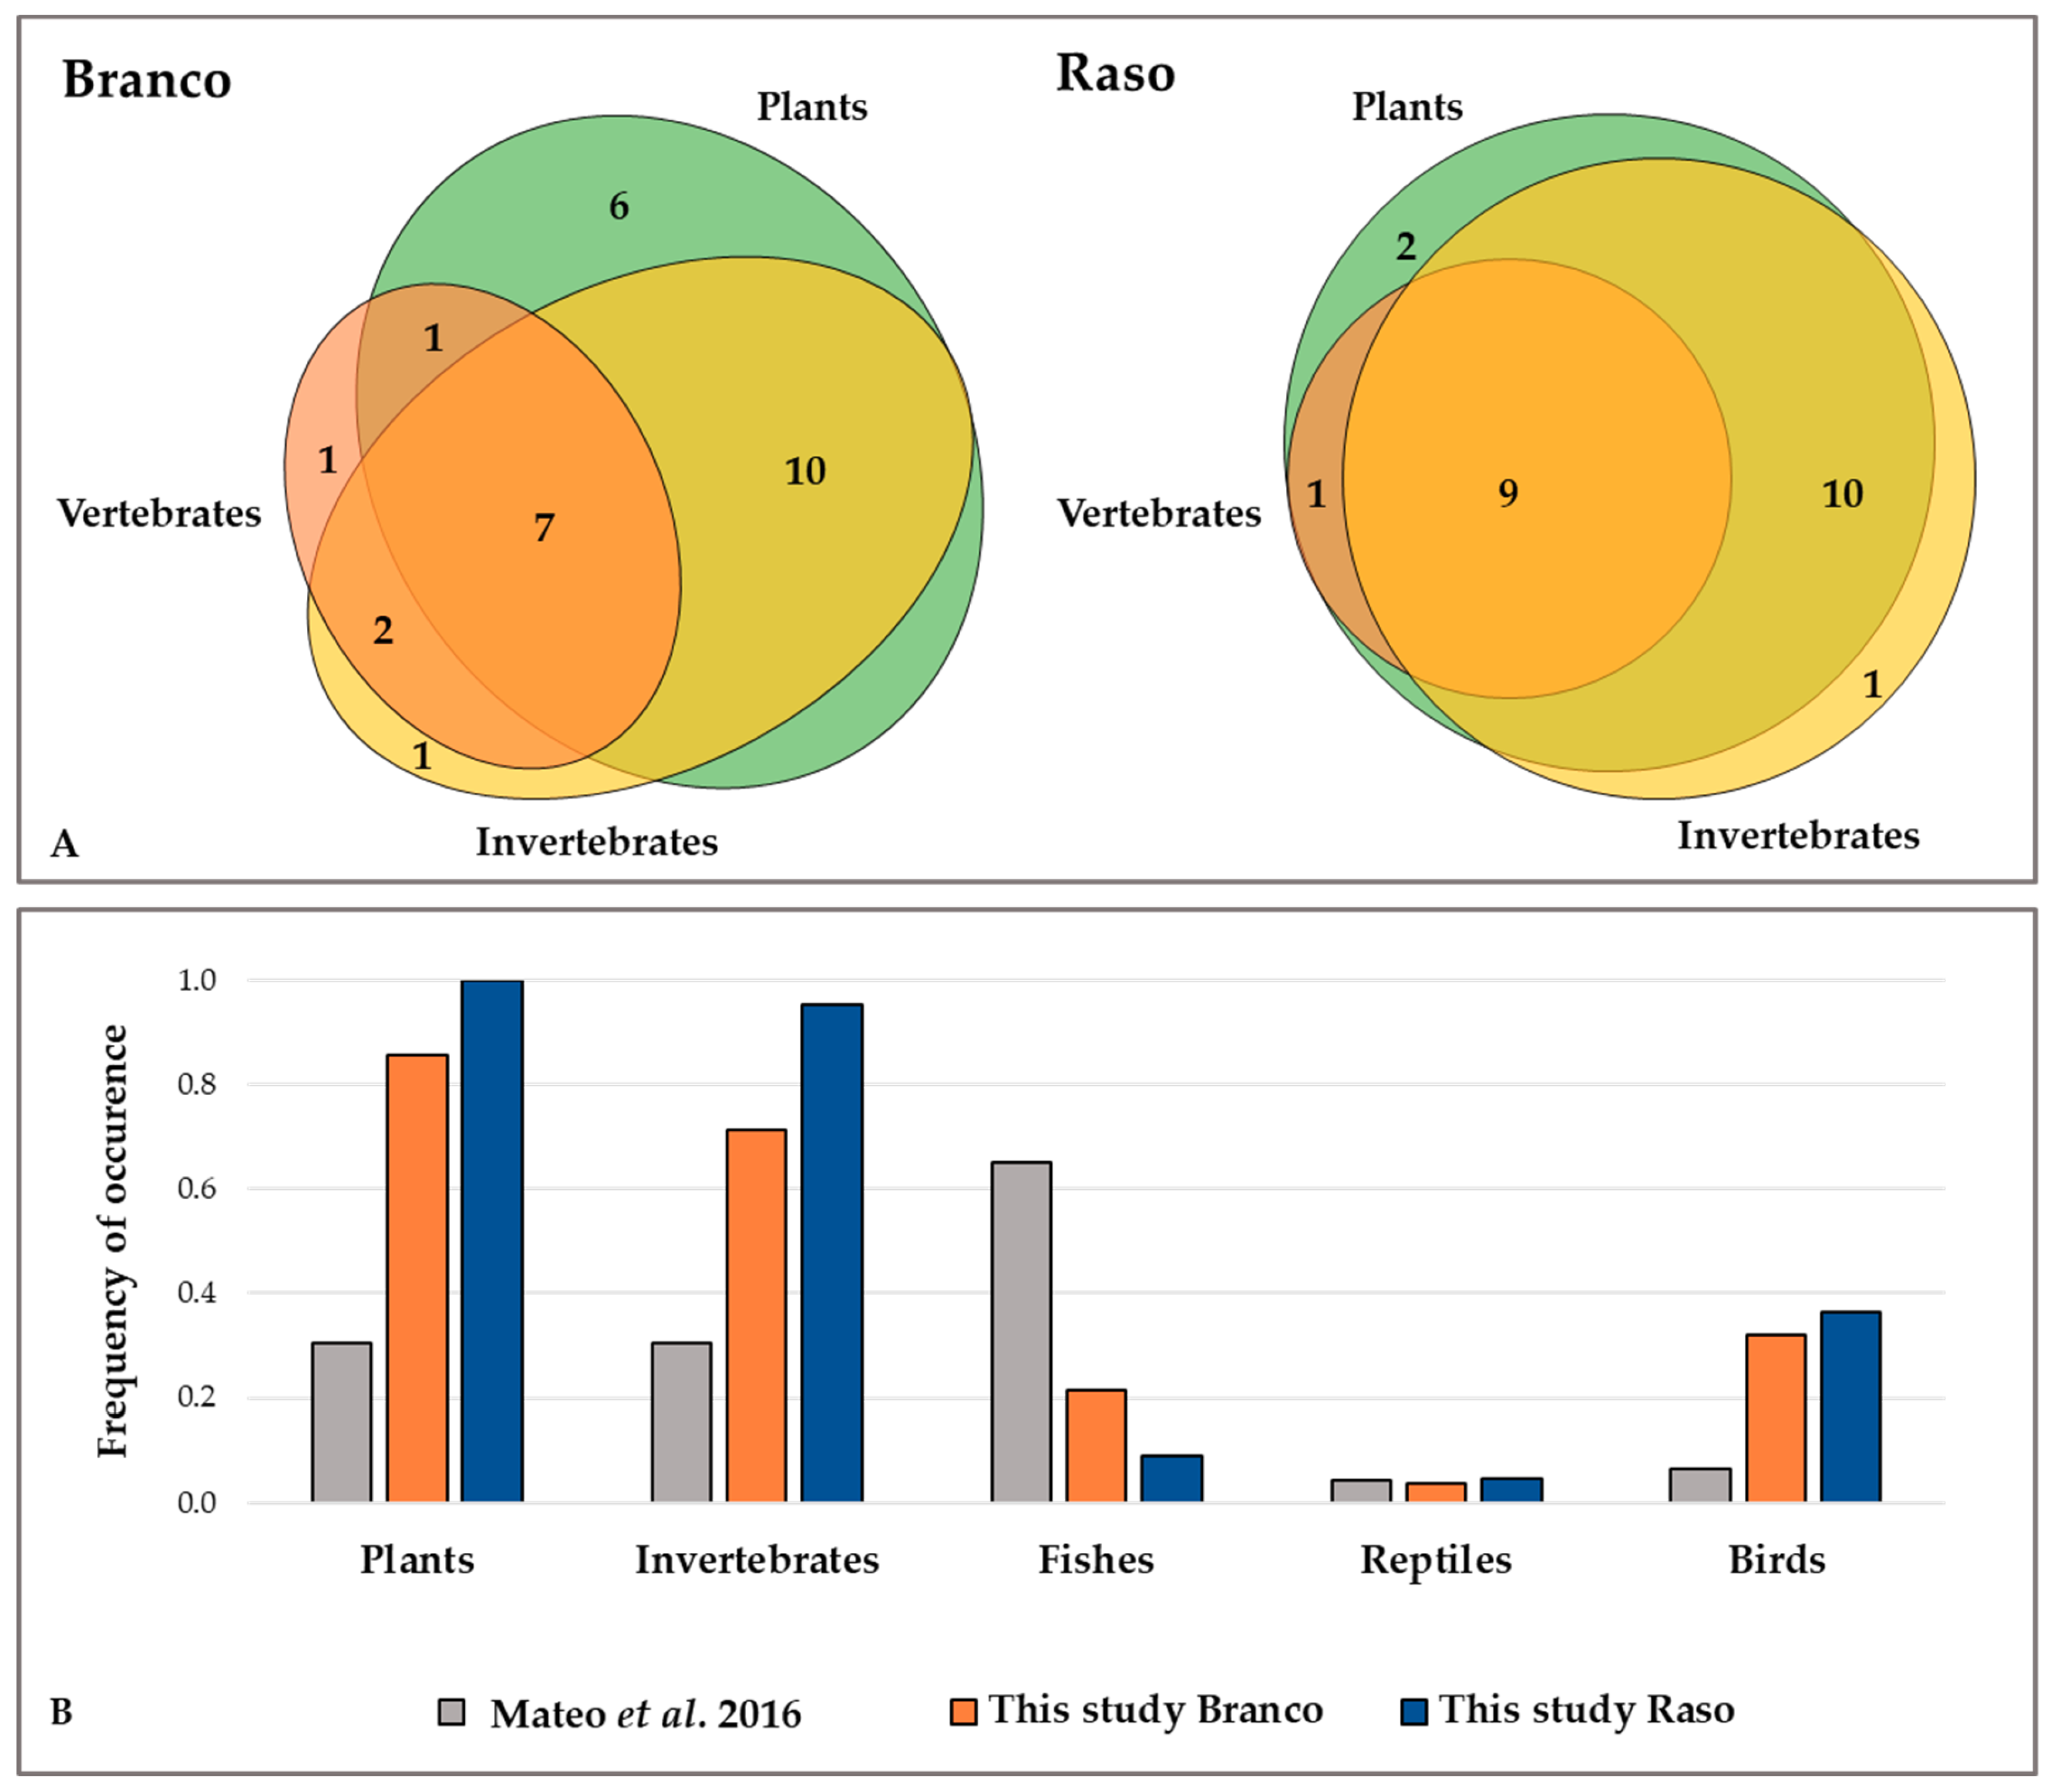
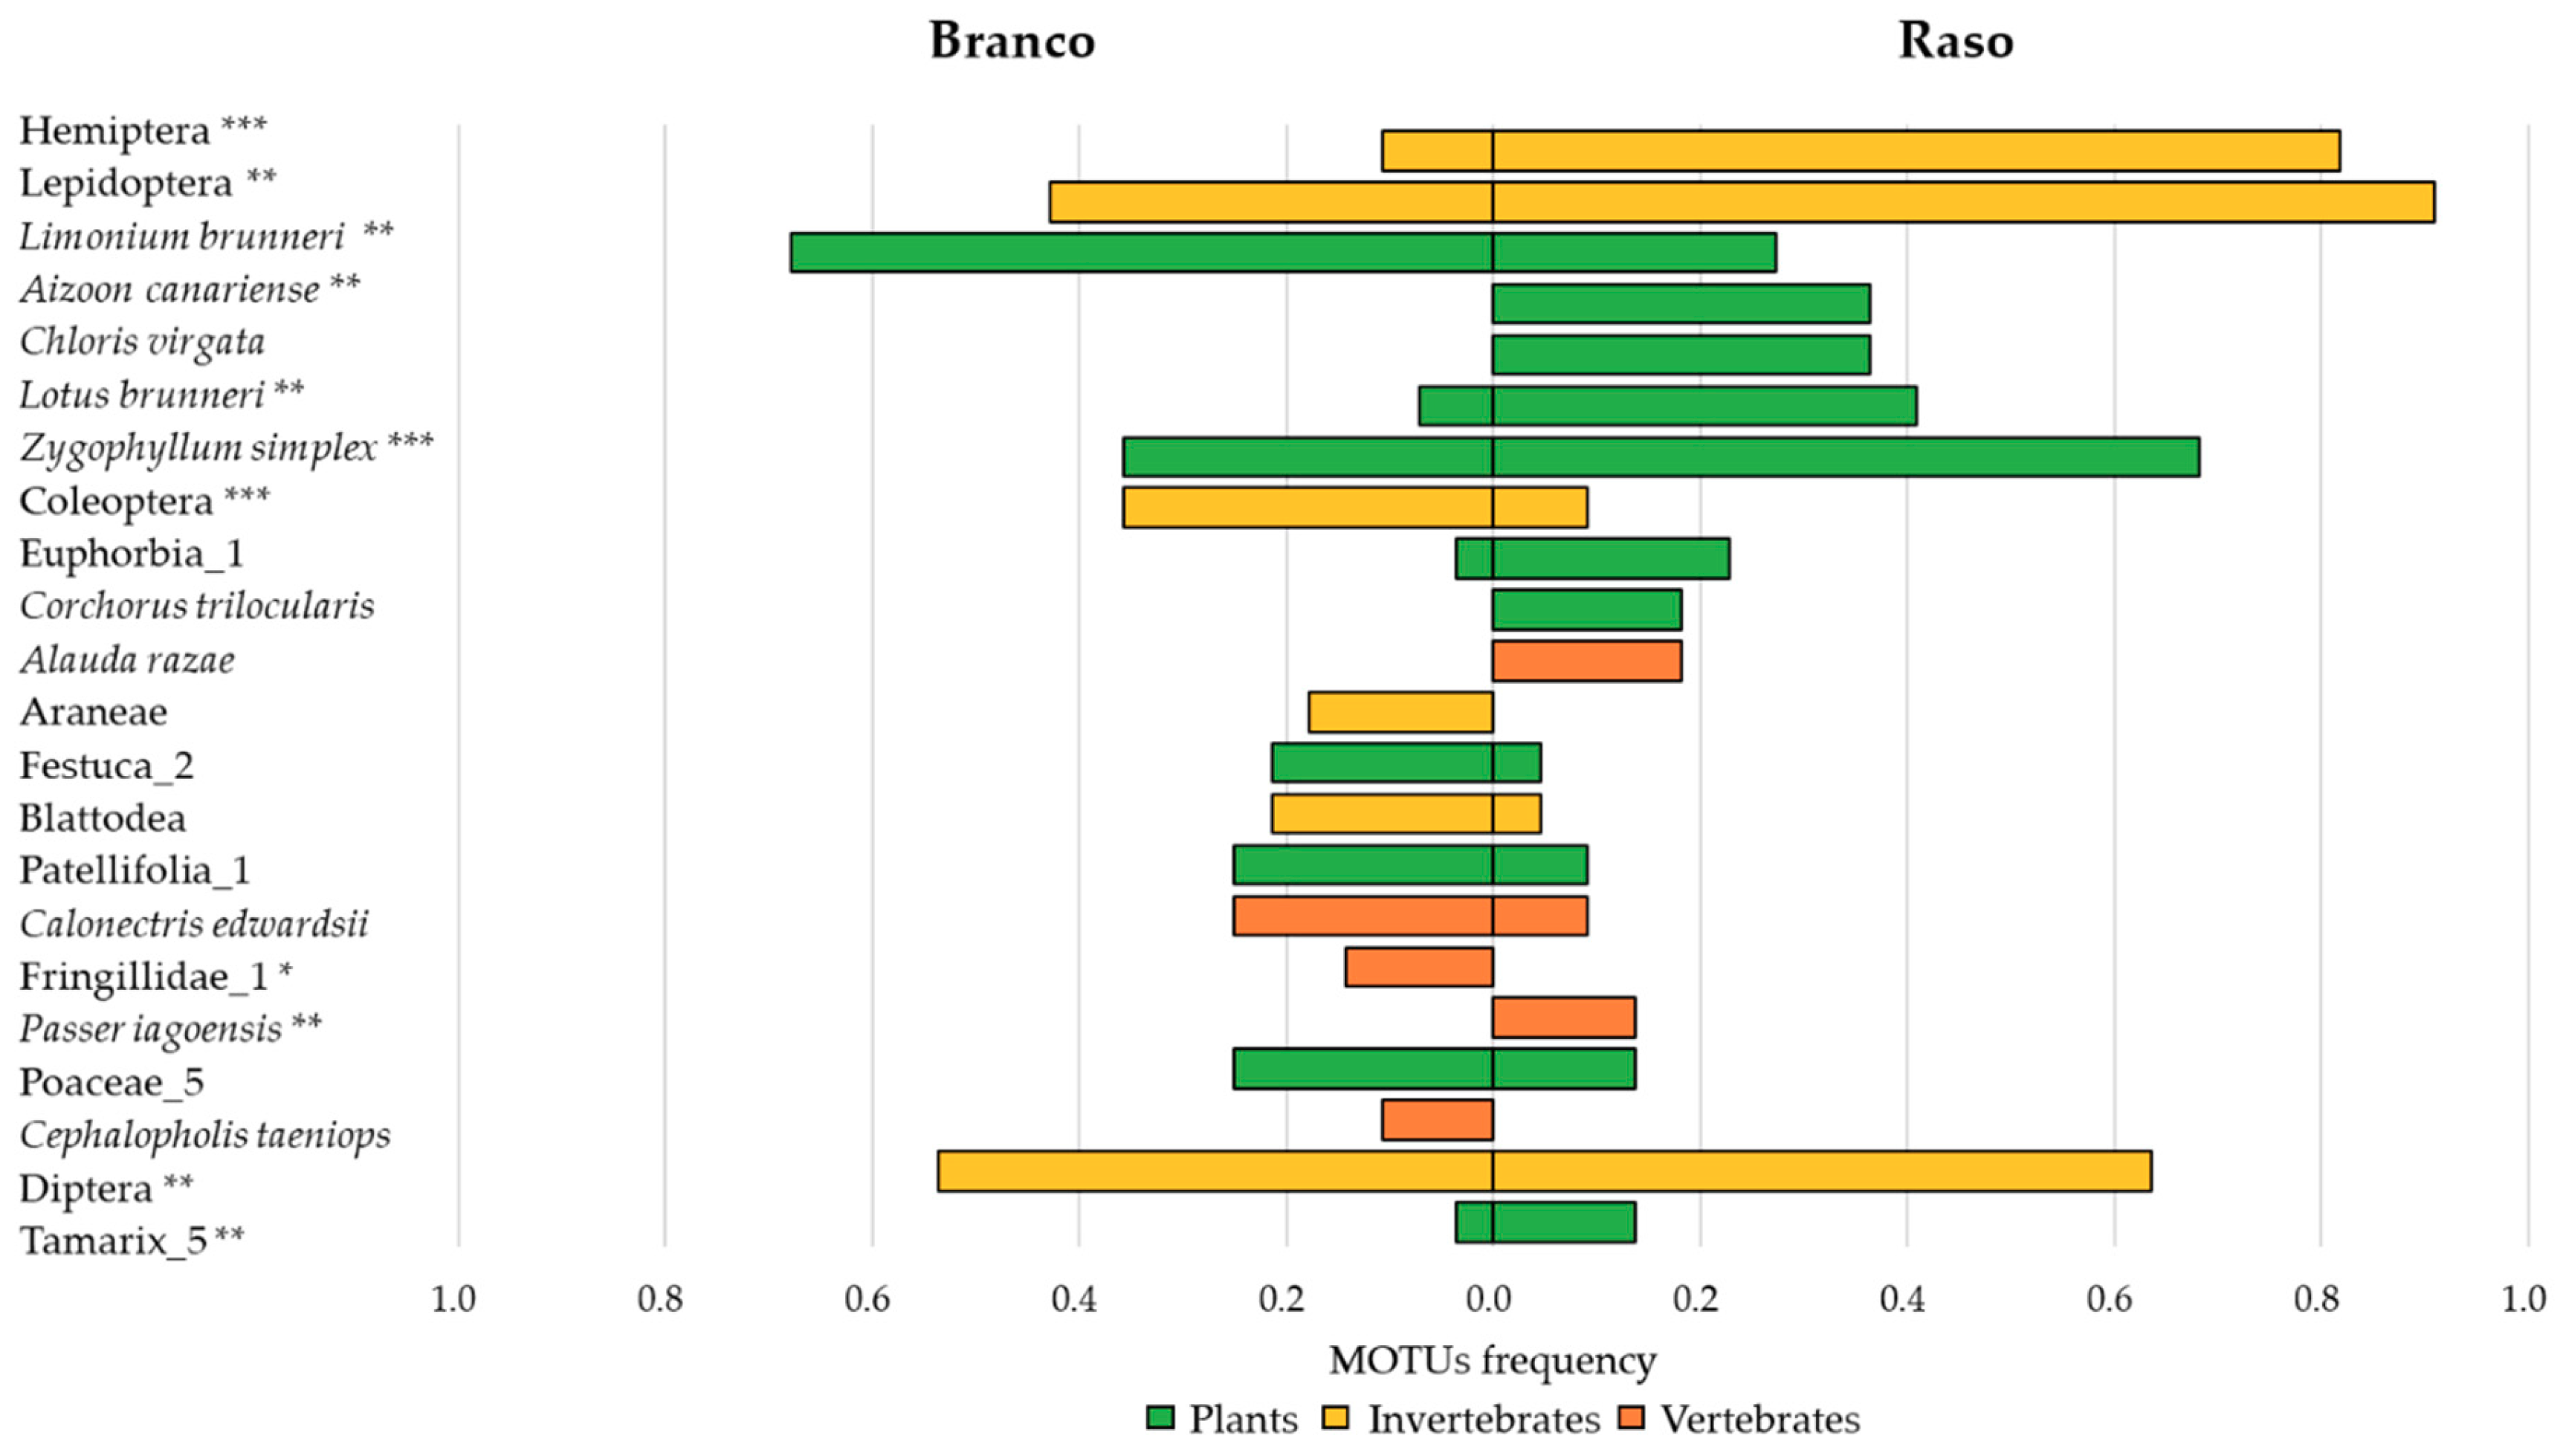
3. Results
4. Discussion
5. Conclusions
Supplementary Materials
Author Contributions
Funding
Acknowledgments
Conflicts of Interest
References
- Escribano-Avila, G.; Lara-Romero, C.; Heleno, R.; Traveset, A. Tropical Seed Dispersal Networks: Emerging Patterns, Biases, and Keystone Species Traits. In Ecological Networks in the Tropics; Dáttilo, W., Rico-Gray, V., Eds.; Springer: Cham, Switzerland, 2018; pp. 93–110. ISBN 978-3-319-6827-3. [Google Scholar]
- Olesen, J.M.; Valido, A. Lizards as pollinators and seed dispersers: An island phenomenon. Trends Ecol. Evol. 2003, 18, 177–181. [Google Scholar] [CrossRef]
- Miranda, E.B.P. The plight of reptiles as ecological actors in the Tropics. Front. Ecol. Evol. 2017, 5, 159. [Google Scholar] [CrossRef]
- Hansen, R.M. Dietary of the chuckwalla, Sauromalus obesus, determined by dung analysis. Herpetologica 1974, 30, 120–123. [Google Scholar]
- Brown, D.S.; Jarman, S.N.; Symondson, W.O. Pyrosequencing of prey DNA in reptile faeces: Analysis of earthworm consumption by slow worms. Mol. Ecol. Resour. 2012, 12, 259–266. [Google Scholar] [CrossRef] [PubMed]
- Brown, D.S.; Ebenezer, K.L.; Symondson, W.O. Molecular analysis of the diets of snakes: Changes in prey exploitation during development of the rare smooth snake Coronella austriaca. Mol. Ecol. 2014, 23, 3734–3743. [Google Scholar] [CrossRef]
- Taylor, H.R.; Gemmell, N.J. Emerging technologies to conserve biodiversity: Further opportunities via genomics. Response to Pimm et al. Trends Ecol. Evol. 2016, 31, 171–172. [Google Scholar] [CrossRef] [PubMed]
- Pompanon, F.; Deagle, B.E.; Symondson, W.O.C.; Brown, D.S.; Jarman, S.N.; Taberlet, P. Who is eating what: Diet assessment using next generation sequencing. Mol. Ecol. 2012, 21, 1931–1950. [Google Scholar] [CrossRef] [PubMed]
- Kartzinel, T.R.; Pringle, R.M. Molecular detection of invertebrate prey in vertebrate diets: Trophic ecology of Caribbean island lizards. Mol. Ecol. Resour. 2015, 15, 903–914. [Google Scholar] [CrossRef]
- Gil, M.J.; Guerrero, F.; Perez-Mellado, V. Seasonal variation in diet composition and prey selection in the Mediterranean gecko Tarentola mauritanica. Isr. J. Zool. 1994, 40, 61–74. [Google Scholar] [CrossRef]
- Hódar, J.; Pleguezuelos, J.; Villafranca, C.; Fernández-Cardenete, J. Foraging mode of the Moorish gecko Tarentola mauritanica in an arid environment: Inferences from abiotic setting, prey availability and dietary composition. J. Arid Environ. 2006, 65, 83–93. [Google Scholar] [CrossRef]
- Ibrahim, A.A. Behavioural ecology of the White-spotted Gecko, Tarentola annularis (Reptilia: Gekkonidae), in Ismailia City, Egypt. Zool. Middle East 2004, 31, 23–38. [Google Scholar] [CrossRef]
- Crochet, P.-A.; Renoult, J.P. Tarentola annularis annularis (Geoffroy de Saint-Hilaire, 1827) preying on a mammal. Herpetol. Notes 2008, 1, 58–59. [Google Scholar]
- Mitchell-Thomé, R.C. Geology of the Middle Atlantic Islands; Lubrecht & Cramer Ltd.: Port Jervis, NY, USA, 1976; ISBN 978-3-443-11012-3. [Google Scholar]
- Anonymous. Boletim Oficial da República de Cabo Verde Nª. 25, I Série; Justiça, M.d., Ed.; Vol. Decreto-Lei Nº. 79/II/90, 29 de Maio de 1990; Governo de Cabo Verde: Praia, Cabo Verde, 1990. [Google Scholar]
- Anonymous. Boletim Oficial da República de Cabo Verde Nª. 36, I Série; Justiça, M.d., Ed.; Vol. Decreto-Lei Nº. 40/2003, 24 de Fevereiro de 2003; Governo de Cabo Verde: Praia, Cabo Verde, 2003. [Google Scholar]
- Arechavaleta, M.; Zurita, N.; Marrero, M.; Martín, J. Lista Preliminar de Especies Silvestres de Cabo Verde (Hongos, Plantas y Animales Terrestres); Consejería de Medio Ambiente y Ordenación, Gobierno de Canarias: Santa Cruz de Tenerife, Spain, 2005; ISBN 8489729255. [Google Scholar]
- Vasconcelos, R.; Freitas, R.; Hazevoet, C.J. The Natural History of the Desertas Islands–Santa Luzia, Branco e Raso; Sociedade Caboverdeana de Zoologia: Porto, Portugal, 2015; ISBN 9788460657934. [Google Scholar]
- Mateo, J.A.; García-Márquez, M.; López-Jurado, L.; Pether, J. Nuevas observaciones herpetológicas en las islas Desertas (archipielago de Cabo Verde). Bol. Asoc. Herpetol. Esp. 1997, 8, 8–11. [Google Scholar]
- Schleich, H. Der kapverdische Riesengecko, Tarentola delalandii gigas (Bocage, 1896) (Reptilia: Sauria–Geckonidae). Spixiana 1980, 3, 147–155. [Google Scholar]
- Vasconcelos, R.; Perera, A.; Geniez, P.; Harris, D.J.; Carranza, S. An integrative taxonomic revision of the Tarentola geckos (Squamata, Phyllodactylidae) of the Cape Verde Islands. Zool. J. Linn. Soc. 2012, 164, 328–360. [Google Scholar] [CrossRef]
- Carranza, S.; Arnold, E.; Mateo, J.A.; López-Jurado, L.F. Long-distance colonization and radiation in gekkonid lizards, Tarentola (Reptilia: Gekkonidae), revealed by mitochondrial DNA sequences. Proc. R. Soc. Lond. B Biol. Sci. 2000, 267, 637–649. [Google Scholar] [CrossRef] [PubMed]
- Mateo, J.A.; Lopez Jurado, L.F.; Geniez, P. Historical distribution of Razo lark Alauda razae in the Cape Verde archipelago. Alauda 2009, 77, 309–312. [Google Scholar]
- Vasconcelos, R. Tarentola gigas, The IUCN Red List of Threatened Species 2013: e.T13152177A13152180. Available online: http://0-dx-doi-org.brum.beds.ac.uk/10.2305/IUCN.UK.2013-1.RLTS.T13152177A13152180.en (accessed on 22 June 2018).
- Vasconcelos, R.; Brito, J.C.; Carranza, S.; Harris, D.J. Review of the distribution and conservation status of the terrestrial reptiles of the Cape Verde Islands. Oryx 2013, 47, 77–87. [Google Scholar] [CrossRef] [Green Version]
- Geraldes, P.; Kelly, J.; Melo, T.; Donald, P. The Restoration of Santa Luzia, Republic of Cabo Verde, Feasibility Study and Restoration action plan 2016–2020. Protecting Threatened and Endemic Species in Cape Verde: A Major Island Restoration Project (CEPF); Sociedade Portuguesa para o Estudo das Aves: Praia, Cabo Verde & Lisboa, Portugal, 2016; p. 86. [Google Scholar]
- Hazevoet, C.J. Breeding birds. In The Natural History of the Desertas Islands–Santa Luzia, Branco e Raso; Vasconcelos, R., Freitas, R., Hazevoet, C.J., Eds.; Sociedade Caboverdiana de Zoologia: Porto, Portugal, 2015; pp. 206–242. ISBN 9788460657934. [Google Scholar]
- Hazevoet, C.J. The Birds of the Cape Verde Islands; British Ornithologists’ Union Check List; Tring: Hertfordshire, UK, 1995; Volume 13, ISBN 9780907446170. [Google Scholar]
- Donald, P.F.; De Ponte, M.; Groz, M.J.P.; Taylor, R. Status, ecology, behaviour and conservation of Raso Lark Alauda razae. Bird Conserv. Int. 2003, 13, 13–28. [Google Scholar] [CrossRef]
- Mateo, J.A.; Geniez, P.; Hernández-Acosta, C.N.; López-Jurado, L.F. ¿Realmente importa tanto el tamaño?: La dieta de las dos especies del género Tarentola de la Isla de Raso (Cabo Verde). Bol. Asoc. Herpetol. Esp. 2016, 27, 19–23. [Google Scholar]
- Diniz, A.C.; Matos, G.C. Carta de Zonação Agro-Ecológica e da Vegetação de Cabo Verde VI e VII—Ilha de S. Vicente –Ilha Sta. Luzia. Garcia da Horta, Série de Botânica. IICT 1994, 12, 69–100. [Google Scholar]
- Freitas, R.; Hazevoet, C.J.; Vasconcelos, R. Geography and geology. In The Natural History of the Desertas Islands–Santa Luzia, Branco e Raso; Vasconcelos, R., Freitas, R., Hazevoet, C.J., Eds.; Sociedade Caboverdeana de Zoologia: Porto, Portugal, 2015; pp. 14–36. ISBN 9788460657934. [Google Scholar]
- Joger, U. Die radiation der gattung Tarentola in makaronesien (Reptilia: Sauria: Gekkonidae). Cour. Forsch.-Inst. Senckenberg 1984, 71, 91–111. [Google Scholar]
- Schleich, H. Die Geckos der Gattung Tarentola der Kapverden (Reptilia: Sauria: Gekkonidae). Cour. Forsch.-Inst. Senckenberg 1984, 68, 95–106. [Google Scholar]
- Romeiras, M.M.; Monteiro, F.; Duarte, M.C.; Schaefer, H.; Carine, M. Patterns of genetic diversity in three plant lineages endemic to the Cape Verde Islands. AoB PLANTS 2015, 7, plv051. [Google Scholar] [CrossRef] [PubMed]
- Carranza, S.; Arnold, E.N.; Thomas, R.H.; López-Jurado, L.F. Status of the extinct giant lacertid lizard Gallotia simonyi simonyi (Reptilia: Lacertidae) assessed using mtDNA sequences from museum specimens. Herpetol. J. 1999, 9, 83–86. [Google Scholar]
- Taberlet, P.; Coissac, E.; Pompanon, F.; Gielly, L.; Miquel, C.; Valentini, A.; Vermat, T.; Corthier, G.; Brochmann, C.; Willerslev, E. Power and limitations of the chloroplast trnL (UAA) intron for plant DNA barcoding. Nucleic Acids Res. 2007, 35, 14. [Google Scholar] [CrossRef] [PubMed]
- Riaz, T.; Shehzad, W.; Viari, A.; Pompanon, F.; Taberlet, P.; Coissac, E. ecoPrimers: Inference of new DNA barcode markers from whole genome sequence analysis. Nucleic Acids Res. 2011, 39, e145. [Google Scholar] [CrossRef] [PubMed]
- Taberlet, P.; Gielly, L.; Pautou, G.; Bouvet, J. Universal primers for amplification of three non-coding regions of chloroplast DNA. Plant Mol. Biol. 1991, 17, 1105–1109. [Google Scholar] [CrossRef]
- Folmer, O.; Black, M.; Hoeh, W.; Lutz, R.; Vrijenhoek, R. DNA primers for amplification of mitochondrial cytochrome c oxidase subunit I from diverse metazoan invertebrates. Mol. Mar. Biol. Biotechnol. 1994, 3, 294–299. [Google Scholar]
- Illumina. 16S Metagenomic Sequencing Library Preparation. Available online: https://support.illumina.com/documents/documentation/chemistry_documentation/16s/16s-metagenomic-library-prep-guide-15044223-b.pdf (accessed on 8 July 2018).
- Mata, V.A.; Amorim, F.; Corley, M.F.; McCracken, G.F.; Rebelo, H.; Beja, P. Female dietary bias towards large migratory moths in the European free-tailed bat (Tadarida teniotis). Biol. Lett. 2016, 12, 20150988. [Google Scholar] [CrossRef]
- Larsson, J. Eulerr: Area-Proportional Euler and Venn Diagrams with Ellipses. R Package Version 3.4.1.. Available online: https://cran.r-project.org/package=eulerr (accessed on 10 September 2018).
- Hsieh, T.C.; Ma, K.H.; Chao, A. iNEXT: Interpolation and extrapolation for species diversity. Available online: https://cran.r-project.org/web/packages/iNEXT/index.html (accessed on 20 July 2018).
- Oksanen, J.; Blanchet, F.G.; Friendly, M.; Kindt, R.; Legendre, P.; McGlinn, D.; Minchin, P.R.; O’Hara, R.B.; Simpson, G.L.; Solymos, P.; et al. Vegan: Community Ecology Package. Available online: https://cran.r-project.org/web/packages/vegan/index.html (accessed on 11 August 2018).
- Gotelli, N.; Hart, E.; Ellison, A. EcoSimR: Null Model Analysis for Ecological Data. Available online: https://cran.r-project.org/web/packages/EcoSimR/index.html (accessed on 11 August 2018).
- Holechek, J.L.; Vavra, M.; Pieper, R.D. Botanical composition determination of range herbivore diets: A review. J. Range Manag. 1982, 35, 309–315. [Google Scholar] [CrossRef]
- Ingerson-Mahar, J. Relating diet and morphology in adult carabid beetles. In The Agroecology of Carabid Beetles; Holland, J.M., Ed.; Intercept: Andover, NH, UK, 2002; pp. 111–136. ISBN 1-898298-76-9. [Google Scholar]
- Seguro, M. Unravelling the Ecology of the Raso Wall Gecko (Tarentola raziana) through Metabarcoding; Faculdade de Ciências da Universidade do Porto: Porto, Portugal, 2017. [Google Scholar]
- Schleich, H. Herpetofauna Caboverdiana. Spixiana 1987, 12, 1–75. [Google Scholar]
- Mateo, J.A.; Pleguezuelos, J.M. Cannibalism of an endemic island lizard (genus Gallotia). Zool. Anz. 2015, 259, 131–134. [Google Scholar] [CrossRef]
- Bowser, A.K.; Diamond, A.W.; Addison, J.A. From puffins to plankton: A DNA-based analysis of a seabird food chain in the Northern Gulf of Maine. PLoS ONE 2013, 8, e83152. [Google Scholar] [CrossRef] [PubMed]
- Carretero, M.A. From set menu to a la carte. Linking issues in trophic ecology of Mediterranean lacertids. Ital. J. Zool. 2004, 71, 121–133. [Google Scholar] [CrossRef]
- Szarski, H. Some remarks on herbivorous lizards. Evolution 1962, 16, 529. [Google Scholar] [CrossRef]
- Godínez-Álvarez, H. Pollination and seed dispersal by lizards: A review. Rev. Chil. Hist. Nat. 2004, 77, 569–577. [Google Scholar] [CrossRef]
- Moodie, R.L. The “stomach stones” of reptiles. Science 1912, 35, 377–378. [Google Scholar] [CrossRef]
- Catarino, S.; Duarte, M.C.; Romeiras, M.M. Limonium brunneri. The IUCN Red List of Threatened Species 2017: e.T110610252A110610255. Available online: http://0-dx-doi-org.brum.beds.ac.uk/10.2305/IUCN.UK.2017-3.RLTS.T110610252A110610255.en (accessed on 15 September 2018).
- Ancochea, E.; Huertas, M.J.; Hernán, F.; Brändle, J.L.; Alonso, M. Structure, composition and age of the small islands of Santa Luzia, Branco and Raso (Cape Verde Archipelago). J. Volcanol. Geotherm. Res. 2015, 302, 257–272. [Google Scholar] [CrossRef]


© 2018 by the authors. Licensee MDPI, Basel, Switzerland. This article is an open access article distributed under the terms and conditions of the Creative Commons Attribution (CC BY) license (http://creativecommons.org/licenses/by/4.0/).
Share and Cite
Pinho, C.J.; Santos, B.; Mata, V.A.; Seguro, M.; Romeiras, M.M.; Lopes, R.J.; Vasconcelos, R. What Is the Giant Wall Gecko Having for Dinner? Conservation Genetics for Guiding Reserve Management in Cabo Verde. Genes 2018, 9, 599. https://0-doi-org.brum.beds.ac.uk/10.3390/genes9120599
Pinho CJ, Santos B, Mata VA, Seguro M, Romeiras MM, Lopes RJ, Vasconcelos R. What Is the Giant Wall Gecko Having for Dinner? Conservation Genetics for Guiding Reserve Management in Cabo Verde. Genes. 2018; 9(12):599. https://0-doi-org.brum.beds.ac.uk/10.3390/genes9120599
Chicago/Turabian StylePinho, Catarina Jesus, Bárbara Santos, Vanessa A. Mata, Mariana Seguro, Maria M. Romeiras, Ricardo Jorge Lopes, and Raquel Vasconcelos. 2018. "What Is the Giant Wall Gecko Having for Dinner? Conservation Genetics for Guiding Reserve Management in Cabo Verde" Genes 9, no. 12: 599. https://0-doi-org.brum.beds.ac.uk/10.3390/genes9120599