Article

A Comparative Analysis of Methods for Determining Odour-Related Separation Distances around a Dairy Farm in Beijing, China

1
School of Chemistry and Biological Engineering, University of Science and Technology Beijing, Beijing 100083, China
2
WG Environmental Health, Unit for Physiology and Biophysics, University of Veterinary Medicine, Veterinärplatz 1, A-1210 Vienna, Austria
3
Beijing Municipal Research Institute of Environmental Protection, Beijing 100037, China
4
Department of Environmental Meteorology, Central Institute of Meteorology and Geodynamics, Hohe Warte 38, A-1190 Vienna, Austria
*
Author to whom correspondence should be addressed.
Submission received: 28 February 2019 / Revised: 25 April 2019 / Accepted: 26 April 2019 / Published: 30 April 2019

Abstract

:
Concentrated animal feeding operations (CAFOs) such as dairy farms are a source of odorous compound emissions. In this study, by identifying relevant odour sources within a 300-head dairy farm and quantifying their emissions, we determined the separation distances to avoid odour annoyance around the dairy farm with two empirical models (Austrian and German Verein Deutscher Ingenieure (VDI) model) and a dispersion model (AERMOD). Besides, this study ponders on the selection of an appropriate meteorological station that best represents the area surrounding the farm. Results show that the maximum separation distances of an exceedance probability of P = 15% determined by the two empirical and the dispersion models are 524 m, 440 m and 655 m, while the minimum values are 202 m, 135 m, and 149 m, respectively. The NE–SW stretching separation distances match well with the wind rose. The mean ratios of separation distances determined by the two empirical models to that of the dispersion model are 1.23 and 0.95. Moreover, statistics of the separation distances indicate good accordance between the empirical models and the dispersion model.

1. Introduction

The on-going world population growth means an increased demand for foods of animal origin, with the inevitable escalation of livestock production systems [1]. Despite its benefits, widespread concerns have been raised that environmental quality is at risk due to the adoption of more intensive livestock practices. Livestock farming contributes to air pollution in various perspectives by emitting a wide range of gaseous and particulate compounds to the atmosphere [2]. Notably, odour is one of the major environmental nuisances in the surroundings of concentrated animal feeding operations (CAFOs), such as dairy farms [3].
Odour exposure can trigger unpleasant reactions ranging from emotional stress to physical symptoms [4,5,6]. Within this context, annoyance has been recognised as one of the most important effects after a resident is exposed to malodour [7]. Recent epidemiological investigations have supported the mechanism that associations between exposures and health symptoms are indirect, relayed through annoyance [8]. A commonly used procedure in countries around the world to avoid odour annoyance makes use of separation distances between emission sources and residential areas [9]. In order to prevent conflicts, it is widely recognised that good planning is a key factor in reducing the occurrence of incompatible land uses located near odour-emitting facilities [10]. In this sense, appropriate methods for determining reliable separation distance are needed.
Odour policies can enforce the separation distance as fixed, given by a pre-defined distance; or variable, determined as the direction-dependent distance on a case-by-case basis. Regarding the latter, dispersion modelling is a broadly used method for calculating direction-dependent separation distances [11]. The time series of ambient odour concentrations predicted by dispersion models is evaluated by so-called odour impact criteria, thereby determining the distances in a direction-dependent manner [12]. Odour impact criteria are formed by an odour concentration threshold, the exceedance probability (P) of this threshold and the averaging time used within the model interface to predict concentrations. The values for each of these parameters are defined in light of the target level of protection against odour annoyance [5].
Another method for obtaining direction-dependent separation distances mainly for CAFOs uses empirical equations. These equations include possibly many factors in it (e.g., type of animal, size and characteristics of the operation, topography, meteorology, etc.) [13]. In doing so, the empirical equations have been developed to facilitate the calculation of separation distances, by using simplified regression models which were derived on the basis of dispersion calculations. In Germany, an empirical model has been developed based on dispersion calculations with a Lagrangian particle dispersion model (AUSTAL2000). It has been further included as a German VDI guideline [14]. In Austria, another empirical model has been designed grounded on dispersion calculations with a Gaussian plume model (AODM, Austrian Odour Dispersion Model) [15]. The general objectives of these two empirical models are identical: To enable a simple and straightforward initial evaluation of the impact on planned livestock buildings. Detailed information on the two referred empirical models can be found in Reference [15] for Austria and in Reference [16] for Germany [14]. Although empirical models offer some benefits and are being applied for regulatory purposes, they still need more substantiation against refined dispersion models or field inspections for a diversity of conditions [17]. For instance, in China, the setting of the present study, research on applying dispersion and empirical models to determine direction-dependent separation distances is still lacking.
The main goal of this work is to compare the separation distances due to the application of the German VDI and Austrian empirical models against a dispersion model with a regulatory character (AERMOD Modelling System). These different methods were applied to a dairy farm in Beijing, China. The results were explored by visual inspection of the contour maps and statistical measures. Importantly, this work ponders on the selection of a suitable meteorological station that best represents the area surrounding the farm. To the best of our knowledge, this is the first time that such comparative analysis has been conducted for a site located in China. The findings are discussed in order to provide recommendations for future applications.

2. Methods

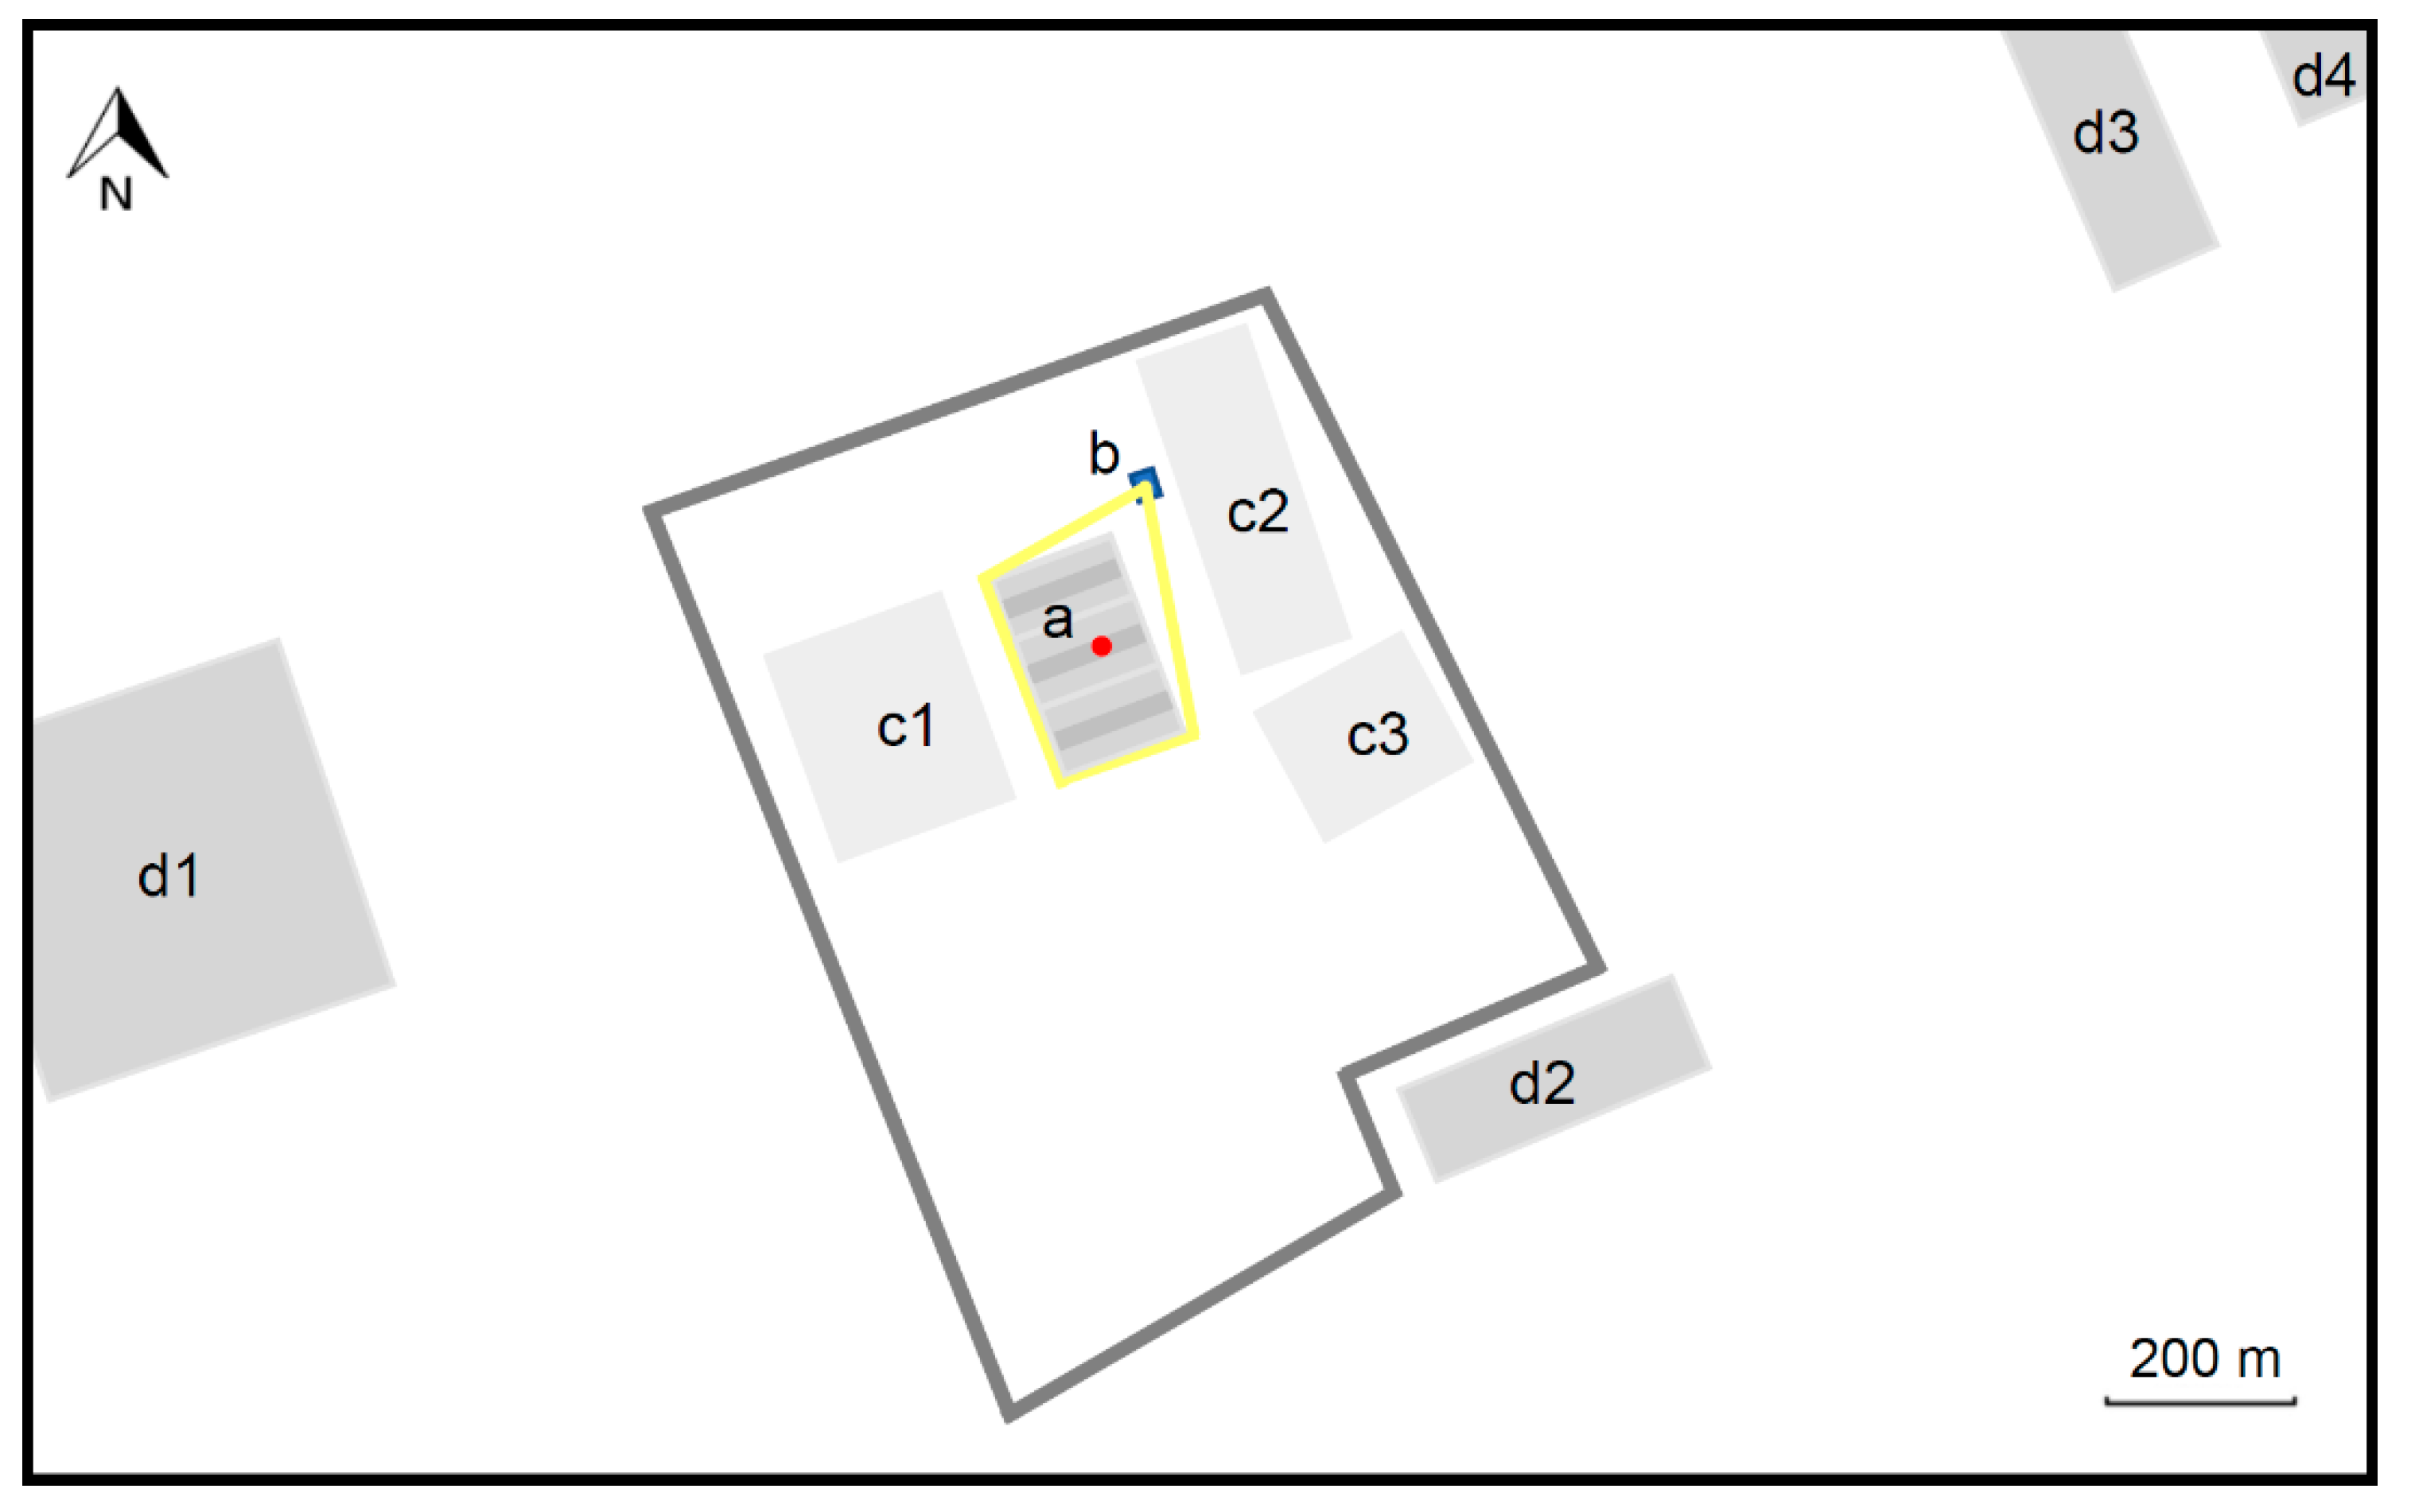
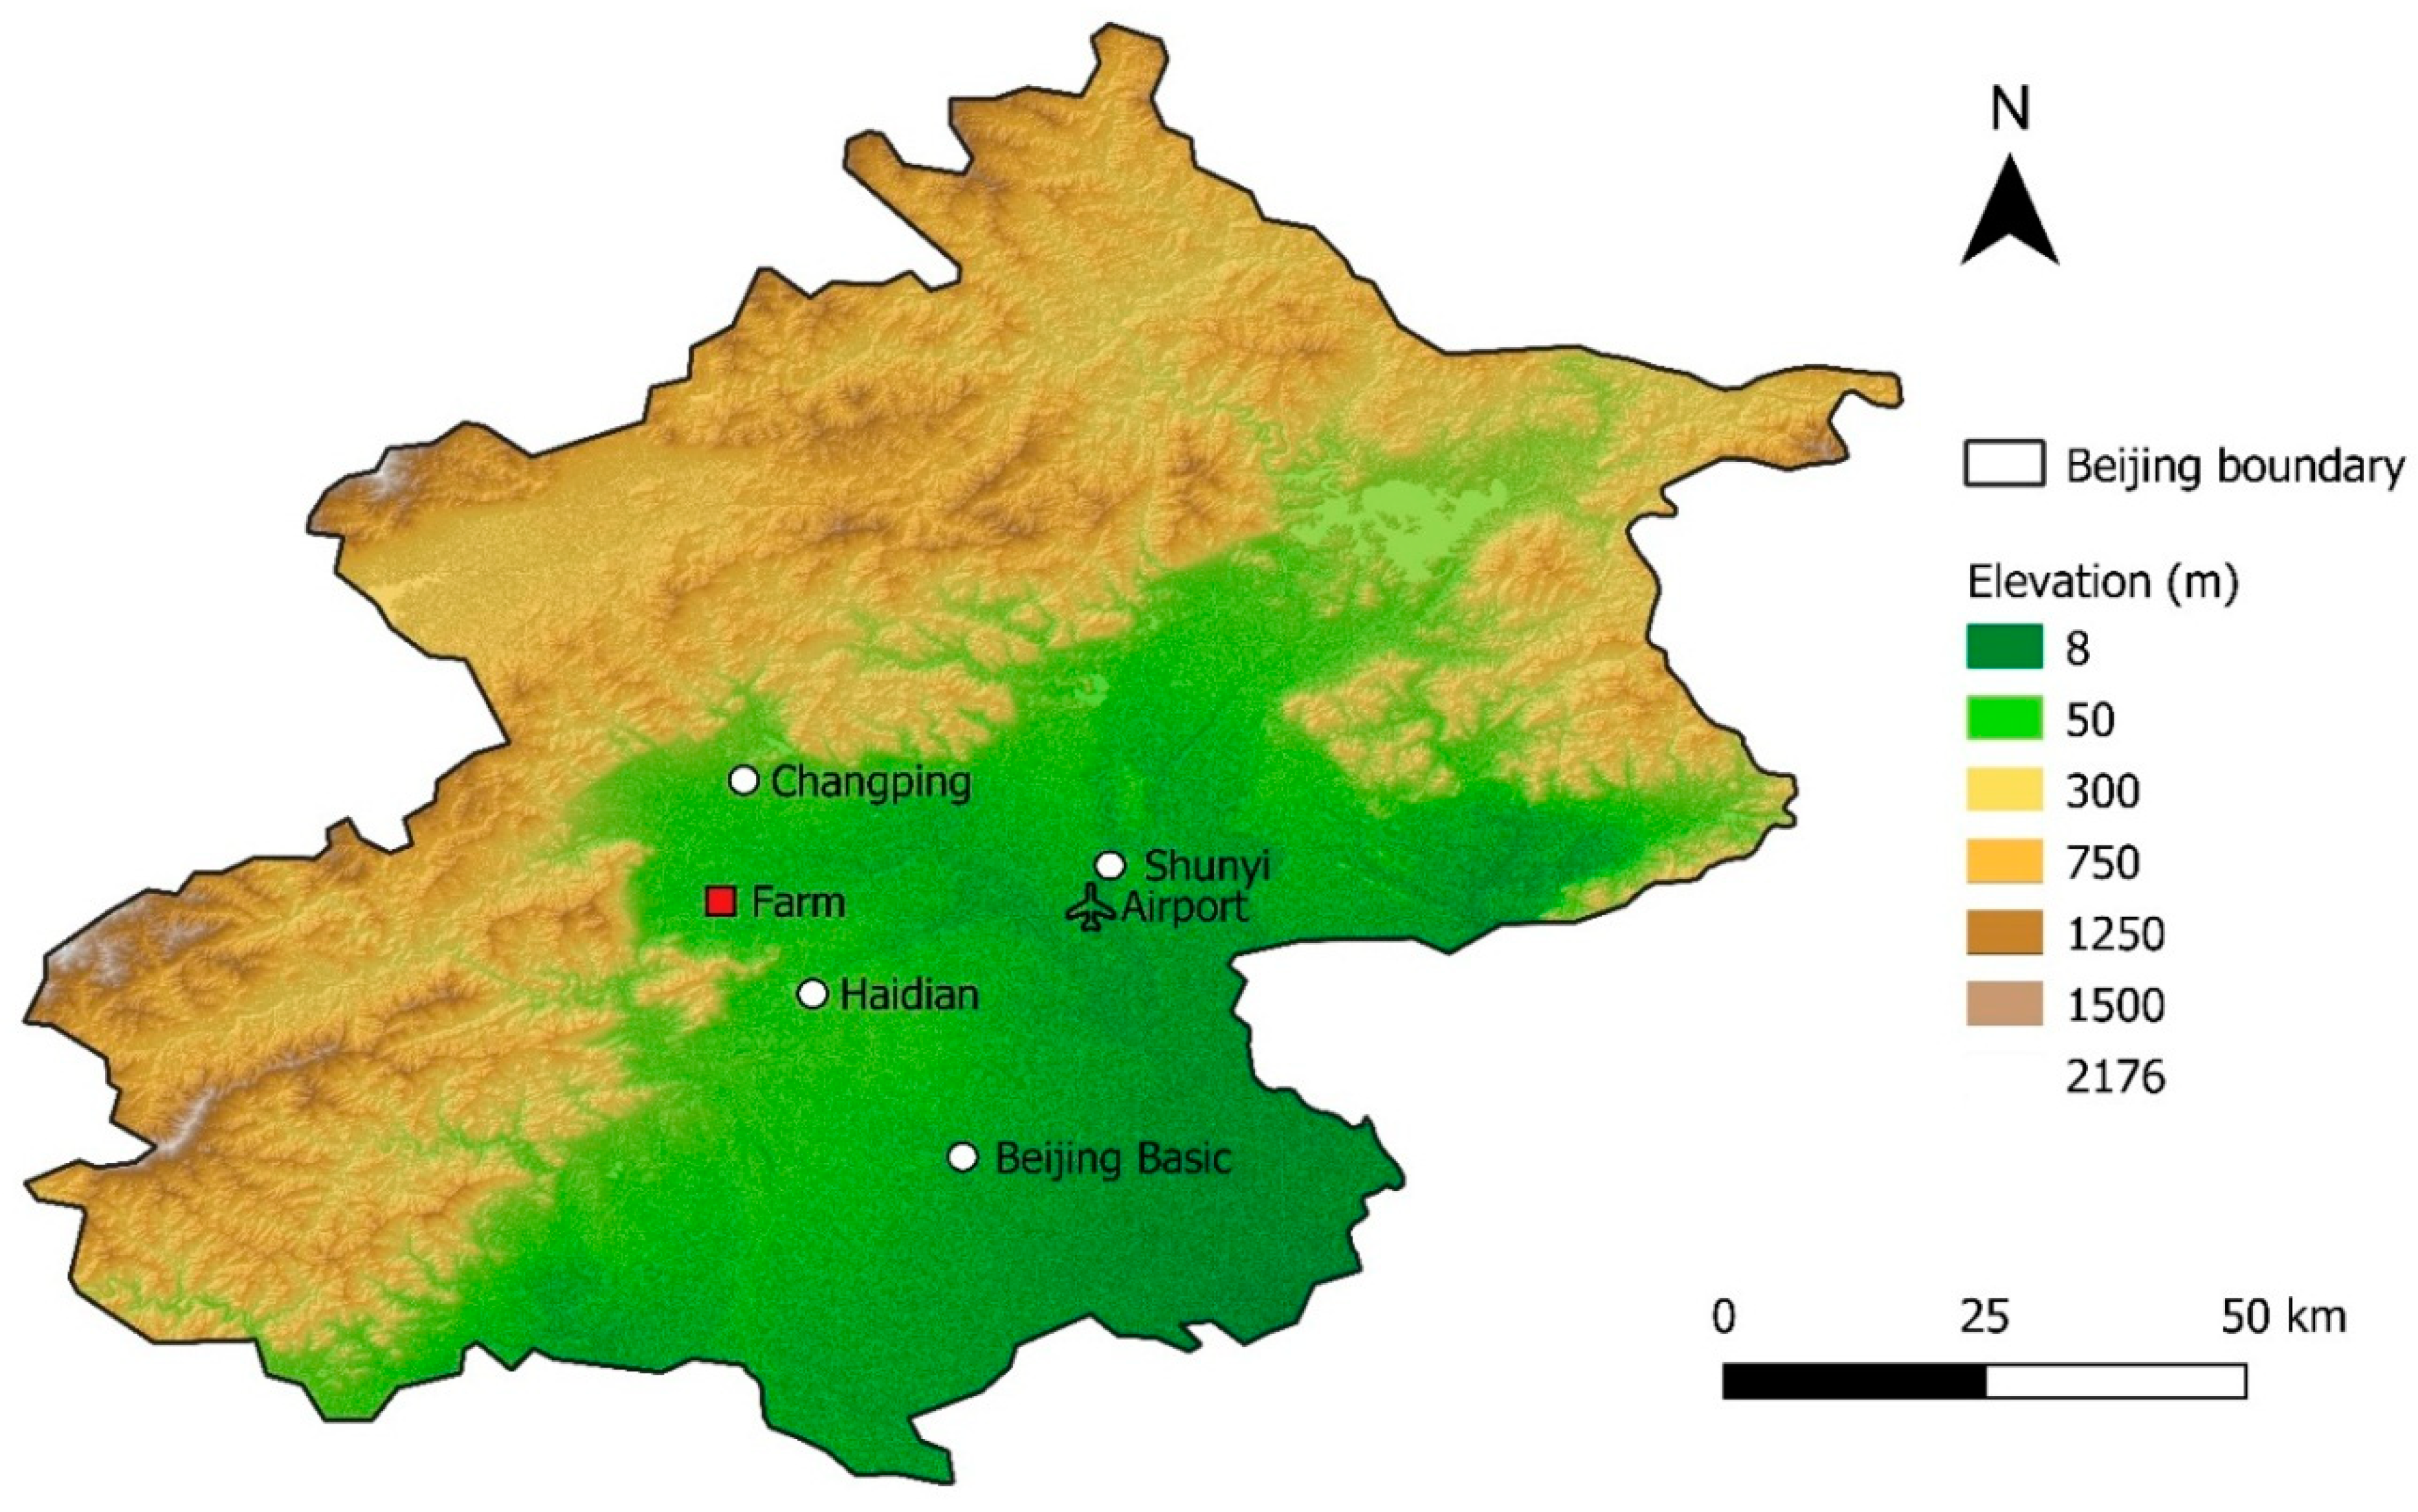
2.1. Site Description and Structure of the Dairy Farm

Beijing is located at the Northern part of the North China Plain and it is divided into 16 districts, consisting of 6 urban and 10 suburban districts. Beijing has an area of 16,410.54 km2, and the principal land uses include urban and built-up, forest, cropland, shrub and water [18]. Beijing has an average elevation of 43.5 m, but it is enclosed by the Taihang Mountains (average elevation 1500–2000 m) to the West and the Yanshan Mountains (average elevation 600–1500 m) to the North [19]. The city has a monsoon-influenced, temperate continental climate, characterised by hot and humid summers and cold, windy, and dry winters [20].
The commercial dairy farm is located approximately 30 km Northwest from central Beijing (40.10° N, 116.16° E). The terrain at the site is mostly flat, and the land use is typically farmland. The farm has an area of 0.67 km2, including feedlot pens, feed mill, slurry treatment workshop, and office area. About 300 cows are raised in the three feedlot pens with a total area of 42,000 m2. The feed of the cows was corn silage and concentrate supplement (corn, bean pulp, bran, etc.). The average body mass of the cows was 1.2 LU (livestock unit, 1 LU = 500 kg). The farm contains three pens (Figure 1). In the middle of each pen, there is a barn for the cows to feed and rest. Inside the barn, there are two rows of free stalls and feed tables (feeding alleys), separated by a central aisle. The area of each of the feed tables is 150 m2. The manure on the feeding area in the barn was cleaned using a scraper every day, and covered and stored in a nearby vacant barn. The details behind the determination of the emission focal point and envelope line shown in Figure 1 are described in Section 2.3.

2.2. Odour Emission Rate

The odour emission rate for the dairy farm was determined in accordance with the VDI 3894 Part 2 [14]. Briefly, the odour emission rate of a livestock facility is the product of the mean body mass of the animals and the body mass specific emission factor (ouE s−1 LU−1). The odour emission rate of an area source is the product of the source area (m−2) and the area-specific emission factor (ouE s−1 m−2). The VDI emission factors are called “conventional values” to emphasize that these values are based on a literature review, a plausibility analysis, and practical experience. The related activity value is the body mass given in livestock units (1 LU = 500 kg) with 1.2 LU per cow. In the present study, the odour sources in the dairy farm that have been identified include three barns for 100 cows each, the feed storage for corn silage and the manure treatment area. The solid part of the manure is removed on a regular basis from the barns and composted in an enclosed shed close to the barns. For this reason, it was assumed that composting-related odour emissions can be neglected. After the composting process, this substrate is used for the production of earthworms. Similarly, no odour emission was assumed for this process step. The total odour emission rate for the dairy farm was determined by the sum of the odour emission rates of each individual source under the premise that mixing effects are ignored (Table 1).

2.3. Emission Focal Point

The application of the two empirical models is limited to only one odour source. According to the VDI 3894 Part 2 [14], in the case of an individual source, there is only one emission focal point, which is consequently used as the distance reference point. However, the present case involves four individual sources, so that the overall emission focal point was calculated using the coordinates of the four individual odour sources (three barns and the feed storage) which are weighted by the odour emission rates. According to the VDI 3894 Part 2 [14], the discrepancy between a point source and an area source is taken into account by a single value which describes the maximum distance between the emission focal point and the maximum elongation of the source. Taking into account the dimensions of the odour sources, an envelope line was arranged (yellow line in Figure 1). Following, the farm was centred in its emission focal point which lies in the origin of the coordinate system. This means that the emission focal point is the reference point for calculating the distances.

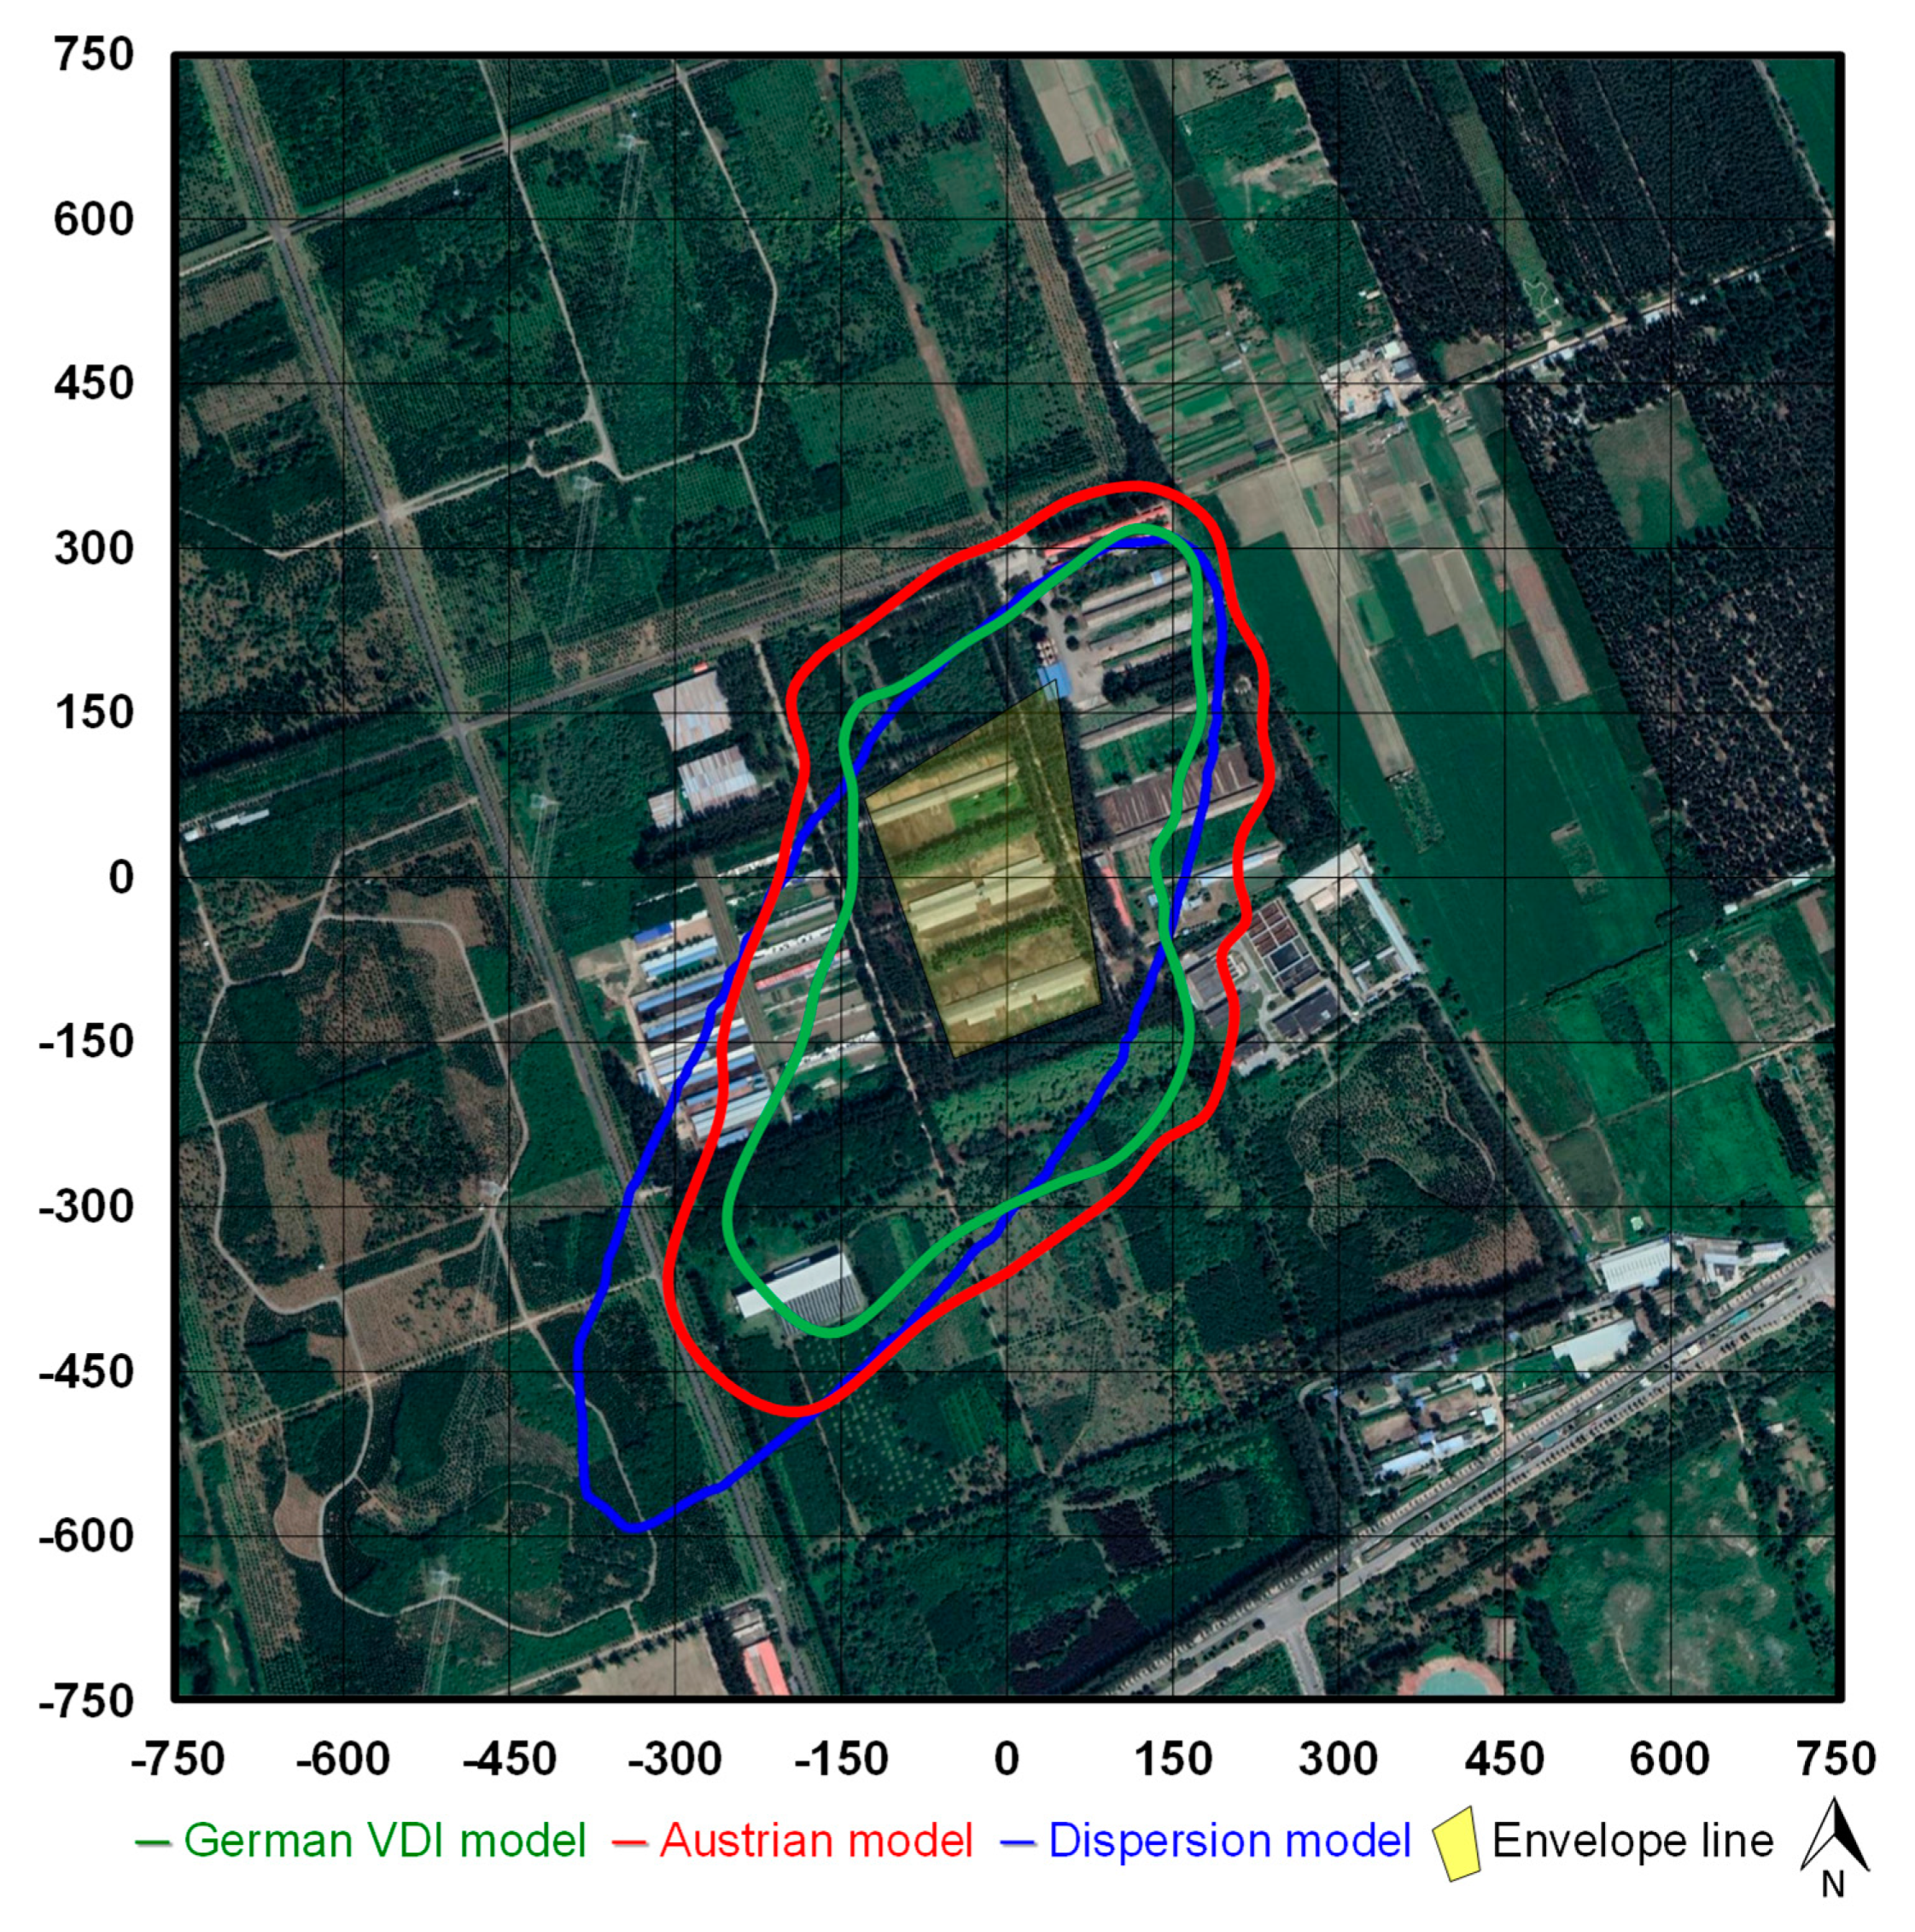
2.4. Empirical Models

Two empirical models were used: The German VDI model [14,16] and the Austrian model [15]. A very brief summary is given here to make the paper consistent to the reader. The German model uses only one meteorological predictor (frequency of the wind direction), whereas the Austrian model uses, in addition, the mean wind velocity for each wind direction. Using this parameter, the stability of the atmosphere is taken into account additionally and in a pragmatic way. This was necessary because the Austrian sites show a more varying distribution of stability conditions and higher frequencies of calm winds compared to most German sites.
In Germany, a regression model was developed via model calculations for 23 sites with the Lagrangian particle dispersion model AUSTAL2000, using a power function S = a Eb to calculate the separation distance S. The power function is defined by three input parameters which were restricted for an improved fit of the regression model. The basis of the power function is the odour emission flow rate E (ouE s−1). The two other predictors are the relative frequency of the wind direction F (‰) in 10° sectors and the odour exceedance probability P (%) of the odour impact criterion, which defines the exponent b and the multiplicative factor a of the power function. The equation for the separation distance reads:
S = [ ( 0.0137 P + 0.689 ) F + 0.251 P + 0.0590 ] E 1 1.79 + 0.204 P
In Austria, a regression model was developed in a similar way by using a power function S = a Eb. In this case, however, the regression analysis is based on dispersion calculations using the Austrian Odour Dispersion Model (AODM) for 6 sites. The power function is defined by four input parameters. The basis of the power function is the odour emission rate E (ouE s−1). The factor a and the exponent b of the power function are defined by two meteorological parameters, the relative frequency of the wind direction F, the mean wind speed W of the wind direction for 10° sectors as well as the odour exceedance probability P of the odour impact criterion. The equation for the separation distance then reads:
S = P 0.386 ( 165 F 0.0289 3.63 W 150 ) E 1 0.0381 F + 0.0191 P + 2.31

2.5. Atmospheric Dispersion Modelling

For the odour dispersion calculations undertaken in this study, the AERMOD Modelling System was used [21,22]. AERMOD is the U.S. Environmental Protection Agency (EPA) preferred air quality model for demonstrating regulatory compliance in the near field (<50 km). Essentially, the model is a steady-state Gaussian plume model with algorithms based on planetary boundary layer turbulence structure and scaling concepts. It incorporates the Monin-Obukhov similarity theory to characterize atmospheric stability in a continuous manner. AERMOD, AERMET, and AERMAP version 18081 were used in the model simulations.
The modelling protocol follows the regulatory options set in the U.S. EPA Guideline on Air Quality Models [23]. The model domain consists of a circular area of 1 km radius centred on the emission focal point of the farm. The domain was discretised using a polar grid. Receptors were distributed along 72 radial directions, with the initial direction at 0° and with moves of 5° clockwise, over 23 concentric rings. A receptor height of 1.5 m above ground level was considered to reflect the average height of the human nose. A total of 1656 receptor points were placed for the calculation of the time series of ambient odour concentrations. A digital elevation model for the model domain was built using the AERMAP terrain processor with terrain data in SRTM1 (resolution of ~30 m). Elevations from near 40–55 m above sea level (ASL) were observed within the model domain. The AERSURFACE utility (version 13016) was applied for determining the surface characteristics (roughness length, albedo and Bowen ratio) when processing meteorological data through AERMET. No background concentrations were assumed. Potential building downwash effects were not considered.
The three barns were treated as area sources with a release height of 0.05 m. The feed storage was assumed as a single-point source with a release height of 2.5 m, exit velocity of 0.5 m s1 and inner diameter of 0.8 m. Source-specific odour emission rates described in Table 1 were used as model inputs.

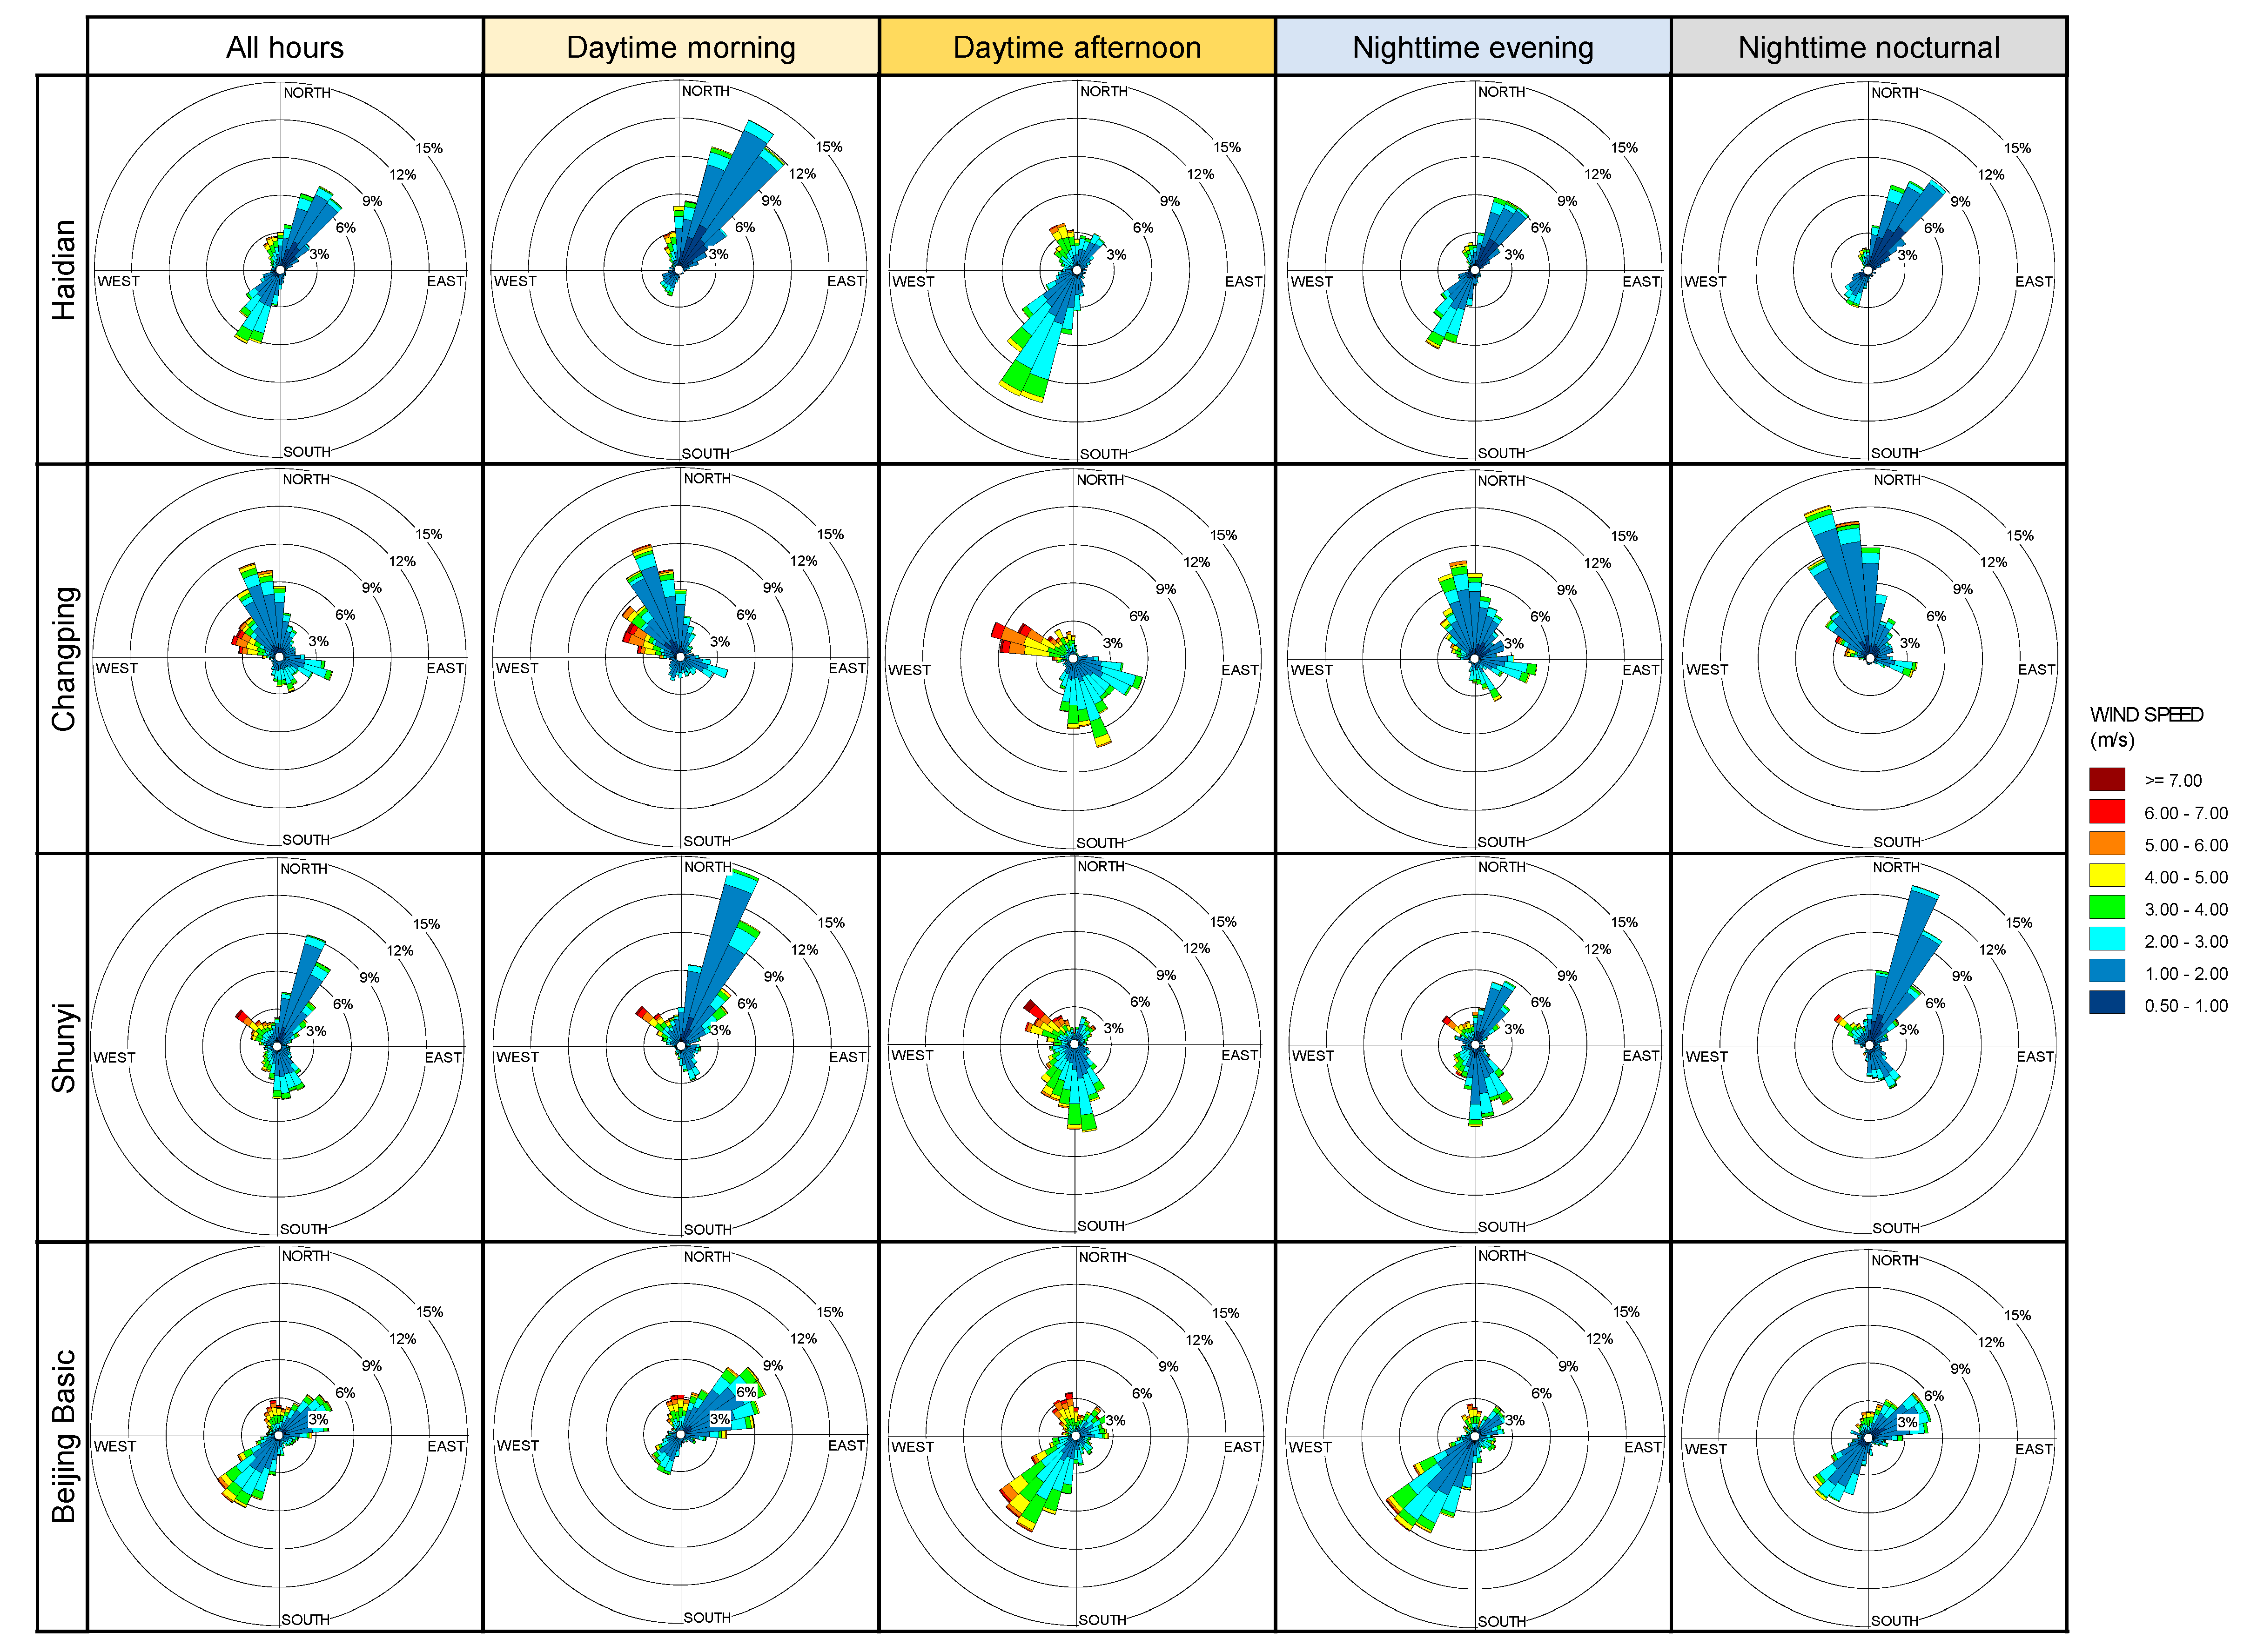
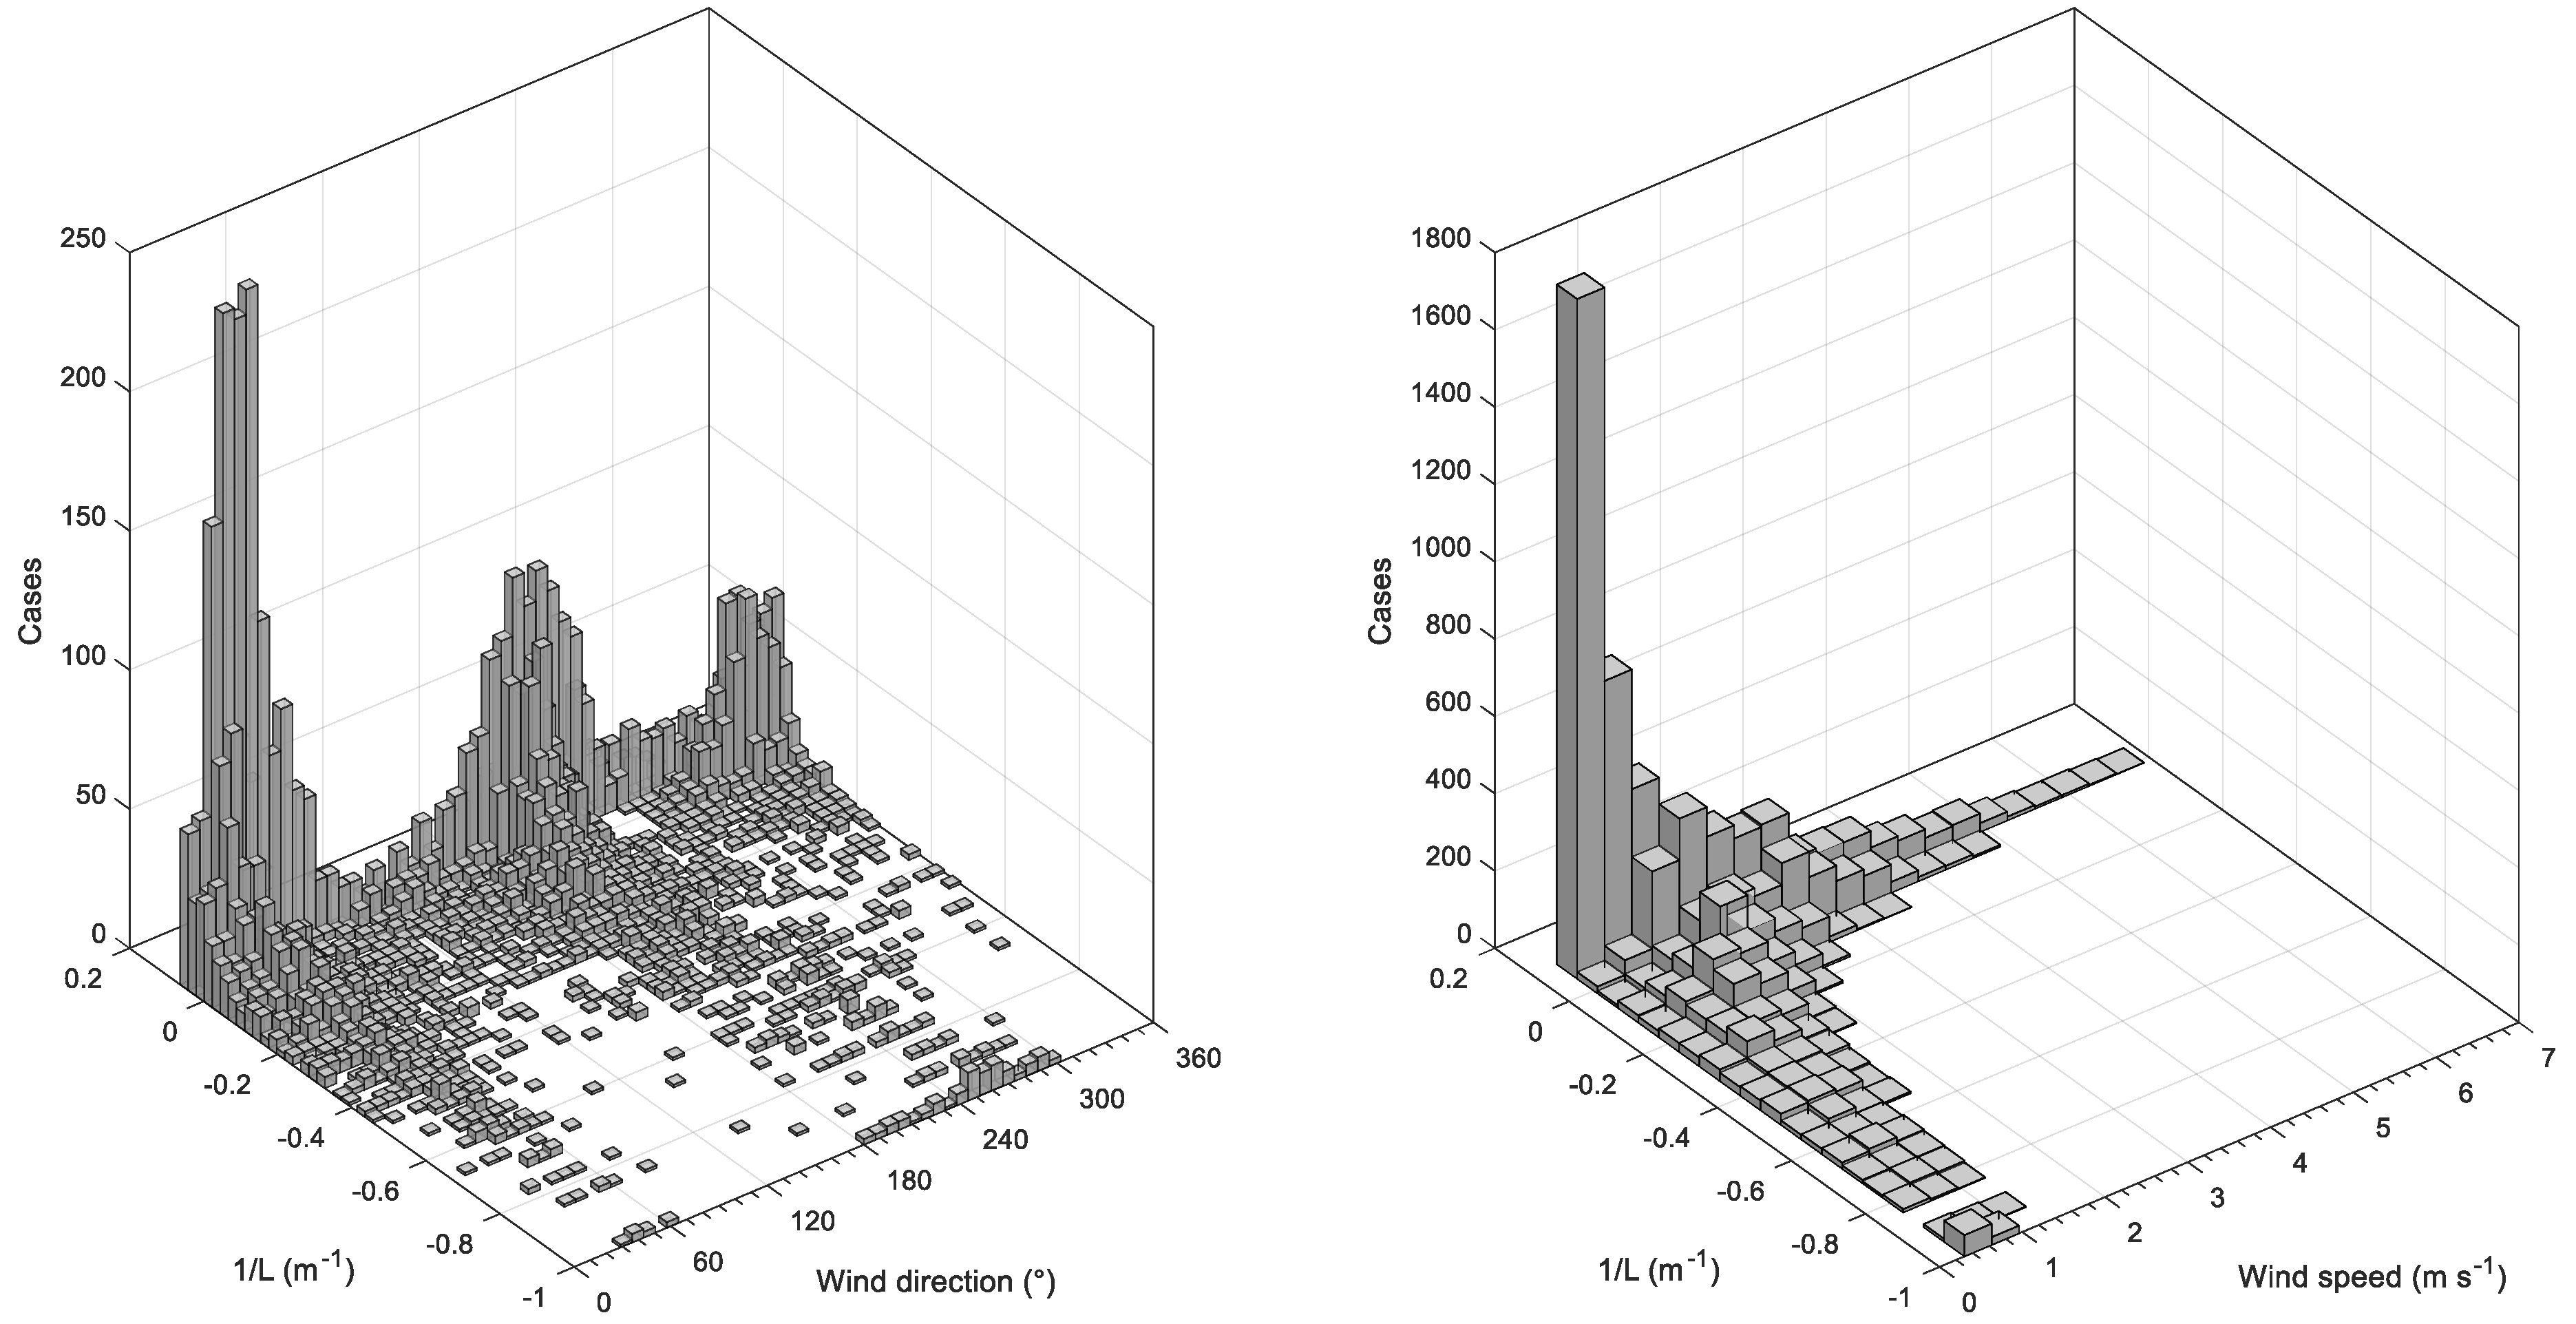
2.6. Meteorological Data

China Meteorological Administration (CMA, http://www.cma.gov.cn/en) operates a dense surface meteorological station network in Beijing. In this work, the position of 18 surface meteorological stations in relation to the dairy farm was used as a starting point to define a representative station. The stations are distributed over the urban area, suburbs and the mountainous region. As a consequence, the stations vary considerably in elevation, ranging from 29–488 m. Because of this and the relative location of the stations, only 4 stations remained as potential candidates for the study: Haidian, Changping, Shunyi and Beijing Basic.
Haidian station is situated to the East of the city at an urban park with recreational grasses, trees, and water. The surroundings of the park include land uses such as high-intensity residential, commercial/industrial/transportation, open water, grassland and barren. Changping station, neighbouring the mountains to the north-northwest (NNW), is placed at a high residential area mixed with commercial/industrial/transportation. Shunyi station is located to the Northeast of the city near Beijing Capital International Airport at an area with high industrial activity. Beijing Basic (also called National basic meteorological station) is located to the SSE of main built-up area in Beijing; this station is mainly surrounded by land uses such as low residential intensity, grassland and commercial/industrial/transportation.
For each station, a one-year time series of meteorological observations for 2017 was obtained from the CMA database (http://data.cma.cn/en). The datasets included observations of air temperature, relative humidity, atmospheric pressure, hourly-averaged wind speed, and direction. The completeness of the datasets for these parameters was fair (>90%) so that no station was eliminated from the selection at this point.
An additional surface meteorological parameter that is required to complete the atmospheric stability estimation in AERMET is cloud cover. However, this parameter is not ordinarily measured in various stations. Cloud data was made available for Beijing Basic, but with three-hourly temporal resolution. As an alternative, cloud data from the Integrated Surface Database (ISD, https://www.ncdc.noaa.gov/isd), which consists of global hourly and synoptic observations, were retrieved for a station located in Beijing Capital International Airport. Missing cloud data were then filled with the three-hourly cloud observations from Beijing Basic, and the remaining gaps were linearly interpolated. The cloud cover distribution resulting from this preprocessing resembled the cloud cover distribution due to 2116 scenes Landsat images during 1985–2015 in Beijing [18].
Upper air data for 2017 were acquired from the NOAA/ESRL Radiosonde Database (https://ruc.noaa.gov/raobs) for the airport as well. Figure 2 shows the relative location of the farm and the meteorological stations selected for data scrutiny. Table 2 summarises the information on the surface and upper air meteorological stations.

2.7. Odour Impact Criterion

The determination of direction-dependent separation distances relies on the required level of protection against odour annoyance. The two empirical models applied in this work were developed for odour impact criteria which are currently enforced in Germany, and also commonly adopted in Austria. These criteria are defined by an odour threshold concentration of 0.25 ouE m−3 (= odour detection threshold of 1 ouE m−3 divided by the constant factor of 4) and an exceedance probability P = 10% for residential and mixed areas and P = 15% for commercial, industrial, agricultural areas. The constant factor of 4 is applied for all stability conditions and distances from the emission source, and it attends the purpose of assessing odour perception on the basis of a one-hour mean value [24]. Because the farm lies mostly in a rural environment, the exceedance probability P = 15% was selected.

2.8. Statistical Analysis

The calculated separation distances due to the two empirical models are compared to the separation distance of the dispersion model, which is used herein as a gold standard. The following statistical measures are used to compare the results: The root mean square error RMSE, the relative absolute error RAE [25], and the Nash-Sutcliffe model efficiency NSE [26]. The RMSE and the RAE describe the deviation of the model calculations from the empirical data. Therefore, their ideal values are 0. NSE indicates the quality of how the model data fit to the line of identity with 1 as an optimal value. NSE < 0 indicates an even worse performance than using the mean value. The calculations of these statistical parameters are described in detail in Wu, et al. [27] and are calculated according to:
R M S E = 1 n i = 1 n ( D i E i ) 2
R A E = i = 1 n | D i E i | i = 1 n | D i D ¯ i |
N S E = 1 i = 1 n ( D i E i ) 2 i = 1 n ( D i D ¯ i ) 2
with the separation distances determined by the dispersion model Di and by the empirical models Ei.

3. Results and Discussion

3.1. Selection of the Surface Meteorological Station

Meteorological data for the calculation of separation distances is of crucial importance as it drives the transport and dispersion of odours in the atmosphere. As described previously, 4 surface stations were initially selected to obtain a representative meteorological dataset for the farm site as no on-site meteorological data exist. The choice of the most suitable meteorological station was grounded on examining station-specific wind conditions, and their adjacent topography and surface characteristics.
Earlier studies have indicated that synoptic and local atmospheric circulations play an important role in modulating air quality, not only in Beijing, but in the Beijing-Tianjin-Hebei (BTH) region as a whole [28]. Because of the mountains to the North and West of the BTH region and the Bohai Sea ~150 km to the Southeast, sea–land, and mountain–valley wind circulations can occur frequently under favourable synoptic conditions [28,29,30,31,32,33,34,35]. These local wind systems develop due to differential heating of surfaces by incoming solar radiation. In the mountain–valley wind circulation, in general, up-valley winds occur during daytime and down-valley winds take place during night-time [36].
It has been reported that the regular evolution of diurnal mountain winds shows four phases, which are intimately connected to the formation and dissipation of temperature inversions [36]. Based on this concept, diurnal wind roses for four daily phases were built. Figure 3 shows the wind roses for all hours of the day as well as for daytime and night-time. The daytime was further divided into daytime morning (6:00–12:00) and daytime afternoon (13:00–18:00), and the night-time into night-time evening (19:00–23:00) and night-time nocturnal (00:00–5:00). The wind roses are exhibited in local standard time (LST) and comprise annual wind data for 2017. The goal here is to capture a possible diurnal variation in wind directions with a focus on the local physical processes that can generate these winds.
On average, for all stations, the highest wind speeds are observed at daytime afternoon (13:00–18:00) and the lowest wind speeds at night-time nocturnal (00:00–5:00). In the whole plain, NE winds seem to dominate particularly during night-time and daytime morning. This indicates that the effect of a thermally-driven diurnal mountain–plain wind system is detected in this region even on an annual basis. In the morning, before the mountains are sufficiently heated by solar radiation, down-valley winds from Northern quadrants are still dominant in Beijing. By midday, as the mountains are well warmed by the sun, the prevailing wind shifts to Southern up-valley winds. At night the mountains are cooled by nocturnal radiation, and then Southern up-valley winds gradually disappear being shifted to down-valley winds from Northern quadrants [37].
Interestingly, the wind roses suggest that the Changping station is greatly influenced by mountain–valley wind circulations, which agrees with the neighbouring topographic conditions to the North of this site (Yanshan Mountains). The strength of diurnal wind systems depends on many factors, such as terrain characteristics, land cover, soil moisture, exposure to insolation, local shading and the surface energy budget [36]. Thus, the distribution of mountain–valley winds may vary throughout the seasons. Based on idealised simulations with the WRF-Chem model in all four seasons, earlier studies have found that mountain–valley wind circulations in Beijing have seasonality [38]. Here, the night-time evening wind rose (19:00–23:00) and, in particular, the night-time nocturnal wind rose (00:00–5:00), clearly show that NNW winds dominate at night-time, but on an annual basis. These NNW winds at Changping can be a consequence of down-valley winds. Moreover, the wind roses for Changping show that down-valley winds increase in frequency from night-time evening (19:00–23:00) to night-time nocturnal (00:00–5:00), reaching their maximum at ~5:00 LST. Although losing their strength, the daytime morning wind rose (6:00–12:00) shows that down-valley winds may occur until noon. Conversely, at daytime afternoon (13:00–18:00), the situation is reversed to prevailing SSE winds, thereby indicating the occurrence of up-valley winds. The maximum frequency of SSE winds was found to occur at ~14:00 LST. This special situation at Changping, attributed to the valley North of the station, cannot be considered representative of the farm conditions; these data are therefore not used.
The three other stations, in contrast to Changping, show a NE–SW orientation of the main winds. The prevailing wind for the Beijing Basic station blows from SW, while NE winds are dominant for Haidian and Shunyi stations. Thus, Beijing Basic shows a different general wind pattern when compared to the other stations. Beijing Basic is situated South of the central Beijing area, where the NE wind component is considerably reduced. Because of this fact together with its relatively distant location to the farm, Beijing Basic station is not considered representative of the farm conditions and therefore the data are also not used.
Even though Haidian and Shunyi stations are separated by ~33 km, their wind roses for all hours of the day show that roughly similar wind patterns are experienced at these sites. They are thus considered representative for a large area when local effects do not dominate. However, diurnal differences in wind conditions arise. During daytime (06:00–18:00), Shunyi has an average wind speed of ~2.1 m s−1, while Haidian has an average wind speed of ~1.7 m s−1. Thus, Shunyi is better ventilated than Haidian during the daytime, and the distribution of daytime wind directions resembles more those at Changping. The daytime afternoon (13:00–18:00) and night-time evening (19:00–23:00) wind roses show another relevant difference. While for Shunyi the main wind directions are from SSE–S, for Haidian they are from south-southwest (SSW). Overall, the wind pattern of Shunyi indicates that this station is to a large extent influenced by the corridor to the Northeast imbued in the mountainous region. For these reasons, Shunyi is also not considered representative of the farm conditions.
As Haidian’s surroundings are most similar to the farm and this station shows strong day-night differences in wind directions attributable to the local topography, this station has been selected as input data for the calculation of separation distances around the farm in this study. It is thought-provoking to note that not always the closest meteorological station can automatically be considered representative of a certain site.

3.2. Separation Distances

Figure 4 overlays the separation distances determined by the dispersion model and the two empirical models for an exceedance probability of P = 15%, thereby facilitating a direct comparison of results. From a visual inspection of this figure, it can already be seen that the shape of the separation distances determined by the three methods is similar and is driven by the distribution of wind directions. While the maximum separation distance determined by AERMOD is 655 m for the NE wind direction (thus oriented towards SW), the maximum distances determined by the Austrian model and the German VDI empirical models are 524 m and 440 m, respectively. Maximum distances for the SW wind direction (oriented towards NE) are 338 m, 338 m, and 378 m for AERMOD, the German VDI, and Austrian empirical models, respectively. Minimum separation distances occur for the East and West wind directions, with values of 149 m, 202 m, and 135 m for AERMOD, the German VDI, and Austrian empirical models, respectively. Thus, the greatest differences among the three methods arise for the prevailing wind directions, whereas the similarity is greater for non-prevailing wind directions. The differences of the separation distances, calculated by the German and the Austrian empirical models, can be explained by the discrepancy between the meteorological sites in the two countries, various emission geometries, an additional predictor for the regression model (power function), and different dispersion models. Due to the simplicity of the empirical models, the results can only be interpreted as an estimation of the separation distances without the claim of the same accuracy as a dispersion model [15,16].
In general, the shape of the encompassed area determined by AERMOD is longer and narrower than that of the Austrian and the German VDI empirical models. The mean ratios of separation distances determined by the Austrian and the German VDI empirical models to that of AERMOD are 1.23 and 0.95, respectively. Hence, the encompassed area of an exceedance probability of P = 15% determined by the Austrian empirical model is the largest, followed by those of AERMOD and the German VDI empirical model.
At this point, an elucidation as to why more elongated separation distances toward southwest (SW) was calculated by the dispersion model arises. The answer to this question is seen in the wind conditions and the distribution of atmospheric stabilities.
In this work, a current default regulatory option for AERMOD known as adjusted surface friction velocity (ADJ_U*) was applied. This option has the aim of addressing some concerns regarding model performance under light winds [39]. It acts to adjust the friction velocity according to Qian and Venkatram [40] for better handling turbulence during low wind speed, stable conditions. The friction velocity is one of the necessary parameters for characterising the atmospheric stability through the Obukhov length (L, with the dimension of length). The L, by definition, can approach positive or negative infinity for neutral states, so that the inverse of L (regularly called the Obukhov stability parameter) is evaluated here. Stable atmospheres have positive values of 1/L; unstable atmospheres have negative values of 1/L; neutral atmospheres have |1/L| values of nearly zero [41]. Because the dispersion calculations were conducted by applying the ADJ_U* option, the minimum positive value of L was observed to be 12.3 m. As a consequence, 1/L values were limited to 0.08 m−1.
Figure 5 compares the atmospheric stability estimated by the model (in terms of 1/L) against wind direction and wind speed. For the main wind directions, a great abundance of slightly stable, low wind speed conditions can be observed, particularly for the winds from north-east (NE). Accordingly, it is reasonable to point out that frequent winds combined with such conditions are likely to cause higher ambient odour concentrations and, consequently, more elongated separation distances. Although still considerable, the amount of slightly stable, low wind speed conditions is reduced for the secondary main wind directions from SW because of higher wind speeds associated with these directions, as can be seen in the wind roses of the Haidian station. On the other hand, unstable conditions occur more frequently with SW winds than with the NE winds, as expected.
With the increase of wind speed, near-neutral conditions start to dominate both during the daytime and night-time. Essentially, neutral stability dominates with wind speeds greater than ~5 m s−1. Extremely unstable and slightly stable conditions were both estimated for low wind speeds (<1.0 m s−1). Additionally, low wind speeds favoured the occurrence of daytime unstable and night-time stable conditions. Therefore, the dependence of turbulence on the wind speed and hour of the day has been confirmed.

3.3. Statistics of the Separation Distances

The statistics of the separation distances determined by the Austrian and the German VDI empirical models related to the dispersion model are summarized in Table 3. The parameters are explained in Section 2.8; with all data along the line of identity, RMSE and RAE assume the value of 0, NSE the value of 1. In general, the empirical models show good results. The root mean square error RMSE of the German VDI empirical model was a little higher than that of the Austrian empirical model, but the relative absolute error RAE showed slightly opposite differences. The parameter Nash-Sutcliffe model efficiency NSE, which evaluates the fit with the line of identity [27], is very close for the two empirical models. The statistical results confirm what is seen when looking at Figure 4: The shape of the curves is similar, but systematic differences in separation distances are manifest, resulting in the relatively large values of the RMSE.

3.4. Input Requirements

The greatest advantage of the empirical models is the reduced demand of meteorological data compared to a dispersion model. While refined dispersion models usually require wind speed, wind direction and atmospheric stability on an hourly basis, the meteorological input data for the two empirical models are straightforward: Mean wind speed for each wind direction (Austrian empirical model) and frequency of 10° wind direction sectors (Austrian and German empirical models). It has to be noted that more and more wind data has been made available by national weather services.
As demonstrated herein, appropriate meteorological data is of great importance for odour dispersion modelling. The evaluation of the wind data of the four meteorological stations indicated that the nearest station is not representative of the farm conditions, since it is greatly influenced by mountain–valley wind circulations. Hence, the selection of a representative meteorological station for odour assessments should also take into account the influence of localised wind systems, when this is the case. If appropriate meteorological data are not available which are representative for the site of the odour emission source, then meteorological measurements have to be performed in-situ to achieve reliable model calculations, especially for dispersion models. The direction-dependent shape of the separation distance shows that the resulting protection level is predominantly controlled by the meteorological situation at the site.
Regarding the emission input, the fact that the calculation of the odour emission rates follows a common procedure for all methods intercompared in this work represents an important advantage for obtaining more reliable separation distances. This common procedure is due to odour emission factors and the related activity values (e.g., number of animals, size of the area emission sources) [14,42].
For the empirical models, the geometry of the odour source had to be simplified by the use of a single-point source. This was approximated here according to VDI 3894 Part 2 [14] by determining the emission focal point and the envelope line showing the extent of the odour sources.
In certain situations, odour plumes from neighbouring odour-emitting facilities can overlap. If clusters of odour-emitting facilities will result in cumulative effects, a dispersion model should be preferred. To estimate if cumulative effects are to be expected, The German VDI 3894 Part 2 [14] includes a simple procedure based on the horizontal angle of the odour-emitting facilities and a receptor point.

4. Conclusions and Outlook

The presented study successfully shows a comparison of odour-related separation distances around a dairy farm in Beijing determined by two empirical models (the Austrian empirical model and the German VDI empirical model) and a regulatory dispersion model (AERMOD). For all methods, the odour emission rates of the sources within the dairy farm were calculated following the VDI 3894 Part 2. The selection of the most suitable meteorological station to the farm conditions play a fundamental role, and thus when relevant the topography and the impact of the local wind system should be considered. The shape of the separation distances determined by the three different methods is similar and resembles the wind data of the selected meteorological station. Besides wind data, the dispersion model incorporates other meteorological parameters in order to estimate atmospheric stability. In this regard, the largest elongation of the separation distances towards SW is explained by the coherence of predominant wind directions and stable conditions.
The results, both in terms of the shape and the statistics of the separation distances (RMSE, RAE, and NSE), indicate the suitability of the two empirical models as screening tools for assessing odour annoyance. The dispersion model used in this work requires surface and upper air meteorological data as input, whereas the two empirical models only need wind statistics (frequency distribution and mean wind speed for 10° sectors of the wind direction). Therefore, the trade-off between accuracy and simplicity, especially for practical applications, should be carefully considered. In this sense, this study confirms the possibility of using methods with different intent and complexity to determine separation distances in the vicinity odour sources such as a dairy farm. The decision as to which method to apply will rely critically on the nature of the investigation, data availability, and the dimension and objectives of a particular study.
These findings have implications particularly for countries with no specific requirements for managing environmental odour, i.e., for those with no legislation based on odour impact criteria. Regulatory authorities can promote the utilisation of the empirical models as first-guess or screening approaches to estimate possibly odour-affected areas. In this way, country-specific odour impact criteria might be developed to guarantee the desired level of protection against odour annoyance.

Author Contributions

Conceptualization, C.W., J.L., G.S. and M.P.; methodology, M.B., C.W., F.Y., C.Q.; writing—original draft preparation, C.W., M.B., G.S. and M.P.; supervision and project administration, J.L.

Acknowledgments

This work was supported by the National Key R&D Program of China (Nos. 2016YFE0115500, 2016YFC0700603 and 2016YFC0700600), the National Natural Science Foundation of China (21576023), and the Fundamental Research Funds for the Central Universities (No. FRF-TP-17-047A1). The cooperation between Austria and China was funded by the OeAD-GmbH (No. CN 10/2016) and the National Key R&D Program of China (No. 2016YFE0115500). Marlon Brancher is supported by the Austrian Science Fund (FWF) in the framework of the Lise Meitner Programme [project number M 2548-N29].

Conflicts of Interest

The authors declare no conflict of interest.

References

  1. Guffanti, P.; Pifferi, V.; Falciola, L.; Ferrante, V. Analyses of odours from concentrated animal feeding operations: A review. Atmos. Environ. 2018, 175, 100–108. [Google Scholar] [CrossRef]
  2. Douglas, P.; Robertson, S.; Gay, R.; Hansell, A.L.; Gant, T.W. A systematic review of the public health risks of bioaerosols from intensive farming. Int. J. Hyg. Environ. Health 2018, 221, 134–173. [Google Scholar] [CrossRef] [Green Version]
  3. Keck, M.; Mager, K.; Weber, K.; Keller, M.; Frei, M.; Steiner, B.; Schrade, S. Odour impact from farms with animal husbandry and biogas facilities. Sci. Total Environ. 2018, 645, 1432–1443. [Google Scholar] [CrossRef]
  4. Blazy, V.; de Guardia, A.; Benoist, J.C.; Daumoin, M.; Guiziou, F.; Lemasle, M.; Wolbert, D.; Barrington, S. Correlation of chemical composition and odor concentration for emissions from pig slaughterhouse sludge composting and storage. Chem. Eng. J. 2015, 276, 398–409. [Google Scholar] [CrossRef] [Green Version]
  5. Brancher, M.; Griffiths, K.D.; Franco, D.; Lisboa, H.D. A review of odour impact criteria in selected countries around the world. Chemosphere 2017, 168, 1531–1570. [Google Scholar] [CrossRef]
  6. Parker, D.B.; Gilley, J.; Woodbury, B.; Kim, K.-H.; Galvin, G.; Bartelt-Hunt, S.L.; Li, X.; Snow, D.D. Odorous VOC emission following land application of swine manure slurry. Atmos. Environ. 2013, 66, 91–100. [Google Scholar] [CrossRef] [Green Version]
  7. Cantuaria, M.L.; Brandt, J.; Løfstrøm, P.; Blanes-Vidal, V. Public perception of rural environmental quality: Moving towards a multi-pollutant approach. Atmos. Environ. 2017, 170, 234–244. [Google Scholar] [CrossRef]
  8. Blanes-Vidal, V. Air pollution from biodegradable wastes and non-specific health symptoms among residents: Direct or annoyance-mediated associations? Chemosphere 2015, 120, 371–377. [Google Scholar] [CrossRef]
  9. Piringer, M.; Schauberger, G. Comparison of a Gaussian diffusion model with guidelines for calculating the separation distance between livestock farming and residential areas to avoid odour annoyance. Atmos. Environ. 1999, 33, 2219–2228. [Google Scholar] [CrossRef]
  10. Badach, J.; Kolasińska, P.; Paciorek, M.; Wojnowski, W.; Dymerski, T.; Gębicki, J.; Dymnicka, M.; Namieśnik, J. A case study of odour nuisance evaluation in the context of integrated urban planning. J. Environ. Manag. 2018, 213, 417–424. [Google Scholar] [CrossRef]
  11. Capelli, L.; Sironi, S.; Del Rosso, R.; Guillot, J.-M. Measuring odours in the environment vs. dispersion modelling: A review. Atmos. Environ. 2013, 79, 731–743. [Google Scholar] [CrossRef]
  12. Piringer, M.; Knauder, W.; Petz, E.; Schauberger, G. Factors influencing separation distances against odour annoyance calculated by Gaussian and Lagrangian dispersion models. Atmos. Environ. 2016, 140, 69–83. [Google Scholar] [CrossRef]
  13. Schauberger, G.; Piringer, M.; Mikovits, C.; Zollitsch, W.; Hörtenhuber, S.J.; Baumgartner, J.; Niebuhr, K.; Anders, I.; Andre, K.; Hennig-Pauka, I.; et al. Impact of global warming on the odour and ammonia emissions of livestock buildings used for, fattening pigs. Biosyst. Eng. 2018, 175, 106–114. [Google Scholar] [CrossRef]
  14. VDI 3894 Part 2, Emissions and their Impact from Livestock Operations. Method to Determine the Separation Distance for Odour; Verlag des Vereins Deutscher Ingenieure: Düsseldorf, Germany, 2012.
  15. Schauberger, G.; Piringer, M.; Jovanovic, O.; Petz, E. A new empirical model to calculate separation distances between livestock buildings and residential areas applied to the Austrian guideline to avoid odour nuisance. Atmos. Environ. 2012, 47, 341–347. [Google Scholar] [CrossRef]
  16. Schauberger, G.; Schmitzer, R.; Kamp, M.; Sowa, A.; Koch, R.; Eckhof, W.; Eichler, F.; Grimm, E.; Kypke, J.; Hartung, E. Empirical model derived from dispersion calculations to determine separation distances between livestock buildings and residential areas to avoid odour nuisance. Atmos. Environ. 2012, 46, 508–515. [Google Scholar] [CrossRef]
  17. Nicolas, J.; Delva, J.; Cobut, P.; Romain, A.-C. Development and validating procedure of a formula to calculate a minimum separation distance from piggeries and poultry facilities to sensitive receptors. Atmos. Environ. 2008, 42, 7087–7095. [Google Scholar] [CrossRef] [Green Version]
  18. Huang, H.; Chen, Y.; Clinton, N.; Wang, J.; Wang, X.; Liu, C.; Gong, P.; Yang, J.; Bai, Y.; Zheng, Y. Mapping major land cover dynamics in Beijing using all Landsat images in Google Earth Engine. Remote Sens. Environ. 2017, 202, 166–176. [Google Scholar] [CrossRef]
  19. Xiang, Y.; Zhang, T.; Liu, J.; Lv, L.; Dong, Y.; Chen, Z. Atmosphere boundary layer height and its effect on air pollutants in Beijing during winter heavy pollution. Atmos. Res. 2019, 215, 305–316. [Google Scholar] [CrossRef]
  20. Xu, M.; Sbihi, H.; Pan, X.; Brauer, M. Local variation of PM2.5 and NO2 concentrations within metropolitan Beijing. Atmos. Environ. 2019, 200, 254–263. [Google Scholar] [CrossRef]
  21. Perry, S.G.; Cimorelli, A.J.; Paine, R.J.; Brode, R.W.; Weil, J.C.; Venkatram, A.; Wilson, R.B.; Lee, R.F.; Peters, W.D. AERMOD: A dispersion model for industrial source applications. Part II: Model performance against 17 field study databases. J. Appl. Meteorol. 2005, 44, 694–708. [Google Scholar] [CrossRef]
  22. Cimorelli, A.J.; Perry, S.G.; Venkatram, A.; Weil, J.C.; Paine, R.J.; Wilson, R.B.; Lee, R.F.; Peters, W.D.; Brode, R.W. AERMOD: A dispersion model for industrial source applications. Part I: General model formulation and boundary layer characterization. J. Appl. Meteorol. 2005, 44, 682–693. [Google Scholar] [CrossRef]
  23. US Environmental Protection Agency (US EPA). Revision to the Guideline on Air Quality Models: Enhancements to the AERMOD Dispersion Modeling System and Incorporation of Approaches to Address Ozone and Fine Particulate Matter. Final, 40 CFR part 51; 2017. Available online: https://www.federalregister.gov/documents/2017/01/17/2016-31747/revisions-to-the-guideline-on-air-quality-models-enhancements-to-the-aermod-dispersion-modeling (accessed on 17 January 2017).
  24. Schauberger, G.; Piringer, M.; Schmitzer, R.; Kamp, M.; Sowa, A.; Koch, R.; Eckhof, W.; Grimm, E.; Kypke, J.; Hartung, E. Concept to assess the human perception of odour by estimating short-time peak concentrations from one-hour mean values. Reply to a comment by Janicke et al. Atmos. Environ. 2012, 54, 624–628. [Google Scholar] [CrossRef]
  25. Bennett, N.D.; Croke, B.F.; Guariso, G.; Guillaume, J.H.; Hamilton, S.H.; Jakeman, A.J.; Marsili-Libelli, S.; Newham, L.T.; Norton, J.P.; Perrin, C. Characterising performance of environmental models. Environ. Model. 2013, 40, 1–20. [Google Scholar] [CrossRef]
  26. Nash, J.E.; Sutcliffe, J.V. River flow forecasting through conceptual models part I—A discussion of principles. J. Hydrol. 1970, 10, 282–290. [Google Scholar] [CrossRef]
  27. Wu, C.; Liu, J.; Zhao, P.; Piringer, M.; Schauberger, G. Conversion of the chemical concentration of odorous mixtures into odour concentration and odour intensity: A comparison of methods. Atmos. Environ. 2016, 127, 283–292. [Google Scholar] [CrossRef]
  28. Miao, Y.; Liu, S.; Zheng, Y.; Wang, S. Modeling the feedback between aerosol and boundary layer processes: A case study in Beijing, China. Environ. Sci. Pollut. Res. Int. 2016, 23, 3342–3357. [Google Scholar] [CrossRef]
  29. Bei, N.; Zhao, L.; Wu, J.; Li, X.; Feng, T.; Li, G. Impacts of sea-land and mountain-valley circulations on the air pollution in Beijing-Tianjin-Hebei (BTH): A case study. Environ. Pollut. 2018, 234, 429–438. [Google Scholar] [CrossRef]
  30. Chen, Y.; Zhao, C.; Zhang, Q.; Deng, Z.; Huang, M.; Ma, X. Aircraft study of mountain chimney effect of Beijing, China. J. Geophys. Res. Atmos. 2009, 114. [Google Scholar] [CrossRef]
  31. Leytem, A.B.; Dungan, R.S.; Bjorneberg, D.L.; Koehn, A.C. Emissions of ammonia, methane, carbon dioxide, and nitrous oxide from dairy cattle housing and manure management systems. J. Environ. Qual. 2011, 40, 1383–1394. [Google Scholar] [CrossRef]
  32. Liu, S.; Liu, Z.; Li, J.; Wang, Y.; Ma, Y.; Sheng, L.; Liu, H.; Liang, F.; Xin, G.; Wang, J. Numerical simulation for the coupling effect of local atmospheric circulations over the area of Beijing, Tianjin and Hebei Province. Sci. China Ser. D Earth Sci. 2009, 52, 382–392. [Google Scholar] [CrossRef]
  33. Long, X.; Tie, X.; Cao, J.; Huang, R.; Feng, T.; Li, N.; Zhao, S.; Tian, J.; Li, G.; Zhang, Q. Impact of crop field burning and mountains on heavy haze in the North China Plain: A case study. Atmos. Chem. Phys. 2016, 16, 9675–9691. [Google Scholar] [CrossRef]
  34. Miao, Y.; Guo, J.; Liu, S.; Liu, H.; Zhang, G.; Yan, Y.; He, J. Relay transport of aerosols to Beijing-Tianjin-Hebei region by multi-scale atmospheric circulations. Atmos. Environ. 2017, 165, 35–45. [Google Scholar] [CrossRef]
  35. Miao, Y.; Liu, S.; Zheng, Y.; Wang, S.; Chen, B.; Zheng, H.; Zhao, J. Numerical study of the effects of local atmospheric circulations on a pollution event over Beijing–Tianjin–Hebei, China. J. Environ. Sci. 2015, 30, 9–20. [Google Scholar] [CrossRef]
  36. Zardi, D.; Whiteman, C.D. Diurnal mountain wind systems. In Mountain Weather Research and Forecasting; Springer: Berlin, Germany, 2013; pp. 35–119. [Google Scholar]
  37. Miao, Y.; Liu, S.; Zheng, Y.; Wang, S.; Chen, B. Numerical study of the effects of topography and urbanization on the local atmospheric circulations over the Beijing-Tianjin-Hebei, China. Adv. Meteorol. 2015, 2015. [Google Scholar] [CrossRef]
  38. Miao, Y.; Hu, X.M.; Liu, S.; Qian, T.; Xue, M.; Zheng, Y.; Wang, S. Seasonal variation of local atmospheric circulations and boundary layer structure in the Beijing-Tianjin-Hebei region and implications for air quality. J. Adv. Model. Earth Syst. 2015, 7, 1602–1626. [Google Scholar] [CrossRef] [Green Version]
  39. Pandey, G.; Sharan, M. Accountability of wind variability in AERMOD for computing concentrations in low wind conditions. Atmos. Environ. 2019, 202, 105–116. [Google Scholar] [CrossRef]
  40. Qian, W.; Venkatram, A. Performance of steady-state dispersion models under low wind-speed conditions. Boundary-Layer Meteorol. 2011, 138, 475–491. [Google Scholar] [CrossRef]
  41. Brancher, M.; Piringer, M.; Franco, D.; Belli Filho, P.; Lisboa, H.D.M.; Schauberger, G. Assessing the inter-annual variability of separation distances around odour sources to protect the residents from odour annoyance. J. Environ. Sci. 2019, 79, 11–24. [Google Scholar] [CrossRef]
  42. VDI 3894 Part 1, Emissions and Immissions from Animal Husbandry-Housing Systems and Emissions-Pigs, Cattle, Poultry, Horses; Verlag des Vereins Deutscher Ingenieure: Düsseldorf, Germany, 2011.
Figure 1. Schematic diagram of the dairy farm and the surroundings. The yellow line stands for the envelope line, the red point stands for the origin; a: Feedlot pens, the brownish area stands for the barns; b: Feed mill; c1: Office area; c2: Milking parlour, manure and slurry treatment area; c3: Research centre; d1–d4: Surrounding villages.
Atmosphere 10 00231 g001
Figure 2. The spatial pattern of topography in Beijing, China, showing the location of the dairy farm and the meteorological stations selected for data scrutiny.
Atmosphere 10 00231 g002
Figure 3. Station-specific wind roses for all hours of the day as well as for daytime and night-time (data period: 2017).
Atmosphere 10 00231 g003
Figure 4. Separation distances around the dairy farm determined by the Austrian and the German VDI empirical models as well as the AERMOD dispersion model for an exceedance probability of P = 15%. The emission focal point lays in the origin of the coordinate system at 0,0 (in metres).
Atmosphere 10 00231 g004
Figure 5. Bivariate histogram plots comparing the atmospheric stability estimated by the AERMOD model (in terms of 1/L) against wind direction (left) and wind speed (right).
Atmosphere 10 00231 g005
Table 1. Odour emission rates for the odour sources identified in the dairy farm. The emission factors are based on the VDI 3894 Part 2 [14].
Odour SourcesSpecific Emission FactorActivity ValueOdour Emission Rate (ouE s−1)
E1 Barn 1
  Dairy cows N = 10012 ouE s−1 LU−1120 LU1440
  Feed table 3 ouE s−1 m−2150 m²450
  Sum--1890
E2 Barn 2
  Dairy cows N = 10012 ouE s−1 LU−160 LU1440
  Feed table 3 ouE s−1 m−2150 m²450
  Sum--1890
E3 Barn 3
  Dairy cows N = 10012 ouE s−1 LU−160 LU1440
  Feed table 3 ouE s−1 m−2150 m²450
  Sum--1890
EF Feed storage (corn silage) 3 ouE s−1 m−260 m²180
MS Manure storage-200 m²-
Total sum 5850
1 LU = 500 kg body mass (LU: livestock unit).
Table 2. Information on the meteorological stations examined in this study (data period: 2017).
StationTypeLatitude ° NLongitude ° EElevation ASL (m)Distance from the Farm (km)
HaidianSurface39.98116.284617
ChangpingSurface40.22116.227613
ShunyiSurface40.13116.622939
Beijing BasicSurface39.80116.473142
Beijing Capital AirportSurface and upper air40.08116.603336
Table 3. Statistics of the separation distances determined by empirical models related to AERMOD. The evaluation was performed by the root mean square error RMSE, the relative absolute error RAE, and the Nash-Sutcliffe model efficiency NSE. (n = 36).
Empirical ModelRMSE (m)RAENSE
German VDI model74.100.530.62
Austrian model69.220.680.67

