Validation and Accuracy Assessment of MODIS C6.1 Aerosol Products over the Heavy Aerosol Loading Area

1
CAS Key Laboratory of Coastal Environmental Processes and Ecological Remediation, Yantai Institute of Coastal Zone Research, Chinese Academy of Sciences, Yantai 264003, China
2
Shandong Key Laboratory of Coastal Environmental Processes, Yantai Institute of Coastal Zone Research, Chinese Academy of Sciences, Yantai 264003, China
*
Author to whom correspondence should be addressed.
Atmosphere 2019, 10(9), 548; https://0-doi-org.brum.beds.ac.uk/10.3390/atmos10090548
Submission received: 1 August 2019
/
Revised: 8 September 2019
/
Accepted: 12 September 2019
/
Published: 14 September 2019
(This article belongs to the Special Issue Urban Atmospheric Aerosols: Sources, Analysis and Effects)
Abstract
:The aim of this study is to evaluate the accuracy of MODerate resolution Imaging Spectroradiometer (MODIS) aerosol optical depth (AOD) products over heavy aerosol loading areas. For this analysis, the Terra-MODIS Collection 6.1 (C6.1) Dark Target (DT), Deep Blue (DB) and the combined DT/DB AOD products for the years 2000–2016 are used. These products are validated using AErosol RObotic NETwork (AERONET) data from twenty-three ground sites situated in high aerosol loading areas and with available measurements at least 500 days. The results show that the numbers of collections (N) of DB and DT/DB retrievals were much higher than that of DT, which was mainly caused by unavailable retrieval of DT in bright reflecting surface and heavy pollution conditions. The percentage falling within the expected error (PWE) of the DT retrievals (45.6%) is lower than that for the DB (53.4%) and DT/DB (53.1%) retrievals. The DB retrievals have 5.3% less average overestimation, and 25.7% higher match ratio than DT/DB retrievals. It is found that the current merged aerosol algorithm will miss some cases if it is determined only on the basis of normalized difference vegetation index. As the AOD increases, the value of PWE of the three products decreases significantly; the undervaluation is suppressed, and the overestimation is aggravated. The retrieval accuracy shows distinct seasonality: the PWE is largest in autumn or winter, and smallest in summer. The most severe overestimation and underestimation occurred in the summer. Moreover, the DT, DB and DT/DB products over different land cover types still exhibit obvious deviations. In urban areas, the PWE of DB product (52.6%) is higher than for the DT/DB (46.3%) and DT (25.2%) products. The DT retrievals perform poorly over the barren or sparsely vegetated area (N = 52). However, the performance of three products is similar over vegetated area. On the whole, the DB product performs better than the DT product over the heavy aerosol loading area.
1. Introduction
Atmospheric aerosols are small particles (0.001–100 μm) from both natural and human sources suspended in the atmosphere that can significantly influence the ecosystem [1], climate, and hydrological cycle [2] due to their effect on radiative forcing [3,4], precipitation and clouds [5]. Due to the high temporal and spatial inhomogeneity in aerosol concentrations and the complex relationship between the aerosol chemical and physical properties and cloud microphysics, the uncertainty in the estimation of the indirect aerosol forcing remains one of the highest in the climate studies today [6,7,8]. Satellite remote sensing is the most effective way of measuring characteristics of aerosol on the global scale. However, currently, remote sensing retrievals of aerosol properties generally achieve a low accuracy, because the radiance measured by the satellite sensor at the top of path radiance is a mixed signal [9], including not only information about the composition of the atmosphere, but also information about the Earth’s surface reflectance [10].
Aerosol effects are significantly latitude dependent, i.e., at mid and lower latitudes, the aerosol loading is very strong, with consequent air pollution [11,12]. In Asia, the most substantial aerosol sources are coal, biomass burning, and dust [13,14]. The Middle East and Northern Africa are located in the region most affected by the presence of Arabian and Saharan desert dust, respectively [15]. The mass of African dust transported in the atmosphere is large [16], and it has been suggested that the transported dusts have a substantial influence on the regional radiative budget [17]. In recent years, the concentration of atmospheric particulates has increased unprecedentedly over these regions. Among them, China, India, and Pakistan’s mean aerosol optical depth measured at AErosol RObotic NETwork (AERONET) sites [18] exceeds global background levels by 4–5 times [19].
Aerosol optical properties such as aerosol optical depth (AOD) were obtained from satellite sensors including the Sea-viewing Wide Field of view Sensor (SeaWiFS) [20], the Multiangle Imaging Spectroradiometer (MISR) [21], the MEdium Resolution Imaging Spectroradiometer (MERIS) [22], the Visible Infrared Imaging Radiometer Suite (VIIRS) [23], and the MODerate resolution Imaging Spectroradiometer (MODIS) [24]. MODIS sensors observe the Earth system from on board two satellites: on Terra since 1999 and on Aqua since 2002. MODIS acquires top-of-the-atmosphere (TOA) data in 36 spectral bands ranging in wavelength from 0.4 μm to 14.4 μm over both land and ocean with near-daily global coverage. The operational MODIS AOD product over land is based on two algorithms, namely, the Dark Target (DT) and Enhanced Deep Blue (DB) algorithms. Over the past decades, MODIS aerosol algorithms have experienced modifications for many times. The Collection 5 (C5) DT, C6/C6.1 DT and the DB algorithms have been extensively evaluated on both global and regional scales [25,26,27,28]. In a previous study, we provided a useful assessment of both the DT and DB aerosol products over Beijing with a specific focus on the potential of retrieval over inhomogeneous urban surfaces [28]. To date, the MODIS C6.1 aerosol products have not yet been fully and effectively verified in the polluted background of medium- and low-latitude areas with heavy aerosol loading. Thus, this study focuses more on the comparative performance of MODIS C6.1 DT, DB and the merged DT/DB AOD products over the heavy aerosol loading area.
MODIS is the first satellite observation plan designed to provide aerosol optical characteristic globally of high spatial resolution. It can provide a long time series of AOD products and can be very useful for air quality studies, etc. The objective of this study is to provide a more detailed evaluation the Terra-MODIS AOD retrieval products using the ground observations from twenty-three AERONET sites in Asia (including China, India and Pakistan), the Middle East (including United Arab Emirates, Bahrain and Kuwait) and Northern Africa (including Egypt, Niger, Benin, Mali and Nigeria) regions. For this, the Terra-MODIS C6.1 DT, DB and DB/DT AOD products (MOD04) at 10 km resolution are collected over the period 2000–2016. Then, the performance of MODIS aerosol retrieval algorithms is validated and compared against AERONET AOD measurements at the site, local and continental scales, meanwhile, the sensitivity of land use types (i.e., urban, barren or sparsely vegetation and vegetation) to aerosol and seasonal variations on aerosol retrievals are also considered and discussed.
2. Datasets and Method
2.1. AERONET Ground-Observed AOD
The AERONET (AERosol RObotic NETwork) is a worldwide network of ground stations equipped with well-calibrated Sun photometers to assess aerosol optical properties, such as their optical depth [18]. It provides a dataset of spectral AOD in the range of 0.340–1.060 µm with low uncertainty (~0.01–0.02) and high temporal resolution (every 15 min) under cloud-free conditions [29]. AERONET observations have been widely adopted for the validation of satellite-retrieved AOD [28,30,31]. For the validation of MODIS aerosol products over the heavy aerosol loading area, this study used the version 3 cloud-screened and quality-controlled level 2.0 AOD ground-based observations from 23 AERONET sites during 2000 to 2016, as shown in Figure 1, which are located in regions above the annual average WHO IT-1 value for PM2.5 of 35 μg/m3, and with at least 500 days of measurements. Figure 1 shows global decadal mean satellite-derived PM2.5; this data set was inspired by work by van Donkelaar et al. [32]. PM2.5 concentrations in large populated regions of northern India and eastern China, respectively, exceed 60 μg/m3 and 80 μg/m3. The summarized information of all collected sites is shown in Table 1.
2.2. Descriptions of MODIS Aerosol Algorithms and Products
The MODIS sensor has 36 channels, ranging from 0.4 to 14.4 µm. Eight of these channels between 0.47 and 2.13 µm are used to retrieve aerosol properties over land and ocean areas by separate algorithms. The MODIS C6.1 aerosol products suite has recently been released to replace the C5 products. The Level 2 aerosol products (MOD04 for Terra and MYD04 for Aqua) are provided at a nominal spatial resolution of 10 km × 10 km at nadir. Spatiotemporally aggregated Level 3 products at 1° × 1° resolution and daily, 8-day, and monthly temporal resolution are also available. In addition to aerosol properties, the MODIS algorithm reports several diagnostic products, including a protocol for assessing the “Quality” of the retrieval known as the Quality Assurance (QA) plan [33].
2.2.1. The DT Aerosol Algorithm and Product
The C6.1 DT algorithm is based on the same algorithm principle as in C5, with subtle changes such as aerosol model, surface reflectance assumptions, cloud mask and pixel selection. First, 20 × 20 groups of pixels with a 500 m resolution at 0.47, 0.65, and 2.13 µm channels, are organized into a “retrieval box” of 10 × 10 km. All unsuitable pixels (e.g., cloud, desert, snow/ice, and inland water), and the darkest 20% and brightest 50% (at 0.65 μm surface reflectance) of pixels are discarded to reduce cloud and surface contamination. At this stage some of the brightest urban surfaces may be discarded but some pixels within the 20 × 20 kernel normally remain for computation of AOD for the 10 km pixel. Then, the surface reflectance at two visible channels can be parameterized, based on a dynamic relationship between visible channels of 0.47 and 0.65 μm and the infrared channel of 2.13 μm. The aerosol model and look-up table are employed in DT retrieval, which is conducted according to geolocation and season. Finally, the spectral AOD is obtained according to the matching values. The details of the 10 km DT algorithm were published in Levy et al. [34]. Recently, the C6.1 not only improved the process of the 10 km product, but also introduced a dataset with a 3 km spatial resolution [24]. It is also worth mentioning that a new surface reflectance relationship between shortwave infrared and visible wavelength bands were revised using a spectral surface reflectance product in the C6.1 DT algorithm [35]. The DT algorithm has been applied on the global scale, and the results show that more than 70.6% retrievals are within the estimated confidence envelope (expected error, EE) of 1 standard deviation which is ±(0.05 + 15% × AODAERONET) [36]. In this study, the DT product at 10 km was obtained from the MODIS Level-1 and Atmosphere Archive and Distribution System (http://ladsweb.nascom.nasa.gov) for the years 2000–2016, and the “Optical Depth Land and Ocean” scientific data set (SDS) was used, with QA = 3 indicating the retrievals of highest confidence.
2.2.2. The DB Aerosol Algorithm and Product
Unlike DT, the DB algorithm was developed to retrieve aerosol properties over bright desert surfaces [37]. It performs retrievals at 1 km resolution and then aggregates pixels into a 10 km retrieval box. These pixels are masked and screened to eliminate clouds and snow/ice surfaces. For the remaining pixels, the surface reflectance is prescribed by one of several methods, dependent on location, season, and land cover type, from a global surface reflectance database in visible bands (0.412, 0.47, and 0.65 μm) at 0.1° × 0.1° resolution, which was developed by the minimum reflectivity method. Unlike the DT uncertainty estimate, the EE of the DB AOD is approximately ±(0.05 + 20% × AODAERONET), and 79% proportion of retrievals agrees within EE of the AERONET observation [26]. In this paper, the MOD04 product with the SDS of “Deep_Blue_Aerosol_Optical_Depth_550_Land_Best_Estimate” is used.
2.2.3. The Merged DT/DB Algorithm and Product
In C6 and C6.1, the new DT and DB merged AOD products (DT/DB) are based on the DT and DB AOD retrievals. The inclusion of a merged SDS was motivated by a desire to provide a more gap-filled data set than is available from the individual algorithms alone. The logic behind the merge as implemented within the C6 reprocessing was that there is a longer heritage of user familiarity with DT data over densely vegetated regions, while DB is the only data set providing coverage over arid surfaces. Three classifications were determined by monthly normalized difference vegetation (NDVI) in the merge algorithm. Over land, where NDVI ≤ 0.2 in a given month, DB data are used to populate the merged SDS, and where NDVI ≥ 0.3, DT data are used. For intermediate NDVI areas which are usually transition zones between arid and vegetated land, the algorithm whose retrieval returns the higher QA flag is used, or if both return QA = 3, the mean value is used [38]. This result is stored in the SDS named “AOD_550_Dark_Target_Deep_Blue_Combined”.
2.3. Spatio-Temporal Matching for Satellite-Retrieved AOD Products with Ground-Based Observations
In this study, to match the instantaneous AOD value provided by satellites with the repeated measurements observed by AERONET, we followed the matchup methodology of Ichoku et al. [39]. The AERONET data averaged within 30 min of the MODIS overpass are extracted and compared with MODIS AOD data averaged within the 5 × 5 pixels surrounding the AERONET site. As satellite-retrieved AOD retrievals are at 550 nm, AERONET data are interpolated to 550 nm using the Angstrom exponent , defined as:
where , are the AOD at wavelengths , . The nearest available pair of wavelengths from AERONET (normally 675 nm and either 440 or 500 nm) are used.
The statistical metrics considered in the evaluation are N is the number of collocated AODs; R and MR are the Pearson’s correlation coefficient and the matching radio of the MODIS AOD product and the AERONET ground-observed data, respectively; RMSE, the root mean square error; MAE, the mean absolute error; RMB, the relative mean bias (the RMB > 1.0 and RMB < 1.0 indicate the overestimation and underestimation of the retrievals, respectively). PWE, PAE and PBE as percentages of collocations falling within, above and below EE envelopes. PAE and PBE represent the overestimation and underestimation of the algorithm, respectively.
3. Results
3.1. Validation of C6.1 DT Retrievals
Table 2 provides the statistical parameters for the ground-observed and DT AOD retrievals. As shown in Table 2, we evaluate the DT retrievals at each site by analyzing the N, matching ratio (MR), R, RMSE, MAE, RMB, PWE, PAE and PBE. The MODIS C6.1 DT AODs show a high correlation (R = 0.804) with AERONET ground-observed measurements and very high accuracy (PWE = 45.6%), but have a significant overestimation over this region with high RMB (1.158, greater than 1.0) and PAE (40.7%) values. The estimation of surface reflectance (SR) is an important factor in DT algorithm over land. However, high SR values make it difficult to accomplish this discrimination as aerosol path radiance is often lower than surface radiance. It was reported by a previous study [40] that the large intercept between DT retrievals and ground-observed AOD is due to a large uncertainty in the surface reflectance estimation [41]. In the Asia region, the greatest uncertainty is observed at urban sites dominated by dust aerosols, including BJS, BJC, and LHR sites, with only 18.3%, 13.8%, and 30.6% of observations falling within the EE, respectively. This may be because the high SR (> 0.079, as shown in Table 1) of the three sites imposes a great challenge and introduces large uncertainty for the DT algorithm. There are no AOD retrievals at the KRC site with the highest SR (0.114). It is notable that the DT algorithm is not applicable in the Middle East region, where most of the land cover type is barren or sparse vegetation. The bright reflectance of dust at blue channel (SR = 0.095-0.162) limits the DT algorithm from retrieving AODs in all sites. Similar to the Middle East, the DT algorithm is only applicable to CSE, DJG and ILR sites with low reflectivity in the North Africa region. However, the N and MR are significantly smaller than those for sites in the Asian region. In addition, the DT algorithm is underestimated at DJG and ILR sites, which was attributed to overestimation of the SR and the use of inappropriate aerosol schemes in the algorithm.
3.2. Validation of C6.1 DB Retrievals
Table 3 shows a comparison between the DB AOD retrievals and the AERONET ground-based observations at all sites. Compared with the DT algorithm, there are much larger numbers of matched retrievals by DB algorithm, i.e., 10258, 3755 and 4632 over sites in Asia, the Middle East, and Northern Africa, respectively. For the Asia region, the statistical data show that the MR is 73.6%, approximately 57.5% of the collections falling within the EE, with the correlation coefficient of 0.702. In this region, the overestimation of AOD is slightly greater than the underestimation (PAE = 22.6%, PBE = 19.9%). In particular, there is serious overestimation at the KRC site, for which PAE = 55.2%. The performance of the DB algorithm is significantly better than that of the DT algorithm in the Middle East region, where the MR is 70.6%, with 47.3% of the collections falling within the EE. In the Northern Africa region, the DB AOD retrievals show a high agreement with AERONET AOD measurements and approximately 49.2% of the retrievals falling within the EE, with low RMSE (0.248) and MAE (0.166) errors. On the whole, the DB algorithm is significantly improved compared to the DT algorithm in this study, i.e., the RMSE and MAE errors are decreased by 14.5% and 20.8%, respectively. Additionally, approximately 53% of the DB retrievals fall within the EE. Although DB was slightly underestimated in comparison to DT, the overestimation of DB retrievals was significantly improved, with the PAE decreased by 63%. This indicates that the DB product is recommended for aerosol applications in this study.
3.3. Validation of C6.1 DT/DB Retrievals
To evaluate the performance, a total of collocated 11,537 MODIS DT/DB aerosol retrievals were compared with AERONET ground-based measurements. As shown in Table 4, it is easy to find that AOD retrievals exhibit overall high correlations with AERONET AOD measurements (R = 0.841), with 53.1% of them falling within the EE, indicating good performances over the heavy aerosol loading areas. However, the accuracies vary greatly at different sites, where only five sites had more than 60% of the collections falling within the EE. In the Asia region, the DT/DB AOD retrievals have an underestimation of 9.8% and an overestimation of 36.5%; the PWE is 53.7%. Similar to the DB algorithm, the DT/DB algorithm also underestimates at the KRC site, where PBE = 48.1%. However, the opposite trend is observed at sites in the North Africa region, where there is an average underestimation of 35.2% and an overestimation of 17.8%, with 47.0% of the collections falling within the EE. Compared with the DT algorithm, the DT/DB algorithm has improved in this region, but this is still not applicable at the DHB, MSF and BRN sites. For all sites, the DT/DB AOD retrievals achieved high correlation (R = 0.841) with AERONET ground measurements, with low RMSE (0.238) and MAE (0.157) errors. However, the DT/DB algorithm has an obvious overestimation in the three regions (PAE = 30.3%, RMB = 1.082).
3.4. Comparison of DT, DB and DT/DB Products with Ground-Observed Data in Each AOD Bin
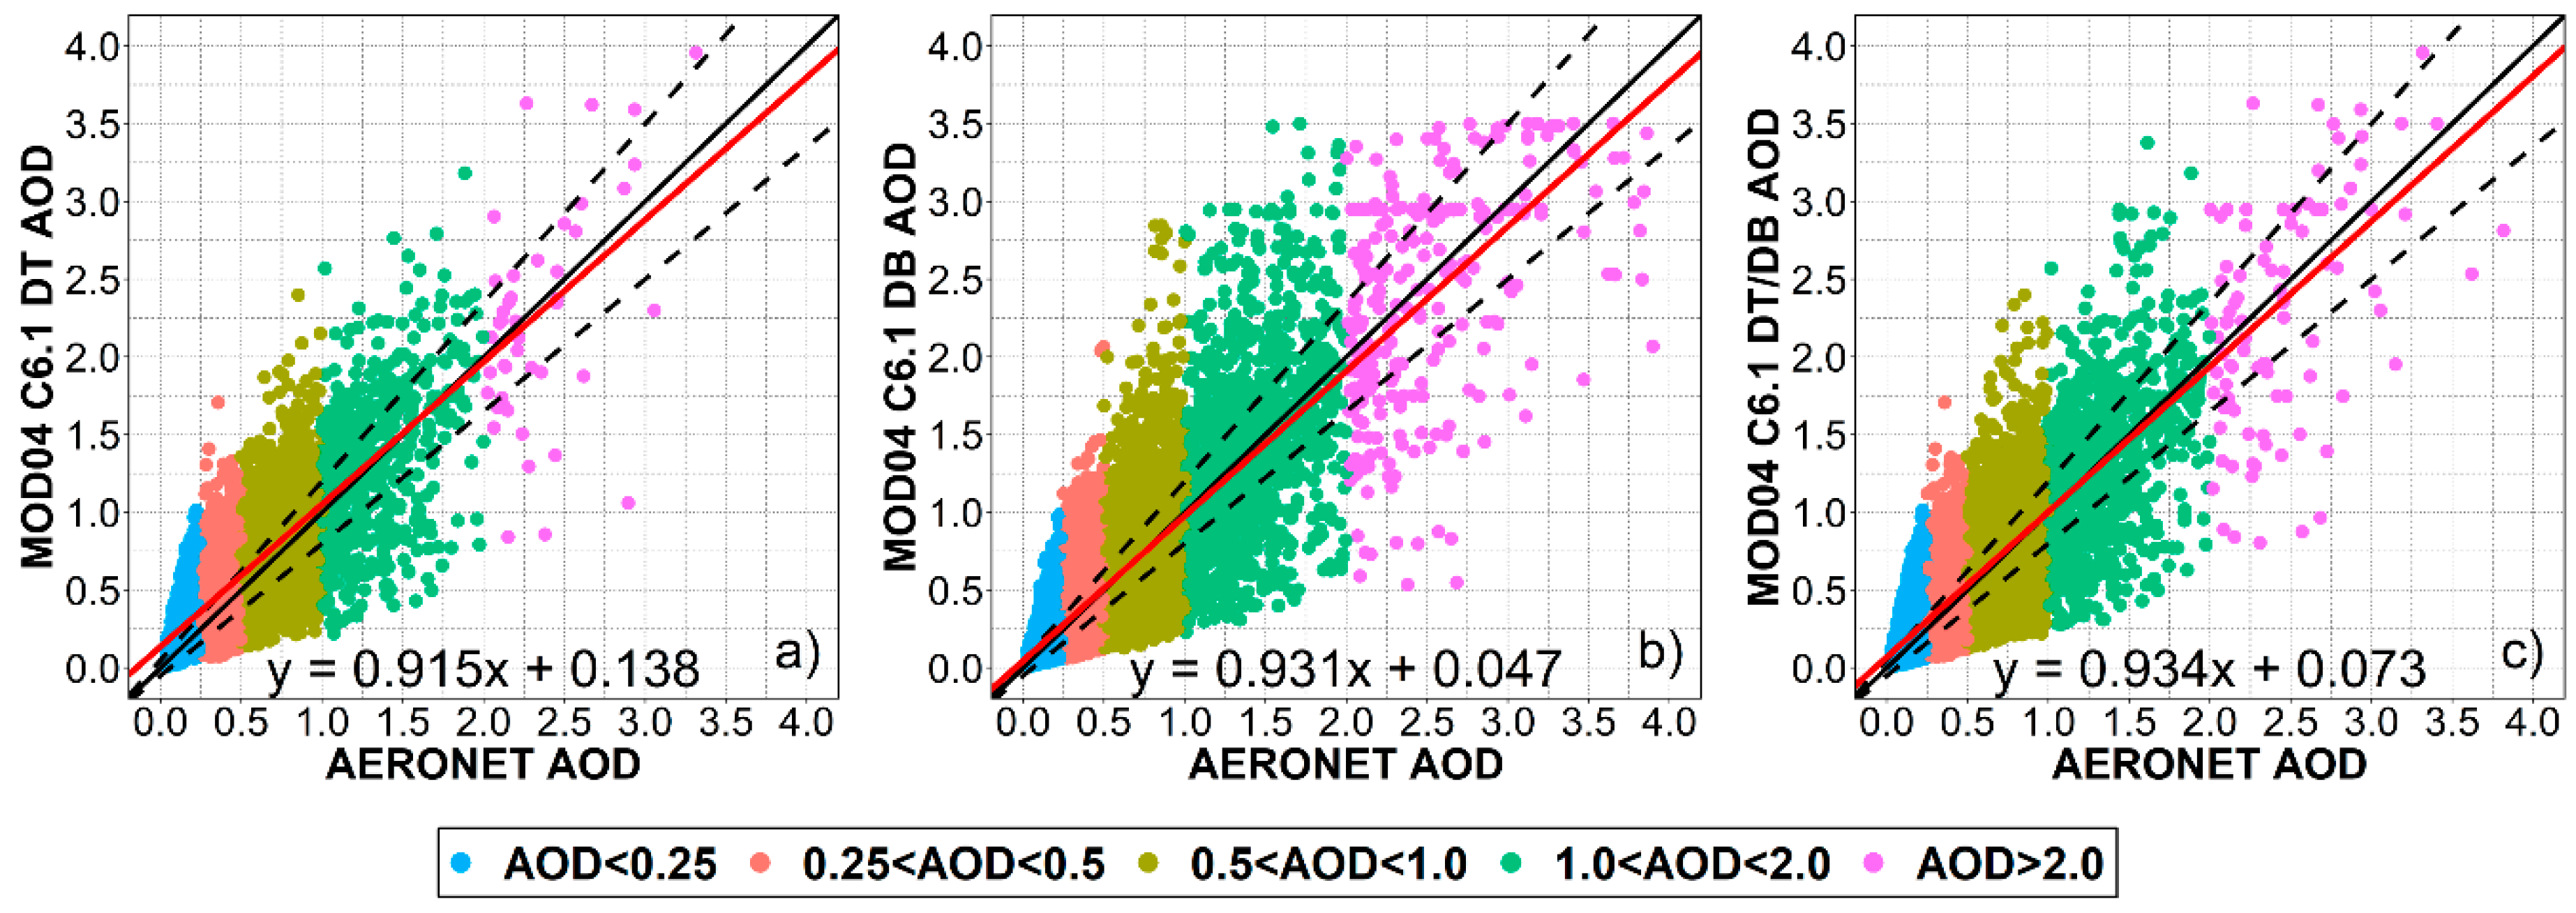
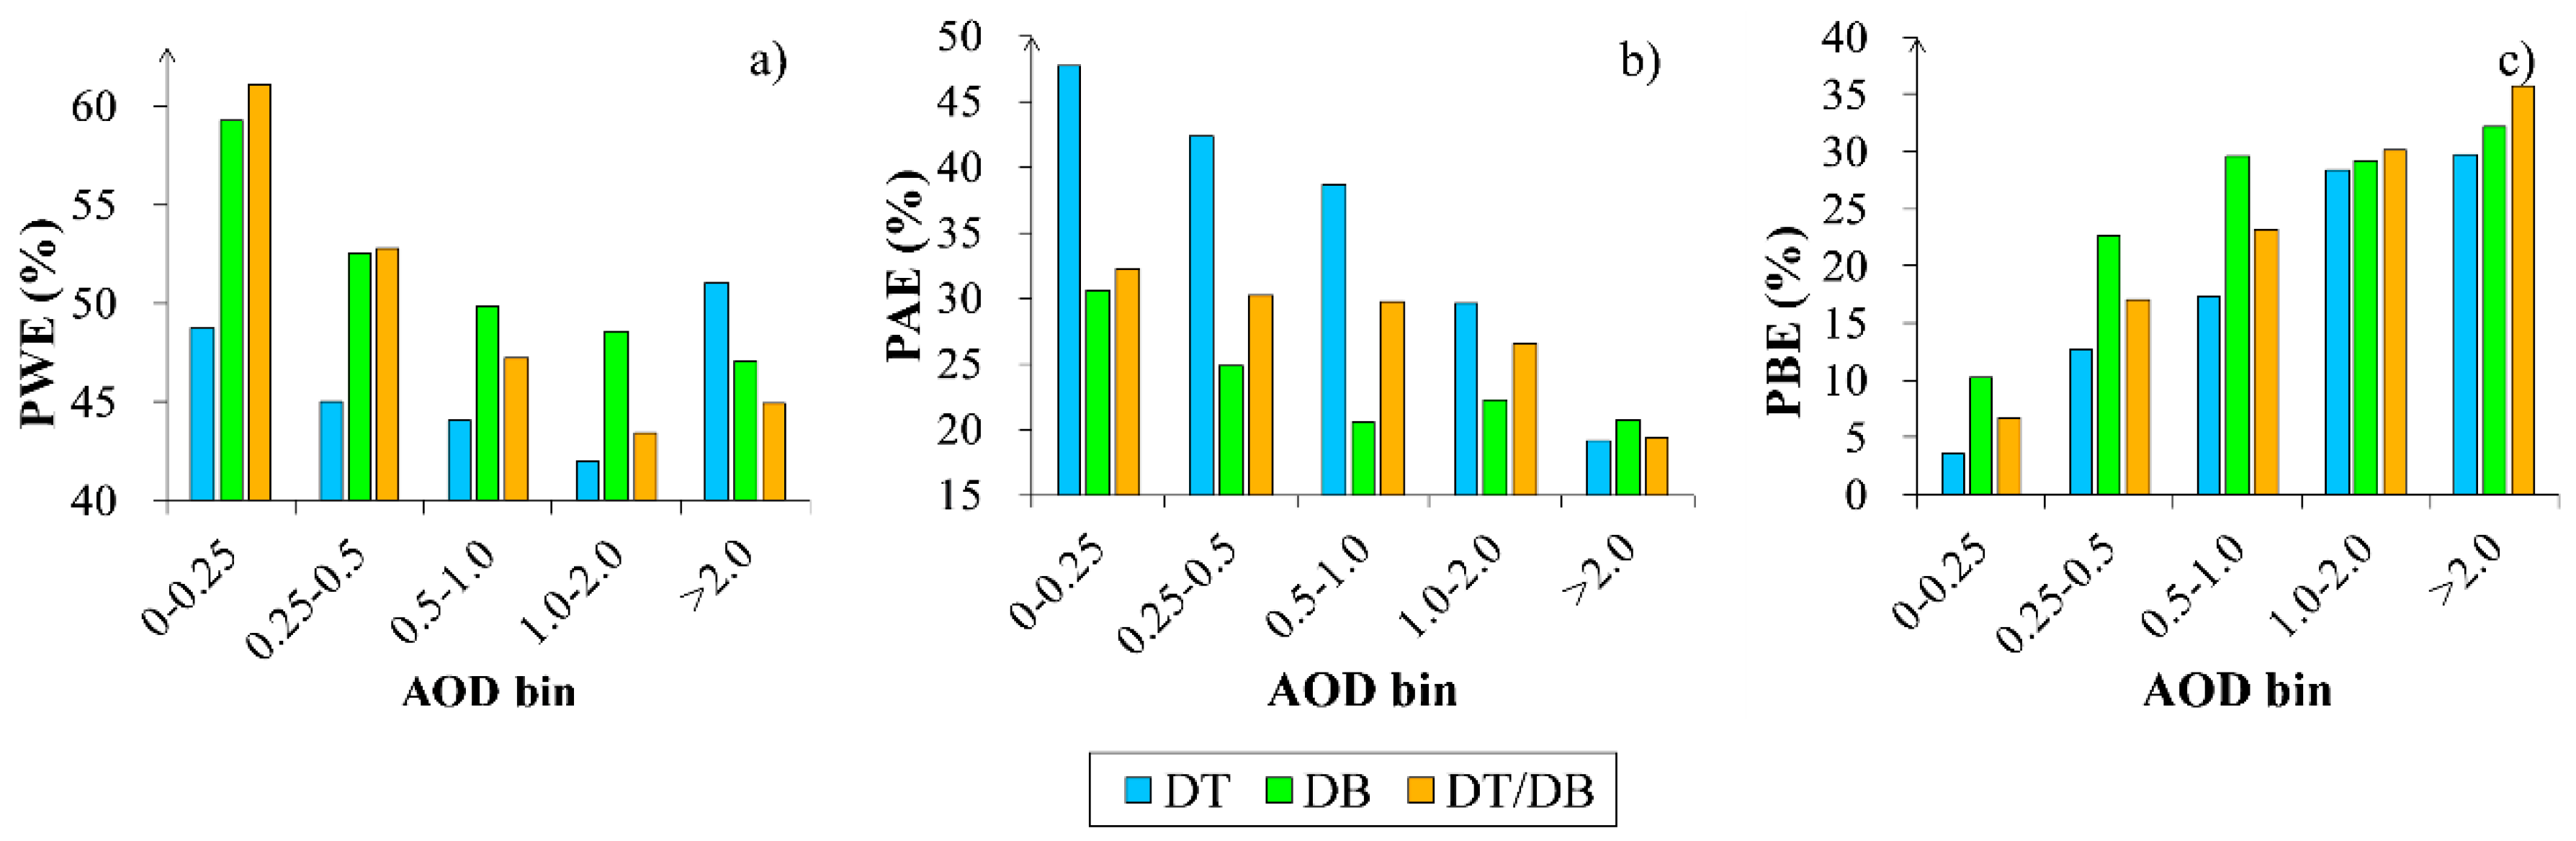
Figure 2 shows the scatter plots of MODIS DT, DB and DT/DB AOD retrievals against AERONET measurements for the years 2000–2016 in the 0 to 4.0 AOD bins. The number of collections for DT retrievals is lower than that for DB and DT/DB retrievals because the DT algorithm is unable to retrieve AOD over bright and complex surface types. In the correlation comparison between satellite retrieval and ground observation, the slope of the linear regression is linked to systematic uncertainties such as assumptions of aerosol models, while the constant offset tends to be associated with factors such as deviation in surface reflectance estimation [26,42]. For DT retrievals, the slope is lower than DB and DT/DB and the intercept is higher than both. As shown in Figure 3, the PWE values of the three products are decreased significantly with increasing AOD. It is worth mentioning that the PWE value of DT algorithm is 51.1% when AOD > 2.0, which is due to the number of collections being very small (N = 47). In addition, the PAE and PBE values decreased and increased, respectively, indicating that overestimation was significantly suppressed, and underestimation increased with the increase of AOD. The DT retrievals have lowest PWE value, highest overestimation, and lowest underestimation in each AOD bin, except for AOD > 2.0. The DB and DT/DB retrievals have lower uncertainty when AOD < 0.25 with PAE = 59.3% and 61.1%, respectively. However, the DB and DT/DB algorithms exhibit underestimation during polluted days (AOD > 1.0), approximately 30% of the collections above EE.
On the whole, the accuracy of the DT, DB and DT/DB algorithms over the heavy aerosol loading and high surface reflectance areas is lower than on the global scale. The verification results show that none of the aerosol products are suitable for application in research on atmospheric aerosols under heavy aerosol loading; thus, there is important theoretical and practical significance for proposing a high-precision method of aerosol retrieval.
3.5. Seasonal Differences of DT, DB and DT/DB Products
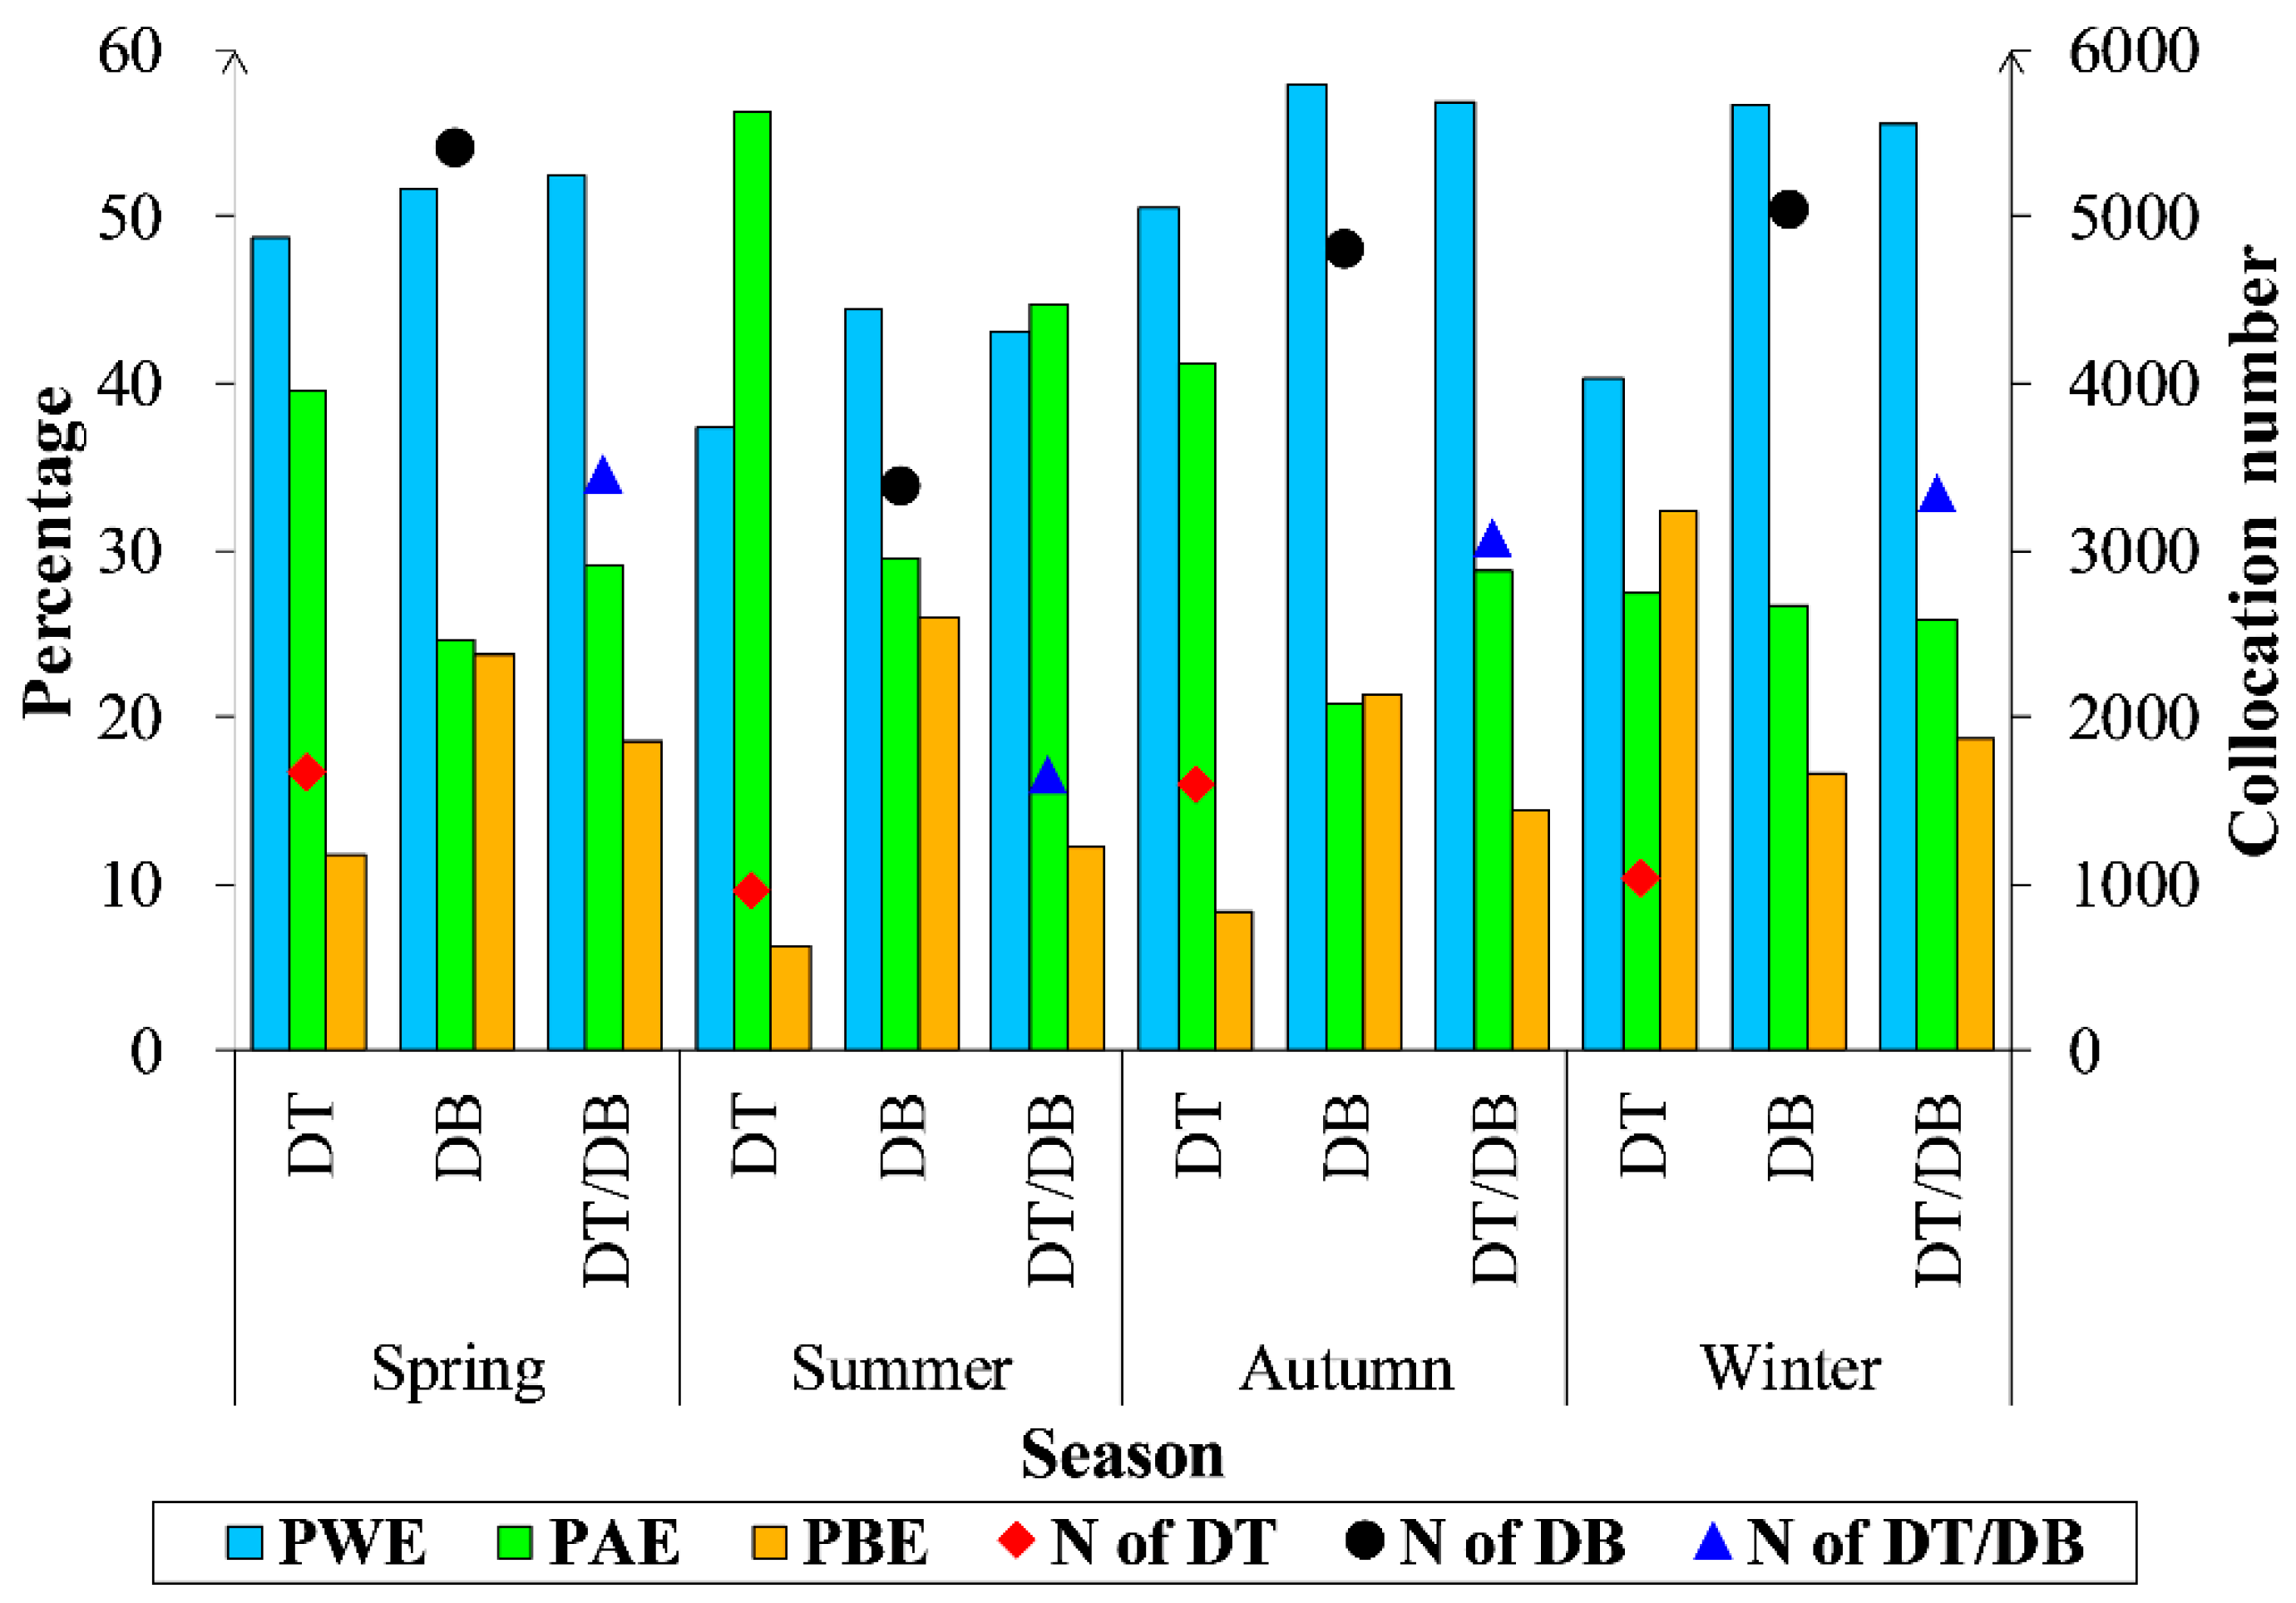
Previously, strong seasonality has been noted in the performance of Aqua MODIS products (including DT, DB and merged DT/DB) [43], which instigated us to examine the seasonality of Terra MODIS AOD. Figure 4 and Figure 5 summarize the seasonal variation of retrieval accuracy for Terra MODIS and AERONET comparison of AOD at 550 nm, indicating that the statistical parameters of DT, DB and DT/DB aerosol retrievals exhibit strong seasonality and similar variation trends. The number of collections for three products is the greatest in spring, moderate in autumn and winter, and the smallest in summer. The value of PWE is highest in autumn, moderate in spring and winter, and lowest in summer. The variation of overestimation is similar, the largest in summer, the smallest in winter for DT and DT/DB products, but the smallest overestimation of DB product is in autumn. The PBE values of the three products are lower than those of PAE in different seasons, indicating that the underestimation of the aerosol retrievals is weaker than overestimation. The underestimation also has strong seasonality, the PBE values of DT and DT/DB are highest in winter and lowest in summer, while the PBE values of DB product are the opposite. In the four seasons, the number of collections of DB product is more than DT and DT/DB products. The accuracy of DB retrievals is superior to that of DT retrievals, due to the more accurate estimation of the surface reflectance. DT has the lowest accuracy, the largest overestimation and the minimum collections, which further demonstrates that the DT algorithm is not suitable for areas with high surface reflectance and pollution. We analyzed the single scattering albedo (SSA) value at Beijing AERONET site from 2001 to 2016 and found that the average values are 0.90, 0.92 at 440, 676 nm, respectively. For the study area, the high setting of the SSA value in the MODIS lookup table may be the one of the reasons for the uncertainty of AOD retrieval.
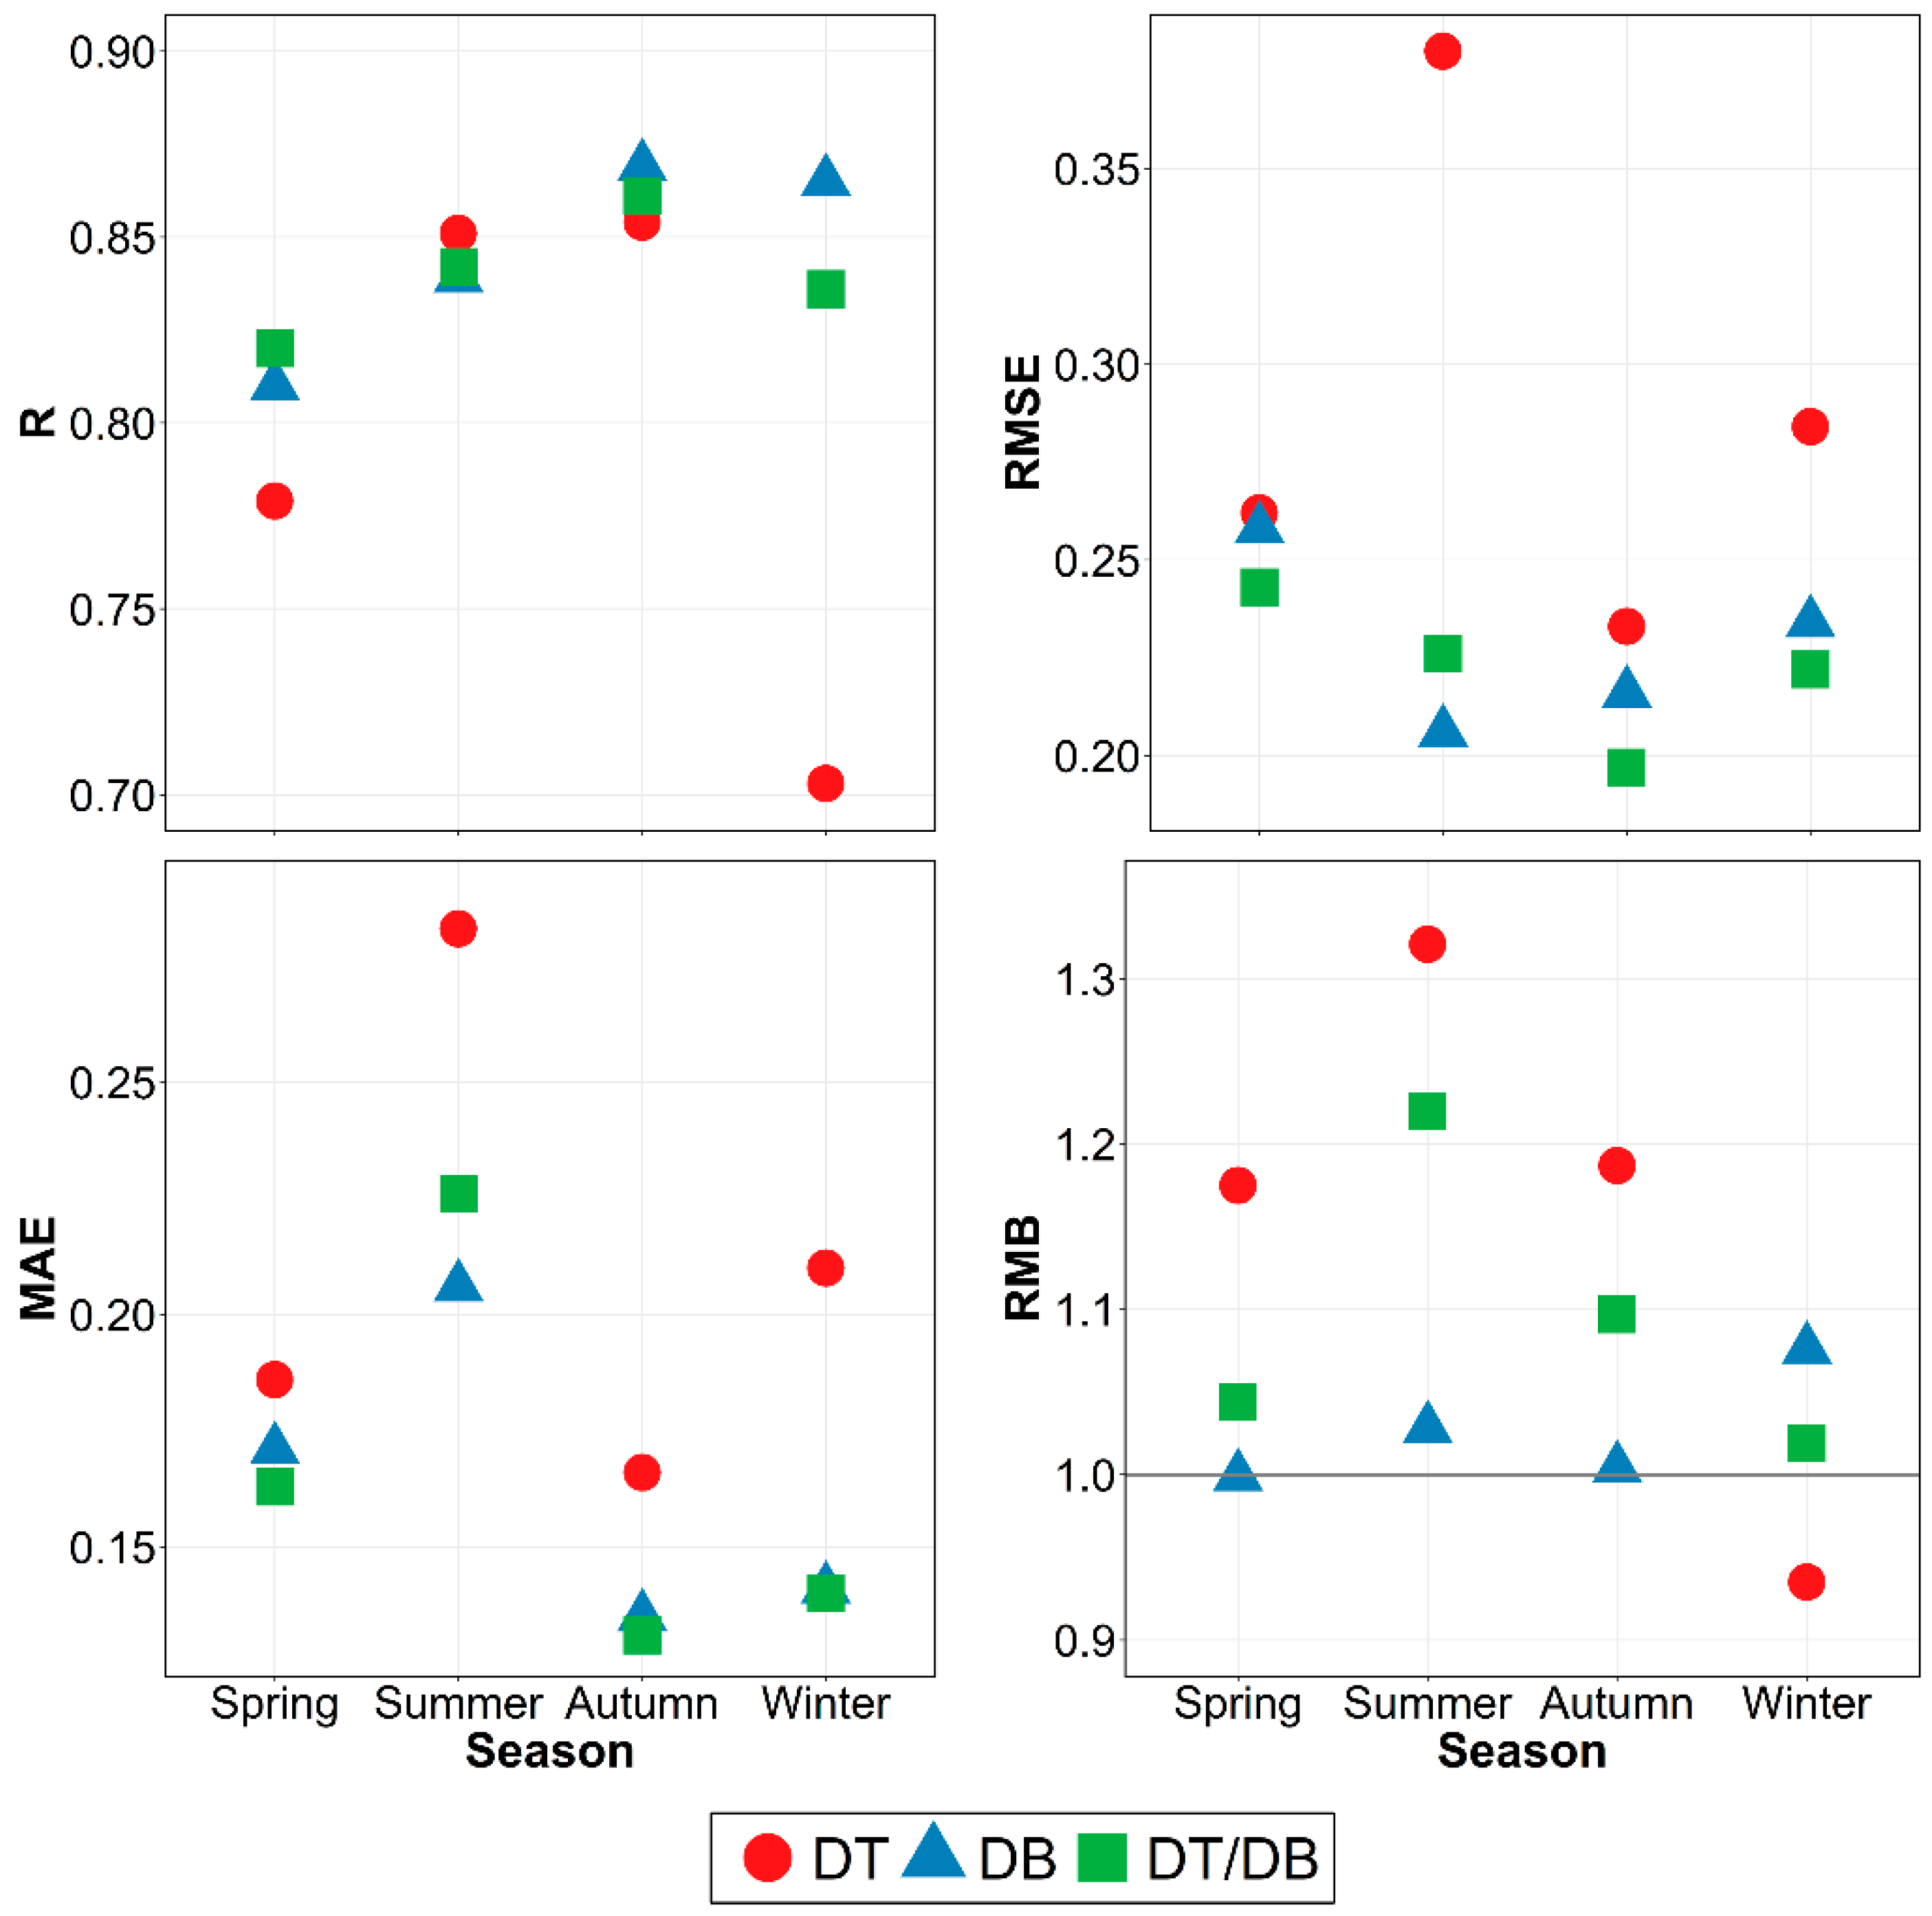
Figure 5 summarizes the error statistics for DT, DB, and DT/DB products against AERONET AOD ground-observed measurements in the four seasons, which indicates that the performance of the DB and DT/DB algorithms is slightly better than the DT algorithm in each season. Figure 5 also illustrates that three products show a strong seasonality when retrieving AOD. Correlations of the DB, DT/DB retrievals and AERONET AOD ground-observed measurements are up to approximately 0.80 in any season, but the correlation coefficient between the MODIS DT retrievals and the AERONET ground-observed AODs in winter decreases to 0.703 as shown Figure 5. Most values of the RMSE are much less than 0.30 in the four seasons for the three products, except DT in winter. The MAE error is higher in summer than other seasons. The RMB errors are greater than 1.0 in the four seasons, which indicates overestimation of the retrievals, except DT in winter, as shown in Figure 3, where PBE = 32.3%. In addition, the values of RMSE and MAE errors for DT product are larger than DB and DT/DB products and the RMB errors for DB and DT/DB products are close to 1.0. In general, the MODIS DT product shows poor ability to retrieve AOD as it has a low PWE of 37.4–50.5% with high RMSE of 0.233–0.380 and MAE of 0.166–0.283. The reason for seasonal variation in accuracy at these sites may be due to monsoon and downwind biomass burning sources [44,45].
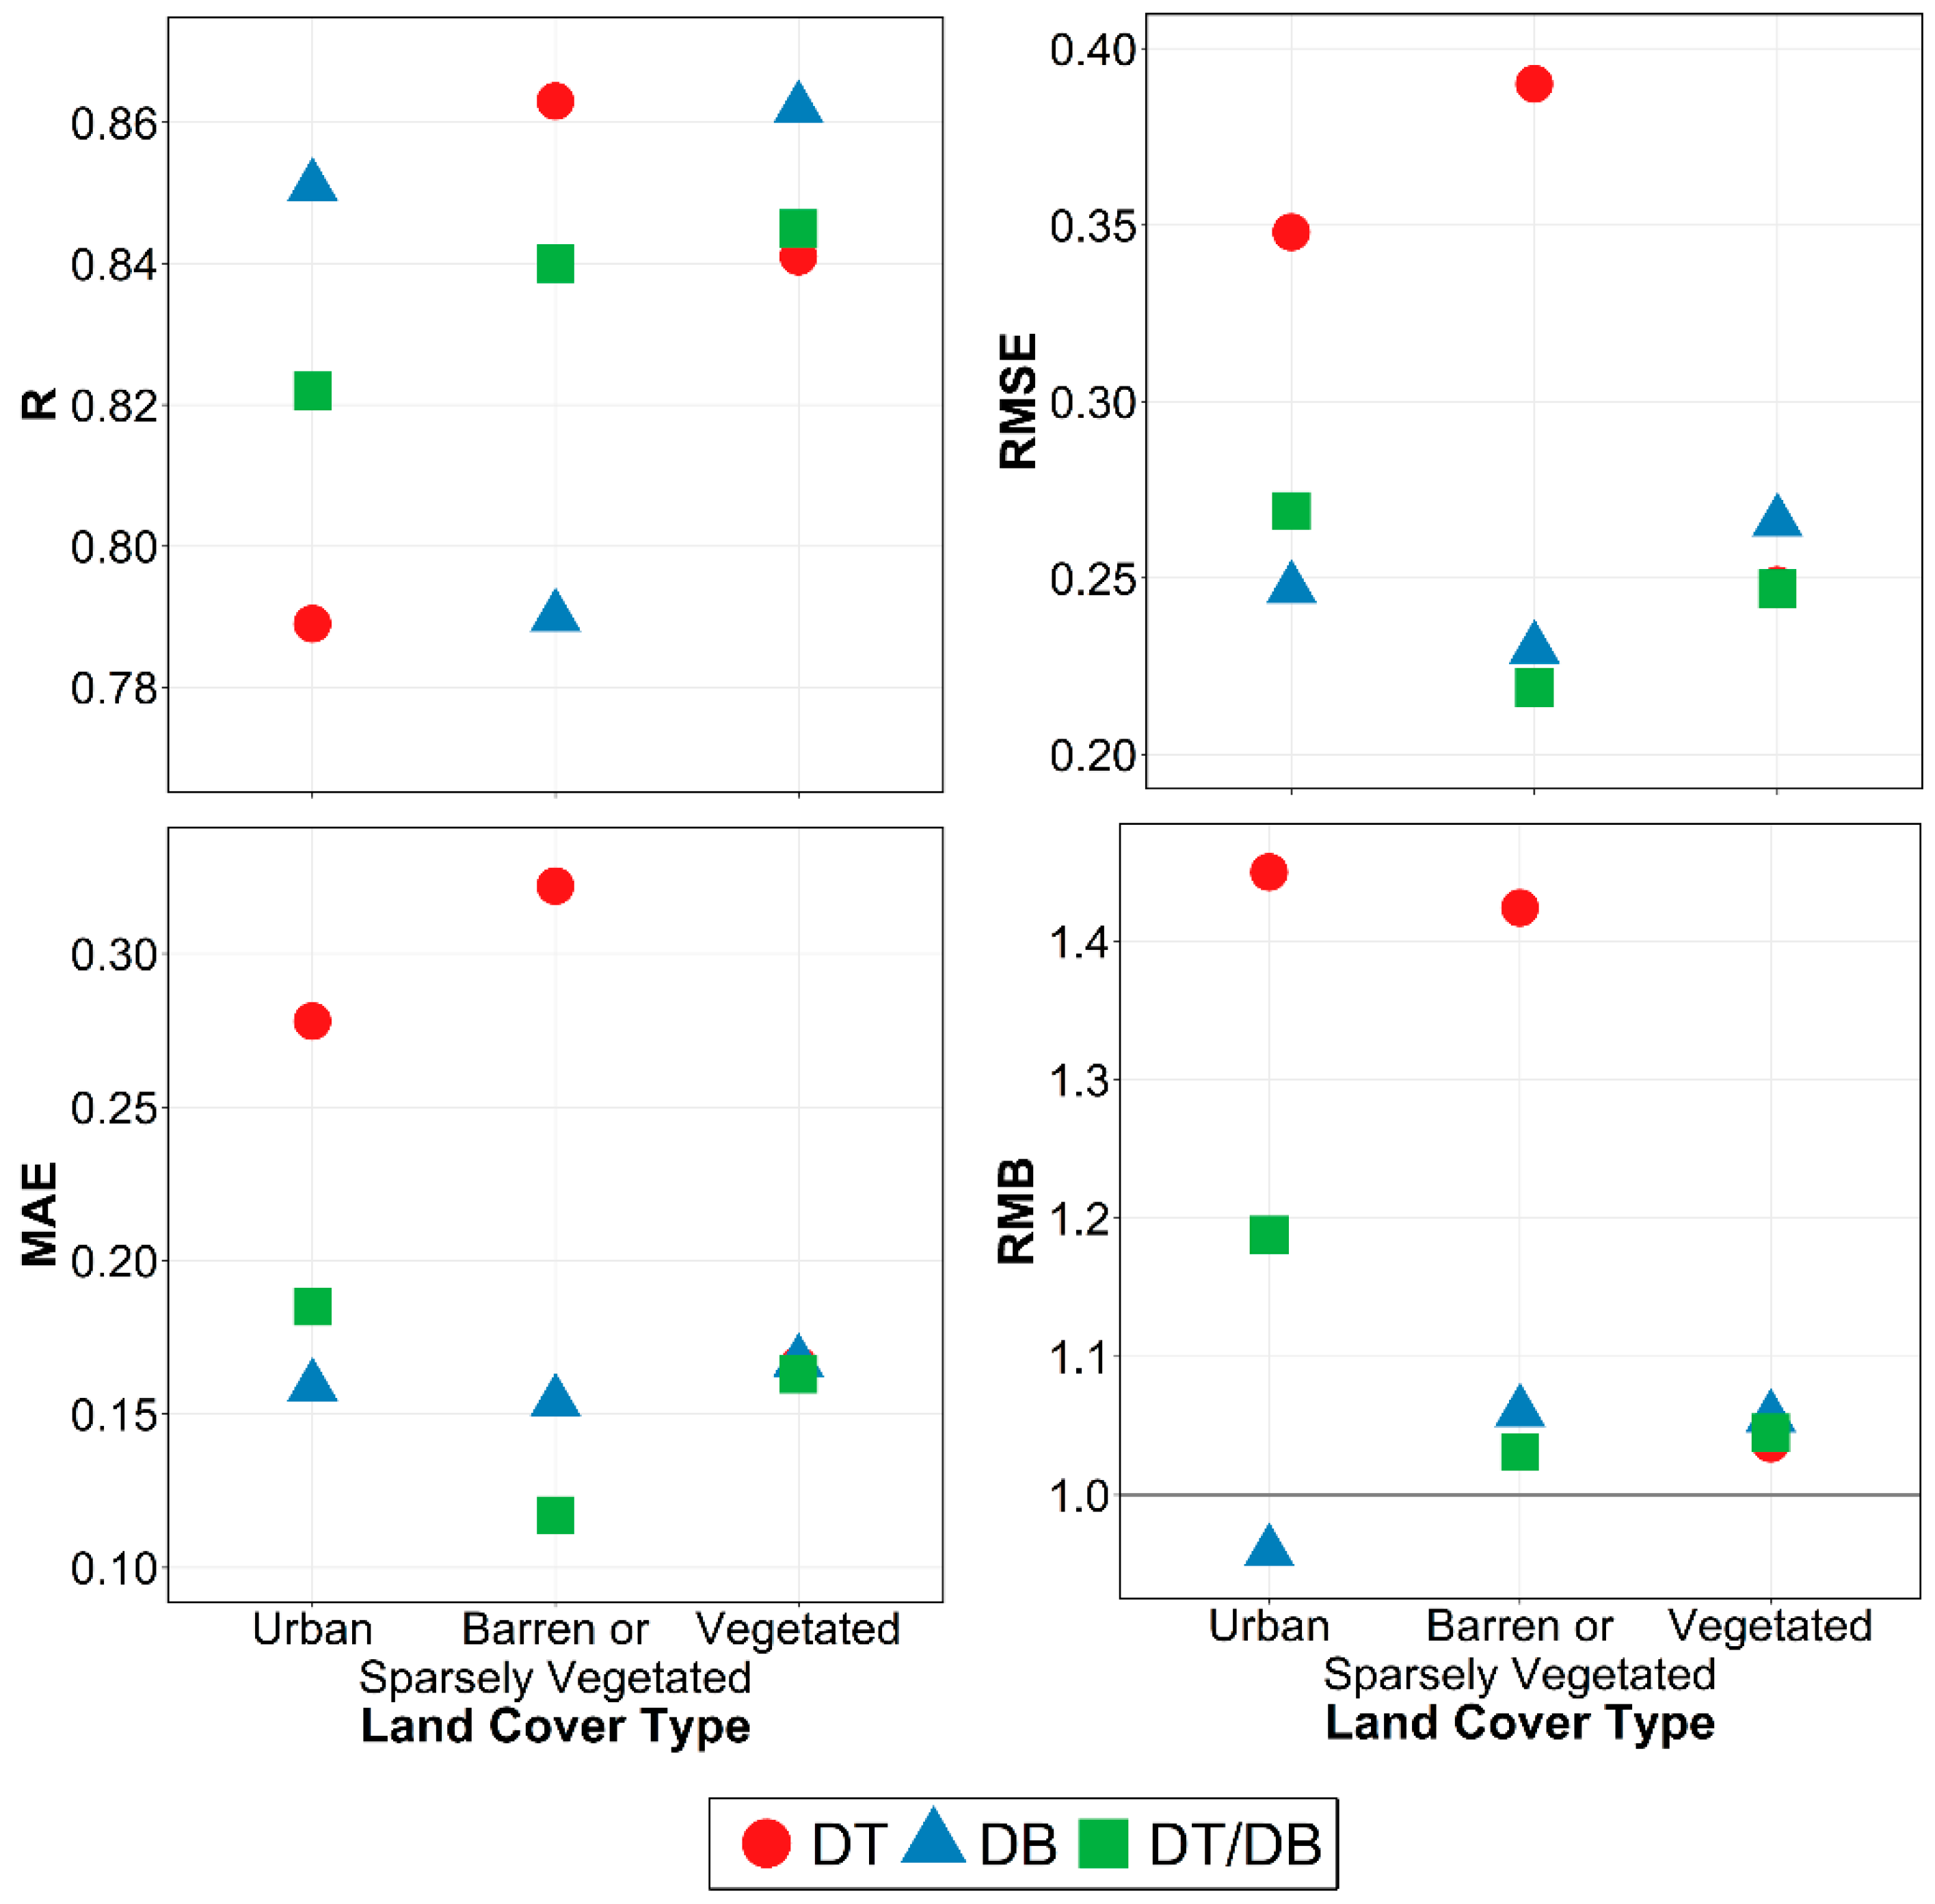
3.6. Adaptability of DT, DB and DT/DB Products over Different Land Cover Types
Due to the diurnal variation of the aerosol sources, components and particle size distributions, assessing the availability of DT, DB and DT/DB products over various land cover types is becoming imperative. To explore the adaptability of three products over different land cover types, in this study, the 23 AERONET sites are divided into three land cover types: (1) urban (8 sites: BJS, BJC, KRC, LHR, DHB, BRN, KUS, and CES); (2) barren or sparsely vegetated (9 sites: THS, HMM, MIS, MZR, MSF, EFS, DMS, ZAS, and AGF); and (3) vegetated (6 sites: XHS, XLS, GCS, KPR, DJG, and ILR), according to the MCD12Q1 Land Cover product in 2013 year and the MOD09A1 8-day composited Surface Reflectance product from 2010 to 2015. Figure 6 illustrated the numbers of collections and the value of PWE, PAE and PBE for three products over urban, barren or sparsely vegetated and vegetated areas and Figure 7 shows the error statistics.
There were totals of 1616, 6435 and 3432 MODIS/AERONET collections over urban area for the DT, DB and DT/DB products, respectively. It is easy to find that the DB retrievals have the highest PWE, the lowest PAE, high correlations with AERONET AOD measurements, and small RMSE and MAE errors, with a value of RMB close to 1.0. For DT retrievals, only 25.2% of the retrievals falling within the EE had large RMSE and MAE errors. The DT product has a higher PAE than the DB product, indicating that DT retrievals seriously overestimated aerosol loading. The DT/DB retrievals have a good correlation, small RMSE and MAE errors, with 46.3% of the collections falling within the EE. However, the DT/DB results exhibited an overestimation, the PAE is slightly higher than that for the DB product. The accuracy of DT/DB retrievals over urban areas is better than the DT product and worse than the DB product. On the whole, the DB retrievals have better applicability in urban areas. Unlike DT and DT/DB products, the DB retrievals are somewhat underestimated over this area.
For barren or sparsely vegetated areas, the collections N for the DT algorithm are much less than other algorithms over this area, with only a small amount at the THS site (N = 52, as shown in Table 2). The results show that the DT product has poor ability to retrieve AOD over barren or sparsely vegetated area. The accuracies of the DB and DT/DB products are similar, with 49.7% and 56.9% of the collections falling within the EE, respectively. However, the collections for DB retrievals with AERONET are almost 1.7 times those for DT/DB product.
We have collected 3432, 3571 and 4534 collections for DT and DB and DT/DB products over the vegetated area. Figure 6 and Figure 7 show that the vegetated sites have highest PWE value for each product, with less overestimation, high correlations, small RMSE and MAE errors, which is not surprising, as the DT algorithm is tuned to vegetated targets.
4. Discussion and Conclusions
The objective of this study was to evaluate the Terra-MODIS C6.1 AOD retrieval product including Dark Target, Deep Blue and the combined DT/DB product at 10 km spatial resolution using ground-observed measurements from AERONET 23 sites over heavy aerosol loading areas during the period 2000 to 2016. The results showed the poorest performance for the DT algorithm over the study area, with only 45.6% of the collections falling within the EE, and with larger RMSE and MAE errors than the DB and DT/DB retrievals. The DB AOD retrievals were in good agreement with AERONET AOD measurements (R = 0.847) at most of the sites, and 53.4% of retrievals fall within in the EE with low RMSE and MAE errors, but the AOD was significantly underestimated when AOD > 1.0. The combined DT/DB AOD appeared to be superior to DT AOD due to the greater contribution of DB retrievals over bright-reflecting source regions. On the whole, over medium- and low-latitude land areas, the value of PWE for all algorithms was lower than the value on a global scale.
In general, the accuracy of the MODIS aerosol product is related not only to the land cover type but also to seasonal variation. For the urban and barren or sparsely vegetation areas, the accuracy of DB and DT/DB algorithms is similar, and better than that of DT retrievals. The performance of three products is similar over vegetation area. The accuracy of DT product is not significantly better than that of DB and DT/DB products, which may be related to both underestimation of surface reflectance and inappropriate use of an absorbing aerosol model in the study area. For the all products, the value of PWE is the largest in autumn, and the smallest in summer, overall, the performance of DB and DT/DB are better than DT in most seasons.
This study provided an overview and initial analysis of the three typical products of Terra-MODIS C6.1 over medium- and low-latitude land areas, where there is heavy aerosol loading and increasing air pollution. The analysis has shown that the DB algorithm has the best performance in this area, and while not optimal, the current merged DT/DB algorithm nevertheless does provide a data set which will be suitable for quantitative scientific applications.
Author Contributions
Conceptualization, X.T. and Z.G.; methodology, X.T. and Z.G.; data curation, X.T.; formal analysis, X.T.; validation X.T.; funding acquisition, Z.G.; project administration, Z.G.; supervision, Z.G.; writing of the original draft, X.T.; writing of review and editing, Z.G.
Funding
This work was supported by the National Natural Science Foundation of China (NSFC) fund project (41876107), NSFC-Shandong joint fund project (U1706219), Basic Special Program of Ministry of Science and Technology (2014FY210600) and Aoshan Science and Technology Innovation Program of Qingdao National Laboratory for Marine Science and Technology (2016ASKJ02).
Acknowledgments
The data for this paper are available at Level-1 and Atmosphere Archive & Distribution System (LAADS) Distributed Active Archive Center (DAAC) (http://ladsweb.nascom.nasa.gov) and AERONET Web (http://aeronet.gsfc.nasa.gov). The authors would like to thank GSFC and AERONET for kindly providing the data. In addition, a very special acknowledgement is made to the editors and referees who provided important comments that improved this paper.
Conflicts of Interest
The authors declare no conflict of interest.
References
- Grantz, D.A.; Garner, J.H.B.; Johnson, D.W. Ecological effects of particulate matter. Environ. Int. 2003, 29, 213–239. [Google Scholar] [CrossRef]
- Ramanathan, V.; Crutzen, P.J.; Kiehl, J.T.; Rosenfeld, D. Atmosphere-Aerosols, climate, and the hydrological cycle. Science 2001, 294, 2119–2124. [Google Scholar] [CrossRef] [PubMed]
- Kaufman, Y.J.; Tanre, D.; Boucher, O. A satellite view of aerosols in the climate system. Nature 2002, 419, 215–223. [Google Scholar] [CrossRef] [PubMed]
- Lolli, S.; Campbell, J.R.; Lewis, J.R.; Gu, Y.; Marquis, J.W.; Chew, B.N.; Liew, S.C.; Salinas, S.V.; Welton, E.J. Daytime Top-of-the-Atmosphere Cirrus Cloud Radiative Forcing Properties at Singapore. J. Appl. Meteorol. Clim. 2017, 56, 1249–1257. [Google Scholar] [CrossRef] [Green Version]
- Rosenfeld, D.; Andreae, M.O.; Asmi, A.; Chin, M.; de Leeuw, G.; Donovan, D.P.; Kahn, R.; Kinne, S.; Kivekas, N.; Kulmala, M.; et al. Global observations of aerosol-cloud-precipitation-climate interactions. Rev. Geophys. 2014, 52, 750–808. [Google Scholar] [CrossRef] [Green Version]
- Lohmann, U.; Feichter, J. Global indirect aerosol effects: a review. Atmos. Chem. Phys. 2005, 5, 715–737. [Google Scholar] [CrossRef] [Green Version]
- Chen, Y.; Penner, J.E. Uncertainty analysis for estimates of the first indirect aerosol effect. Atmos. Chem. Phys. 2005, 5, 2935–2948. [Google Scholar] [CrossRef] [Green Version]
- Stocker, T. Climate Change 2013: The Physical Science Basis: Working Group I Contribution to the Fifth Assessment Report of the Intergovernmental Panel on Climate Change; Cambridge University Press: New York, NY, USA, 2014; pp. 33–50. [Google Scholar]
- Lolli, S.; Alparone, L.; Garzelli, A.; Vivone, G. Haze Correction for Contrast-Based Multispectral Pansharpening. IEEE Geosci. Remote. Sens. Lett. 2017, 14, 2255–2259. [Google Scholar] [CrossRef]
- He, Q.Q.; Zhang, M.; Huang, B.; Tong, X.L. MODIS 3 km and 10 km aerosol optical depth for China: Evaluation and comparison. Atmos. Environ. 2017, 153, 150–162. [Google Scholar] [CrossRef]
- Talbi, A.; Kerchich, Y.; Kerbachi, R.; Boughedaoui, M. Assessment of annual air pollution levels with PM1, PM2.5, PM10 and associated heavy metals in Algiers, Algeria. Environ. Pollut. 2018, 232, 252–263. [Google Scholar] [CrossRef]
- Kim, K.H.; Kabir, E.; Kabir, S. A review on the human health impact of airborne particulate matter. Environ. Int. 2015, 74, 136–143. [Google Scholar] [CrossRef] [PubMed]
- Oanh, N.T.K.; Upadhyaya, N.; Zhuang, Y.H.; Hao, Z.P.; Murthy, D.V.S.; Lestari, P.; Villarin, J.T.; Chengchua, K.; Co, H.X.; Dung, N.T.; et al. Particulate air pollution in six Asian cities: Spatial and temporal distributions, and associated sources. Atmos. Environ. 2006, 40, 3367–3380. [Google Scholar] [CrossRef]
- Huebert, B.J.; Bates, T.; Russell, P.B.; Shi, G.Y.; Kim, Y.J.; Kawamura, K.; Carmichael, G.; Nakajima, T. An overview of ACE-Asia: Strategies for quantifying the relationships between Asian aerosols and their climatic impacts. J. Geophys. Res. Atmos. 2003, 108. [Google Scholar] [CrossRef] [Green Version]
- Basart, S.; Perez, C.; Cuevas, E.; Baldasano, J.M.; Gobbi, G.P. Aerosol characterization in Northern Africa, Northeastern Atlantic, Mediterranean Basin and Middle East from direct-sun AERONET observations. Atmos. Chem. Phys. 2009, 9, 8265–8282. [Google Scholar] [CrossRef] [Green Version]
- Agacayak, T.; Kindap, T.; Unal, A.; Pozzoli, L.; Mallet, M.; Solmon, F. A case study for Saharan dust transport over Turkey via RegCM4.1 model. Atmos. Res. 2015, 153, 392–403. [Google Scholar] [CrossRef]
- Tegen, I.; Lacis, A.A.; Fung, I. The influence on climate forcing of mineral aerosols from disturbed soils. Nature 1996, 380, 419–422. [Google Scholar] [CrossRef]
- Holben, B.N.; Eck, T.F.; Slutsker, I.; Tanre, D.; Buis, J.P.; Setzer, A.; Vermote, E.; Reagan, J.A.; Kaufman, Y.J.; Nakajima, T.; et al. AERONET—A federated instrument network and data archive for aerosol characterization. Remote Sens. Environ. 1998, 66, 1–16. [Google Scholar] [CrossRef]
- Nichol, J.E.; Bilal, M. Validation of MODIS 3 km Resolution Aerosol Optical Depth Retrievals Over Asia. Remote Sens.-Basel 2016, 8, 328. [Google Scholar] [CrossRef]
- Sayer, A.M.; Hsu, N.C.; Bettenhausen, C.; Jeong, M.J.; Holben, B.N.; Zhang, J. Global and regional evaluation of over-land spectral aerosol optical depth retrievals from SeaWiFS. Atmos. Meas. Tech. 2012, 5, 1761–1778. [Google Scholar] [CrossRef] [Green Version]
- Kahn, R.A.; Gaitley, B.J.; Garay, M.J.; Diner, D.J.; Eck, T.F.; Smirnov, A.; Holben, B.N. Multiangle Imaging SpectroRadiometer global aerosol product assessment by comparison with the Aerosol Robotic Network. J. Geophys. Res. Atmos. 2010, 115. [Google Scholar] [CrossRef]
- Vidot, J.; Santer, R.; Aznay, O. Evaluation of the MERIS aerosol product over land with AERONET. Atmos. Chem. Phys. 2008, 8, 7603–7617. [Google Scholar] [CrossRef] [Green Version]
- Jackson, J.M.; Liu, H.Q.; Laszlo, I.; Kondragunta, S.; Remer, L.A.; Huang, J.F.; Huang, H.C. Suomi-NPP VIIRS aerosol algorithms and data products. J. Geophys. Res. Atmos. 2013, 118, 12673–12689. [Google Scholar] [CrossRef]
- Remer, L.A.; Mattoo, S.; Levy, R.C.; Munchak, L.A. MODIS 3 km aerosol product: algorithm and global perspective. Atmos. Meas. Tech. 2013, 6, 1829–1844. [Google Scholar] [CrossRef] [Green Version]
- Bilal, M.; Nichol, J.E. Evaluation of MODIS aerosol retrieval algorithms over the Beijing-Tianjin-Hebei region during low to very high pollution events. J. Geophys. Res. Atmos. 2015, 120, 7941–7957. [Google Scholar] [CrossRef]
- Sayer, A.M.; Hsu, N.C.; Bettenhausen, C.; Jeong, M.J. Validation and uncertainty estimates for MODIS Collection 6 “Deep Blue” aerosol data. J. Geophys. Res. Atmos. 2013, 118, 7864–7872. [Google Scholar] [CrossRef]
- Tao, M.H.; Chen, L.F.; Wang, Z.F.; Tao, J.H.; Che, H.Z.; Wang, X.H.; Wang, Y. Comparison and evaluation of the MODIS Collection 6 aerosol data in China. J. Geophys. Res. Atmos. 2015, 120, 6992–7005. [Google Scholar] [CrossRef]
- Tian, X.P.; Liu, Q.; Li, X.H.; Wei, J. Validation and Comparison of MODIS C6.1 and C6 Aerosol Products over Beijing, China. Remote Sens.-Basel 2018, 10, 2021. [Google Scholar] [CrossRef]
- Smirnov, A.; Holben, B.N.; Eck, T.F.; Dubovik, O.; Slutsker, I. Cloud-screening and quality control algorithms for the AERONET database. Remote Sens. Environ. 2000, 73, 337–349. [Google Scholar] [CrossRef]
- Schaap, M.; Timmermans, R.M.A.; Koelemeijer, R.B.A.; de Leeuw, G.; Builtjes, P.J.H. Evaluation of MODIS aerosol optical thickness over Europe using sun photometer observations. Atmos. Environ. 2008, 42, 2187–2197. [Google Scholar] [CrossRef]
- Li, D.; Qin, K.; Wu, L.X.; Xu, J.; Letu, H.S.; Zou, B.; He, Q.; Li, Y.F. Evaluation of JAXA Himawari-8-AHI Level-3 Aerosol Products over Eastern China. Atmosphere-Basel 2019, 10, 215. [Google Scholar] [CrossRef]
- van Donkelaar, A.; Martin, R.V.; Brauer, M.; Boys, B.L. Use of Satellite Observations for Long-Term Exposure Assessment of Global Concentrations of Fine Particulate Matter. Environ. Health Persp. 2015, 123, 135–143. [Google Scholar] [CrossRef] [PubMed] [Green Version]
- Hubanks, P.A. MODIS Atmosphere QA Plan for Collection 005; NASA Goddard Space Flight Center: Greenbelt, MD, USA, 2005; Volume 57.
- Levy, R.C.; Mattoo, S.; Munchak, L.A.; Remer, L.A.; Sayer, A.M.; Patadia, F.; Hsu, N.C. The Collection 6 MODIS aerosol products over land and ocean. Atmos. Meas. Tech. 2013, 6, 2989–3034. [Google Scholar] [CrossRef] [Green Version]
- Gupta, P.; Levy, R.C.; Mattoo, S.; Remer, L.A.; Munchak, L.A. A surface reflectance scheme for retrieving aerosol optical depth over urban surfaces in MODIS Dark Target retrieval algorithm. Atmos. Meas. Tech. 2016, 9, 3293–3308. [Google Scholar] [CrossRef] [Green Version]
- Remer, L.A.; Kaufman, Y.J.; Tanre, D.; Mattoo, S.; Chu, D.A.; Martins, J.V.; Li, R.R.; Ichoku, C.; Levy, R.C.; Kleidman, R.G.; et al. The MODIS aerosol algorithm, products, and validation. J. Atmos. Sci. 2005, 62, 947–973. [Google Scholar] [CrossRef]
- Hsu, N.C.; Jeong, M.J.; Bettenhausen, C.; Sayer, A.M.; Hansell, R.; Seftor, C.S.; Huang, J.; Tsay, S.C. Enhanced Deep Blue aerosol retrieval algorithm: The second generation. J. Geophys. Res. Atmos. 2013, 118, 9296–9315. [Google Scholar] [CrossRef]
- Sayer, A.M.; Munchak, L.A.; Hsu, N.C.; Levy, R.C.; Bettenhausen, C.; Jeong, M.J. MODIS Collection 6 aerosol products: Comparison between Aqua’s e-Deep Blue, Dark Target, and “merged” data sets, and usage recommendations. J. Geophys. Res. Atmos. 2014, 119, 13965–13989. [Google Scholar] [CrossRef]
- Ichoku, C.; Chu, D.A.; Mattoo, S.; Kaufman, Y.J.; Remer, L.A.; Tanre, D.; Slutsker, I.; Holben, B.N. A spatio-temporal approach for global validation and analysis of MODIS aerosol products. Geophys. Res. Lett. 2002, 29. [Google Scholar] [CrossRef] [Green Version]
- Xie, Y.; Zhang, Y.; Xiong, X.X.; Qu, J.J.; Che, H.Z. Validation of MODIS aerosol optical depth product over China using CARSNET measurements. Atmos. Environ. 2011, 45, 5970–5978. [Google Scholar] [CrossRef]
- Bilal, M.; Nazeer, M.; Nichol, J.E.; Bleiweiss, M.P.; Qiu, Z.F.; Jakel, E.; Campbell, J.R.; Atique, L.; Huang, X.L.; Lolli, S. A Simplified and Robust Surface Reflectance Estimation Method (SREM) for Use over Diverse Land Surfaces Using Multi-Sensor Data. Remote Sens.-Basel 2019, 11, 1344. [Google Scholar] [CrossRef]
- Levy, R.C.; Remer, L.A.; Kleidman, R.G.; Mattoo, S.; Ichoku, C.; Kahn, R.; Eck, T.F. Global evaluation of the Collection 5 MODIS dark-target aerosol products over land. Atmos. Chem. Phys. 2010, 10, 10399–10420. [Google Scholar] [CrossRef] [Green Version]
- Mhawish, A.; Banerjee, T.; Broday, D.M.; Misra, A.; Tripathi, S.N. Evaluation of MODIS Collection 6 aerosol retrieval algorithms over Indo-Gangetic Plain: Implications of aerosols types and mass loading. Remote Sens. Environ. 2017, 201, 297–313. [Google Scholar] [CrossRef]
- van der Werf, G.R.; Randerson, J.T.; Giglio, L.; Collatz, G.J.; Mu, M.; Kasibhatla, P.S.; Morton, D.C.; DeFries, R.S.; Jin, Y.; van Leeuwen, T.T. Global fire emissions and the contribution of deforestation, savanna, forest, agricultural, and peat fires (1997-2009). Atmos. Chem. Phys. 2010, 10, 11707–11735. [Google Scholar] [CrossRef]
- Zhang, L.; Liao, H.; Li, J.P. Impacts of Asian summer monsoon on seasonal and interannual variations of aerosols over eastern China. J. Geophys. Res. Atmos. 2010, 115. [Google Scholar] [CrossRef] [Green Version]
Figure 1.
The geographical location of the study area. (a) The locations of the 23 AERONET sites are used for the evaluation of the satellite-based AOD products by circulars, and (b) the spatial distribution of all AERONET sites in the world. Background map is global annual average surface-level PM2.5 concentration derived from MODIS and MISR AOD satellite data sets (2001–2010) [32].

Figure 2.
Validation of MOD04 C6.1 DT (a), DB (b), and combined DT/DB (c) AOD retrievals at 10 km resolution against AERONET measurements for the years 2000–2016. The dashed lines = EE lines, black solid line = 1:1 line, and red solid line = regression line.
Figure 2.
Validation of MOD04 C6.1 DT (a), DB (b), and combined DT/DB (c) AOD retrievals at 10 km resolution against AERONET measurements for the years 2000–2016. The dashed lines = EE lines, black solid line = 1:1 line, and red solid line = regression line.

Figure 3.
The percentage within in (PWE), above (PAE) and below (PBE) the expected error for the DT (a), DB (b), and DT/DB (c) products in each AOD bin over heavy aerosol loading area for the years 2000–2016.
Figure 3.
The percentage within in (PWE), above (PAE) and below (PBE) the expected error for the DT (a), DB (b), and DT/DB (c) products in each AOD bin over heavy aerosol loading area for the years 2000–2016.

Figure 4.
The percentage within in (PWE), above (PAE) and below (PBE) the expected error and the number of collocations for the DT, DB and DT/DB products in the four seasons over heavy aerosol loading area for the years 2000–2016.
Figure 4.
The percentage within in (PWE), above (PAE) and below (PBE) the expected error and the number of collocations for the DT, DB and DT/DB products in the four seasons over heavy aerosol loading area for the years 2000–2016.

Figure 5.
Error statistics for DT, DB, and DT/DB products against AERONET AOD ground-observed measurements in the four seasons.
Figure 5.
Error statistics for DT, DB, and DT/DB products against AERONET AOD ground-observed measurements in the four seasons.

Figure 6.
The percentage within in (PWE), above (PAE) and below (PBE) the expected error and the number of collocations for the DT, DB and DT/DB products over different land cover types for the years 2000–2016.
Figure 6.
The percentage within in (PWE), above (PAE) and below (PBE) the expected error and the number of collocations for the DT, DB and DT/DB products over different land cover types for the years 2000–2016.

Figure 7.
Error statistics for DT, DB, and DT/DB products against AERONET AOD ground-observed measurements over different land cover types.
Figure 7.
Error statistics for DT, DB, and DT/DB products against AERONET AOD ground-observed measurements over different land cover types.


Table 1.
AErosol RObotic NETwork (AERONET) Level 2.0 data used in this study.
| Region | Country | AERONET Site | Lat/Lon | Land Cover Type | Time Period | Average AOD | Average Surface Reflectance (SR) |
|---|---|---|---|---|---|---|---|
| Asia | China | Beijing (BJS) | 39.977/116.381 | Urban | 2001–2016 | 0.610 | 0.088 |
| Beijing-CAMS (BJC) | 39.933/116.317 | Urban | 2012–2016 | 0.611 | 0.079 | ||
| Taihu (THS) | 31.421/120.215 | Barren or Sparsely Vegetated | 2005–2012 | 0.732 | 0.124 | ||
| Xianghe (XHS) | 39.754/116.962 | Cropland | 2001–2015 | 0.664 | 0.071 | ||
| Xinglong (XLS) | 40.396/117.578 | Mixed Forest | 2006–2012 | 0.271 | 0.037 | ||
| India | Gandhi_College (GCS) | 25.871/84.128 | Wetland | 2006–2015 | 0.623 | 0.085 | |
| Kanpur (KPR) | 26.513/80.232 | Wetland | 2001–2015 | 0.610 | 0.080 | ||
| Pakistan | Karachi (KRC) | 24.870/67.030 | Urban | 2006–2014 | 0.417 | 0.114 | |
| Lahore (LHR) | 31.542/74.325 | Urban | 2007–2015 | 0.629 | 0.110 | ||
| Middle East | United Arab Emirates | Dhabi (DHB) | 24.481/54.383 | Urban | 2003–2008 | 0.399 | 0.111 |
| Hamim (HMM) | 22.967/54.300 | Barren or Sparsely Vegetated | 2004–2007 | 0.318 | 0.144 | ||
| Masdar_Institute (MIS) | 24.442/54.617 | Barren or Sparsely Vegetated | 2012–2016 | 0.387 | 0.162 | ||
| Mezaira (MZR) | 23.145/53.779 | Barren or Sparsely Vegetated | 2004–2016 | 0.329 | 0.124 | ||
| Mussafa (MSF) | 24.372/54.467 | Barren or Sparsely Vegetated | 2004–2010 | 0.389 | 0.095 | ||
| Bahrain | Bahrain (BRN) | 26.208/50.609 | Urban | 2000–2006 | 0.401 | 0.112 | |
| Kuwait | Kuwait_University (KUS) | 29.325/47.971 | Urban | 2007–2010 | 0.585 | 0.148 | |
| Northern Africa | Egypt | El_Farafra (EFS) | 27.058/27.990 | Barren or Sparsely Vegetated | 2014–2016 | 0.181 | 0.209 |
| Cairo_EMA_2 (CES) | 30.081/31.290 | Urban | 2010–2014 | 0.355 | 0.089 | ||
| Niger | DMN_Maine_Soroa (DMS) | 13.217/12.023 | Barren or Sparsely Vegetated | 2005–2010 | 0.493 | 0.112 | |
| Zinder_Airport (ZAS) | 13.777/8.990 | Barren or Sparsely Vegetated | 2009–2016 | 0.536 | 0.101 | ||
| Benin | Djougou (DJG) | 9.760/1.599 | Savannas | 2004–2007 | 0.706 | 0.074 | |
| Mali | Agoufou (AGF) | 15.345/-1.479 | Barren or Sparsely Vegetated | 2003–2009 | 0.498 | 0.089 | |
| Nigeria | Ilorin (ILR) | 8.320/4.340 | Savannas | 2000–2016 | 0.758 | 0.114 |
Note: The SR is the surface reflectance at blue channel, the data source is MODIS surface reflectance products during 2010-2015; and the land cover type is from MODIS Land Cover product in 2013.
Table 2.
Statistical summary for validation of MOD04 DT AOD product.
| Region | Site | N | MR (%) | R | PBE (%) | PAE (%) | PWE (%) | RMSE | MAE | RMB | Equation of Linear Regression |
|---|---|---|---|---|---|---|---|---|---|---|---|
| Asia | BJS | 672 | 23.0 | 0.829 | 4.3 | 77.4 | 18.3 | 0.371 | 0.309 | 1.526 | y = 0.876x + 0.326 |
| BJC | 174 | 24.0 | 0.685 | 7.5 | 78.7 | 13.8 | 0.432 | 0.357 | 1.505 | y = 0.637x + 0.442 | |
| THS | 52 | 6.3 | 0.863 | 1.9 | 75.0 | 23.1 | 0.390 | 0.322 | 1.424 | y = 1.130x + 0.220 | |
| XHS | 917 | 40.8 | 0.927 | 6.9 | 27.3 | 65.8 | 0.247 | 0.145 | 1.106 | y = 1.040x + 0.037 | |
| XLS | 240 | 24.9 | 0.871 | 15.0 | 13.3 | 71.7 | 0.128 | 0.080 | 0.969 | y = 0.881x + 0.022 | |
| GCS | 558 | 51.7 | 0.821 | 11.1 | 24.4 | 64.5 | 0.192 | 0.132 | 1.071 | y = 0.965x + 0.064 | |
| KPR | 1245 | 48.3 | 0.809 | 3.2 | 42.8 | 54.0 | 0.239 | 0.163 | 1.212 | y = 1.040x + 0.099 | |
| KRC | - | - | - | - | - | - | - | - | - | - | |
| LHR | 676 | 57.0 | 0.798 | 4.0 | 65.4 | 30.6 | 0.315 | 0.248 | 1.389 | y = 1.140x + 0.140 | |
| All | 4534 | 32.5 | 0.845 | 6.0 | 46.1 | 47.9 | 0.278 | 0.195 | 1.247 | y = 0.990x + 0.141 | |
| Middle East | DHB | - | - | - | - | - | - | - | - | - | - |
| HMM | - | - | - | - | - | - | - | - | - | - | |
| MIS | - | - | - | - | - | - | - | - | - | - | |
| MZR | - | - | - | - | - | - | - | - | - | - | |
| MSF | - | - | - | - | - | - | - | - | - | - | |
| BRN | - | - | - | - | - | - | - | - | - | - | |
| KUS | - | - | - | - | - | - | - | - | - | - | |
| All | - | - | - | - | - | - | - | - | - | - | |
| Northern Africa | EFS | - | - | - | - | - | - | - | - | - | - |
| CES | 94 | 8.3 | 0.673 | 4.2 | 39.4 | 56.4 | 0.189 | 0.133 | 1.242 | y = 0.906x + 0.123 | |
| DMS | - | - | - | - | - | - | - | - | - | - | |
| ZAS | - | - | - | - | - | - | - | - | - | - | |
| DJG | 243 | 35.0 | 0.861 | 69.2 | 1.6 | 29.2 | 0.290 | 0.234 | 0.682 | y = 0.804x − 0.082 | |
| AGF | - | - | - | - | - | - | - | - | - | - | |
| ILR | 382 | 21.5 | 0.842 | 72.8 | 1.8 | 25.4 | 0.354 | 0.290 | 0.660 | y = 0.782x − 0.095 | |
| All | 719 | 8.6 | 0.811 | 62.6 | 6.7 | 30.7 | 0.316 | 0.250 | 0.708 | y = 0.725x − 0.012 | |
| All | 5253 | 19.0 | 0.804 | 13.7 | 40.7 | 45.6 | 0.284 | 0.202 | 1.158 | y = 0.915x + 0.138 | |
Note: N is the number of collections; MR is the matching ratio of the MODIS AOD product and the ground-observed data; R is the correlation coefficient between the MODIS AOD product and the ground-observed data; PWE is the percentage within the EE; PAE is the percentage above the EE; PBE is the percentage below the EE; RMSE is the root-mean-square error; MAE is mean absolute error, it is the ratio of the satellite mean to the AERONET mean; and RMB is relative mean bias.
Table 3.
Statistical summary for validation of MOD04 DB AOD product.
| Region | Site | N | MR (%) | R | PBE (%) | PAE (%) | PWE (%) | RMSE | MAE | RMB | Equation of Linear Regression |
|---|---|---|---|---|---|---|---|---|---|---|---|
| Asia | BJS | 2462 | 84.1 | 0.895 | 17.1 | 19.7 | 63.2 | 0.261 | 0.148 | 1.011 | y = 0.929x + 0.043 |
| BJC | 532 | 73.4 | 0.864 | 17.1 | 22.7 | 60.2 | 0.303 | 0.169 | 1.051 | y = 0.972x + 0.039 | |
| THS | 370 | 45.1 | 0.799 | 26.2 | 20.3 | 53.5 | 0.321 | 0.203 | 1.002 | y = 1.010x − 0.006 | |
| XHS | 1878 | 83.5 | 0.911 | 8.7 | 36.6 | 54.7 | 0.281 | 0.173 | 1.133 | y = 0.986x + 0.088 | |
| XLS | 562 | 58.4 | 0.796 | 20.4 | 13.9 | 65.7 | 0.169 | 0.098 | 0.933 | y = 0.798x + 0.034 | |
| GCS | 842 | 78.0 | 0.740 | 22.4 | 22.8 | 54.8 | 0.290 | 0.188 | 1.039 | y = 1.060x − 0.012 | |
| KPR | 1865 | 72.3 | 0.752 | 14.0 | 23.9 | 62.1 | 0.250 | 0.157 | 1.065 | y = 0.934x + 0.080 | |
| KRC | 836 | 59.4 | 0.603 | 55.2 | 5.9 | 38.9 | 0.227 | 0.169 | 0.672 | y = 0.462x + 0.087 | |
| LHR | 911 | 76.8 | 0.773 | 27.0 | 20.1 | 52.9 | 0.229 | 0.164 | 0.936 | y = 0.825x + 0.066 | |
| All | 10258 | 73.6 | 0.862 | 19.9 | 22.6 | 57.5 | 0.261 | 0.161 | 1.020 | y = 0.958x + 0.034 | |
| Middle East | DHB | 230 | 74.2 | 0.558 | 41.8 | 24.3 | 33.9 | 0.235 | 0.183 | 0.900 | y = 0.625x + 0.111 |
| HMM | 581 | 87.5 | 0.765 | 16.0 | 16.5 | 67.5 | 0.137 | 0.094 | 1.012 | y = 0.859x + 0.048 | |
| MIS | 670 | 70.5 | 0.506 | 34.6 | 28.2 | 37.2 | 0.238 | 0.178 | 0.969 | y = 0.542x + 0.170 | |
| MZR | 1274 | 86.4 | 0.800 | 11.6 | 34.0 | 54.4 | 0.158 | 0.114 | 1.156 | y = 0.957x + 0.065 | |
| MSF | 470 | 59.9 | 0.585 | 38.5 | 28.9 | 32.6 | 0.254 | 0.195 | 0.992 | y = 0.626x + 0.146 | |
| BRN | 193 | 30.9 | 0.626 | 44.6 | 17.1 | 38.3 | 0.231 | 0.177 | 0.809 | y = 0.555x + 0.106 | |
| KUS | 337 | 65.6 | 0.776 | 16.9 | 42.4 | 40.7 | 0.307 | 0.222 | 1.185 | y = 0.784x + 0.215 | |
| All | 3755 | 70.6 | 0.702 | 23.8 | 28.9 | 47.3 | 0.210 | 0.150 | 1.047 | y = 0.769x + 0.104 | |
| Northern Africa | EFS | 342 | 55.2 | 0.659 | 7.9 | 63.2 | 28.9 | 0.235 | 0.189 | 1.614 | y = 0.675x + 0.214 |
| CES | 934 | 82.8 | 0.651 | 29.3 | 26.2 | 44.5 | 0.180 | 0.137 | 0.951 | y = 0.604x + 0.120 | |
| DMS | 647 | 58.1 | 0.769 | 27.0 | 22.6 | 50.4 | 0.214 | 0.149 | 0.951 | y = 0.706x + 0.104 | |
| ZAS | 604 | 40.0 | 0.887 | 19.5 | 27.0 | 53.5 | 0.241 | 0.156 | 1.076 | y = 1.070x + 0.004 | |
| DJG | 395 | 56.8 | 0.839 | 40.8 | 9.6 | 49.6 | 0.257 | 0.185 | 0.846 | y = 0.807x + 0.027 | |
| AGF | 1089 | 72.4 | 0.812 | 20.5 | 27.2 | 52.3 | 0.285 | 0.172 | 1.065 | y = 0.968x + 0.047 | |
| ILR | 621 | 34.9 | 0.855 | 17.4 | 26.2 | 56.4 | 0.304 | 0.203 | 1.030 | y = 0.951x + 0.066 | |
| All | 4632 | 55.5 | 0.837 | 23.4 | 27.4 | 49.2 | 0.248 | 0.166 | 1.021 | y = 0.903x + 0.058 | |
| ALL | 18,645 | 67.5 | 0.847 | 21.6 | 25.0 | 53.4 | 0.248 | 0.160 | 1.025 | y = 0.931x + 0.047 | |
Table 4.
Statistical summary for validation of MOD04 DT/DB AOD product.
| Region | Site | N | MR (%) | R | PBE (%) | PAE (%) | PWE (%) | RMSE | MAE | RMB | Equation of Linear Regression |
|---|---|---|---|---|---|---|---|---|---|---|---|
| Asia | BJS | 1742 | 59.5 | 0.853 | 9.0 | 38.7 | 52.3 | 0.271 | 0.176 | 1.194 | y = 0.879x + 0.143 |
| BJC | 347 | 47.9 | 0.800 | 7.8 | 50.1 | 42.1 | 0.303 | 0.213 | 1.294 | y = 0.879x + 0.175 | |
| THS | 63 | 7.7 | 0.883 | 4.8 | 63.5 | 31.7 | 0.022 | 0.004 | 1.381 | y = 1.250x + 0.087 | |
| XHS | 1418 | 63.1 | 0.917 | 5.9 | 33.8 | 60.3 | 0.259 | 0.154 | 1.153 | y = 1.050x + 0.056 | |
| XLS | 314 | 32.6 | 0.879 | 16.9 | 11.8 | 71.3 | 0.121 | 0.077 | 0.945 | y = 0.889x + 0.013 | |
| GCS | 684 | 63.3 | 0.768 | 14.6 | 23.7 | 61.7 | 0.208 | 0.141 | 1.043 | y = 0.913x + 0.078 | |
| KPR | 1469 | 57.0 | 0.788 | 6.1 | 37.9 | 56.0 | 0.232 | 0.157 | 1.160 | y = 0.968x + 0.113 | |
| KRC | 285 | 20.3 | 0.603 | 48.1 | 4.2 | 47.7 | 0.189 | 0.134 | 0.679 | y = 0.335x + 0.124 | |
| LHR | 684 | 57.7 | 0.779 | 5.6 | 61.4 | 33.0 | 0.309 | 0.240 | 1.356 | y = 1.110x + 0.138 | |
| All | 7006 | 50.3 | 0.856 | 9.8 | 36.5 | 53.7 | 0.254 | 0.167 | 1.164 | y = 0.980x + 0.094 | |
| Middle East | DHB | - | - | - | - | - | - | - | - | - | - |
| HMM | 542 | 81.6 | 0.814 | 17.2 | 12.7 | 70.1 | 0.113 | 0.083 | 0.956 | y = 0.832x + 0.039 | |
| MIS | 30 | 3.2 | 0.521 | 36.7 | 20.0 | 43.3 | 0.167 | 0.137 | 0.885 | y = 0.687x + 0.072 | |
| MZR | 1149 | 78.0 | 0.821 | 11.9 | 31.2 | 56.9 | 0.144 | 0.105 | 1.126 | y = 0.947x + 0.057 | |
| MSF | - | - | - | - | - | - | - | - | - | - | |
| BRN | - | - | - | - | - | - | - | - | - | - | |
| KUS | 37 | 7.2 | 0.884 | 24.4 | 27.0 | 48.6 | 0.332 | 0.228 | 1.007 | y = 0.849x + 0.123 | |
| All | 1758 | 33.0 | 0.834 | 14.2 | 25.2 | 60.6 | 0.142 | 0.101 | 1.066 | y = 0.906x + 0.052 | |
| Northern Africa | EFS | 116 | 18.7 | 0.415 | 12.1 | 52.6 | 35.3 | 0.205 | 0.165 | 1.414 | y = 0.349x + 0.227 |
| CES | 337 | 39.9 | 0.672 | 32.6 | 22.6 | 44.8 | 0.167 | 0.127 | 0.940 | y = 0.808x + 0.043 | |
| DMS | 469 | 42.1 | 0.783 | 29.2 | 19.0 | 51.8 | 0.207 | 0.139 | 0.901 | y = 0.654x + 0.097 | |
| ZAS | 442 | 29.3 | 0.910 | 20.3 | 22.9 | 56.8 | 0.413 | 0.137 | 1.040 | y = 1.080x − 0.019 | |
| DJG | 267 | 38.4 | 0.872 | 63.7 | 2.6 | 33.7 | 0.278 | 0.221 | 0.710 | y = 0.800x − 0.061 | |
| AGF | 760 | 50.5 | 0.841 | 23.3 | 20.1 | 56.6 | 0.228 | 0.138 | 0.961 | y = 0.859x + 0.044 | |
| ILR | 382 | 21.5 | 0.842 | 72.8 | 1.8 | 25.4 | 0.354 | 0.290 | 0.660 | y = 0.782x − 0.095 | |
| All | 2773 | 33.2 | 0.823 | 35.2 | 17.8 | 47.0 | 0.243 | 0.167 | 0.870 | y = 0.784x + 0.041 | |
| ALL | 11,537 | 41.8 | 0.841 | 16.6 | 30.3 | 53.1 | 0.238 | 0.157 | 1.082 | y = 0.934x + 0.073 | |
© 2019 by the authors. Licensee MDPI, Basel, Switzerland. This article is an open access article distributed under the terms and conditions of the Creative Commons Attribution (CC BY) license (http://creativecommons.org/licenses/by/4.0/).
Share and Cite
MDPI and ACS Style
Tian, X.; Gao, Z. Validation and Accuracy Assessment of MODIS C6.1 Aerosol Products over the Heavy Aerosol Loading Area. Atmosphere 2019, 10, 548. https://0-doi-org.brum.beds.ac.uk/10.3390/atmos10090548
AMA Style
Tian X, Gao Z. Validation and Accuracy Assessment of MODIS C6.1 Aerosol Products over the Heavy Aerosol Loading Area. Atmosphere. 2019; 10(9):548. https://0-doi-org.brum.beds.ac.uk/10.3390/atmos10090548
Chicago/Turabian StyleTian, Xinpeng, and Zhiqiang Gao. 2019. "Validation and Accuracy Assessment of MODIS C6.1 Aerosol Products over the Heavy Aerosol Loading Area" Atmosphere 10, no. 9: 548. https://0-doi-org.brum.beds.ac.uk/10.3390/atmos10090548
Note that from the first issue of 2016, this journal uses article numbers instead of page numbers. See further details here.