Face Temperature as an Indicator of Thermal Stress in Outdoor Work Environments


Department of Landscape Architecture and Urban Planning, Texas A&M University, College Station, TX 77843, USA
*
Author to whom correspondence should be addressed.
Atmosphere 2020, 11(6), 627; https://0-doi-org.brum.beds.ac.uk/10.3390/atmos11060627
Submission received: 22 May 2020
/
Revised: 8 June 2020
/
Accepted: 11 June 2020
/
Published: 13 June 2020
(This article belongs to the Special Issue Multidisciplinary Studies on the Outdoor Thermo-Hygrometric Comfort and its Technological, Environmental and Social Applications)
Abstract
:The frequency and duration of heatwaves are steadily increasing as climate change becomes more serious. These changes particularly endanger the health of those who must work outdoors in hot environments. This study introduces a novel approach to monitor the heat-health of airport outdoor workers using infrared thermography. The faces of airport workers who were refueling airplanes in extreme heat conditions were monitored using a thermal infrared thermometer during their work cycle throughout the day. Changes in temperature on their exposed faces (e.g., the ear, cheek, chin) were monitored throughout the day over a two-month period. In every test, the subject’s face temperature increased, then suddenly dropped for a short time, and then continued increasing. Subjects were also asked to assess their thermal perception of the work each time they were tested throughout the study. They reported that they felt discomfort in terms of thermal comfort when the facial skin temperature went down temporarily before the temperature rose. These results show that the physical measurement criteria when outdoor workers’ thermal health is in jeopardy can be based on the results of facial skin temperature measurements.

1. Introduction
Climate change and changes in the physical environment of cities have significantly affected urban temperatures. Particularly during extreme heat event days in the summer, urban thermal environments rapidly deteriorate, and harm from heat stress has steadily increased each year [1]. Researchers and planners have attempted to improve thermal environments by understanding and modifying the characteristics of urban geometry within a city to reduce the harm to human lives. For example, building height and the distance between the buildings can be adjusted to facilitate air circulation or to regulate the amount of solar radiation [2]. Alternatively, it is possible to designate and provide thermally pleasant places for people by analyzing changes in building shadows throughout the day. In addition, a cooling effect can be created by planting trees on the street, or installing an artificial sunshade device to provide a shaded place [3]. As such, researchers and city planners have been researching and applying various methods to increase the thermal comfort of pedestrians in the city or those who do outdoor activities.
In addition to understanding a city’s thermal environment, planners need to consider airports because they need a different approach. Even if the airport is located outside the city, the functional characteristics create environmental characteristics that are different from the surrounding conditions and are unique to the airport [4]. For example, there are no tall buildings except for the control tower, and no trees to provide shade. The primary materials in this outdoor environment are asphalt and concrete. Since these pavement materials emit excessive terrestrial radiation, the thermal environment airport workers experience while working is different from that of the city center, and the results can lead to severe and inevitable harm [5]. In particular, outdoor airport workers suffer since they often perform high-intensity work in a short period of time [6]. Most of the tasks, such as refueling aircraft, loading, and unloading luggage, and aircraft inspections, are typical outdoor duties [5].
In the summer, airport workers in the airport’s outdoor working environment are exposed to higher heat stress levels than outdoor workers in the city. In addition to the intensity of airport tasks that must be completed in a short time, the damage caused by terrestrial radiation is considerable due to the exposed asphalt or concrete (tarmac) without shade devices that would help workers avoid direct solar and terrestrial radiation [5]. This deadly working environment can threaten the lives of workers. Although several studies have shown that a suitable heat-related work environment has a high correlation with worker safety as well as labor efficiency [7], few studies have focused on heat conditions of outdoor airport workers. Although several studies have examined the safety of the working environment of outdoor airport workers, most of the research has focused on guidelines and utility to ensure their physical safety [8]. Therefore, more research on the heat-related working environment of airport workers is still needed [9]. Since in hot climates, outdoor airport workers are regularly exposed to heat stress, studies have frequently examined their stress [5]. However, few studies have examined the thermal environment and safety of airport workers in more general climate areas.
To improve the working conditions to protect workers from extreme heat, some researchers have proposed using a cooling vest as protective gear and have verified a limited effect [6]. However, even if appropriate protective gear is provided, it is essential to monitor their health status in real-time because airport field workers must perform high-strength work in a short period of time. Establishing a thermally safe working environment for outdoor airport workers and monitoring changes in their health during their work is one of the most critical tasks to ensure safety. To monitor the thermal comfort level of workers, an effective method is to continuously monitor and measure body temperature as an indicator. To this end, it is necessary to establish effective methods and standards for continuously monitoring body temperature.
Theoretically, core body temperature is one of the most accurate body temperature indices, but a continuous measurement is difficult to observe for real-time monitoring, and the measurement method has a complicated disadvantage [10]. Measuring the core temperature of a person can provide evidence of heat health: A core temperature of approximately 37 °C is considered healthy, a core temperature of 38 °C to 39 °C can imply heat exhaustion, and a core temperature of 40 °C or above puts a person in extreme danger of heat stroke [11]. However, measuring core temperature is invasive and difficult, particularly under working conditions. Thus, it is important to find a surrogate for core temperature that can be measured unobtrusively and remotely to indicate a person’s heat health. Studies examining human thermal comfort typically use a questionnaire to ask subjects about their comfort/discomfort level [12]. However, this is an impractical method in an environment where workers are constantly moving and have to pay careful attention to their work. Therefore, the primary method for this study was measuring facial skin temperature using a thermal imaging camera.
Infrared thermography has been used to estimate the heat stress on individuals in indoor environments, but this technique has rarely been used in outdoor conditions. Briggs et al. [13] measured the faces of people in outdoor environments during cold and windy conditions, but their studies were not conducted in hot environments. In terms of where to take the temperature on the face, Ghahramani et al. [14] used infrared thermography to monitor the faces of individuals and found that different areas of the face responded differently to heat than to cold conditions. Aryal et al. [15] used temple skin temperatures to estimate the level of fatigue in construction workers undertaking heavy work in indoor environments. Li et al. [16] found that ear, nose and cheek temperatures correlated best with indoor thermal comfort levels. Ghahramani et al. [17] also used infrared thermography to monitor the face temperatures of 10 subjects in indoor environments and used the results to develop a predictive model. The results of these previous studies guide the methods used in this study.
In terms of individual environments, airports have unique functional characteristics. Outdoor airport workers, especially those working in areas adjacent to runways, are often vulnerable to extreme heat [5]. Thus, it is necessary to improve the outdoor working environment in terms of thermal comfort of these airport workers who are regularly exposed to extreme heat environments.
Outdoor thermal comfort can be calculated based on the microclimate data collected using a portable weather station [18,19]. In this process, various models can be used to estimate the thermal comfort that humans feel at certain times and places [20]. This estimation method is also a widely utilized heat stress research method. This study aimed to confirm the effectiveness of using facial skin temperature measurements as an indicator using a thermal imaging camera to monitor the health and safety of outdoor airport workers who are vulnerable to extreme thermal environments. In addition, the goal was to determine the correlation between facial skin temperature obtained through thermal imaging camera images by calculating the workers’ thermal comfort using COMFA, which is a human thermal comfort index [21].
2. Materials and Methods
2.1. Study Site and Characteristics
The study was conducted at Easterwood Airport in College Station, Texas. This site was selected as a suitable location due to the local climate, airport urban form, and high occupation exposure to climatic variables that could lead to heat stress illness. The city of College Station is located within the humid subtropical climate zone, which normally experiences hot and humid summers [22]. The physical characteristics of the site generate a local heat island. The landscape within the airfield is largely comprised of flat, open expanses of paved concrete and grass with a small water retention pond surrounded by a thin vegetative buffer. The extent of impervious land within the airfield is mostly exposed paved concrete with several buildings situated at multiple sites.
The outdoor thermal comfort assessment was conducted during the hottest summer months of July and August in 2018. The daily ramp operations on the airfield involve ground service providers and employees, known as line service technicians (LST), whose daily jobs include quickly fueling commercial aircraft before their scheduled departure. All 14 airport LSTs at Easterwood Airport were enrolled in the study and there were 12 test days in the two-month period. Table 1 details the demographic data collected for each participant. To safely monitor real-time aircraft fueling, the procedure design of the tests required minimal interruption of normal airport operations. The same procedure was followed for each test. The procedure dates were chosen at random and participants were generally unaware that they had been selected for the procedure on any given day.
Each participant wore a standard line service technician uniform designed to meet aviation safety standards, which generally included the following items for:
- ○
- Head and extremities: Hat, protective eyewear and gloves.
- ○
- Torso: loose Fitting, highly reflective shirt.
- ○
- Lower body: Dark pants/shorts and work boots.
Each day, between 15:00 and 16:00 central standard time, one commercial aircraft was scheduled to arrive at Easterwood Airport for passenger exchange and fuel services. Fuel service requests were dispatched to a shared LST radio frequency. The responsible LST operator located the parked fuel truck, drove the fuel truck with no air conditioning around the perimeter road of the airport toward the commercial terminal, then fueled the aircraft, returned via the perimeter road, and finally parked the fuel truck in its original location. However, if there were additional aircraft on the ramp requesting fuel after refueling the commercial aircraft, then the procedure continued until the LST had completed all outstanding orders for fuel.
2.2. Data Collection
At the time of the study (July and August 2018), all 14 LSTs at Easterwood Airport registered to participate, but only 12 LSTs participated in the study. We conducted 12 days of observations and measurements for each of the 12 LSTs. One person per day was observed and measurements for the procedures were taken during working hours. Thus, the total observations and measurements for this study included 12 full procedures (i.e., one person per day over 12 days). The observations were frequently not continuous, or the observation process had to stop, so the observer did not interfere with the LSTs’ work. As a result, continuous data were often missing. Five of the twelve procedures obtained accurate and continuous data that could be utilized for the analysis and produce meaningful results. After analyzing the changes in the skin temperature of the last five participants and the outdoor thermal comfort of the five days during the measurement procedures, we selected three days to compare and schematize the trends of distinct changes (i.e., warm, hot, extremely hot).
For the 12 procedures, data collection included site-level meteorological measurements, field observations, and infrared thermography. A FLIR E5 thermal infrared camera was used to collect thermal images at 5-min intervals measuring skin temperature on several points on the face [23]. Each participant provided verbal feedback every 15 min to identify their perceived thermal sensation using thermal comfort-level indicators (Table 2). Local airport meteorological conditions were collected onsite using a Kestrel 5400 Heat Stress Tracker and by monitoring the airfield’s local weather station [24]. The Kestrel instrument collected air temperature, relative humidity, and wind speed data at 10-s intervals while the local station reported meteorological conditions hourly. Table 3 lists the instruments and the types of data collected. For both the FLIR E5 and Kestrel 5400, the accuracy of the data collected depended on the use of a radiation shield. The face of each participant was shaded when the measurements were taken and the Kestrel 5400 remained in a shaded area while collecting meteorological data.
The step-by-step procedure was as follows. After the commercial aircraft arrived, the investigator entered the airport property from a private entrance out of view of the LSTs. In close proximity to the initial/ending thermal image location, the Kestrel 5400 was fixed on a tripod 1.5 m above the pavement to collect onsite microclimate data for an extended period of time before, during, and after the procedure. The essential microclimate variables were collected, including air temperature (°C), relative humidity (%), and wind speed (m/s) (Table 3). These variables were also collected through the airfield’s weather station for comparison and accuracy.
At the start of each procedure before the participant entered the fuel truck, an initial baseline thermal image was taken of the face profile (Figure 1) followed by an image of the face front. This two-image sequence was repeated every 5 min. Identical to the initial image sequence, an ending image sequence was captured when the procedure was complete. In addition to collecting the images, outdoor thermal comfort-level indicators and the corresponding verbal anchors were collected at 15-minute intervals. Each participant was also asked to describe how they currently felt on a scale from “warm” to “extremely hot” (Table 2) and, when applicable, they were asked to reflect on their previous reported comfort level to gauge if there was a difference in perception. Before the study began, each participant had an opportunity to review the perceived comfort-level indicators and they could ask to review the indicator information at any point during the study period.
2.3. Data Analysis Methods
Data collected during the study was reviewed using FLIR Tools, a software package designed to analyze thermal images using several temperature measurement tools. Each thermal image underwent a five-point facial analysis. On the face profile, a measurement tool seeking the maximum, minimum, and average skin temperature was used to track a temporal change of five points on the subject’s the ear, cheek, nose, chin, and temple. These five points were recorded for each image taken during the procedure and ultimately resulted in a temporal plot where changes in skin temperature could be analyzed over time.
Airport microclimate conditions were analyzed using the COMFA energy budget model, which is designed to estimate an individual’s thermal comfort level under dynamic microclimate conditions. For each procedure, the recorded air temperature, relative humidity, and wind speed were entered in the comfort model to calculate the individual’s energy budget. Participants’ clothing was always the same, as regulated by the airport’s safety standards. Therefore, rco (insulation value) = 50 (s/m) and P (permeability of clothing ensemble) = 175, the variables for the clothing conditions used in the COMFA model, were applied to calculate the energy budget [12], reflecting their work-regulated clothing (i.e., t-shirt, short pants, socks, running shoes). The results were interpreted based on Harlan, Brazel, Prashad, Stefanov, and Larsen [25].
Brown and Gillespie [21] developed the COMFA model to explain human energy balance based on four factors: Perspiration rate, energy budget, core body temperature, and skin temperature. Since it was initially developed, the current COMFA model has been modified, supplemented, and verified over time. People’s thermal sensation while performing intense metabolic activity can be calculated more accurately using this model. Their energy budget calculated by the COMFA model is expressed according to five thermal scale ranges (Table 4).
3. Results
Air temperature measurements during the tests ranged from 30.1 °C to 39.8 °C over time with the highest temperatures occurring from late July through August. Relative humidity during the study ranged from 24.8% to 58.9% (Table 5). A total of 12 procedures were conducted ranging in duration from 15 min to 85 min (Table 6).
The lowest recorded skin temperature was 25.6 °C and the highest was 40.3 °C. Each participant’s recorded skin temperature increased until it reached a relatively stable threshold for a duration of 15 min to 20 min. This threshold was typically followed by a 5-min cooling period and then a 5-min heating period before returning to another stabilization threshold. Figure 2 illustrates the three levels of warm (July 25), hot (August 1), and extremely hot (July 23) days, which show distinct facial heating patterns among the five thermal comfort perception indicators identified in Table 2. The mid-test drops in skin temperatures on hot and extremely hot days were often accompanied by participants feeling “extremely hot,” followed by requests to briefly suspend their procedure to properly rehydrate or cool off. On warm days, the drop in face temperature occurred more quickly than on hot and extremely hot days.
Individuals only reported “extremely hot” thermal discomfort on August 1, August 9, and August 10. During the August 10 procedure, the second longest duration (57 min), the participant displayed poor decision-making while navigating the fuel truck around the busy airfield. This error was followed by an expressed lowered confidence in his ability to continue the required tasks. His mental clarity and judgement appeared to diminish over the course of the procedure.
The collected data for July 23 and July 25 stopped at 25 min and 20 min, respectively. Nevertheless, the data from these two measurement dates were used to compare results with the August 1 data because the collected data were relatively high quality. In addition, these data were meaningful in explaining the trend of changes in skin temperature just before the skin temperature dropped sharply after 20 min as shown in the August 1 data. Thus, the data were used for analysis despite the timeframe differences.
4. Discussion
The temperature of the faces of adult men working in hot outdoor conditions at an airport were measured at five different points every five minutes using a thermal infrared camera. All five points on the face (i.e., ear, cheek, nose, chin, and temple) heated and cooled at approximately the same rate. Subjects were too warm or too hot most of the time, but occasionally subjects reported that they were much too hot and wanted to go inside to cool down. As expected, their facial temperature heated up over time, but unexpectedly, after about 15 min to 20 min of heating up, the facial temperature dropped dramatically. After a brief cooling time, the facial temperature rebounded and continued to increase in temperature. This drop in facial temperature often coincided with the subjects reporting that they were much too hot and would like to stop working and go inside. This result suggests an unobtrusive measure of the point where a person’s heat health is in jeopardy.
This study has some limitations that offer opportunities for further study. The experimental design could have ensured that all enrolled subjects participated in all procedures. Procedure days were chosen at random throughout the study period, but the procedure began at the same time each of those days. Thus, only individuals who worked during that time were available to participate. In addition, conditions were only recorded inside the cab of the vehicle before and after each procedure. The level of fatigue prior to each procedure was not measured and ranged from some participants beginning the procedure from a cool, relaxed environment while others began the procedure already somewhat fatigued from work.
Through careful modification of the microclimate, design strategies may be implemented to lower an individual’s energy budget from dangerous to more stable levels of acclimated comfort. Since the modification of air temperature and relative humidity is not practical at the microclimate scale [21], a future design that enhances the outdoor thermal environment must focus on the remaining components that impact an individual’s thermal comfort in summer outdoor conditions–solar and terrestrial radiation [26].
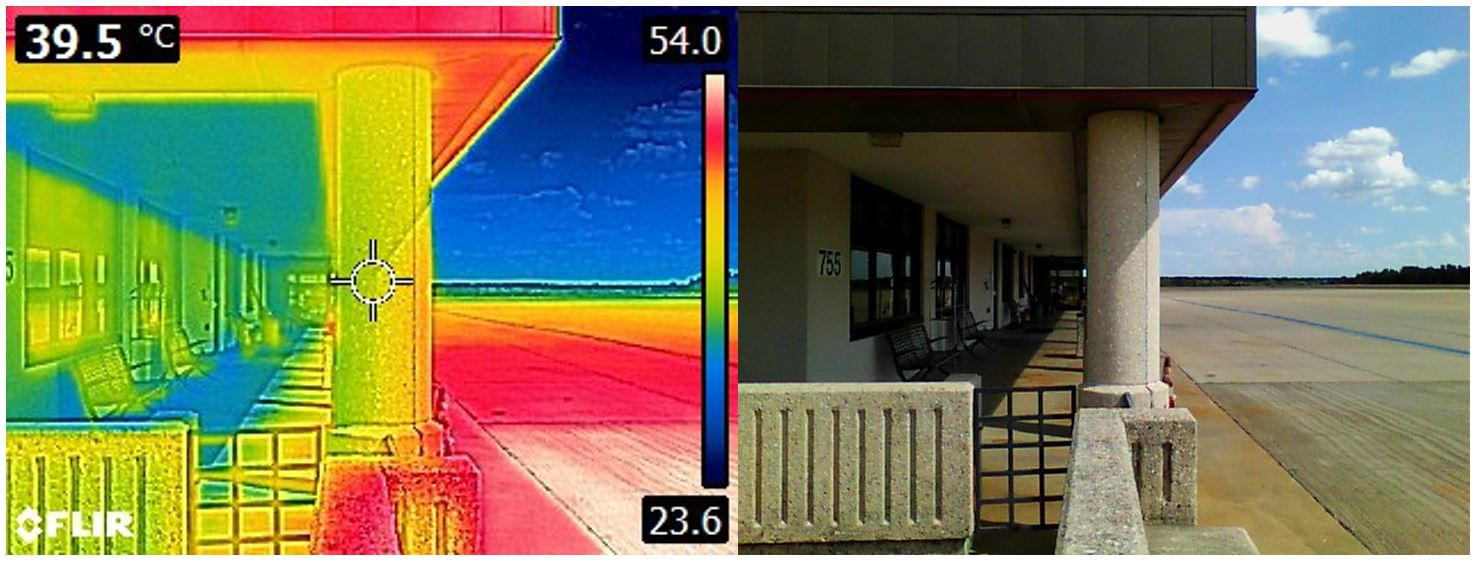
The COMFA model was used to estimate how a reduction in the amount of incoming solar and terrestrial radiation might lower an outdoor airport worker’s energy budget surplus and their risk of experiencing heat-related illness. Figure 3 depicts an existing ramp setting where microclimate conditions greatly influence the daily thermal comfort of airport line service technicians. This image, taken on August 20, highlights the thermal properties of the surrounding surfaces and depicts the levels of incoming energy that ultimately creates a stressful thermal environment for the individual. The COMFA energy budget for these conditions was 275 W/m2, which is considered dangerously hot. Another building at the airport had a shaded verandah (Figure 4) and the COMFA energy budget for this location at the same time was 133 W/m2, which would be considered thermally comfortable. This suggests that an appropriate design of outdoor environments can provide thermally safe working conditions even on extremely hot days.
Due to the size of regional airports that operate only domestic flights, the number of flights operated per day is small, and flights are frequently canceled due to weather. In addition, relatively few workers are employed at this airport, limiting the number of workers that could be monitored. In the course of the procedures during the participants’ work, there were numerous situations in which the researchers were careful not to interfere with the participants’ work, which was usually when the work had to be completed quickly. As a result, the continuity of observations and skin temperature measurements of LSTs was interrupted, or the measurement had to be stopped en route. These situations often resulted in missing or poor-quality data being utilized for analyses. However, there were limits to the difficulty of remeasurement due to the study site and participants’ work schedules.
In this study, due to the small number of participants and measurements, descriptive statistics were used to explain the results of the analysis [13]. In addition, airports are classified as security facilities, and even when researchers receive permission for research activities, there are limited opportunities for public access to the runway. The functional specificity of airports also limits the monitoring period, time, and number of target workers for data collection. Whereas these conditions limit the generalizability of the results, this study has value as a preliminary study that can be utilized before starting a study on the working environment related to the thermal comfort of outdoor laborers working at large airports.
A significant labor characteristic of outdoor airport workers is the high intensity work compared to other occupational groups. For that reason, the 14 LSTs who first accepted and registered to participate in the study were all men in their 20s and 30s. In this study, the five selected men were in their 20s. The pattern of temperature changes in the body may be different for men versus women due to physical characteristics. Notably, the skin temperature changes noted in this study may be different for men than for women. Thus, the results did not reflect the various age and gender ratios of the total number of people who could participate in this type of study [6]. To understand the thermal comfort of their working environment, as well as that of outdoor workers at airports, further research is needed to observe and measure the different kinds of outdoor labor occupational groups [7,27]. In addition, if various gender and age groups are reflected in the composition of research participants, researchers can better analyze and understand the heat stress experienced by outdoor workers during extreme heat event days.
Another restriction in this study is that thermal imaging cameras have limitations in monitoring workers at a distance. As in this study, if the monitoring is performed at a close distance within 2–3 m, relatively accurate facial skin temperature information can be obtained, but as the distance increases, the resolution of the image decreases, so the accuracy of the information is inevitably lowered. For example, when observing workers in a monitoring room located at a distance from the work site, it may be challenging to obtain accurate thermal image information [28]. Therefore, if both the thermal imaging camera and sensors attached to each part of the human body are used simultaneously, it is possible to accurately calculate the thermal comfort of an operator based on body temperature information obtained by various measurement methods measured at more points [29]. However, wearable devices used in some studies are extremely limited, and in most cases, it is impossible to measure body temperature accurately due to sweat resistance. Some researchers have developed an attached bio-signal detection device that complements elasticity and water resistance, such as a band-aid [30]. In future studies, if these devices are used in parallel with a thermal imaging camera, a more accurate process for monitoring the thermal comfort of outdoor workers may be possible.
5. Conclusions
This study demonstrated that outdoor thermal stress levels could be adequately analyzed using noninvasive infrared thermography in an airport urban landscape. In addition, these methods of collecting environmental and physiological variables can occur with minimal intervention to the occupational process. Future research focusing on reducing human heat stress illness in an urban environment should expand on the methods employed in this study. Landscape architects and urban planners can use the methods outlined in this study to test the effectiveness of proposed design strategies in increasing the heat safety of outdoor workers.
Author Contributions
Conceptualization, S.H. and R.D.B.; methodology, S.H.; validation, S.H.; formal analysis, S.H.; investigation, S.H.; resources, S.H. and S.W.K.; data curation, S.H.; writing—original draft preparation, S.H. and S.W.K.; writing—review and editing, S.W.K.; visualization, S.H. and S.W.K; supervision, R.D.B.; project administration, S.W.K.; All authors have read and agreed to the published version of the manuscript.
Funding
This research received no external funding.
Conflicts of Interest
The authors declare that they have no conflict of interest.
Disclaim
All procedures performed in studies involving human participants were in accordance with the ethical standards of the institutional and/or national research committee (TAMU Institutional Review Board 078286) and with the 1964 Helsinki declaration and its later amendments or comparable ethical standards. Informed consent was obtained from all participants included in the study. Additional informed consent was obtained from all individual participants for whom identifying information is included in this article.
References
- Stone, J.B. The City and the Coming Climate: Climate Change in the Places We Live; Cambridge University Press: Cambridge, UK, 2012. [Google Scholar] [CrossRef]
- Stone, B.; Hess, J.J.; Frumkin, H. Urban form and extreme heat events: Are sprawling cities more vulnerable to climate change than compact cities? Environ. Health Perspect. 2010, 118, 1425–1428. [Google Scholar] [CrossRef] [Green Version]
- Mazhar, N.; Brown, R.D.; Kenny, N.; Lenzholzer, S. Thermal comfort of outdoor spaces in Lahore, Pakistan: Lessons for bioclimatic urban design in the context of global climate change. Landsc. Urban Plan. 2015, 138, 110–117. [Google Scholar] [CrossRef]
- Freestone, R. Planning, sustainability and airport-led urban development. Int. Plan. Stud. 2009, 14, 161–176. [Google Scholar] [CrossRef]
- Noweir, M.H.; Bafail, A.O. Study of summer heat exposure at the ground services operations of a main international airport in Saudi Arabia. Environ. Monit. Assess. 2008, 145, 103–111. [Google Scholar] [CrossRef] [PubMed]
- Chan, A.P.C.; Yang, Y.; Yam, M.C.H.; Lam, E.W.M.; Hu, J.Y. Factors affecting airport apron workers’ preference on cooling vests. Perform. Enhanc. Health 2016, 5, 17–23. [Google Scholar] [CrossRef]
- Venugopal, V.; Chinnadurai, J.S.; Lucas, R.A.I.; Kjellstrom, T. Occupational heat stress profiles in selected workplaces in India. Int. J. Environ. Res. Public Health 2016, 13, 89. [Google Scholar] [CrossRef] [PubMed] [Green Version]
- Landry, J.; Ingolia, S.; Transportation Research Board; Airport Cooperative Research Program; United States Fastpitch Association Ramp Safety Practices Administration. Ramp Safety Practices; Transportation Research Board: Washington, DC, USA, 2011. [Google Scholar]
- Tarui, H.; Kanamaru, Y.; Sakagami, J.; Ozaki, H. Physiological effects of heat stress on ground crew in the Japan Air Self-Defense Force. In Elsevier Ergonomics Book Series; Tochihara, Y., Ohnaka, T., Eds.; Elsevier: Amsterdam, The Netherlands, 2005; Volume 3, pp. 55–60. [Google Scholar]
- Cosma, A.C.; Simha, R. Using the contrast within a single face heat map to assess personal thermal comfort. Build. Environ. 2019, 160, 106163. [Google Scholar] [CrossRef]
- Bouchama, A.; Knochel, J.P. Heat stroke. N. Engl. J. Med. 2002, 346, 1978–1988. [Google Scholar] [CrossRef] [PubMed]
- Brown, R.D.; Gillespie, T.J.; Gillespie, T.J. Microclimatic Landscape Design: Creating Thermal Comfort and Energy Efficiency; Wiley: Hoboken, NJ, USA, 1995. [Google Scholar]
- Briggs, A.G.S.; Gillespie, T.J.; Brown, R.D. Measuring facial cooling in outdoor windy winter conditions: An exploratory study. Int. J. Biometeorol. 2017, 61, 1831–1835. [Google Scholar] [CrossRef] [PubMed]
- Ghahramani, A.; Castro, G.; Becerik-Gerber, B.; Yu, X. Infrared thermography of human face for monitoring thermoregulation performance and estimating personal thermal comfort. Build. Environ. 2016, 109, 1–11. [Google Scholar] [CrossRef] [Green Version]
- Aryal, A.; Ghahramani, A.; Becerik-Gerber, B. Monitoring fatigue in construction workers using physiological measurements. Autom. Constr. 2017, 82, 154–165. [Google Scholar] [CrossRef]
- Li, D.; Menassa, C.C.; Kamat, V.R. Non-intrusive interpretation of human thermal comfort through analysis of facial infrared thermography. Energy Build. 2018, 176, 246–261. [Google Scholar] [CrossRef]
- Ghahramani, A.; Castro, G.; Karvigh, S.A.; Becerik-Gerber, B. Towards unsupervised learning of thermal comfort using infrared thermography. Appl. Energy 2018, 211, 41–49. [Google Scholar] [CrossRef] [Green Version]
- Herdt, A.J.; Brown, R.D.; Scott-Fleming, I.; Cao, G.; MacDonald, M.; Henderson, D.; Vanos, J.K. Outdoor thermal comfort during anomalous heat at the 2015 Pan American Games in Toronto, Canada. Atmosphere 2018, 9, 321. [Google Scholar] [CrossRef] [Green Version]
- Yao, R.; Luo, Q.; Luo, Z.; Jiang, L.; Yang, Y. An integrated study of urban microclimates in Chongqing, China: Historical weather data, transverse measurement and numerical simulation. Sustain. Cities Soc. 2015, 14, 187–199. [Google Scholar] [CrossRef] [Green Version]
- Coccolo, S.; Kämpf, J.; Scartezzini, J.-L.; Pearlmutter, D. Outdoor human comfort and thermal stress: A comprehensive review on models and standards. Urban Clim. 2016, 18, 33–57. [Google Scholar] [CrossRef]
- Brown, R.D.; Gillespie, T.J. Estimating outdoor thermal comfort using a cylindrical radiation thermometer and an energy budget model. Int. J. Biometeorol. 1986, 30, 43–52. [Google Scholar] [CrossRef]
- Peel, M.C.; Finlayson, B.L.; McMahon, T.A. Updated world map of the Köppen-Geiger climate classification. Hydrol. Earth Syst. Sci. 2007, 11, 1633–1644. [Google Scholar] [CrossRef] [Green Version]
- FLIR Systems. User’s Manual FLIR Ex Series; FLIR Systems, Inc.: Wilsonville, OR, USA, 2019. [Google Scholar]
- NIELSEN-KELLERMAN. User Guide Kestrel 5400 Heat Stress Tracker; NIELSEN-KELLERMAN: Boothwyn, PA, USA, 2018. [Google Scholar]
- Harlan, S.L.; Brazel, A.J.; Prashad, L.; Stefanov, W.L.; Larsen, L. Neighborhood microclimates and vulnerability to heat stress. Soc. Sci. Med. 2006, 63, 2847–2863. [Google Scholar] [CrossRef]
- Brown, R.D. Design With Microclimate: The Secret to Comfortable Outdoor Space; Island Press: Washington, DC, USA, 2010. [Google Scholar]
- Jay, O.; Kenny, G.P. Heat exposure in the Canadian workplace. Am. J. Ind. Med. 2010, 53, 842–853. [Google Scholar] [CrossRef]
- Gade, R.; Moeslund, T.B. Thermal cameras and applications: A survey. Mach. Vis. Appl. 2014, 25, 245–262. [Google Scholar] [CrossRef] [Green Version]
- Naqi, M.; Lee, S.; Kwon, H.-J.; Lee, M.G.; Kim, M.; Kim, T.W.; Shin, H.K.; Kang, S.; Gandla, S.; Lee, H.-S.; et al. A fully integrated flexible heterogeneous temperature and humidity sensor-based occupancy detection device for smart office applications. Adv. Mater. Technol. 2019, 4, 1900619. [Google Scholar] [CrossRef]
- Lee, S.; Gandla, S.; Naqi, M.; Jung, U.; Kang, S.; Youn, H.S.; Pyun, D.G.; Lee, Y.; Kwon, H.; Kim, H.; et al. All-day mobile healthcare monitoring system based on heterogeneous stretchable sensors for medical emergency. IEEE Trans. Ind. Electron. 2019. [Google Scholar] [CrossRef]
Figure 1.
Example of thermal image of a participant’s face profile.

Figure 2.
(a) Facial heat pattern. Illustrations show average facial skin temperatures collected during warm, hot, and extremely hot days. (b) warm (July 25), (c) hot (August 1), and (d) extremely hot (July 23) conditions and verbal comfort feedback.
Figure 2.
(a) Facial heat pattern. Illustrations show average facial skin temperatures collected during warm, hot, and extremely hot days. (b) warm (July 25), (c) hot (August 1), and (d) extremely hot (July 23) conditions and verbal comfort feedback.


Figure 3.
Current ramp setting for daily operations with surface thermal properties. COMFA Energy Budget = +275 W/m2 (person would prefer to be much cooler and is in danger of heat stress).
Figure 3.
Current ramp setting for daily operations with surface thermal properties. COMFA Energy Budget = +275 W/m2 (person would prefer to be much cooler and is in danger of heat stress).

Figure 4.
Airport building with shaded verandah and surface thermal properties. COMFA Energy Budget = +133 W/m2 (thermally comfortable and safe).
Figure 4.
Airport building with shaded verandah and surface thermal properties. COMFA Energy Budget = +133 W/m2 (thermally comfortable and safe).


Table 1.
Participant demographic data collected.
| ID | Age | Height (m) | Weight (kg) |
|---|---|---|---|
| CG | 22 | 2.01 | 95 |
| DC | 29 | 1.91 | 82 |
| DM | 25 | 1.85 | 95 |
| MC | 28 | 1.75 | 79 |
| KS | 27 | 1.78 | 100 |
Table 2.
Perceived thermal comfort-level indicators [25].
Table 2.
Perceived thermal comfort-level indicators [25].
| Level of Comfort | |
|---|---|
| Warm | I am close to sweating; I am heating up |
| Uncomfortably warm | I am beginning to sweat, but I can continue |
| Hot | I am sweating, but I can continue |
| Uncomfortably hot | I am uncomfortably sweating; I am pushing myself to continue |
| Extremely hot | I am uncomfortably sweating; I would like go inside to rest |
| Instrument | Parameter | Frequency | Model | Accuracy |
|---|---|---|---|---|
| Infrared Camera | Skin Temperature | 5 min | FLIR E5 | 2 |
| Thermometer | Air Temperature | 10 s | Kestrel 5400 | 0.5 |
| Hygrometer | Relative Humidity | 10 s | Kestrel 5400 | 2% |
| Anemometer | Wind Speed | 10 s | Kestrel 5400 | 0.4 m/s |
Table 4.
Translation of energy budget values into people’s thermal comfort level [12].
Table 4.
Translation of energy budget values into people’s thermal comfort level [12].
| Budget (W/m2) | Interpretation |
|---|---|
| Budget < −150 | Would prefer to be much warmer |
| −150 < Budget < −50 | Would prefer to be warmer |
| −50 < Budget < 50 | Would prefer no change |
| 50 < Budget < 150 | Would prefer to be cooler |
| 150 < Budget | Would prefer to be much cooler |
Table 5.
Recorded meteorological data collected. Column labeled Ta is the air temperature (°C); Column Wind is the recorded wind speed (m/s); Column RH is the relative humidity %; Column COMFA represents the calculated energy budget (W/m2) for a person during the procedure. All conditions in the study ranged from 201 W/m2 to 339 W/m2, a level that Harlan, Brazel, Prashad, Stefanov, and Larsen [25] identified as being in danger of heat stress.
| Procedure Date | Ta (°C) | Wind (m/s) | RH (%) | COMFA (W/m2) |
|---|---|---|---|---|
| 10 July | 34.6 | 1.24 | 45 | 250 |
| 11 July | 30.1 | 1.96 | 58.2 | 217 |
| 12 July | 35.1 | 1.86 | 46.8 | 255 |
| 19 July | 36.3 | 1.96 | 40.2 | 265 |
| 23 July | 39.8 | 1.24 | 32.1 | 290 |
| 25 July | 30.1 | 1.14 | 40.5 | 216 |
| 31 July | 32.9 | 1.76 | 58.9 | 237 |
| 1 August | 36.3 | 2.27 | 24.8 | 241 |
| 9 August | 34.4 | 0.92 | 41.4 | 228 |
| 10 August | 33.9 | 1.34 | 47.0 | 224 |
| 15 August | 35.8 | 1.96 | 40.0 | 240 |
| 20 August | 37.0 | 1.24 | 39.1 | 247 |
Colors representing levels of thermal perception are based on the color index in Table 2.
Table 6.
Summary of procedure results. Columns show the 12 procedures with recorded facial skin temperatures (average of five points: Ear, cheek, nose, chin, and temple) collected every 5 min. Rows represent participants’ self-reported thermal comfort levels collected every 15 min.
Table 6.
Summary of procedure results. Columns show the 12 procedures with recorded facial skin temperatures (average of five points: Ear, cheek, nose, chin, and temple) collected every 5 min. Rows represent participants’ self-reported thermal comfort levels collected every 15 min.
| Time | 10 July | 11 July | 12 July | 19 July | 23 July | 25 July | 31 July | 1 August | 9 August | 10 August | 15 August | 20 August |
|---|---|---|---|---|---|---|---|---|---|---|---|---|
| 1 | - | - | 37.6 | 31.6 | 29.7 | 37.8 | 30.6 | 29 | 31.8 | 31 | 28.4 | - |
| 2 | - | 38.9 | 39 | 39.8 | 37.3 | 32.1 | 34.8 | 37.3 | 35.4 | 35.4 | 37.4 | - |
| 5 | 38.2 | 39.5 | 38.7 | 39.1 | 37.6 | 38.6 | 36.6 | 36.9 | 35 | 35.8 | 37.2 | 35.9 |
| 10 | 36.9 | 38.1 | 38.7 | 39.5 | 37.3 | 37.4 | 35.1 | 36.2 | 36.9 | 23.8 | 37.7 | 38.1 |
| 15 | 38.6 | 30.1 | 37.7 | 40.1 | 38.6 | 38.4 | 36.7 | 38 | 36.7 | 31.2 | 28.3 | 36.4 |
| 20 | 37.3 | - | 39.8 | 38.2 | 38.7 | 37 | 35.4 | 37 | 34.6 | 36.4 | 30.7 | 37.4 |
| 25 | - | - | 28.9 | 39.6 | 39.1 | - | 35.9 | 29.4 | 37.2 | 35.6 | - | 38.4 |
| 30 | - | - | 38.9 | 27.4 | - | - | 35.3 | 36.3 | 35 | 34.2 | - | - |
| 35 | - | - | - | - | - | - | - | 36.6 | 27.9 | 33.7 | - | - |
| 40 | - | - | - | - | - | - | - | 38.6 | - | 36 | - | - |
| 45 | - | - | - | - | - | - | - | 37.7 | - | 34.1 | - | - |
| 50 | - | - | - | - | - | - | - | 37.1 | - | 35.6 | - | - |
| 55 | - | - | - | - | - | - | - | 28.9 | - | 36.3 | - | - |
| 60 | - | - | - | - | - | - | - | 31.7 | - | - | - | - |
| 65 | - | - | - | - | - | - | - | 30.5 | - | - | - | - |
| 70 | - | - | - | - | - | - | - | 30.8 | - | - | - | - |
| 75 | - | - | - | - | - | - | - | 30.4 | - | - | - | - |
| 80 | - | - | - | - | - | - | - | 38.3 | - | - | - | - |
| 85 | - | - | - | - | - | - | - | 37.7 | - | - | - | - |
Colors representing levels of thermal perception are based on the color index in Table 2.
© 2020 by the authors. Licensee MDPI, Basel, Switzerland. This article is an open access article distributed under the terms and conditions of the Creative Commons Attribution (CC BY) license (http://creativecommons.org/licenses/by/4.0/).
Share and Cite
MDPI and ACS Style
Hastings, S.; Kim, S.W.; Brown, R.D. Face Temperature as an Indicator of Thermal Stress in Outdoor Work Environments. Atmosphere 2020, 11, 627. https://0-doi-org.brum.beds.ac.uk/10.3390/atmos11060627
AMA Style
Hastings S, Kim SW, Brown RD. Face Temperature as an Indicator of Thermal Stress in Outdoor Work Environments. Atmosphere. 2020; 11(6):627. https://0-doi-org.brum.beds.ac.uk/10.3390/atmos11060627
Chicago/Turabian StyleHastings, Scott, Se Woong Kim, and Robert D. Brown. 2020. "Face Temperature as an Indicator of Thermal Stress in Outdoor Work Environments" Atmosphere 11, no. 6: 627. https://0-doi-org.brum.beds.ac.uk/10.3390/atmos11060627
Note that from the first issue of 2016, this journal uses article numbers instead of page numbers. See further details here.