Insignificant Impact of the “Stay-At-Home” Order on Ambient Air Quality in the Memphis Metropolitan Area, U.S.A.


1
School of Public Health, University of Memphis, Memphis, TN 38152, USA
2
Shelby County Health Department, Memphis, TN 38105, USA
*
Author to whom correspondence should be addressed.
Atmosphere 2020, 11(6), 630; https://0-doi-org.brum.beds.ac.uk/10.3390/atmos11060630
Submission received: 14 May 2020
/
Revised: 5 June 2020
/
Accepted: 11 June 2020
/
Published: 14 June 2020
(This article belongs to the Special Issue Coronavirus Pandemic Shutdown Effects on Urban Air Quality)
Abstract
:The lockdowns due to the COVID-19 pandemic have been reported to reduce ambient air pollution in many cities globally. This study aims to examine whether air pollution dropped in Memphis, a typical U.S. metropolitan city and transportation hub, during the lockdown from 25 March to 4 May, 2020. Daily air pollution data measured at five representative monitoring stations in the Memphis Metropolitan Area were downloaded from the U.S. Environmental Protection Agency’s Air Quality System. The mean concentrations of fine particulate matter (PM2.5), nitrogen dioxide (NO2), and ozone during the lockdown were compared with the baseline concentrations measured during the same periods in 2017–2019 using linear regression models. The average vehicle miles traveled (VMT) reduced by 57% in this region during the lockdown compared to that during 1–24 March, 2020. The mean (± standard deviation) concentrations of PM2.5, NO2, and ozone were 7.5 ± 2.6 μg/m3, 16.5 ± 9.4 ppb, and 44.5 ± 8.4 ppb, respectively, during the lockdown. They did not statistically differ from the baseline concentrations, nor were they lower than the mean concentrations in the prior month (25 February–24 March, 2020), after accounting for meteorological conditions. The lack of effect could be explained by the small contribution of traffic emissions to air pollution. The results suggest that the “stay-at-home” order had an insignificant impact on reducing air pollution in Memphis.
1. Introduction
The worldwide lockdowns and stay-at-home orders to fight the COVID-19 pandemic have caused traffic reduction and industry and business closures. Air pollution drops have produced a beneficial side effect observed in many major cities globally. A Google search on 7 May, 2020, using “Air pollution drops, Coronavirus” as key search terms yielded about 27,000,000 results. NASA satellite images and numerous photos clearly displayed the dramatic contrast of air pollution levels between pre- and post-pandemic lockdown periods in China [1]. A recent report compared fine particulate matter (PM2.5) concentrations before and during the pandemic in 10 major global cities under lockdown and found that nine cities experienced reductions compared to the same period in 2019 [2]. Researchers have speculated that these reductions might lower air pollution associated mortality rates [3].
It was notable that the global focus targeted those cities with well-known severe air pollution issues, e.g., Delhi, India; Beijing, China; and Los Angeles, US. The significant air quality improvements could be easily visualized and perceived in these cities. In the U.S., however, air pollution levels are generally low in most cities, e.g., the national annual average concentrations of PM2.5, ozone, and nitrogen dioxide (NO2) were 7.5 μg/m3, 63.1 ppb, and 7.8 ppb, respectively, in 2019 [4]. While only a few megacities like Los Angeles and New York City have high air pollution due to large populations, the vast majority of U.S. cities are small with low population density. The overwhelming claims of air pollution drops based on megacity cases may not have occurred in most U.S. cities. Another issue lies in the comparison methods. The current comparisons were performed with satellite images or simple descriptive statistics; however, satellites cannot measure “nose-level” concentrations [5], and the visual inspection may be misleading [6]. Simple comparisons also lack consideration of potential confounders such as weather variations [7].
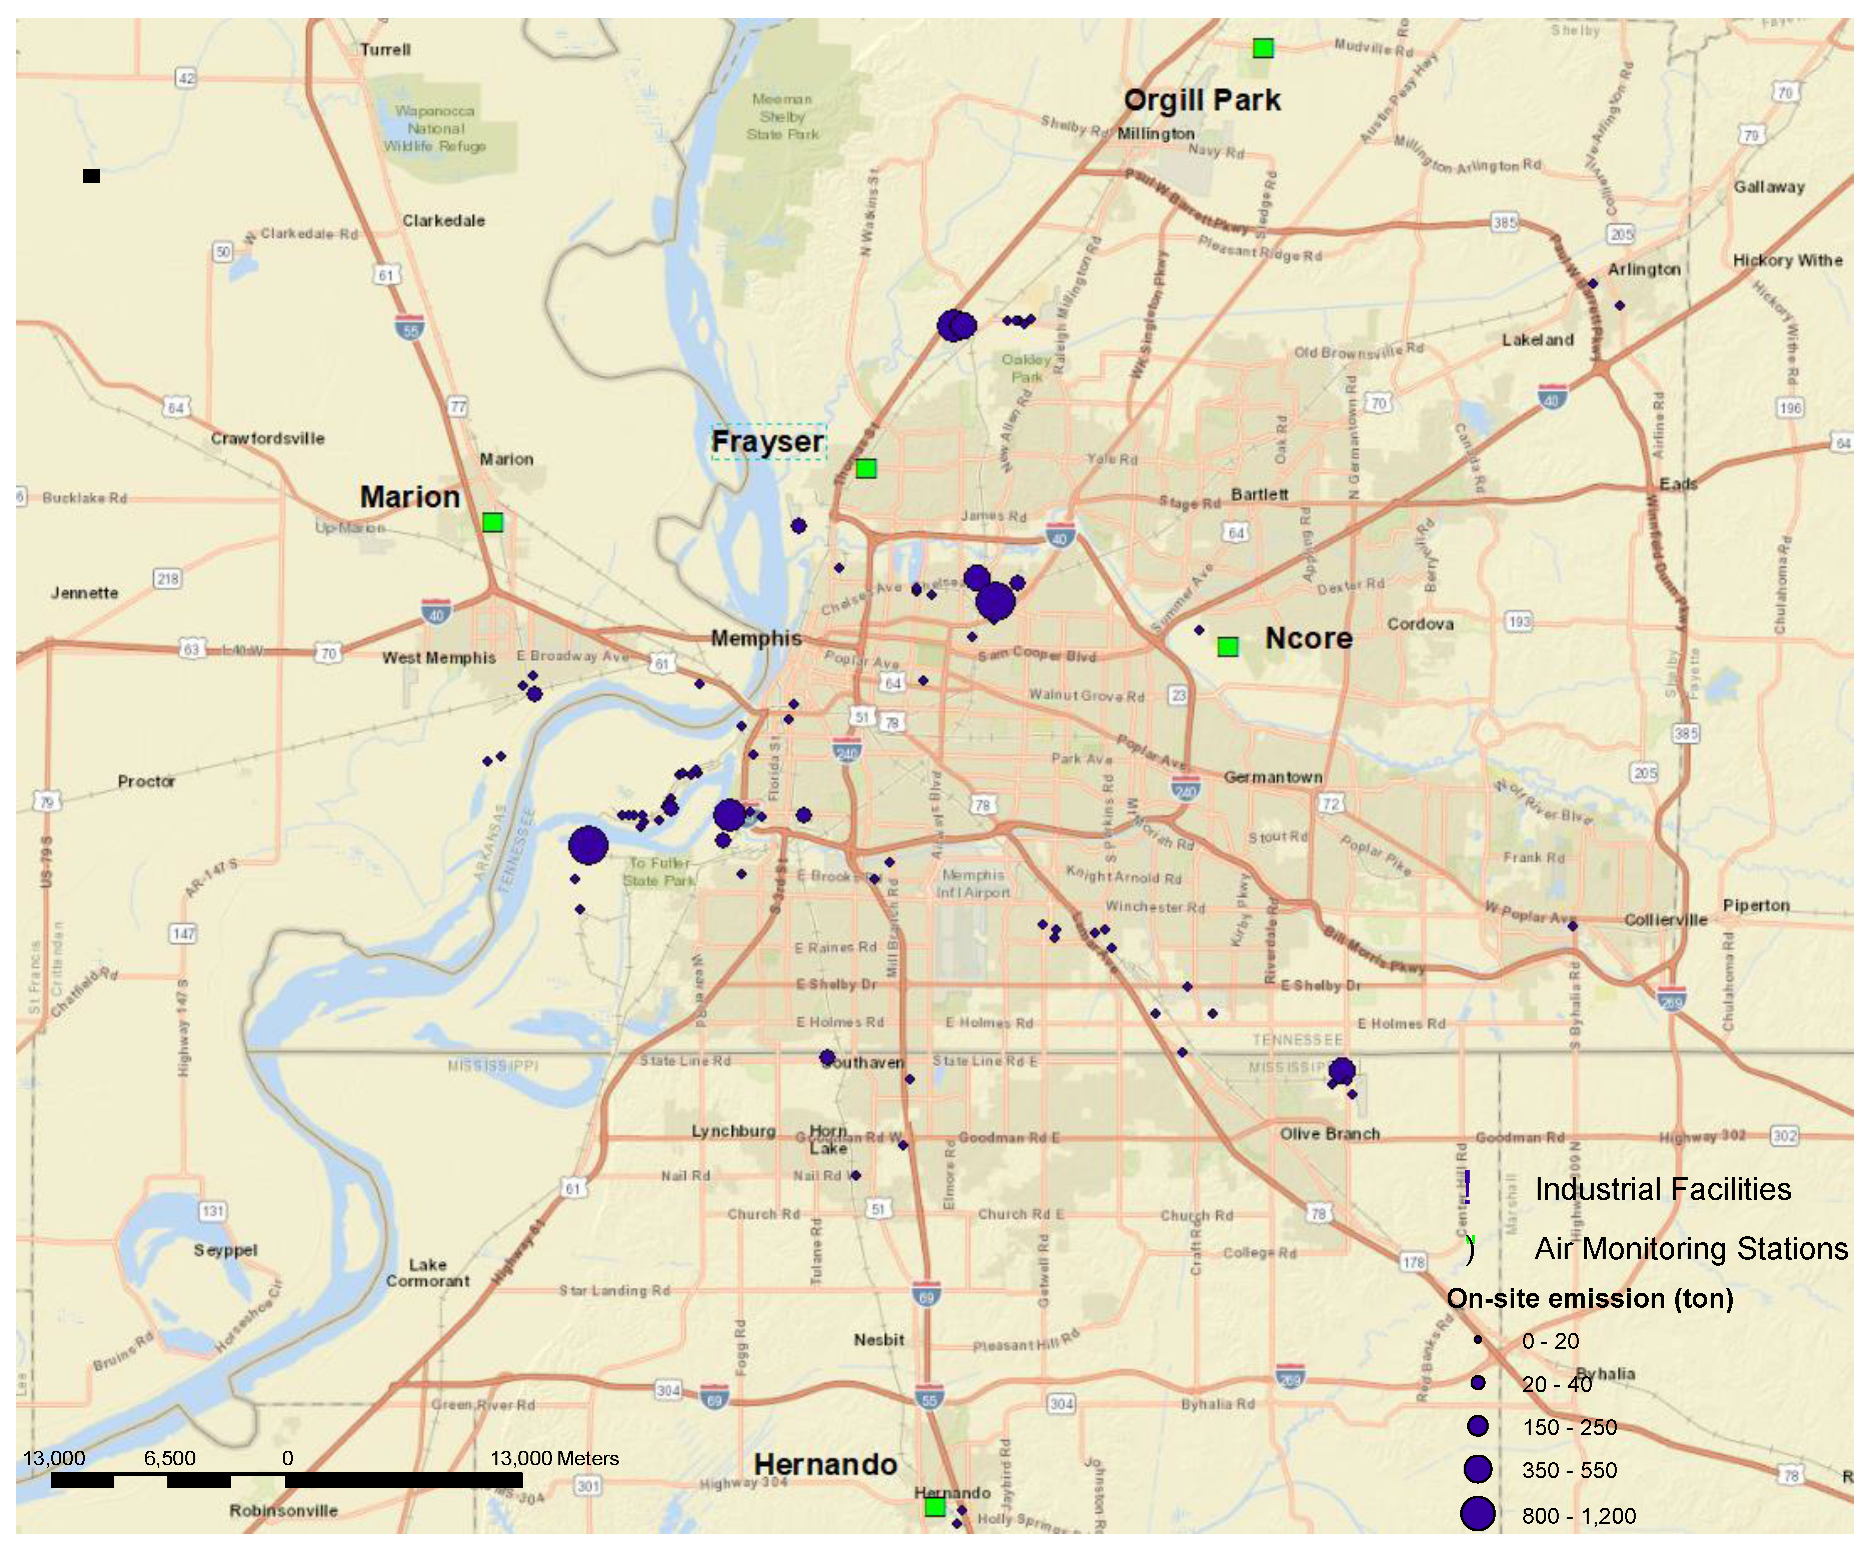
The current study is based on a recognition of the need for detailed evaluations of lockdown impacts on air quality using in situ monitoring data. A detailed analysis focused on even a single region could provide useful insight into this timely topic. This study aims to examine whether a reduction in air pollution occurred during the lockdown period in a typical mid-size U.S. metropolitan city. The Memphis Metropolitan Area served as the testbed in this study. This area is also known as the Mid-South Region, with Memphis as the central city. Known as the “Distribution Center of America”, Memphis is a major Mid-American commercial and transportation hub. The primary air pollution emission sources in this area include industries, airports, trains, truck corridors, highways, and ships on the Mississippi River. Southwest Memphis houses clustered heavy industries, including a refinery and a natural gas power plant (Figure 1). Memphis has the busiest airport for cargo traffic [8], the third-largest rail center, and one of the largest inland ports in the nation. The Lamar Avenue corridor in Memphis is home to the newly enlarged BNSF Rail Yard used primarily for freight off-loading operations and brings thousands of train cars and trucks daily through the area. Major highways include Interstate 40, 240, 55, and 385, and their inner-city segments all have high traffic volumes of >50,000 vehicles/day [9]. With all these industrial and traffic emission sources, we hypothesized that the “stay-at-home” policy would significantly reduce air pollution during the lockdown period.
2. Methods
The “stay-at-home” order took effect at 6:00 p.m. on 24 March, 2020 [10] and ended on 4 May, 2020 [11] in this region. The air quality measured during the lockdown (25 March–4 May, 2020), was compared with that measured in the same period in 2017–2019. The data in three prior years provided a more stable baseline. The immediate effect of lockdown was examined by comparing air quality during the lockdown with that in the prior month, i.e., 25 February–24 March, 2020.
The study area was the three neighboring counties in the Memphis Metropolitan Area: Shelby County, TN, DeSoto County, MS, and Crittenden County, AR. According to the U.S. Census 2010–2019 data, the total population was 1.17 million, and the total area was 4789 km2 in this tri-state region [12]. Daily average concentrations of criteria pollutants measured during the above periods were downloaded from the U.S. Environmental Protection Agency’s (EPA) Air Quality System (AQS) [4]. Air quality data were available at five monitoring stations in this region (Figure 1): (1) The National Core station (Ncore, Site ID: 4715775), located at the center of Memphis City and nearby municipalities. This site monitors the urban background air pollution levels. (2) The Hernando station (Site ID: 280330002), located in Hernando, Mississippi, 20 km south to the Memphis International Airport. (3) The Marion station (Site ID: 50350005), located in Marion, Arkansas, and 15 km west to Memphis Downtown. These three sites measure the background urban air quality of this region [13]. (4) The Frayser station (Site ID: 471570021), located in a low-income community in North Memphis. This site represents an urban community setting to address potential environmental justice issues. (5) The Orgill station (Site ID: 471571004), which is a suburban site located near the northern border of this region. In combination, data from these five stations are representative of the air quality in this Tennessee–Mississippi–Arkansas tri-state region. Ozone data were available at all the five stations, PM2.5 data at Ncore, Hernando, and Marion stations, and NO2 data at the Marion station. The NO2 data were available until 31 March, 2020 in the AQS. All the air monitoring data in the AQS met the quality assurance (QA) requirements stipulated in Title 40 of the Code of Federal Regulations [14]. In this region, the measurement uncertainty was 4%, 7%, and 4% for PM2.5, NO2, and ozone, respectively. Weather data, including daily average wind speed, temperature, and precipitation measured at the Memphis International Airport, were downloaded from the National Oceanic and Atmospheric Administration (NOAA) database [15]. The data system applies QA checks to the full dataset during data updates and reconstruction [16].
Two traffic measures were adopted to indicate the changes in traffic. The vehicle miles traveled (VMT) is an extensively used metric that measures the total amount of travel for all individuals in a geographic region over a given period of time [17]. VMT has been used to indicate traffic emissions in air pollution studies [18,19,20]. Daily VMT data were not yet available from the U.S. or Tennessee Departments of Transportation (TDOT), and thus the data were captured from the Streetlight VMT Monitor, a commercial online database [21]. The Streetlight VMT is estimated based on travel of mobile devices and shows a 98% correlation with the standard method [22]. It should be noted that Streetlight VMT represents residents’ VMT generated by passenger cars of people residing in the county on a particular day, but does not include commercial VMT typically generated by trucks. The data were available at the county level starting on 1 March 2020. The daily traffic counts data in Shelby County were requested from TDOT for the study periods. TDOT has only two traffic stations (Stations #22 and #512) that continuously monitor daily traffic counts in Shelby County. Station #22 is located on Road R204, near the intersection of R204 and US385, and Station #512 on North Watkins Street, near the intersection of North Watkins Street and US51. The daily traffic counts at these two stations served as a secondary source to confirm the traffic volume changes.
The frequency distributions of pollutant concentrations, temperature, and wind speed showed symmetric histograms and could be described by normal distributions. The distribution of precipitation displayed a sharply right-skewed histogram, which could be described by the extreme distribution. Pearson correlation coefficient (R) and coefficient of divergences (COD) were computed to examine the temporal and spatial variability among paired sites. A high R (>0.7) and low COD (<0.2) suggest that air pollutant concentrations at two sites were spatially similar and had similar temporal variation patterns [23,24]. For each air pollutant, the average concentration in the baseline period (25 March–4 May, 2017–2019) was defined as the baseline concentration, and that during the lockdown period (25 March–4 May, 2020) as the event concentration. Simple comparisons were performed using a linear regression model with period as the only explanatory variable (crude model). This model was equivalent to a two-sample t-test to compare the means in two periods. Further comparisons were performed using a full model with period as the explanatory variable and daily average wind speed, temperature, and precipitation as covariates. The full model examined the effect of lockdown, adjusting for weather conditions. All the residuals displayed random patterns in residual plots, indicating the linear models were appropriate. The data were organized in Microsoft Excel (Microsoft Office 365), and statistical analyses were performed in SAS (Ver. 9.4, SAS Institute Inc., Cary, NC, USA).
3. Results
The residents’ travel significantly dropped during the lockdown (Figure S1). The average daily VMT was 61.3 ± 26.6 million during 1–24 March, 2020, and 26.6 ± 5.6 million during 25 March–4 May, 2020, representing a 57% decrease in total residents’ travel during the lockdown period. At TDOT Station #22, the traffic count averaged 7,659/day during the lockdown, 40% down from the same periods in 2017–2019 (average 12,759/day) and 30% down from the prior month (average 10,875/day). At TDOT Station #152, the traffic count averaged 8,165/day, a 14% drop from the same periods in 2018–2019 (average 9,468/day) and a 6% drop from the prior month (average 8,690/day).
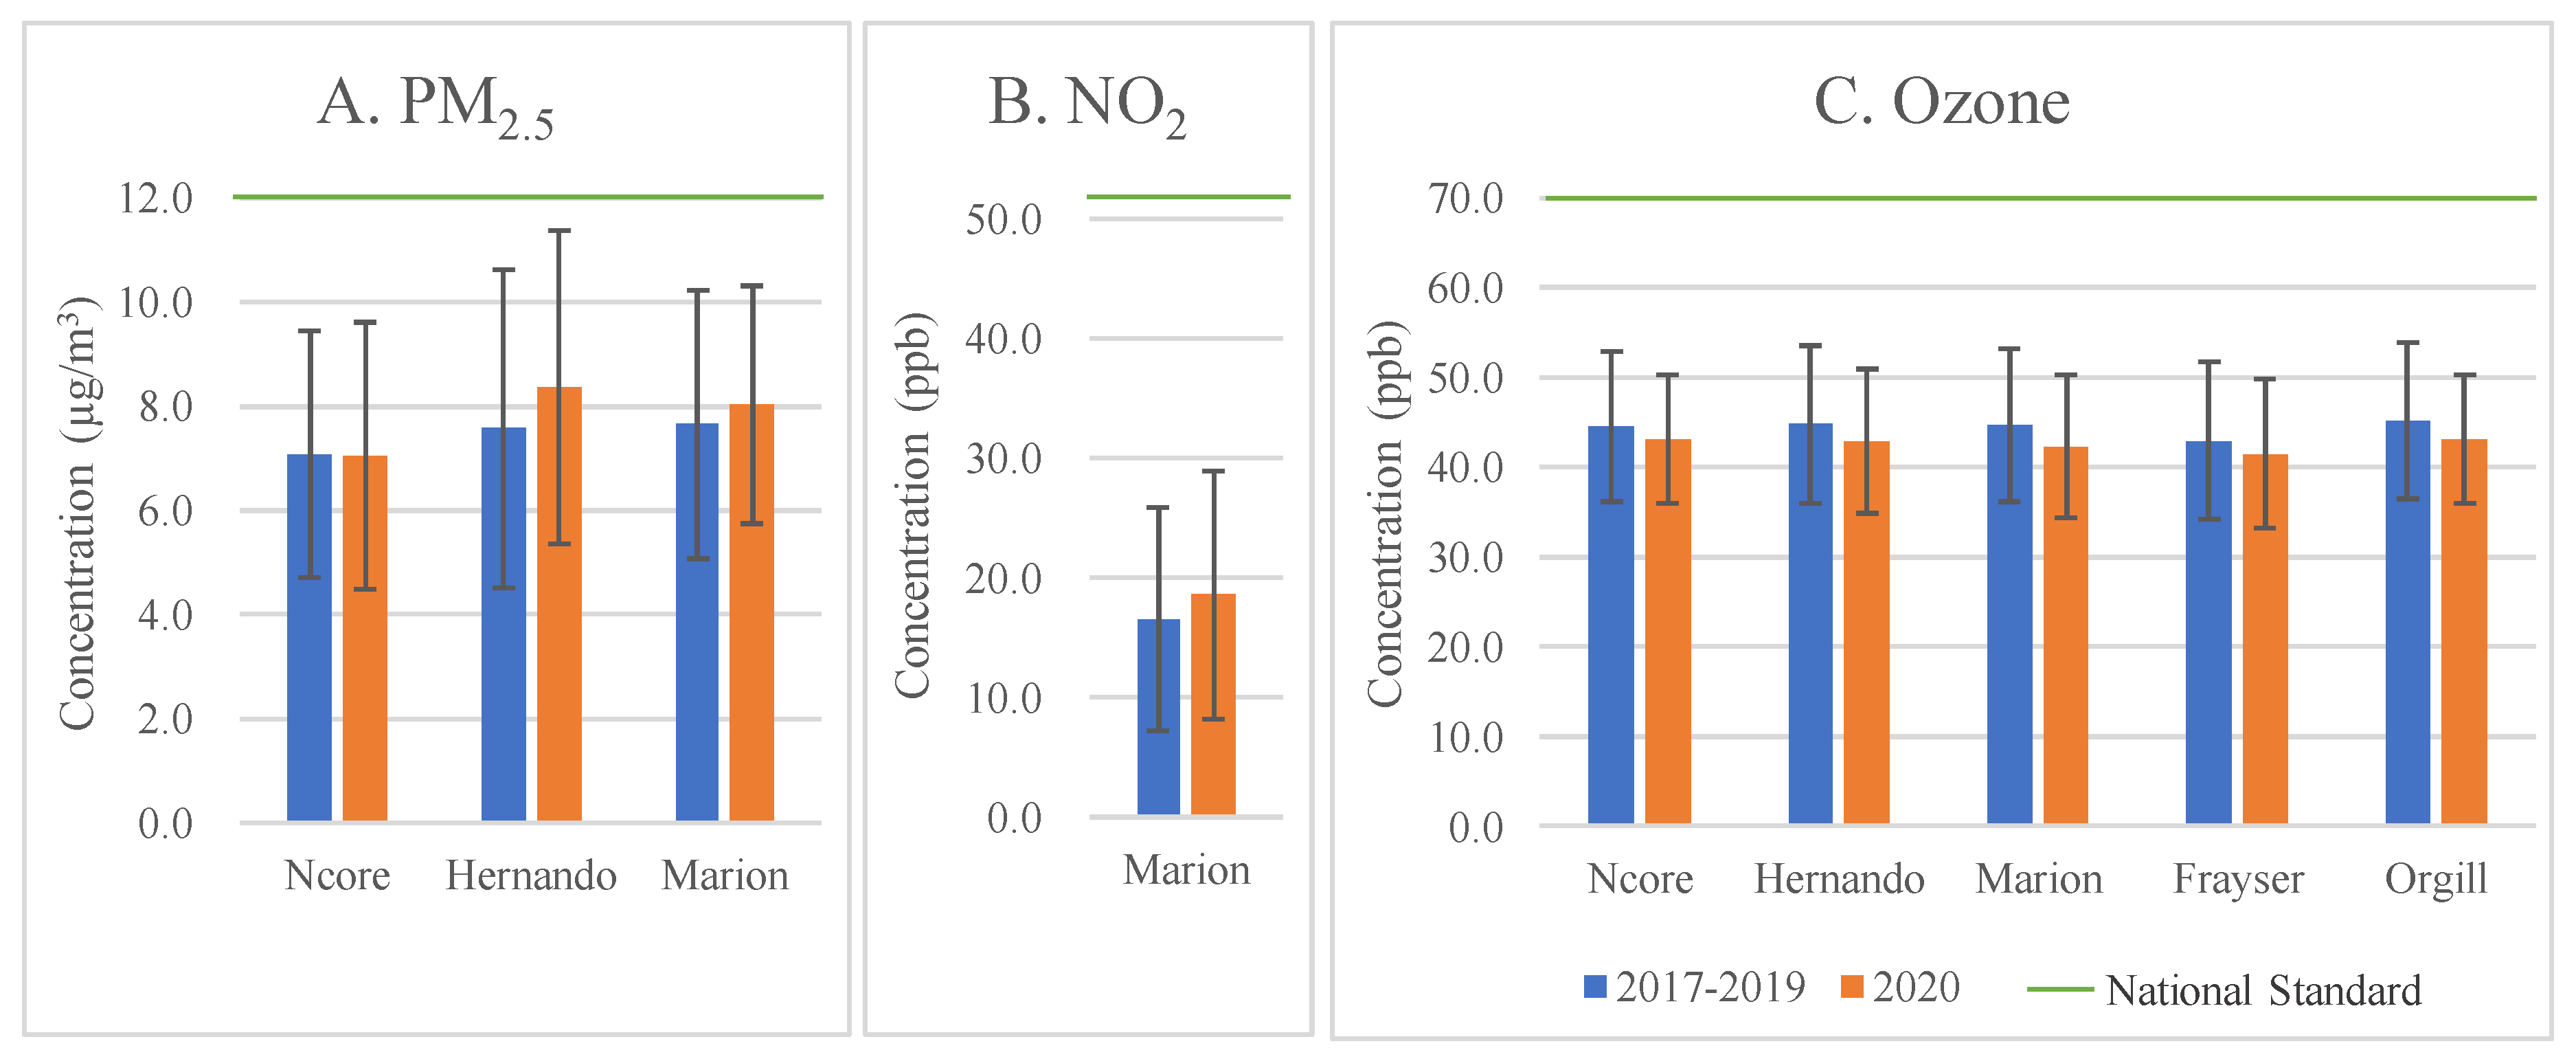
The air pollution levels in Memphis were low compared to the national standards (Table 1 and Figure 2). During 2017–2019, the baseline average concentration (±standard deviation) of PM2.5 was 7.1 ± 2.4, 7.6 ± 3.1, and 7.6 ± 2.6 μg/m3 at Ncore, Hernando, and Marion stations, respectively. The regional baseline concentration of NO2 was 16.5 ± 9.4 at the Marion station. The baseline concentrations of ozone ranged from 43.0 ± 8.8 ppb to 45.2 ± 8.8 ppb at the five monitoring stations (Table 1). For PM2.5, Pearson Rs were 0.77–0.82 and CODs were 0.10–0.13 among Ncore, Hernando, and Marion sites (Table 2). For ozone, Pearson Rs were 0.90–0.96 and CODs were 0.03–0.05 among the five sites (Table 3). The high Rs and very low CODs indicate that the background air pollution levels had small spatial variation and similar temporal patterns in this region. Thus, the grand regional mean concentrations of PM2.5, NO2, and ozone were 7.5 ± 2.6 μg/m3, 16.5 ± 9.4 ppb, and 44.5 ± 8.4 ppb, respectively, during the baseline period, and 7.8 ± 2.5 μg/m3, 18.6 ± 10.4 ppb, and 42.6 ± 7.44 ppb, respectively, during the lockdown period. The standards for annual average concentrations of PM2.5, NO2, ozone are 12.0 μg/m3, 53 ppb, and 70 ppb, respectively [25]. The concentrations of criteria pollutants were far below the standards in both periods.
The changes in air pollutant concentrations during the lockdown, in comparison to the baseline period, were inconsistent (Figure 2) but all statistically insignificant (Table 1). The mean PM2.5 level stayed the same at Ncore and was 0.38 μg/m3 higher at Marion during the lockdown. The statistical tests for the changes were all insignificant: p-values = 0.94 and 0.41 for PM2.5 and ozone in the crude models, respectively; and 0.77 and 0.21 in the full models, respectively. The regional mean NO2 concentration showed a 2.0 ppb increase during the lockdown compared to the baseline period, but it was statistically insignificant in both crude (p = 0.58) and full (p = 0.51) models. For ozone, the average concentrations decreased by 1.4–2.4 ppb at the four sites, all being insignificant in the crude models (p-values = 0.11–0.34). After accounting for the weather conditions, these changes were still insignificant, indicated by p-values of 0.06–0.30 in full models.
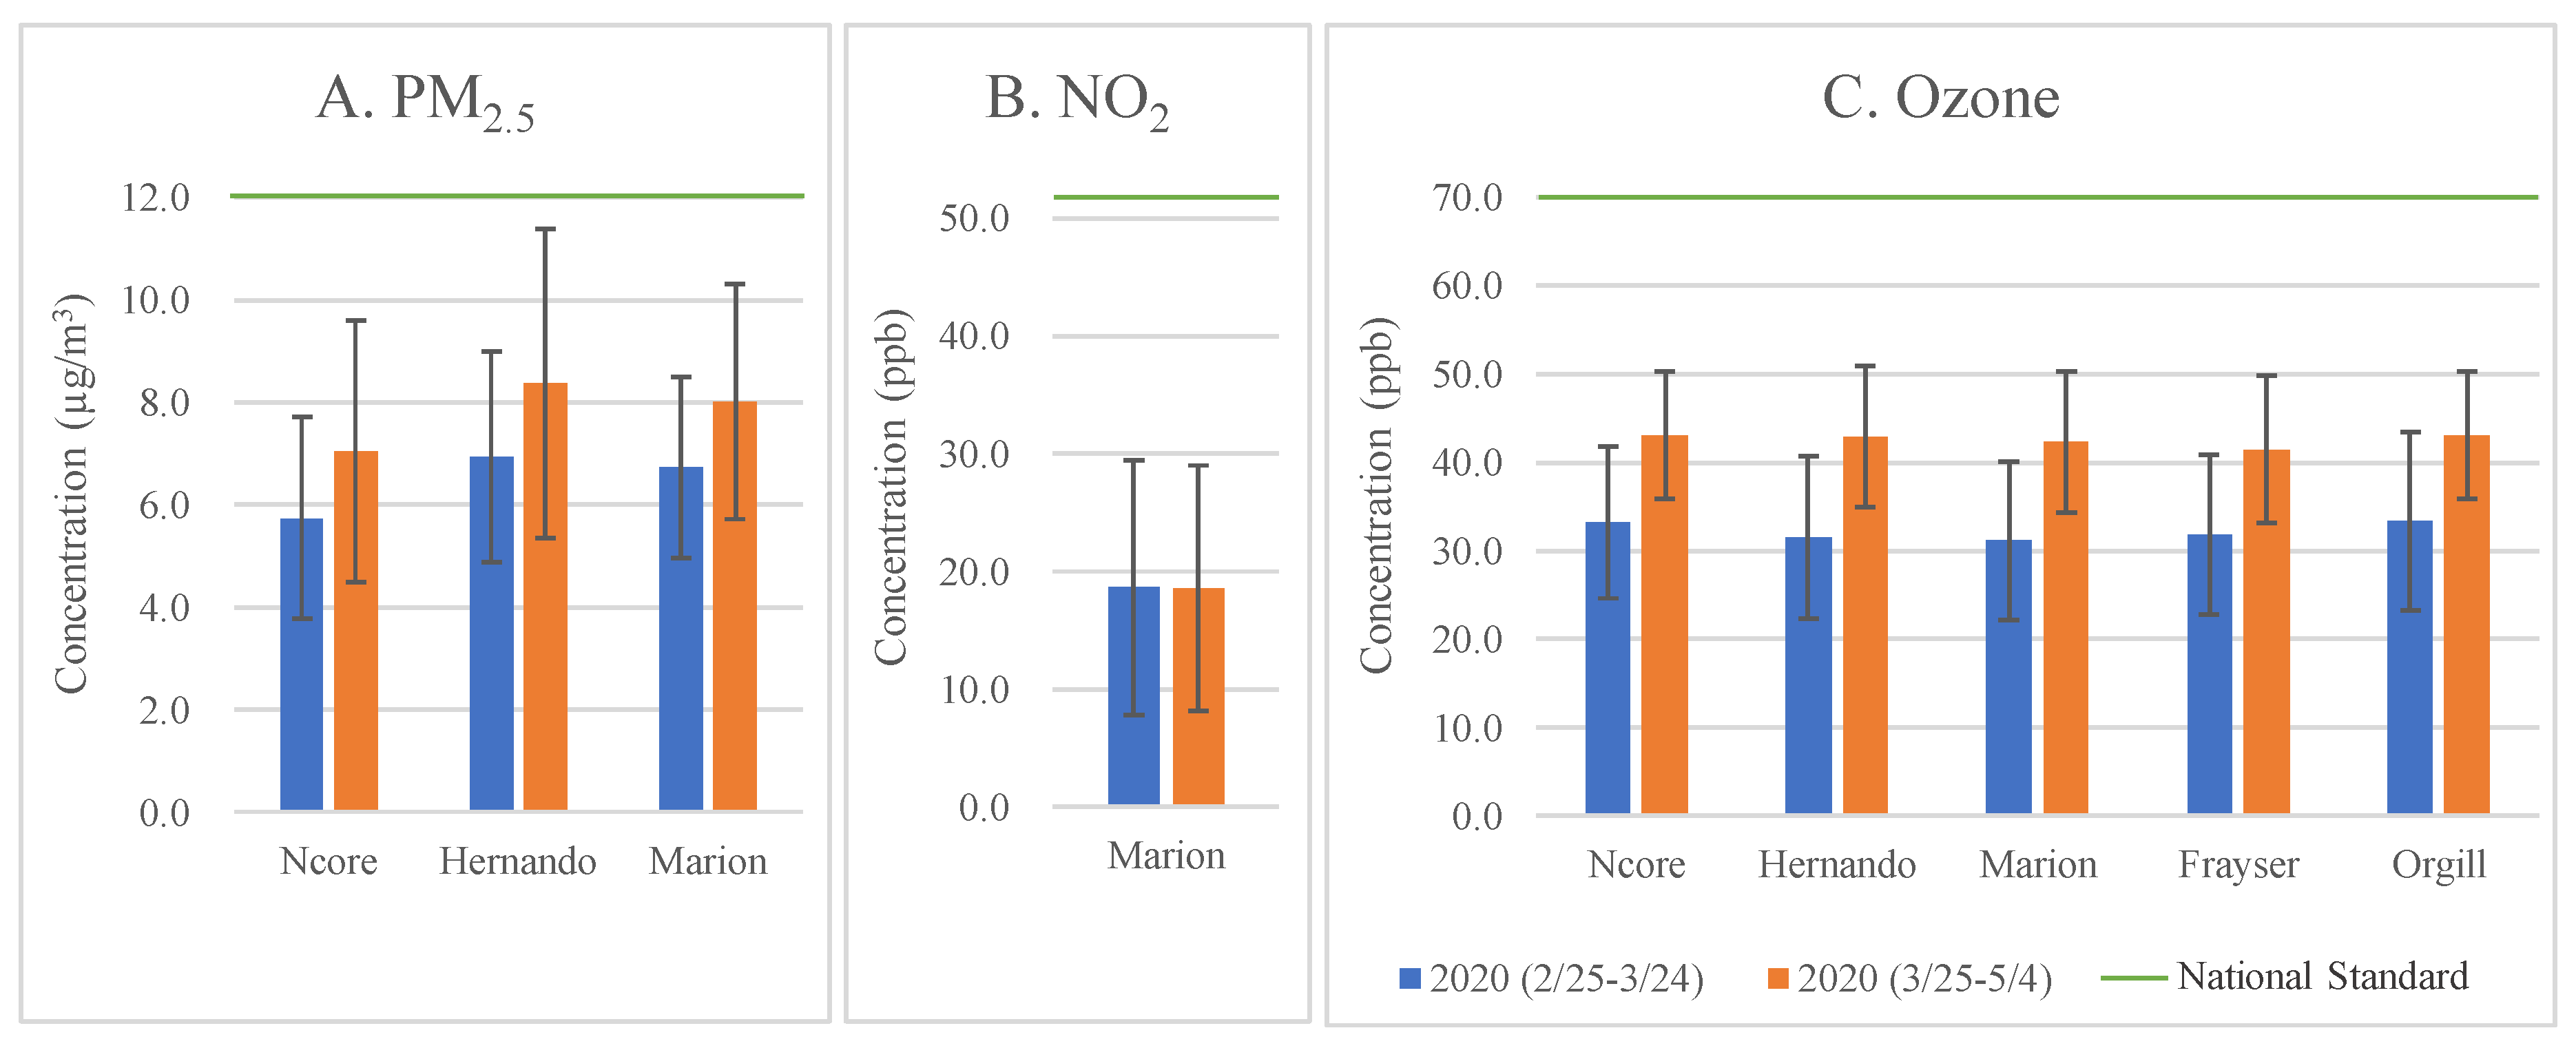
No immediate air pollution drops occurred during the lockdown, in comparison to the pollution levels in the prior month (Figure S1). PM2.5 concentrations during the lockdown even increased by 23%, 21%, and 19% at Ncore, Hernando, and Marion stations, respectively (Figure 3 and Table 4). NO2 concentration did not change at Marion. Ozone concentrations increased by 29–36% during the lockdown compared with those in the prior months. Although the above comparisons were not fair comparisons considering the known seasonal variation, the facts suggested that there were no immediate air pollution drops right after the “stay-at-home” order in Memphis.
4. Discussion
This study found no air pollution reductions in Memphis during the COVID-19 lockdown period, as opposed to air quality improvements predominantly reported in the media. The variation of air pollutant levels can be explained by source emissions, source contributions, and weather conditions. In Memphis, the “stay-at-home” order allowed residents to travel to perform essential activities and encouraged essential businesses to remain open, allowing manufacturing companies, distributors, and supply chain companies to remain open, and transportation services such as buses, airlines, taxis, railways, and other private transportation providers to continue services [26]. Hence, the emissions from commercial transportation and manufacturing should not have changed during the lockdown. The Streetlight VMT used in this study appropriately reflected the part of the traffic that was impacted by the lockdown, as Streetlight VMT is the total miles residents travel every day but does not include commercial truck miles traveled. The above impacts on traffic are reflected by the 57% reduction in VMT but only a 6–30% reduction in daily traffic counts.
The source contributions to PM2.5 and NOx could be estimated using the latest 2017 National Emissions Inventory (NEI) data [27]. Combining data from Shelby, TN, DeSoto, MS, and Crittenden, AR, emissions from on-road non-diesel light-duty vehicles contributed 2.4% and 24.8% of the total PM2.5 and NOx emissions, respectively. These numbers were similar to previous studies, e.g., an early study showed that on-road non-diesel and diesel emissions contributed 7% of PM2.5 mass in Memphis [28]. A recent modeling study estimated that the on-road contribution was 7% and 15% to PM2.5 and ozone, respectively, in Memphis in 2020 [29]. The EPA estimated that highway vehicles contributed 32.3% of NOx in 2018 [30]. Using 2.4%, 24.8%, and 15% contributions of VMT to PM2.5, NO2, and ozone, respectively, and 57% reduction in VMT, the concentration decreases would be 1%, 3%, and 11% for PM2.5, ozone, and NO2, respectively. These small values could be overshadowed by fluctuations in emissions and weather conditions, as well as the measurement uncertainty (4%–7%). For example, the slight drops of ozone level in comparison to the baseline might be attributable to the temperature decrease (average 16.5 °C during the lockdown vs. 17.0 °C during the baseline). Although these estimates were rough, the small contribution of emissions from on-road light-duty vehicles explained the null effect during the lockdown in Memphis, despite the large reduction in residents’ VMT.
The elevated air pollutant levels during the lockdown in comparison to the prior month could be explained by seasonal variation and sources. The elevated PM2.5 concentrations might be attributable to seasonal biomass burning and increased formation of secondary particles [31,32]. Ozone is a secondary pollutant whose formation increases with increasing solar radiation [33,34] and ambient temperature [35,36]. The elevated ozone concentration during the lockdown should be mainly attributed to the seasonal variation of tropospheric ozone that had a possible increase in natural contributions during spring [37].
We hypothesize that traffic reduction due to lockdowns has limited effects on improving air pollution in most U.S. cities. Nationally, contributions of transportation sources to air pollution are similar to those in Memphis [30]. Another fact is that “stay-at-home” orders were enacted in less than half of U.S. regions, and might not have been strictly followed [38] due to “quarantine fatigue” [39]. A preliminary observation also suggests that air pollution at the surface level does not show a huge change in the U.S. [7].
The strengths of this study included the use of a typical metro area with high transportation volumes, real air monitoring data representative of this region, and thorough analyses accounting for weather variations. The results are subject to several limitations, though. The findings based on the Mid-South region may be extrapolated to other U.S. cities, but a national analysis is required to understand how ground-level air pollution responds to lockdown orders. Of course, it would be a daunting task to collect all the information about air pollutant concentrations, lockdown periods, policy provisions, residents’ mobility changes, industry and business closures, traffic volumes, source contributions, as well as weather conditions for a large region or the entire U.S. This study had NO2 data at only one site, and air monitoring data were unavailable at the two near-road monitoring stations in this region, making impossible a direct understanding of how traffic-related air pollution changed over the lockdown. Air monitoring data were also missing for air toxics that pose risks for respiratory, neurologic, and carcinogenic effects [40]. These limitations inform the need for future COVID-19 related air pollution exposure research that targets national-level analyses, near-road air pollution, and air toxics.
5. Conclusions
This case study in a transportation hub city provided a thorough analysis of the impacts of the “stay-at-home” policy on air pollution with in-situ monitoring data. The air quality in the Memphis Metropolitan Area met the National Ambient Air Quality Standards. Air pollution drops did not occur during the lockdown period, mainly due to the low contribution of traffic sources. To our knowledge, this is the first study that reports on how ground-level air pollution responds to the “stay-at-home” order in the U.S.. The results of this study suggest that air pollution changes during COVID-19 lockdowns may be inconsistent in U.S. cities, which warrants further national-level analyses.
Supplementary Materials
The following are available online at https://0-www-mdpi-com.brum.beds.ac.uk/2073-4433/11/6/630/s1, Figure S1: Daily average concentrations of criteria air pollutants and weather conditions in the Greater Memphis Area between 25 February 2020 and 4 May 2020.
Author Contributions
Conceptualization, C.J.; methodology, C.J.; formal analysis, X.F. and C.J.; data curation, X.F.; writing—original draft preparation, C.J. and X.F.; writing—review and editing, D.B. and L.S.; visualization, X.F. and C.J.; supervision, C.J.; project administration, C.J.; funding acquisition, C.J. and D.B. All authors have read and agreed to the published version of the manuscript.
Funding
This research was funded by the Urban Child Institute and a JPB Environmental Health Fellowship award granted by the JPB Foundation and managed by the Harvard T.H. Chan School of Public Health.
Acknowledgments
The authors thank the Tennessee Department of Transportation Long Range Planning Division for providing the daily traffic count data.
Conflicts of Interest
The authors declare no conflict of interest. The funders had no role in the design of the study; in the collection, analyses, or interpretation of data; in the writing of the manuscript, or in the decision to publish the results.
References
- NASA. Airborne Nitrogen Dioxide Plummets Over China. Available online: https://earthobservatory.nasa.gov/images/146362/airborne-nitrogen-dioxide-plummets-over-china (accessed on 7 May 2020).
- IQAir. COVID-19 Air Quality Report: COVID-19 Impact on Air Quality in 10 Major Cities; IQAir: Staad, Switzerland, 2020. [Google Scholar]
- Isaifan, R.J. The dramatic impact of Coronavirus outbreak on air quality: Has it saved as much as it has killed so far? Glob. J. Environ. Sci. Manag. 2020, 6, 275–288. [Google Scholar] [CrossRef]
- USEPA. Air Data: Air Quality Data Collected at Outdoor Monitors Across the US. Available online: https://aqs.epa.gov/api (accessed on 5 May 2019).
- Duncan, B.N.; Prados, A.I.; Lamsal, L.N.; Liu, Y.; Streets, D.G.; Gupta, P.; Hilsenrath, E.; Kahn, R.A.; Nielsen, J.E.; Beyersdorf, A.J.; et al. Satellite data of atmospheric pollution for U.S. air quality applications: Examples of applications, summary of data end-user resources, answers to FAQs, and common mistakes to avoid. Atmos. Environ. 2014, 94, 647–662. [Google Scholar] [CrossRef] [Green Version]
- NASA’s Scientific Visualization Studio. Reductions in Nitrogen Dioxide Associated with Decreased Fossil Fuel use Resulting from COVID-19 Mitigation. Available online: https://svs.gsfc.nasa.gov/4810 (accessed on 11 May 2020).
- Schiermeier, Q. Why pollution is plummeting in some cities—But not others. Nature 2020, 580, 313. [Google Scholar] [CrossRef] [PubMed] [Green Version]
- ACI. Cargo Traffic 2017 FINAL (Annual). Available online: https://aci.aero/data-centre/annual-traffic-data/cargo/2017-cargo-summary-annual-traffic-data/ (accessed on 7 May 2020).
- TDOT. Traffic Maps. Available online: https://www.tn.gov/content/dam/tn/tdot/maps/2019-traffic-maps-with-aadt/Shleby%20Combined.pdf (accessed on 7 May 2020).
- WMC. Memphis, Shelby County Municipalities Issue ‘Safer-at-home’ Orders to Curb the Spread of COVID-19. Available online: https://www.wmcactionnews5.com/2020/03/23/mayor-issues-safer-home-order-memphis/ (accessed on 8 May 2020).
- WMC. Memphis Mayor Extends Safer-at-home Order into May. Available online: https://www.wmcactionnews5.com/2020/04/21/memphis-mayor-extends-safer-at-home-order-into-may/ (accessed on 8 May 2020).
- U.S. Census Bureau. QuickFacts: Crittenden County, Arkansas; DeSoto County, Mississippi; Shelby County, Tennessee. Available online: https://www.census.gov/quickfacts/fact/table/crittendencountyarkansas,desotocountymississippi,shelbycountytennessee/PST045219 (accessed on 28 May 2020).
- TDEC. TN Annual Monitoring Network Plan; Tennessee Department of Environment and Conservation: Nashville, TN, USA, 2019.
- U.S. Government. 40 CFR Appendix A to Part 58—Quality Assurance Requirements for Monitors used in Evaluations of National Ambient Air Quality Standards; Office of the Federal Register National Archives and Records Administration: Washington, DC, USA, 2019.
- NOAA. Climate Data Online: Dataset Discovery. Available online: https://www.ncdc.noaa.gov/cdo-web/datasets (accessed on 8 May 2020).
- NOAA. Global Historical Climate Network Daily-Description. Available online: https://www.ncdc.noaa.gov/ghcn-daily-description (accessed on 29 May 2020).
- Leard, B.; Linn, J.; Munnings, C. Explaining the evolution of passenger vehicle miles traveled in the United States. Energy J. 2019, 40, 25–54. [Google Scholar] [CrossRef] [Green Version]
- de Foy, B.; Schauer, J.J. Changes in speciated PM2.5 concentrations in Fresno, California, due to NOx reductions and variations in diurnal emission profiles by day of week. Elem. Sci. Anthr. 2019, 7. [Google Scholar] [CrossRef]
- Ravi, V.; Gao, A.H.; Martinkus, N.B.; Wolcott, M.P.; Lamb, B.K. Air quality and health impacts of an aviation biofuel supply chain using forest residue in the Northwestern United States. Environ. Sci. Technol. 2018, 52, 4154–4162. [Google Scholar] [CrossRef] [PubMed]
- Christoforou, C.S.; Salmon, L.G.; Hannigan, M.P.; Solomon, P.A.; Cass, G.R. Trends in fine particle concentration and chemical composition in Southern California. J. Air Waste Manag. Assoc. 2000, 50, 43–53. [Google Scholar] [CrossRef] [PubMed] [Green Version]
- StreetLight Data. Daily County VMT. Available online: https://www.streetlightdata.com/VMT-monitor-by-county/#emergency-map-response (accessed on 8 May 2020).
- StreetLight Data. VMT Monitor—Methodology and Validation; StreetLight Data: San Francisco, CA, USA, 2020. [Google Scholar]
- Krudysz, M.A.; Froines, J.R.; Fine, P.M.; Sioutas, C. Intra-community spatial variation of size-fractionated PM mass, OC, EC, and trace elements in the Long Beach, CA area. Atmos. Environ. 2008, 42, 5374–5389. [Google Scholar] [CrossRef]
- Massoud, R.; Shihadeh, A.L.; Roumie, M.; Youness, M.; Gerard, J.; Saliba, N.; Zaarour, R.; Abboud, M.; Farah, W.; Saliba, N.A. Intraurban variability of PM10 and PM2.5 in an Eastern Mediterranean city. Atmos. Res. 2011, 101, 893–901. [Google Scholar] [CrossRef]
- USEPA. National Ambient Air Quality Standards (40 CFR part 50). Available online: https://www.epa.gov/criteria-air-pollutants/naaqs-table (accessed on 8 May 2020).
- Strickland, J. Civil Emergency Proclamation and Executive Order Extending and Amending Safer at Home Directive and Closure of Non-Essential Services and Businesses (No. 10-2020); City of Memphis: Memphis, TN, USA, 2020.
- USEPA. 2017 National Emissions Inventory (NEI) Data. Available online: https://www.epa.gov/air-emissions-inventories/2017-national-emissions-inventory-nei-data (accessed on 31 May 2020).
- Doraiswamy, P.; Davis, W.T.; Miller, T.L.; Fu, J.S. Source apportionment of fine particles in Tennessee using a source-oriented model. J. Air Waste Manag. Assoc. 2007, 57, 407–419. [Google Scholar] [CrossRef] [PubMed] [Green Version]
- Nopmongcol, U.; Alvarez, Y.; Jung, J.; Grant, J.; Kumar, N.; Yarwood, G. Source contributions to United States ozone and particulate matter over five decades from 1970 to 2020. Atmos. Environ. 2017, 167, 116–128. [Google Scholar] [CrossRef]
- USEPA. Our Nation’s Air 2019; U.S. Environmental Protection Agency: Washington, DC, USA, 2019.
- Xu, L.; Suresh, S.; Guo, H.; Weber, R.J.; Ng, N.L. Aerosol characterization over the southeastern United States using high-resolution aerosol mass spectrometry: Spatial and seasonal variation of aerosol composition and sources with a focus on organic nitrates. Atmos. Chem. Phys. 2015, 15, 7307–7336. [Google Scholar] [CrossRef] [Green Version]
- Lee, S.; Russell, A.G.; Baumann, K. Source apportionment of fine particulate matter in the Southeastern United States. J. Air Waste Manag. Assoc. 2007, 57, 1123–1135. [Google Scholar] [CrossRef] [PubMed] [Green Version]
- Arsenovic, P.; Rozanov, E.; Anet, J.; Stenke, A.; Schmutz, W.; Peter, T. Implications of potential future grand solar minimum for ozone layer and climate. Atmos. Chem. Phys. 2018, 18, 3469–3483. [Google Scholar] [CrossRef] [Green Version]
- Egorova, T.; Rozanov, E.; Arsenovic, P.; Sukhodolov, T. Ozone Layer Evolution in the Early 20th Century. Atmosphere 2020, 11, 169. [Google Scholar] [CrossRef] [Green Version]
- Seinfeld, J.H. Urban Air Pollution: State of the Science. Science 1989, 243, 745–752. [Google Scholar] [CrossRef] [PubMed]
- Atkinson, R. Atmospheric chemistry of VOCs and NOx. Atmos. Environ. 2000, 34, 2063–2101. [Google Scholar] [CrossRef]
- Gaudel, A.; Cooper, O.R.; Ancellet, G.; Barret, B.; Boynard, A.; Burrows, J.P.; Clerbaux, C.; Coheur, P.F.; Cuesta, J.; Cuevas, E.; et al. Tropospheric Ozone Assessment Report: Present-day distribution and trends of tropospheric ozone relevant to climate and global atmospheric chemistry model evaluation. Elem.-Sci. Anthrop. 2018, 6, 39. [Google Scholar] [CrossRef]
- Glanz, J.; Carey, B.; Holder, J.; Watkins, D.; Valentino-DeVries, J.; Rojas, R.; Leather, L. Where America Didn’t Stay Home Even as the Virus Spread. Available online: https://www.nytimes.com/interactive/2020/04/02/us/coronavirus-social-distancing.html (accessed on 12 May 2020).
- Shaver, K. “Quarantine Fatigue”: Researchers Find More Americans Venturing out against Coronavirus Stay-at-home Orders. Available online: https://www.washingtonpost.com/local/trafficandcommuting/quarantine-fatigue-researchers-find-more-americans-venturing-out-against-coronavirus-stay-at-home-orders/2020/04/25/fa1f01b2-84a3-11ea-a3eb-e9fc93160703_story.html (accessed on 13 May 2020).
- Woodall, G.M.; Smith, R.L. The Air Toxics Health Effects Database (ATHED). Toxicol. Appl. Pharmacol. 2008, 233, 20–24. [Google Scholar] [CrossRef] [PubMed]
Figure 1.
Ambient air monitoring stations in the Memphis Metropolitan Area.

Figure 2.
Comparison of average concentrations of PM2.5, NO2, and ozone in the Memphis Metropolitan Area between lockdown period (25 March–4 May, 2020) and the baseline period (25 March–4 May, 2017–2019). The green lines indicate the annual national standards. The error bars indicate the standard deviations.

Figure 3.
Comparison of average concentrations of PM2.5, NO2, and ozone in the Memphis Metropolitan Area between the lockdown period (25 March–4 May, 2020) and the prior month (25 February–24 March, 2020). The green lines indicate the annual national standards. The error bars indicate the standard deviations.


Table 1.
Comparisons of PM2.5, NO2, and ozone concentrations during the lockdown and baseline periods.
Table 1.
Comparisons of PM2.5, NO2, and ozone concentrations during the lockdown and baseline periods.
| Air Pollutant | PM2.5 (μg/m3) | NO2 (ppb) | Ozone (ppb) | ||||||
|---|---|---|---|---|---|---|---|---|---|
| Site | Ncore | Hernando | Marion | Marion | Ncore | Hernando | Marion | Frayser | Orgill |
| Lockdown (25 March–4 May, 2020) | |||||||||
| Mean (±SD) | 7.05 (±2.56) | 8.37 (±3.01) | 8.03 (±2.29) | 18.6 (±10.41) | 43.1 (±7.21) | 42.9 (±7.98) | 42.3 (±8.01) | 41.5 (±8.30) | 43.1 (±7.20) |
| Baseline (25 March–4 May, 2017–2019) | |||||||||
| Mean (±SD) | 7.08 (±2.37) | 7.57 (±3.06) | 7.65 (±2.57) | 16.5 (±9.37) | 44.6 (±8.33) | 44.8 (±8.80) | 44.7 (±8.52) | 43.0 (±8.75) | 45.2 (±8.77) |
| Crude model | |||||||||
| Lockdown (p-value) | −0.03 (0.94) | 0.80 (0.15) | 0.37 (0.41) | 2.05 (0.58) | −1.42 (0.33) | -1.83 (0.25) | −2.45 (0.11) | −1.49 (0.34) | −2.06 (0.18) |
| Full model | |||||||||
| Lockdown (p-value) | −0.12 (0.77) | 0.81 (0.13) | 0.56 (0.21) | 2.11 (0.51) | −1.71 (0.23) | −2.14 (0.16) | -3.06 (0.06) | −1.58 (0.30) | −2.10 (0.16) |
| Temperature (p-value) | 0.14 (<0.0001) | 0.07 (0.01) | 0.08 (0.0004) | −0.10 (0.26) | 0.02 (0.78) | −0.29 (0.0004) | −0.01 (0.9) | −0.01 (0.89) | −0.02 (0.80) |
| Wind speed (p-value) | −0.04 (0.55) | 0.02 (0.77) | 0.08 (0.14) | −1.18 (<0.0001) | −0.24 (0.23) | 0.04 (0.86) | −0.08 (0.67) | −0.02 (0.91) | 0.01 (0.96) |
| Precipitation (p-value) | -0.40 (0.26) | −1.93 (<0.0001) | −1.11 (0.004) | −2.37 (0.09) | −4.50 (0.0004) | −4.11 (0.0036) | −2.83 (0.034) | −4.77 (0.0004) | −4.18 (0.002) |
Table 2.
Pearson correlation coefficients (Rs) and coefficients of divergence (CODs) of PM2.5 concentrations among Ncore, Hernando, and Marion sites.
Table 2.
Pearson correlation coefficients (Rs) and coefficients of divergence (CODs) of PM2.5 concentrations among Ncore, Hernando, and Marion sites.
| Pearson Correlation Coefficient (R) | ||||
|---|---|---|---|---|
| Site | Ncore | Hernando | Marion | |
| COD | Ncore | 0.77 | 0.82 | |
| Hernando | 0.13 | 0.80 | ||
| Marion | 0.10 | 0.11 | ||
Table 3.
Pearson correlation coefficients (Rs) and coefficients of divergence (CODs) of ozone concentrations among five sites in the Memphis Metropolitan Area.
Table 3.
Pearson correlation coefficients (Rs) and coefficients of divergence (CODs) of ozone concentrations among five sites in the Memphis Metropolitan Area.
| Pearson Correlation Coefficient (R) | ||||||
|---|---|---|---|---|---|---|
| Site | Ncore | Hernando | Marion | Frayser | Orgill | |
| COD | Ncore | 0.96 | 0.94 | 0.96 | 0.95 | |
| Hernando | 0.04 | 0.90 | 0.92 | 0.90 | ||
| Marion | 0.04 | 0.05 | 0.97 | 0.95 | ||
| Frayser | 0.04 | 0.05 | 0.03 | 0.96 | ||
| Orgill | 0.03 | 0.05 | 0.03 | 0.04 | ||
Table 4.
Comparisons of PM2.5, NO2, and ozone concentrations during the lockdown and prior month.
| Air Pollutants | PM2.5 (μg/m3) | NO2 (ppb) | Ozone (ppb) | ||||||
|---|---|---|---|---|---|---|---|---|---|
| Site | Ncore | Hernando | Marion | Marion | Ncore | Hernando | Marion | Frayser | Orgill |
| Lockdown (25 March–4 May, 2020) | |||||||||
| Mean (±SD) | 7.05 (±2.56) | 8.37 (±3.01) | 8.03 (±2.29) | 18.6 (±10.41) | 43.1 (±7.21) | 42.9 (±7.98) | 42.3 (±8.01) | 41.5 (±8.30) | 43.1 (±7.20) |
| Prior month (25 February–24 March, 2020) | |||||||||
| Mean (±SD) | 5.75 (±1.96) | 6.94 (±2.05) | 6.70 (±1.77) | 18.7 (±10.9) | 33.2 (±8.56) | 31.6 (±9.19) | 31.2 (±8.95) | 31.8 (±9.07) | 33.3 (±10.1) |
| Crude model | |||||||||
| Lockdown (p-value) | 1.30 (0.03) | 1.42 (0.03) | 1.30 (0.01) | −0.08 (0.99) | 9.97 (<0.0001) | 11.3 (<0.0001) | 11.1 (<0.0001) | 9.67 (<0.0001) | 9.78 (<0.0001) |
| Full model | |||||||||
| Lockdown (p-value) | −0.03 (0.95) | 0.23 (0.75) | 0.52 (0.39) | 0.92 (0.85) | 11.6 (<0.0001) | 14.2 (<0.0001) | 13.2 (<0.0001) | 11.9 (<0.0001) | 11.3 (<0.0001) |
| Temperature (p-value) | 0.17 (<0.0001) | 0.13 (0.006) | 0.10 (0.008) | −0.06 (0.79) | −0.21 (0.12) | −0.42 (0.02) | −0.31 (0.03) | −0.30 (0.06) | −0.18 (0.24) |
| Wind speed (p-value) | −0.11 (0.24) | −0.16 (0.17) | 0.03 (0.71) | −1.57 (0.005) | 0.45 (0.19) | 0.74 (0.07) | 0.57 (0.11) | 0.78 (0.04) | 0.55 (0.15) |
| Precipitation (p-value) | −0.16 (0.79) | −1.29 (0.07) | −0.73 (0.25) | −1.35 (0.76) | −5.48 (0.02) | −2.43 (0.30) | −3.77 (0.14) | −6.55 (0.009) | −4.67 (0.06) |
© 2020 by the authors. Licensee MDPI, Basel, Switzerland. This article is an open access article distributed under the terms and conditions of the Creative Commons Attribution (CC BY) license (http://creativecommons.org/licenses/by/4.0/).
Share and Cite
MDPI and ACS Style
Jia, C.; Fu, X.; Bartelli, D.; Smith, L. Insignificant Impact of the “Stay-At-Home” Order on Ambient Air Quality in the Memphis Metropolitan Area, U.S.A. Atmosphere 2020, 11, 630. https://0-doi-org.brum.beds.ac.uk/10.3390/atmos11060630
AMA Style
Jia C, Fu X, Bartelli D, Smith L. Insignificant Impact of the “Stay-At-Home” Order on Ambient Air Quality in the Memphis Metropolitan Area, U.S.A. Atmosphere. 2020; 11(6):630. https://0-doi-org.brum.beds.ac.uk/10.3390/atmos11060630
Chicago/Turabian StyleJia, Chunrong, Xianqiang Fu, Debra Bartelli, and Larry Smith. 2020. "Insignificant Impact of the “Stay-At-Home” Order on Ambient Air Quality in the Memphis Metropolitan Area, U.S.A." Atmosphere 11, no. 6: 630. https://0-doi-org.brum.beds.ac.uk/10.3390/atmos11060630
Note that from the first issue of 2016, this journal uses article numbers instead of page numbers. See further details here.