Tree Surface Temperature in a Primary Tropical Rain Forest
by
Qinghai Song
1,2,3,*, 
Chenna Sun
1,2,3,4,
Yun Deng
1,2,4,
He Bai
1,2,3,4,
Yiping Zhang
1,2,3,*,
Hui Yu
1,2,3,4,
Jing Zhang
1,2,3,4,
Liqing Sha
1,2,3,
Wenjun Zhou
1,2,3 and
Yuntong Liu
1,2,3 1
CAS Key Laboratory of Tropical Forest Ecology, Xishuangbanna Tropical Botanical Garden, Chinese Academy of Sciences, Menglun 666303, China
2
Center for Plant Ecology, Core Botanical Gardens, Chinese Academy of Sciences, Xishuangbanna 666303, China
3
Global Change Research Group, Xishuangbanna Tropical Botanical Garden, Chinese Academy of Sciences, Menglun 666303, China
4
Department of Life Sciences, University of Chinese Academy of Sciences, Beijing 100049, China
*
Authors to whom correspondence should be addressed.
Atmosphere 2020, 11(8), 798; https://0-doi-org.brum.beds.ac.uk/10.3390/atmos11080798
Submission received: 29 June 2020
/
Revised: 21 July 2020
/
Accepted: 23 July 2020
/
Published: 29 July 2020
(This article belongs to the Special Issue Plant Adaptation to Global Climate Change)
Abstract
:As one of the important factors affecting plant productivity and plant distribution, temperature also affects the physiological and ecological characteristics of plants to a large extent. We report canopy leaf temperature distribution over a 36 m tall primary tropical rain forest and samplings of 28 tree species in SW China by means of two high resolution thermal cameras (P25, Flir systems, Wilsonville, OR, USA). The leaf temperature of dominant tree Species Pometia tomentosa was the highest (31.8 °C), 10.2 °C higher than that of tree species Mezzettipsis creaghii (21.6 °C). The mean leaf to air temperature difference (Tc–Ta) of Pometia tomentosa was the highest (6.4 K), the second highest was Barringtonia pendula (6.1 K), and Mezzettipsis creaghii had the lowest (Tc–Ta) (1.9K). (Tc–Ta) of tree species with smaller leaves and larger stomatal conductance was lowly sensitive to climate factors. Leaf size and stomatal conductance together decided the effect of climate change to (Tc–Ta) of the different tree species. We have shown that the composition of tree species in tropical rain forest areas is important to the climate through our research.
1. Introduction
There are many factors that affect plant productivity and plant distribution, such as climate, topography, water, soil, microorganisms, and so on. However, as one of the important factors affecting plant productivity and plant distribution, temperature also affects the physiological and ecological characteristics of plants to a large extent. Temperature influences rates of plant photosynthesis and respiration, litter decomposition and microbial activity [1], and other biological processes will affect the fixation and release of carbon dioxide [2]. On the other hand, leaf temperature is also affected by stomatal control of transpiration [3] and traits affecting heat exchange [4]. For example, leaf size, leaf shape, petiole length, and other traits can affect leaf temperature [5,6,7].As a result, global warming is expected to affect carbon pools on land, increasing the amount of carbon dioxide in the atmosphere [8,9]. The rate of ecosystem respiration will increase with increasing temperature. At the same time, rising temperatures may lead to plant stomata closing, thus reducing the primary productivity of tropical rainforest ecosystems.
With the global biodiversity crisis becoming increasingly serious, research on plant diversity and its role in ecosystem function is becoming increasingly important in ecology. Due to the good combination of precipitation and temperature in the tropical rain forest area, the plant types in the tropical rain forest area are also very rich. Moist rainforests cover about 6~7% of the earth’s surface, but they are home to more than half of all life on earth [10]. According to research, the tropical rainforest contains the largest collection of living plant species in the world [9]. They contain 40% of the world’s forest biomass [10] and soil carbon [11]. Especially on a small scale, dominant tree species in a tropical rain forest community have a great influence on forest carbon sequestration [12].
Due to the incomplete development of technology, the early research mostly focused on the microhabitat temperature measurement of single tree species. Recently, new digital technologies in combination with thermal (IR) transmission lenses have been developed to accurately measure actual temperature regimes in canopies. For example, Kumar et al. conducted field experiments on farms in central and southern India (18°9′ N, 74°28′ E). They used thermal imaging to assess the canopy temperature differences among different genotypes of soybeans to further differentiate the soybean’s ability to withstand water stress [13]. Padhi et al. used infrared thermal imaging technology to measure the canopy temperature of cotton fields at Kingsthorpe Research Station (27°30′44′′ S,151°46′55′′ E), thus providing a basis for assessing crop water deficit pressure using stomatal conductance index [14]. Daniel and Körner assessed, by using a combination of IR imagery, both surface and root zone temperatures on a landscape scale in the Swiss Alps [13]. In Switzerland, leaf surface temperatures vary widely between species in mixed deciduous forests and urban environments [14,15]. Stomatal conductance, the key factor controlling leaf temperature, varies greatly in ten tropical forests [3]. Thus, we can see that different plants have different canopy temperatures. Moreover, the temperature of the crown is closely related to the stomatal conductance and water content of the leaves. Canopy temperatures have a series of uncertainties in their variations, and controlling environmental factors [3,4]. Therefore, we hypothesized that canopy temperatures of broadleaved trees in primordial tropical forests may differ significantly among species. According to the 2007 report by the Intergovernmental Panel on Climate Change (IPCC), global temperatures are expected to rise from 2.4 to 5.5 °C as carbon dioxide levels in the atmosphere increase [16]. This global warming may be related to changes in solar radiation, precipitation, and other micrometeorological factors on a regional or ecosystem scale. Studying the responses of different tree species to these climatic stress factors is helpful to understand the dynamics of vegetation in the context of global warming [14,15].
Little is known about how species-scale variation in leaf temperature influences community-scale variation in canopy temperature [14]. Our study has two main purposes (1) to study the spatial and temporal distribution of species under specific canopy temperature, (2) to discuss the possible influence of future climate change on canopy temperature difference (CTD). Through this study, we want to explore the significance of forest tree species’ composition on canopy heat accumulation.
2. Materials and Methods
2.1. Site Description and Studied Species
Our experiment was conducted in a tropical rain forest in Xishuangbanna, southwestern China (21°55′39′′ N, 101°15′ 55′′ E, elevation 750 m). Xishuangbanna Nature Reserve Authority is mainly responsible for protecting the reserve forest sites. Our institute workers were approved by Xishuangbanna Nature Reserve Authority to conduct experiments in the site. There were no specific permissions required for the activities. The height of the rainforest canopy is about 36 m. The stand has a stem density of 964 trees ha−1 (diameter ≥ 5 cm) and a total basal area of 32.28 m2 ha−1; the number of tree species in the plot was 179 in 2007 [17].
2.2. Dominant Mature Tree Species
The important value of the five tree species ranked in the top five over the whole tree species [17]. So, we selected the top five canopy mature tree species in this rainforest which is dominated by Pometia tomentosa, Barringtonia macrostachya, Gironniera subaequalis, Ardisia tenera, and Mezzettiopsis creaghi, respectively [18]. The canopy temperature characteristics of the five tree species are shown in Table 1. The sites did not involve endangered or protected species.
2.3. Saplings of 28 Tree Species
We also selected samplings of 28 tree species in the lower layer of the forest that could be adequately replicated. Five tree samples of each tree species were measured.
2.4. Thermal Imaging of the Canopy Dominant Tree Species
A 70 m tower was established at the center of the plot. In this study, two thermal imaging cameras (P25, Flir systems, Wilsonville, OR, USA) with a resolution of 320 × 420 pixels were used to determine the canopy temperature of the dominant tree species. Two thermal imaging cameras (P25, Flir systems, Wilsonville, OR, USA) were mounted 3 to 5 m above the canopy. In addition, exposed and certain sized canopies were selected to measure the average canopy surface temperature. The camera (P25, Flir systems, Wilsonville, OR, USA) software was used to analyze the canopy surface temperature of the measured images. This provided us with 76,800 temperature data with a resolution of 0.1K under sunny conditions. We only cut three leaves in a tree to analyze the leaf stomatal conductance.
2.5. Thermal Imaging and Stomatal Conductance of 28 Tree Species Samplings
By measuring the temperature of the leaves and the temperature of the air, we calculated the difference between the two average temperatures. In addition, we measured the leaf stomatal conductance of samplings of 28 tree species. All measurements were conducted on 13–15 June 2018, three meteorologically similar days (from 09:30 to 13:00). We also used two thermal cameras (P25, Flir systems, Wilsonville, OR, USA) to measure the leaf temperature. Then, the leaf stomatal conductance was measured with a portable photosynthesis system (LI-6400, Li-COR, Lincoln, NE, USA).
2.6. Environmental Data and Soil Moisture
In the corresponding period, wind speed (A100R, Vector, UK), air temperature and humidity (HMP45C, Vaisala, Vantaa, Finland), photosynthetically active radiation (LI-190SB, Li-COR, Lincoln, NE, USA), net radiation (CNR-1, Kipp & Zonen, The Netherlands), soil temperature (TCAV, Scientific Inc., Logan, UT, USA), and soil moisture (CS616, Campbell Scientific Inc., Logan, UT, USA) were measured simultaneously. All these factors were sampled at 0.5 Hz and the data were stored in the data logger. The 30 min average was also calculated and stored by the data logger (CR1000, Campbell Scientific Inc., Logan, UT, USA).
The canopy temperature difference was calculated by using the canopy surface temperature and air temperature at the same time.
2.7. Evaluate the Canopy Temperature Change
In order to explore the possible influence of future climate change on the canopy temperature difference (CTD), we used Function (1) to evaluate the canopy temperature change [19].
where Pa is atmospheric pressure (kPa), Rn is net radiation (W m−2), G is soil heat flux (W m−2), gc is canopy stomatal conductance (mmol m−2 s−1), gH is boundary layer heat conductance (mmol m−2 s−1), is the specific heat of air at constant pressure (J mol−1 K−1), λ is latent heat of vaporization (J mol−1), is the vapor pressure deficit (kPa), and Pa is atmospheric pressure (kPa).
2.8. Statistical and Analytical Methods
All data processing and statistical analyses were conducted using the Statistical Analysis System (SPSS 26.0 Software, IBM, Armonk, NY, USA). Significant differences between means were tested using one-way analysis of variance (ANOVA). Significant effects of the main meteorological elements on the canopy temperature difference rates were determined by multiple linear regressions.
3. Results
3.1. Environmental Conditions
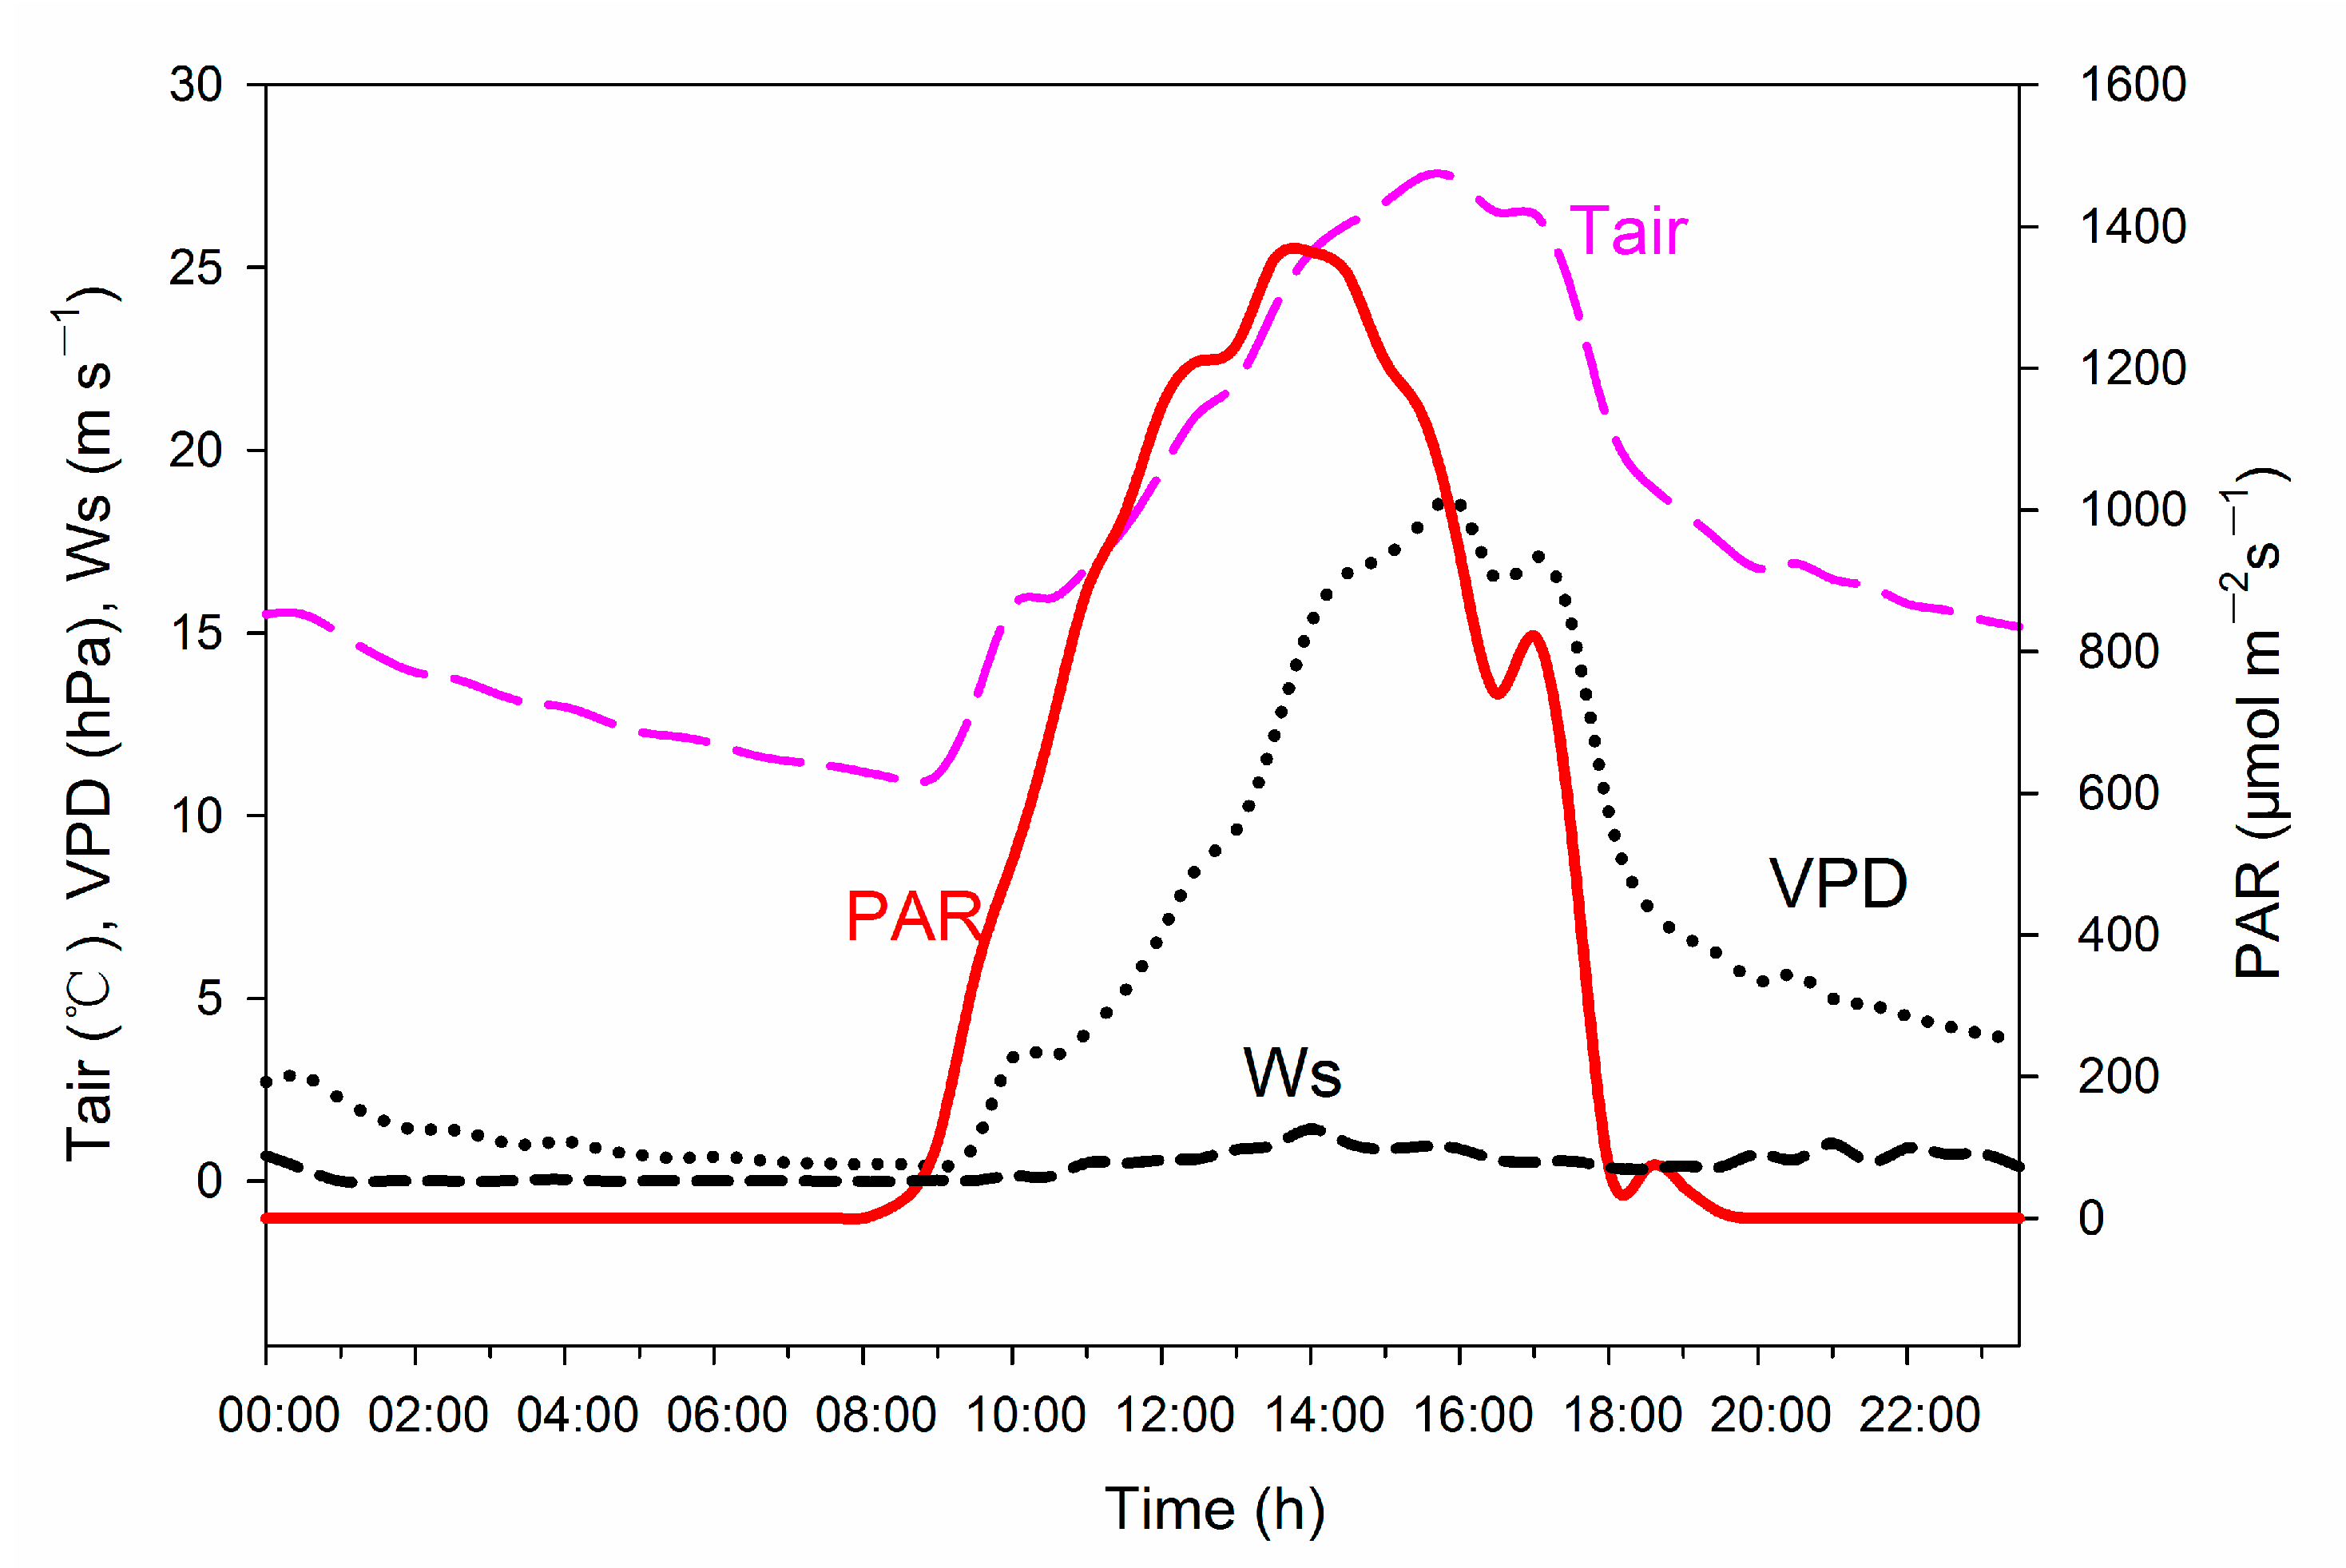
Figure 1 showed diurnal variations in the main meteorological elements during the observational period. The maximum air temperature was 27.6 °C. The maximum photosynthetic active radiation (PAR) was 1380 μmol m−2 s−1. Wind speed was very low in this site.
Soil moisture has a strong influence on the plant surface temperature. During the measurement, the soil moisture content at 5 cm depth was 12.5%. This is an area with very low soil moisture throughout the year, which means trees can tolerate drought.
3.2. Spatial and Temporal Temperature Distribution of the Dominant Mature Tree Species
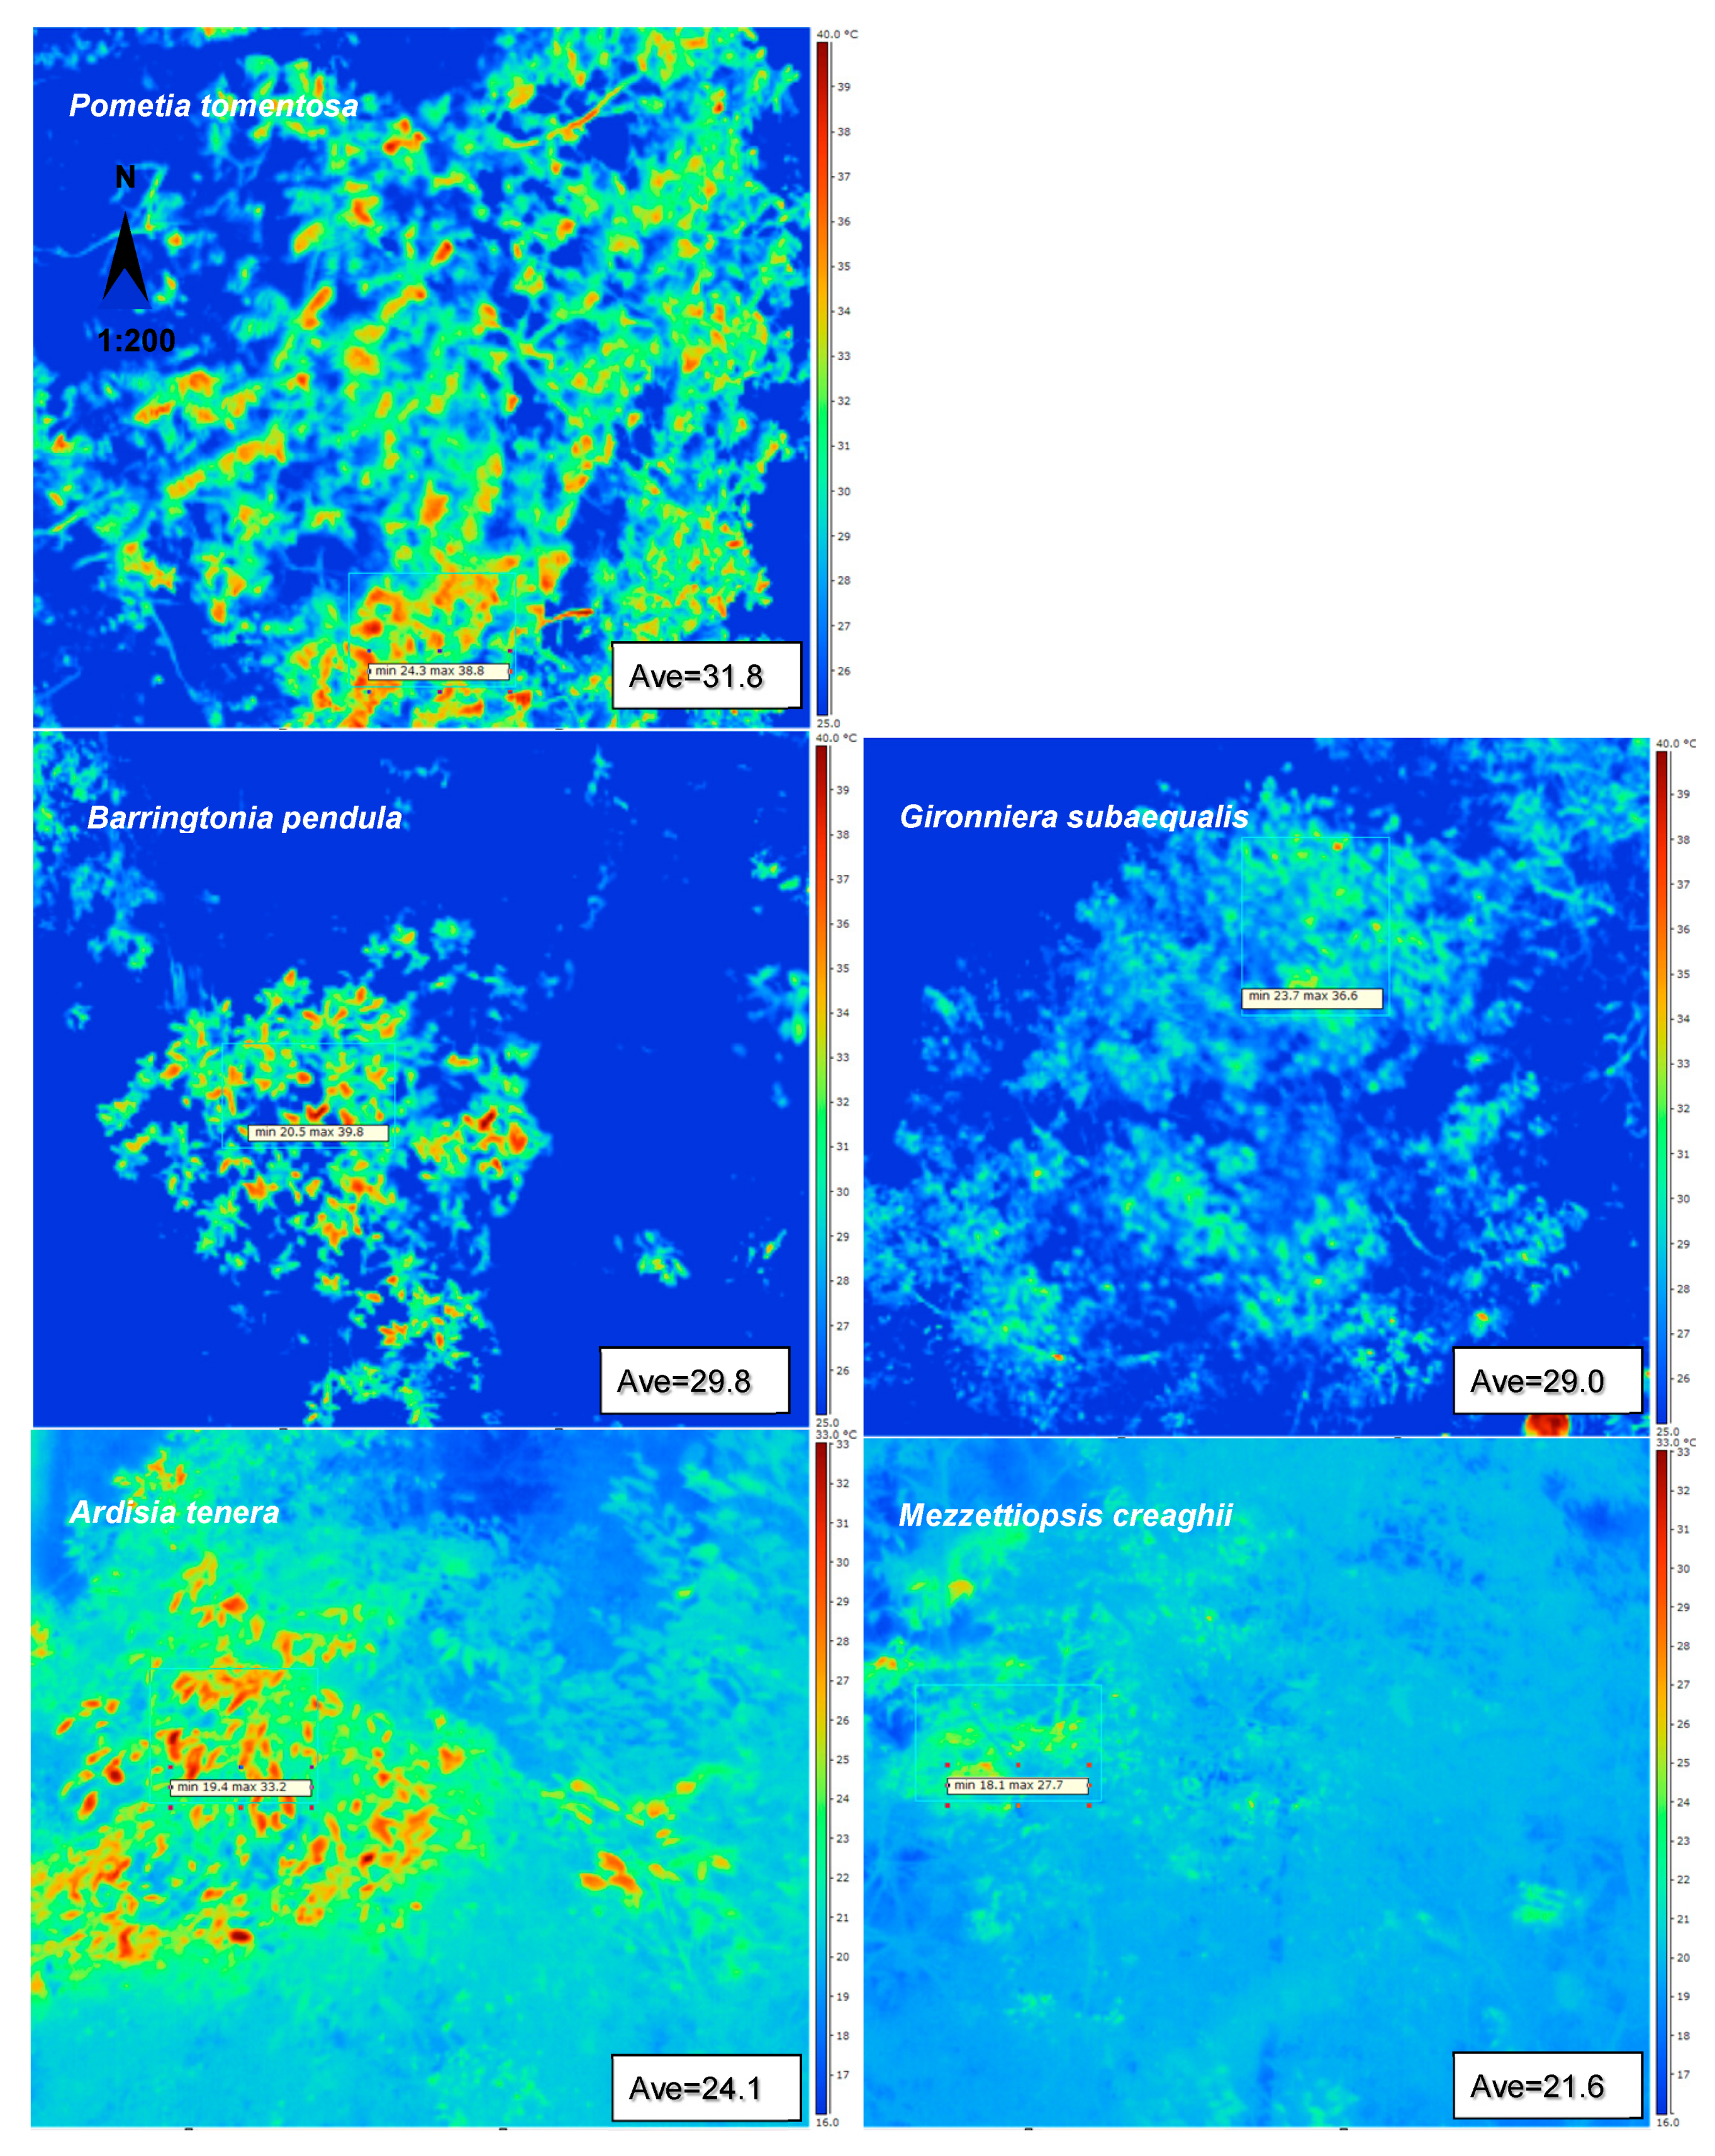
Canopies were scanned on 4 February, 2018 from 13:55 to 14:05 true local time. Figure 2 shows the pattern of the mean temperature of the three layers at 14:00. The mean leaf temperature of Pometia tomentosa in upper layer was the highest (31.8 °C), 10.2 °C higher than that of the tree species Mezzettipsis creaghii (21.6 °C) in the lower layer.
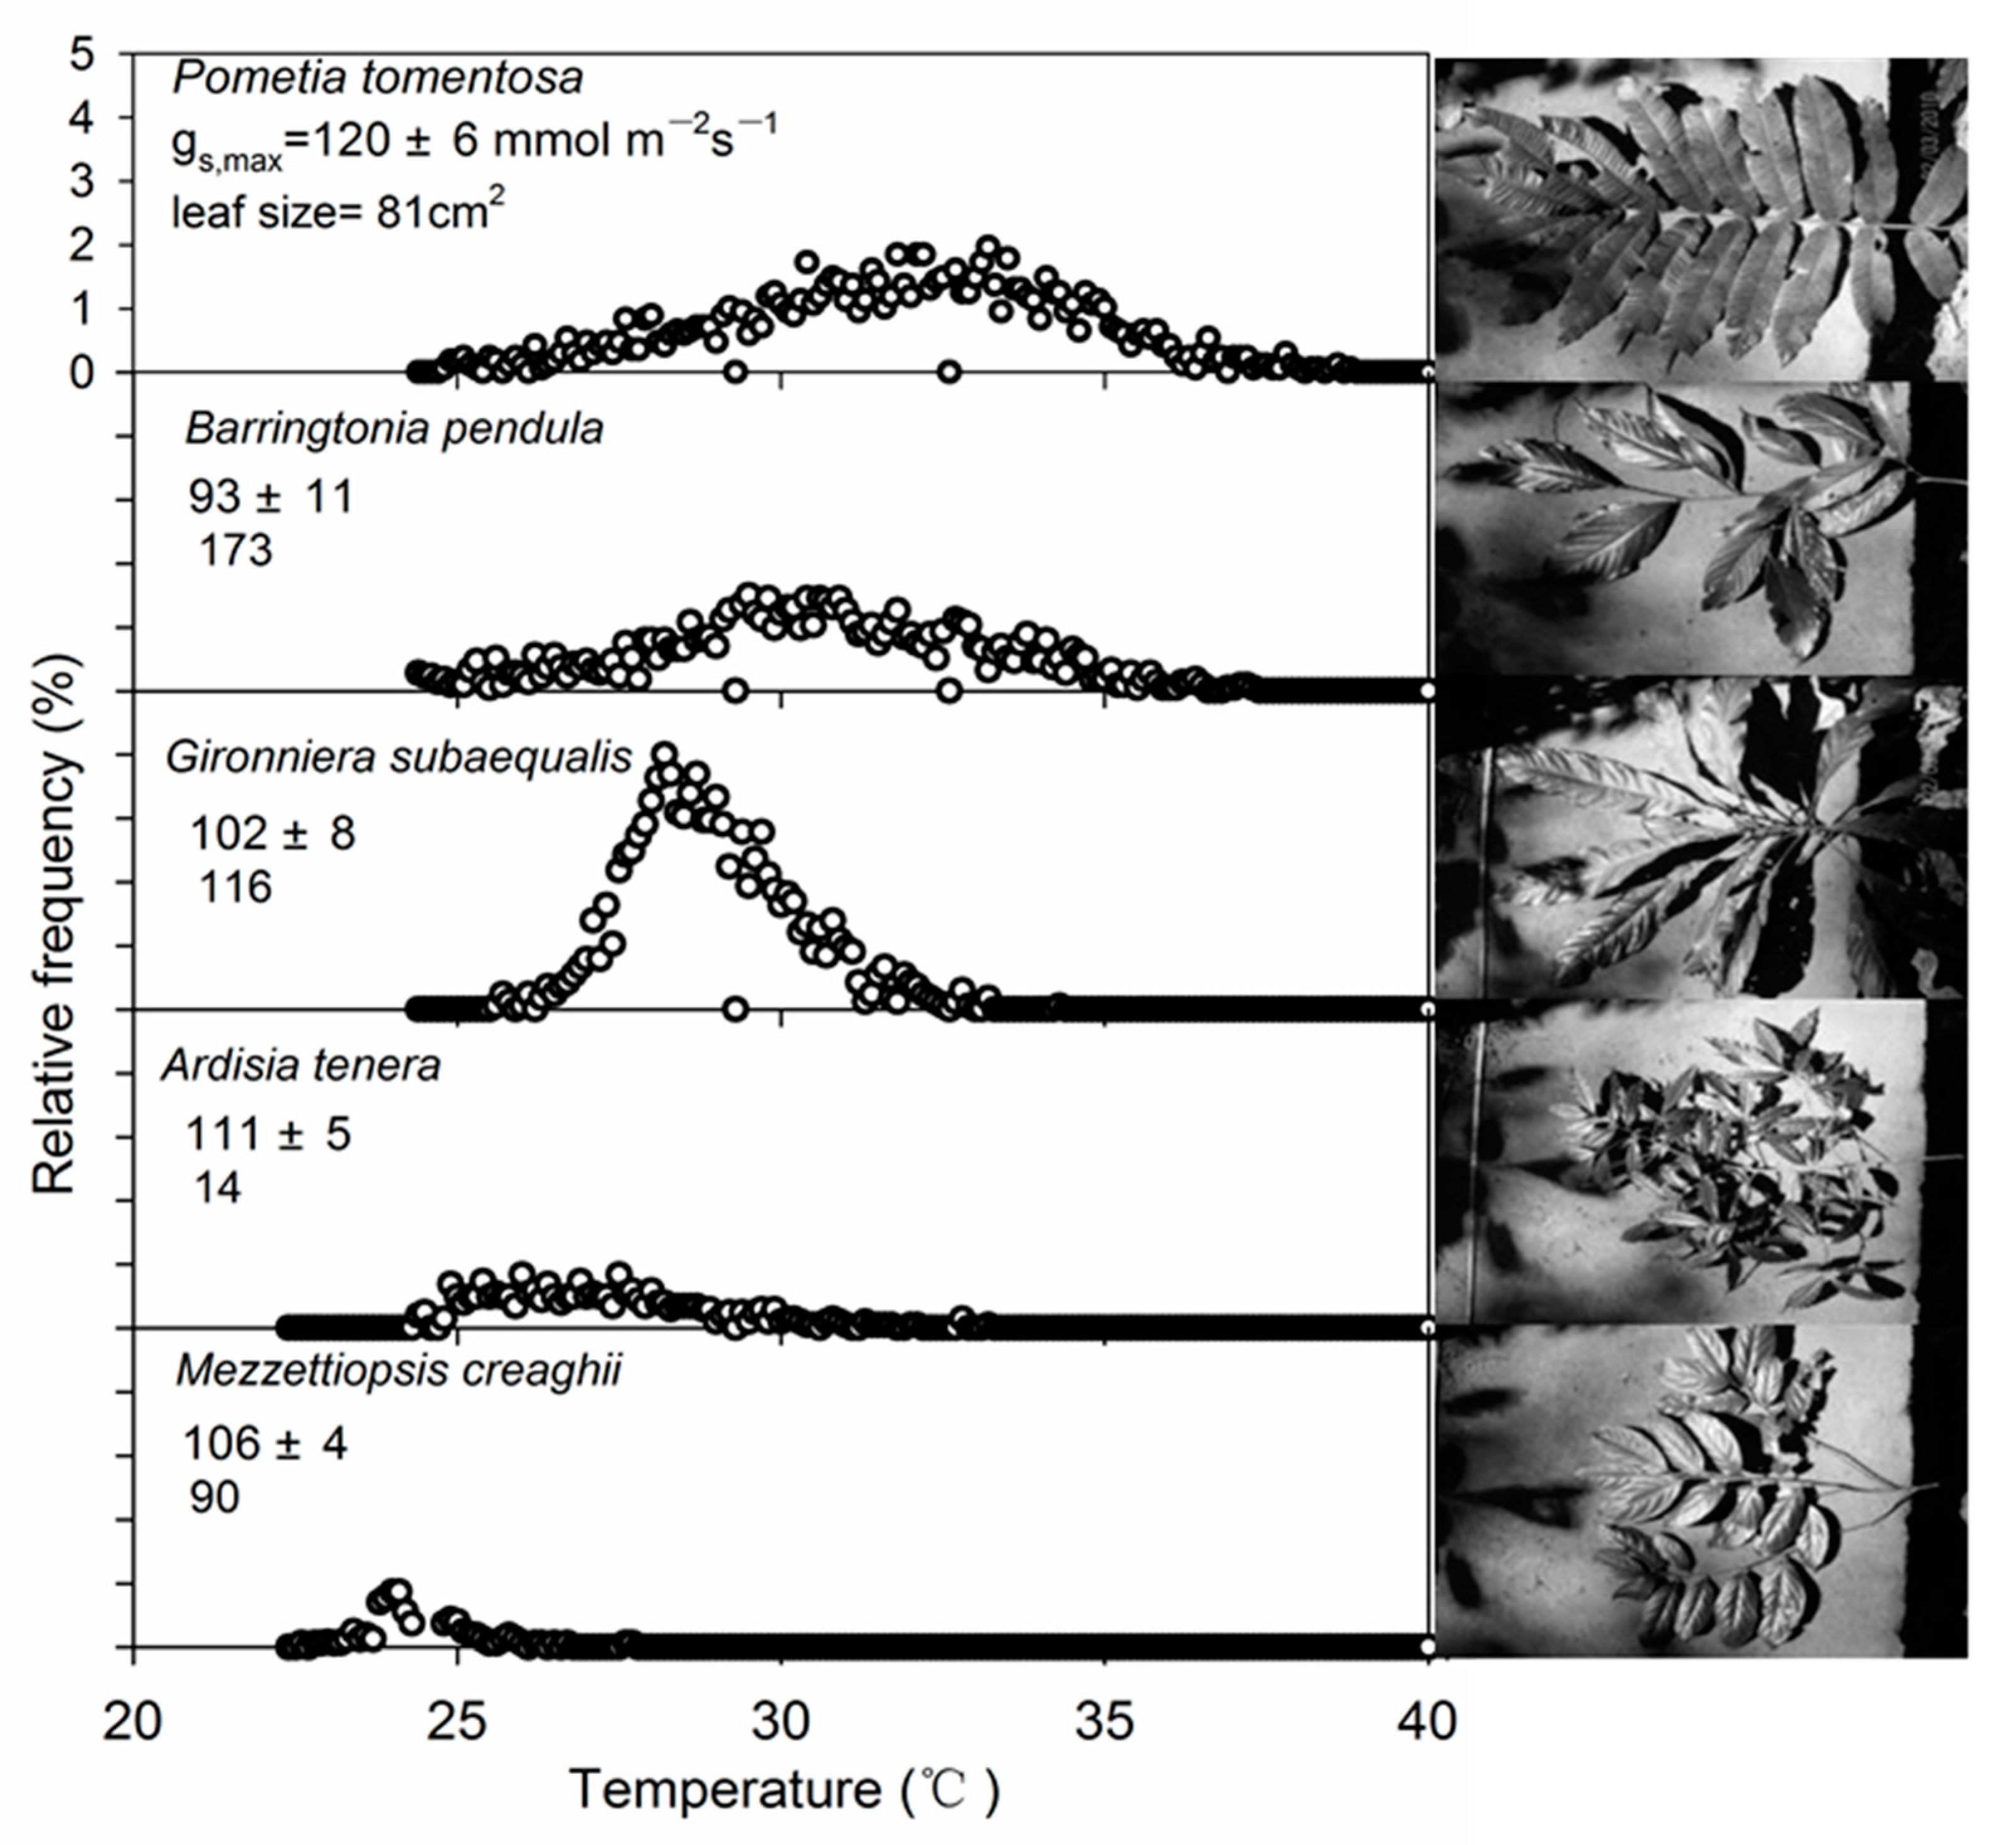
The maximum stomatal conductance of the five species ranged from 93~120 mmol m−2 s−1 (Figure 3), and there were significant differences between the five species. The leaf size of the five species ranged from 14~173 cm2 (Figure 3). With the increase in temperature, the relative frequency of Gironniera subaequalis changed most obviously, and reached the maximum at 28 °C. The change of the other four trees was relatively gentle (Figure 3).
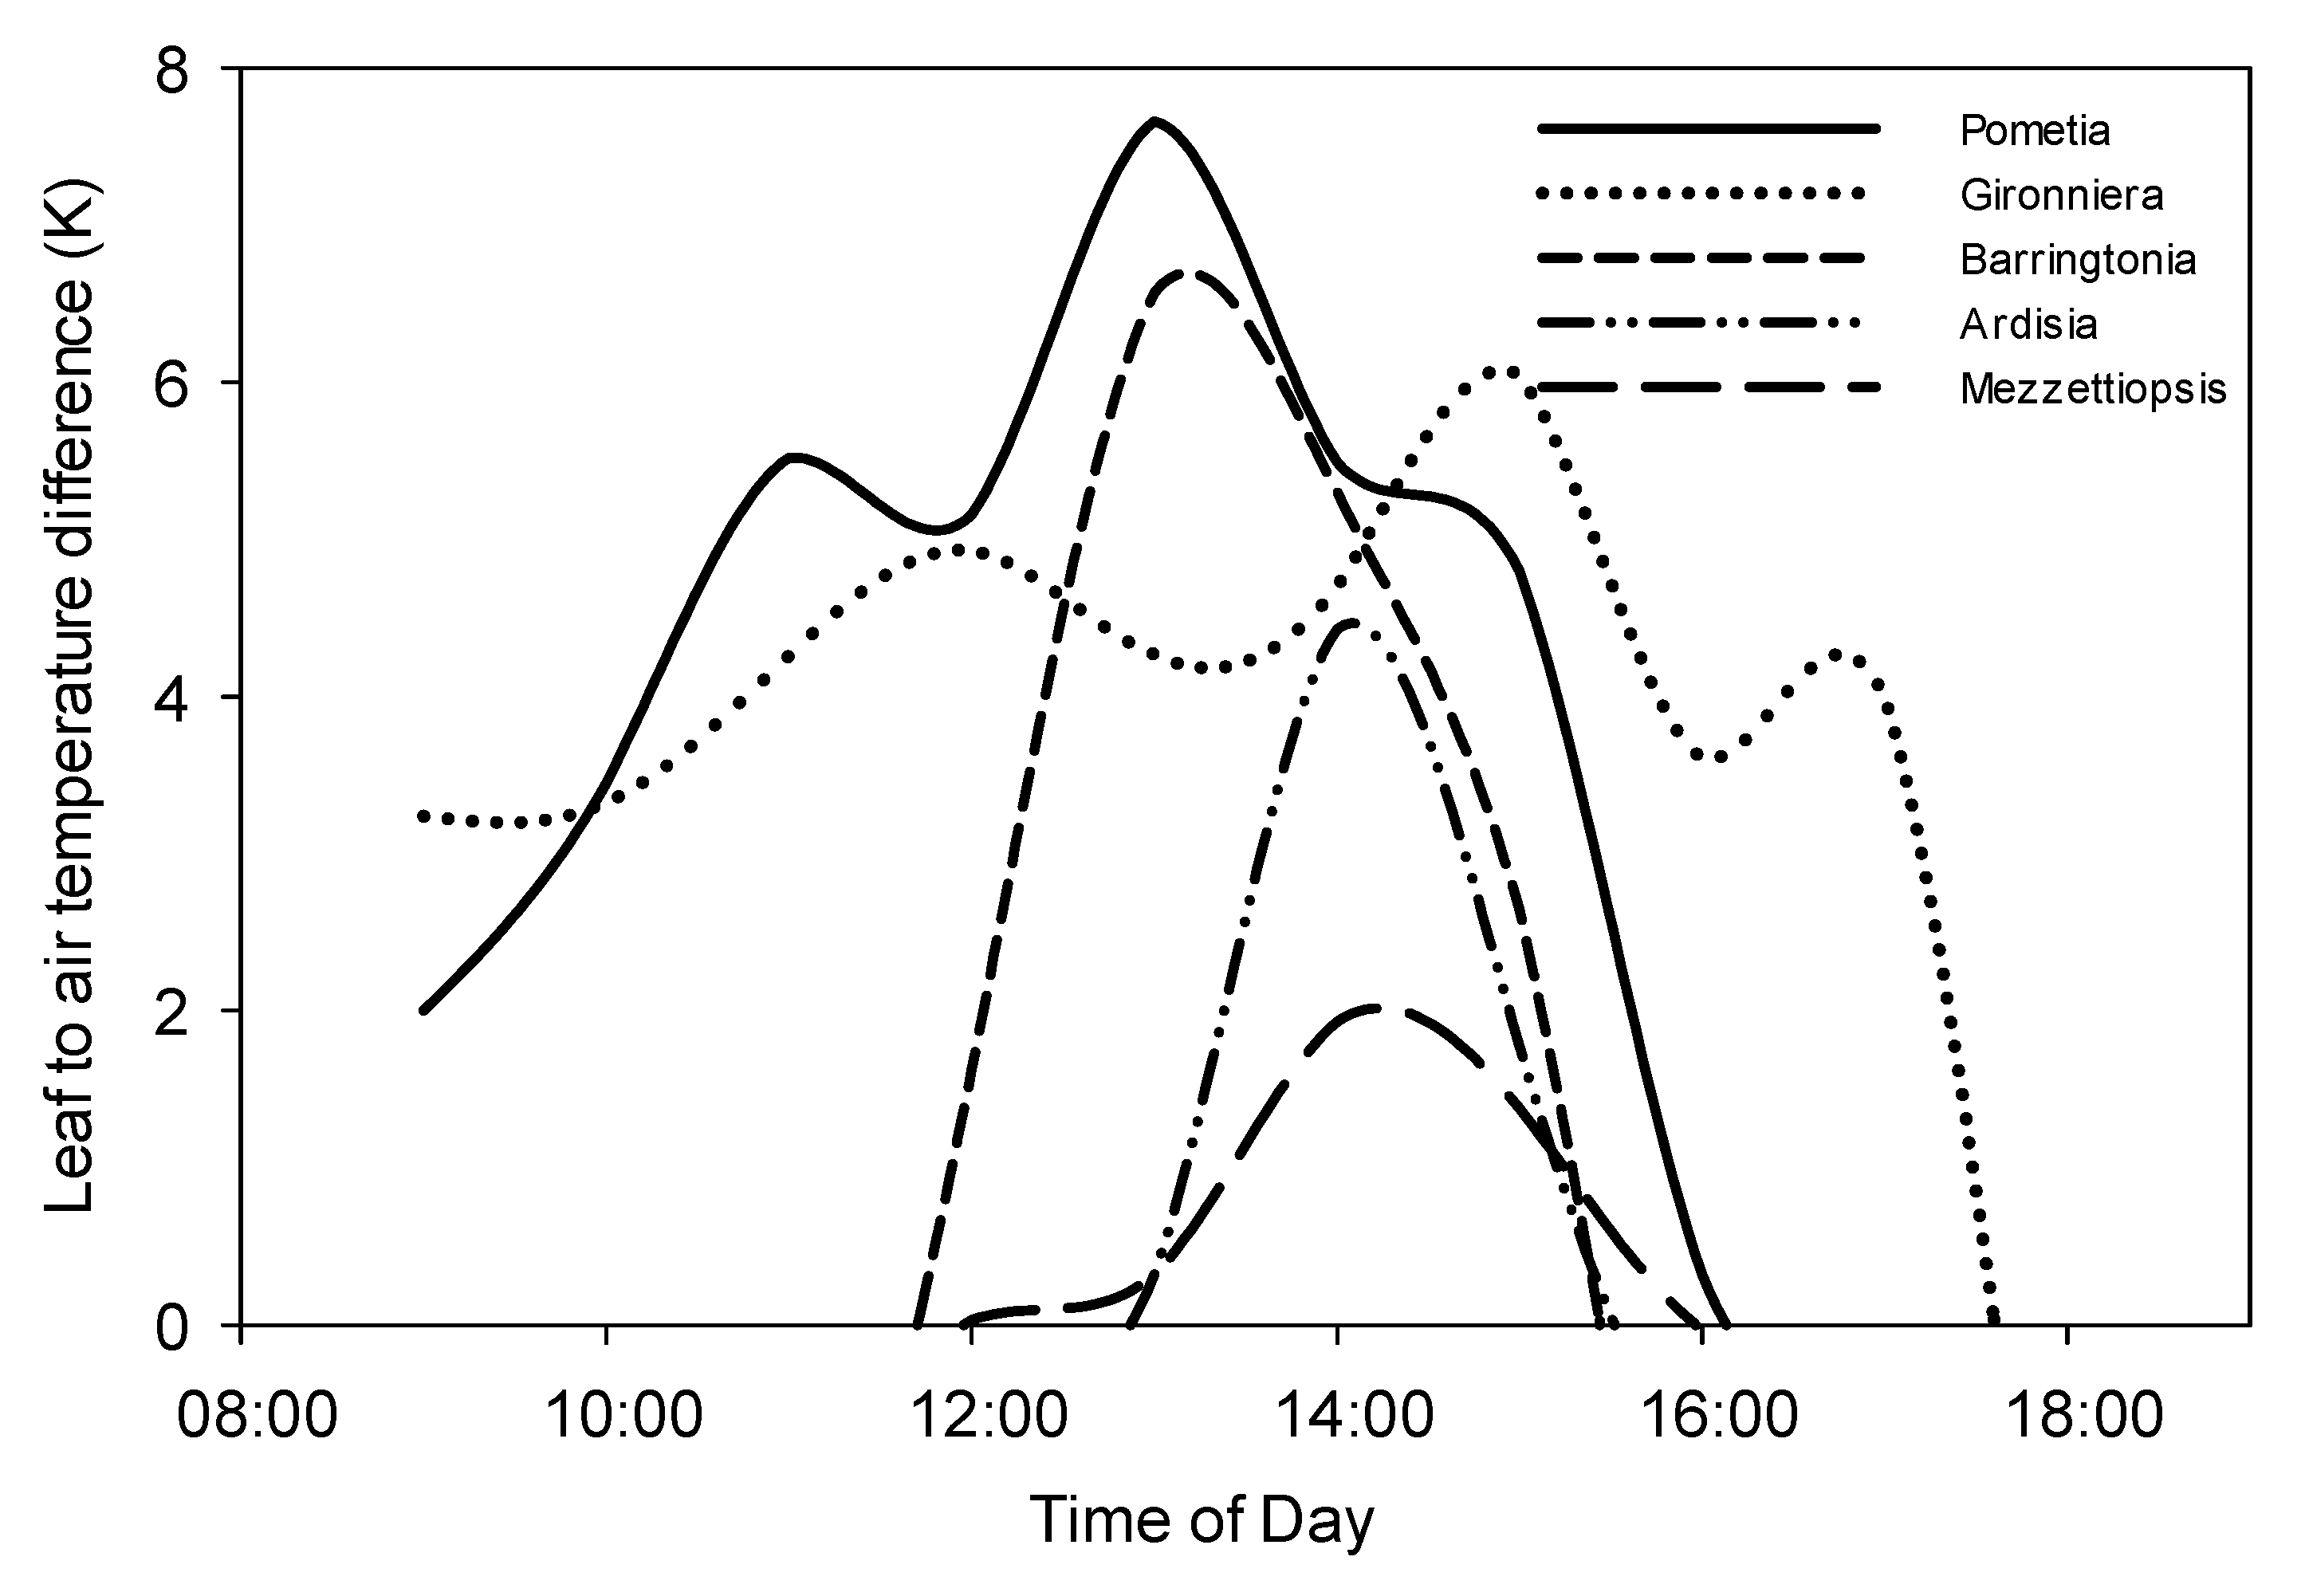
We measured the mean (Tc–Ta) on 4 February, 2018. The mean (Tc–Ta) consisted with the photo flux density patterns (Figure 3 and Figure 4). The five species of the three layers monitored on that day showed significant differences in (Tc–Ta). Pometia tomentosa had the highest (Tc–Ta) (6.4 K), the second highest was Barringtonia pendula (6.1 K), and Mezzettipsis creaghii had the lowest (Tc–Ta) (1.9K) (Figure 4).
We found that the temperature change within the canopies was very significant (p < 0.01) (Figure 4). The canopy temperature difference of Pometia tomentosa and Barringtonia macrostachya reached the highest at about 13:00. However, the canopy temperature difference of Gironniera subaequalis reached its maximum two hours later (at about 15:00) (Figure 4).
3.3. (Tc–Ta) Variations in a Changing Climate
(Tc–Ta) ranged from nearly 0 K (Barringtonia racemosa (L.) Spreng.) to 3 K (Swietenia mahagoni (L.) Jacq.), showing that the mean leaf temperatures of 28 tree species had a highly species-specific manner (Table 2). The mean leaf temperature cannot be fully or solely explained by stomatal conductance or leaf area. This is because of the complex feedback effect between leaf temperature and climatic conditions or leaf function [20].
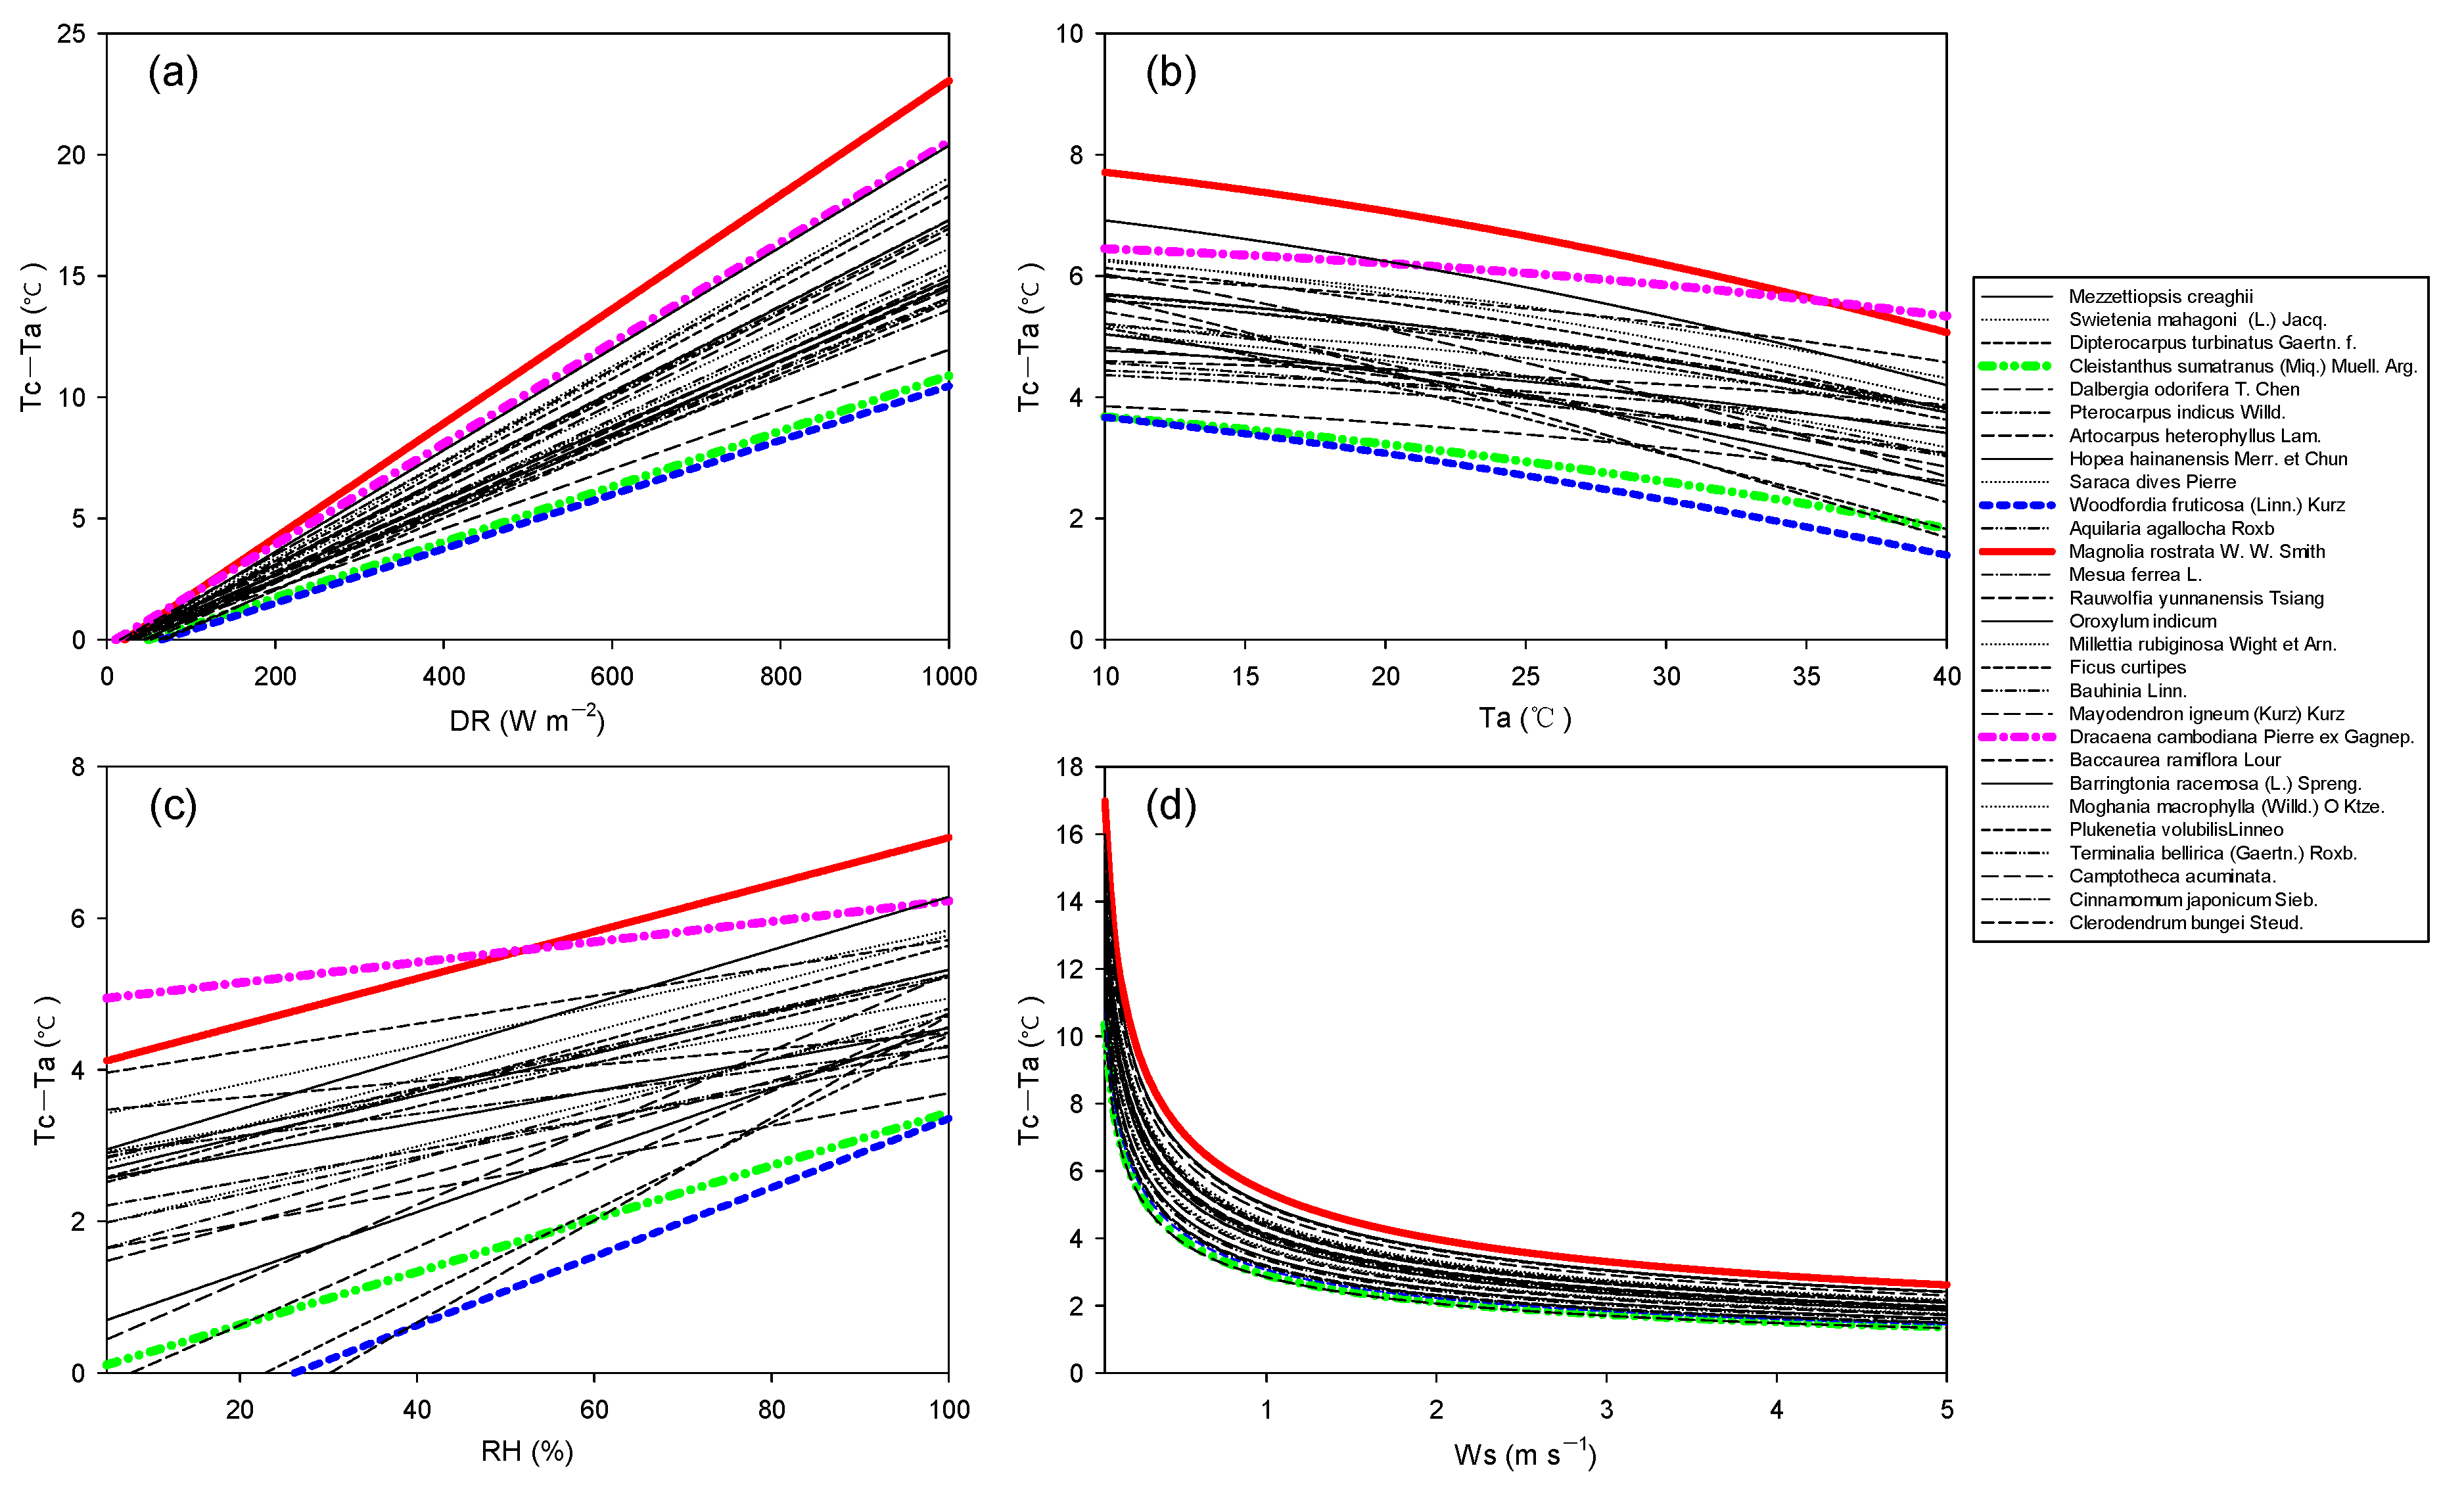
It is estimated that global warming will strengthen the water cycle and increase the demand for evaporation in ecosystems. Under drought stress, stomatal conductance of plants decreases, thus reducing transpiration and increasing canopy temperature. Therefore, in order to explore the differences in canopy temperature among tree species in an expected changing climate, we assumed that the maximum gs value of each tree species decreased linearly to 50%. (Tc–Ta) was very sensitive to all simulated meteorological elements (Figure 5; p < 0.01) and increased linearly with the increase in direct radiation (DR) and relative humidity (RH) (Figure 5a,c). (Tc–Ta) decreased non-linearly with the increase in air temperature (Ta) and wind speed (Ws) (Figure 5b,d).
With the increase in direct radiation (DR), the canopy temperature difference (CTD) of large-leaved trees increased more than that of small-leaved trees (Figure 5a). Species-specific differences in (Tc–Ta) became larger with the increasing DR.
The decrease amplitude of (Tc–Ta) with the increasing Ta of the tree species with the largest leaves (Magnolia rostrata W. W. Smith) was similar to the tree species with the smallest leaves (Woodfordia fruticose (Linn.) Kurz). (Tc–Ta) was negatively correlated with air temperature (Ta) and relative humidity (RH) (Figure 5b,c), indicating that (Tc–Ta) decreased with increasing water vapor pressure deficit (VPD). Species-specific differences in (Tc–Ta) became smaller with the increasing Ws (Figure 5d).
4. Discussion
Our results suggest that the species composition of trees has an important impact on the local climate of the primary tropical rain forest and are consistent with the study in a mixed deciduous forest [14]. The temperature changes found in this study may be critical in determining the diversity of canopy-dwelling plant communities. The patterns of temperature change identified by the study may be critical in determining canopy plant diversity [14].
The mean leaf temperatures of 28 tree species have a highly species-specific manner. Mean leaf temperature cannot be fully or solely explained by stomatal conductance or leaf area [21]. This is because of the complex feedback effect between leaf temperature and climatic conditions or leaf function [22]. Variations in leaf temperature play a major role in determining rates of photosynthetic CO2 uptake and transpiration [23]. On the other hand, changes in photosynthesis and transpiration resulting from changes in leaf temperature may have an impact on the efficiency of nutrient use [7,20].
On the other hand, the response of canopy temperature difference of 28 tree species to climate change was also diverse. (Tc–Ta) of tree species with smaller leaves and larger stomatal conductance was lowly sensitive to climate factors, such as Woodfordia fruticose (Linn.) Kurz and Cleistanthus sumatranus (Miq.) Muell. Arg. In contrast, (Tc–Ta) of tree species (Dracaena cambodiana Pierre ex Gagnep.) with the smallest stomatal conductance was highly sensitive to climate factors. (Tc–Ta) of tree species (Magnolia rostrata W. W. Smith) with the largest leaves was also highly sensitive to climate factors, even if the stomatal conductance was not small. In other words, different tree species have their own strategies for climate change. With the maintenance of tree species diversity, the ability of ecosystems to resist climate change will be stronger. Conversely, loss of tree species diversity will make forests more vulnerable to climate change [24]. Climate change research for the future will involve a series of uncertainties, and it is still not sure what climate scenario will best reflect reality. What are the differences of short-term response and long-term adaptation of different tree species to climate change? [25]. Thus, tropical rainforest management for climate change has to deal with a range of uncertainties in the future.
5. Conclusions and Implications
Our study showed that the leaf size and stomatal conductance together decided the effect of climate change on (Tc–Ta) of the different tree species in the tropical rainforest. (Tc–Ta) of tree species with smaller leaves and larger stomatal conductance was lowly sensitive to climate factors. These results indicate species-specific functional traits which are needed to explicitly explore and model the interactions of individuals for improving the understanding and prediction of climate change impacts on vegetation.
Author Contributions
Q.S., C.S., and Y.Z. wrote the main manuscript text. H.B., H.Y., J.Z., W.Z., Y.L., Y.D., and L.S. performed the experiments. All authors have read and agreed to the published version of the manuscript.
Funding
The National Natural Science Foundation of China (41671209, U1602234, 31290221, 31770528), the National Natural Science Foundation of China and Thailand Research Fund (NSFC-TRF) (41961144017), the National Key Research and Development Program of China (2016YFC0502105), and the CAS 135project (2017XTBG-T01, 2017XTBG-F01).
Acknowledgments
We are grateful to Donghai Yang, Taoxiang Yi for their assistance in the experimental field. This work was supported by Xishuangbanna Ecological Station for Tropical rain forest. This research was funded by the National Natural Science Foundation of China (41671209, U1602234, 31290221, 41961144017, 31770528), the National Key Research and Development Program of China (2016YFC0502105), and the CAS 135project (2017XTBG-T01, 2017XTBG-F01).
Conflicts of Interest
The authors declare no conflict of interests.
References
- Swift, M.J.; Heal, O.W.; Anderson, J.M. Decomposition in Terrestrial Ecosystems; Studies in Ecology; Univ of California Press: Berkeley, CA, USA, 1979; Volume 5. [Google Scholar]
- Raich, J.W.; Russell, A.E.; Kitayama, K.; Parton, W.J.; Vitousek, P.M. Temperature Influences Carbon Accumulation in Moist Tropical Forests. Ecology 2006, 87, 76–87. [Google Scholar] [CrossRef] [Green Version]
- Tan, Z.; Zhao, J.; Wang, G.; Chen, M.; Yang, L.; He, C.; Restrepocoupe, N.; Peng, S.; Liu, X.; Ribeiro Da Rocha, H.; et al. Surface conductance for evapotranspiration of tropical forests: Calculations, variations, and controls. Agric. For. Meteorol. 2019, 275, 317–328. [Google Scholar] [CrossRef]
- Lin, H.; Chen, Y.J.; Zhang, H.L.; Fu, P.L.; Fan, Z.X. Stronger cooling effects of transpiration and leaf physical traits of the plants from a hot dry habitat than from a hot wet habitat. Funct. Ecol. 2017, 31, 2202–2211. [Google Scholar] [CrossRef] [Green Version]
- Kumar, M.; Govindasamy, V.; Rane, J.; Singh, A.K.; Choudhary, R.L.; Raina, S.K.; George, P.; Aher, L.K.; Singh, N.P. Canopy temperature depression (CTD) and canopy greenness associated with variation in seed yield of soybean genotypes grown in semi-arid environment. S. Afr. J. Bot. 2017, 113, 230–238. [Google Scholar] [CrossRef]
- Rahman, M.A.; Moser, A.; Gold, A.; Rotzer, T.; Pauleit, S. Vertical air temperature gradients under the shade of two contrasting urban tree species during different types of summer days. Sci. Total Environ. 2018, 633, 100–111. [Google Scholar] [CrossRef] [PubMed]
- Page, G.F.; Lienard, J.F.; Pruett, M.J.; Moffett, K.B. Spatiotemporal dynamics of leaf transpiration quantified with time-series thermal imaging. Agric. For. Meteorol. 2018, 256, 304–314. [Google Scholar] [CrossRef]
- Schimel, D.S.; Braswell, B.H.; Holland, E.A.; McKeown, R.; Ojima, D.S.; Painter, T.H.; Parton, W.J.; Townsend, A.R. Climatic, edaphic, and biotic controls over storage and turnover of carbon in soils. Glob. Biogeochem. Cycles 1994, 8, 279–293. [Google Scholar] [CrossRef] [Green Version]
- Connell, J.H. Diversity in tropical rain forests and coral reefs. Science 1978, 199, 1302–1310. [Google Scholar] [CrossRef] [Green Version]
- Dixon, R.K.; Brown, S.; Houghton, R.A.; Solomon, A.M.; Trexler, M.C.; Wisniewski, J. Carbon pools and flux of global forest ecosystems. Science 1994, 263, 185–190. [Google Scholar] [CrossRef]
- Jobbàgy, E.G.; Jackson, R.B. The vertical distribution of soil organic carbon and its relation to climate and vegetation. Ecol. Appl. 2000, 10, 423–436. [Google Scholar] [CrossRef]
- Van der Molen, M.K.; Dolman, A.J.; Ciais, P.; Eglin, T.; Gobron, N.; Meir, P.; Peters, W.; Phillips, O.L.; Reichstein, M.; Chen, T.; et al. Drought and ecosystem carbon cycling. Agric. For. Meteorol. 2011, 151, 765–773. [Google Scholar] [CrossRef]
- Daniel, S.; Körner, C. Infrared thermometry of alpine landscapes challenges climatic warming projections. Glob. Chang. Biol. 2010, 16, 2602–2613. [Google Scholar]
- Leuzinger, S.; Körner, C. Tree species diversity affects canopy leaf temperatures in a mature temperate forest. Agric. For. Meteorol. 2007, 146, 29–37. [Google Scholar] [CrossRef]
- Leuzinger, S.; Roland, V.; Körner, C. Tree surface temperature in an urban environment. Agric. For. Meteorol. 2010, 150, 56–62. [Google Scholar] [CrossRef]
- Solomon, S.; Qin, D. Climate Change 2007: The Physical Science Basis, Contribution of Working Group I to the Third Assessment Report of the IPCC.; Cambridge University Press: Cambridge, UK, 2007; p. 996. [Google Scholar]
- Hu, Y.H.; Cao, M.; Lin, L.X. Dynamics of tree species composition and community structure of a tropical seasonal rain forest in Xishuangbanna, Southwest China. Acta Ecol. Sin. 2010, 30, 949–957. [Google Scholar]
- Zhu, H. Forest vegetation of Xishuangbanna, south China. For. Stud. China 2006, 8, 1–58. [Google Scholar]
- Maes, W.H.; Steppe, K. Estimating evapotranspiration and drought stress with ground-based thermal remote sensing in agriculture: A review. J. Exp. Bot. 2012, 63, 4671–4712. [Google Scholar] [CrossRef] [Green Version]
- Atkinson, L.J.; Campbell, C.; Zaragozacastells, J.; Hurry, V.; Atkin, O.K. Impact of growth temperature on scaling relationships linking photosynthetic metabolism to leaf functional traits. Funct. Ecol. 2010, 24, 1181–1191. [Google Scholar] [CrossRef]
- Jackson, R.D.; Idso, S.B.; Reginato, R.J.; Pinter, P.J. Canopy temperature as a crop water stress index. Water Resour. Res. 1981, 17, 1133–1138. [Google Scholar] [CrossRef]
- Keenan, T.F.; Niinemets, U. Global leaf trait estimates biased due to plasticity in the shade. Nat. Plants 2017, 3, 1–6. [Google Scholar] [CrossRef] [Green Version]
- Slot, M.; Reysanchez, C.; Winter, K.; Kitajima, K. Trait-based scaling of temperature-dependent foliar respiration in a species-rich tropical forest canopy. Funct. Ecol. 2014, 28, 1074–1086. [Google Scholar] [CrossRef]
- Zhang, T.; Niinemets, U.; Sheffield, J.; Lichstein, J.W. Shifts in tree functional composition amplify the response of forest biomass to climate. Nature 2018, 556, 99–102. [Google Scholar] [CrossRef] [PubMed]
- Slot, M.; Winter, K. In situ temperature response of photosynthesis of 42 tree and liana species in the canopy of two Panamanian lowland tropical forests with contrasting rainfall regimes. New Phytol. 2017, 214, 1103–1117. [Google Scholar] [CrossRef] [PubMed] [Green Version]
Figure 1.
Air temperature (Ta), vapor pressure deficit (VPD), photosynthetic active radiation (PAR) and wind speed (Ws) during the canopy temperature measurements.
Figure 1.
Air temperature (Ta), vapor pressure deficit (VPD), photosynthetic active radiation (PAR) and wind speed (Ws) during the canopy temperature measurements.

Figure 2.
The false color thermal image of part of the canopy of five tree species taken at 14:00 on 4 February 2018, shows the canopy surface temperature of five different tree species. The squares show some selected frames that have been used (Table 1 and Figure 5).

Figure 3.
Leaf temperature distributions of the five tree species showed (photos). Maximum gs and leaf size values are inserted.
Figure 3.
Leaf temperature distributions of the five tree species showed (photos). Maximum gs and leaf size values are inserted.

Figure 4.
Leaf to air temperature difference of the five tree species.

Figure 5.
Response of canopy temperature difference (Tc–Ta) to climatic factors, including direct radiation (DR) (a), air temperature (Ta) (b), relative humidity (RH) (c), and wind speed (Ws) (d). Red line: Magnolia rostrata W. W. Smith; pink line: Dracaena cambodiana Pierre ex Gagnep; blue line: Woodfordia fruticose (Linn.) Kurz; green line: Cleistanthus sumatranus (Miq.) Muell. Arg.


Table 1.
The average canopy temperature repeat number n, canopy temperature difference (CTD), temperature range, minimum and maximum values of the five rainforest tree species selected in the study (letter a~e represents the difference from high to low at the significant level of 0.05 (p < 0.05)).
Table 1.
The average canopy temperature repeat number n, canopy temperature difference (CTD), temperature range, minimum and maximum values of the five rainforest tree species selected in the study (letter a~e represents the difference from high to low at the significant level of 0.05 (p < 0.05)).
| Species | Tc–Ta (K) | T-Range (K) | Tmin (°C) | Tmax (°C) | n |
|---|---|---|---|---|---|
| Pometia tomentosa | 6.4 a | 14.5 ± 1.51 | 24.3 ± 0.37 | 38.8 ± 1.14 | 9 |
| Barringtonia pendula | 6.1 b | 11.7 ± 2.04 | 23.8 ± 0.61 | 35.5 ± 1.43 | 9 |
| Gironniera subaequalis | 4.7 c | 8.7 ± 1.26 | 25.6 ± 0.25 | 34.3 ± 1.01 | 9 |
| Ardisia tenera | 4.4 d | 13.8 ± 1.05 | 19.4 ± 0.18 | 33.2 ± 0.87 | 9 |
| Mezzettiopsis creaghii | 1.9 e | 10.9 ± 1.07 | 16.8 ± 0.26 | 27.7 ± 0.81 | 9 |
Table 2.
Leaf-to-air temperature (Tc–Ta), leaf area, and maximum stomatal conductance (gsmax) of 28 tree species.
Table 2.
Leaf-to-air temperature (Tc–Ta), leaf area, and maximum stomatal conductance (gsmax) of 28 tree species.
| No. | Species Name | Tc–Ta °C | Leaf Area cm2 | gsmax mmol m−2 s−1 | n |
|---|---|---|---|---|---|
| 1 | Mezzettiopsis creaghii | 0.99 ± 0.86 | 32.83 ± 6.47 | 173.29 ± 49.90 | 5 |
| 2 | Swietenia mahagoni (L.) Jacq. | 2.93 ± 2.00 | 44.32 ± 5.10 | 162.93 ± 27.76 | 5 |
| 3 | Dipterocarpus turbinatus Gaertn. f. | 1.80 ± 0.51 | 106.38 ± 7.44 | 222.04 ± 17.58 | 4 |
| 4 | Cleistanthus sumatranus (Miq.) Muell. Arg. | 0.81 ± 0.11 | 15.98 ± 5.93 | 401.26 ± 29.47 | 5 |
| 5 | Dalbergia odorifera T. Chen | 0.57 ± 0.48 | 14.51 ± 3.83 | 221.41 ± 57.08 | 5 |
| 6 | Pterocarpus indicus Willd. | 0.79 ± 0.15 | 70.93 ± 30.95 | 188.18 ± 65.16 | 5 |
| 7 | Artocarpus heterophyllus Lam. | 1.43 ± 1.92 | 97.80 ± 11.60 | 448.82 ± 44.31 | 5 |
| 8 | Hopea hainanensis Merr. et Chun | 0.83 ± 0.28 | 74.03 ± 12.96 | 480 ± 31.26 | 5 |
| 9 | Saraca dives Pierre | 1.27 ± 0.11 | 100.88 ± 30.05 | 166.59 ± 33.11 | 5 |
| 10 | Woodfordia fruticose (Linn.) Kurz | 1.15 ± 1.73 | 20.10 ± 3.70 | 548.88 ± 48.58 | 5 |
| 11 | Aquilaria agallocha Roxb | 0.31 ± 0.08 | 29.64 ± 4.58 | 217.26 ± 21.22 | 5 |
| 12 | Magnolia rostrata W. W. Smith | 0.59 ± 0.51 | 253.10 ± 116.03 | 170.23 ± 49.83 | 5 |
| 13 | Mesua ferrea L. | 0.63 ± 0.11 | 22.28 ± 7.27 | 127.65 ± 26.22 | 5 |
| 14 | RauwoIfia yunnanensis Tsiang | 0.23 ± 0.22 | 23.86 ± 4.01 | 88.26 ± 43.74 | 5 |
| 15 | Oroxylum indicum | 0.30 ± 0.72 | 59.16 ± 23.86 | 355.58 ± 139.85 | 5 |
| 16 | Millettia rubiginosa Wight et Arn. | 1.68 ± 1.06 | 46.97 ± 16.90 | 235.17 ± 102.95 | 5 |
| 17 | Ficus curtipes | 0.26 ± 0.38 | 70.38 ± 17.56 | 209.97 ± 78.20 | 5 |
| 18 | Bauhinia Linn. | 0.16 ± 0.17 | 65.65 ± 9.33 | 183.91 ± 53.83 | 5 |
| 19 | Mayodendron igneum (Kurz) Kurz | 0.32 ± 0.22 | 41.82 ± 8.00 | 274.25 ± 77.56 | 6 |
| 20 | Dracaena cambodiana Pierre ex Gagnep. | 0.93 ± 0.16 | 95.00 ± 21.43 | 80.78 ± 33.25 | 5 |
| 21 | Baccaurea ramiflora Lour | 0.67 ± 0.19 | 76.53 ± 8.38 | 121.56 ± 21.29 | 5 |
| 22 | Barringtonia racemosa (L.) Spreng. | 0.08 ± 0.24 | 178.54 ± 51.97 | 219.04 ± 79.81 | 5 |
| 23 | Moghania macrophylla (Willd.) O Ktze. | 1.57 ± 0.46 | 115.02 ± 25.24 | 212.76 ± 70.90 | 5 |
| 24 | Plukenetia volubilisLinneo | 2.61 ± 1.69 | 94.54 ± 19.97 | 550.80 ± 93.84 | 5 |
| 25 | Terminalia bellirica (Gaertn.) Roxb. | 0.38 ± 0.66 | 57.87 ± 11.24 | 269.73 ± 46.20 | 5 |
| 26 | Camptotheca acuminata. | 0.76 ± 0.23 | 144.90 ± 34.76 | 398.22 ± 93.55 | 5 |
| 27 | Cinnamomum japonicum Sieb. | 0.07 ± 0.42 | 23.21 ± 4.00 | 187.48 ± 28.19 | 5 |
| 28 | Clerodendrum bungei Steud. | 1.20 ± 0.12 | 171.80 ± 47.19 | 638.84 ± 43.46 | 5 |
© 2020 by the authors. Licensee MDPI, Basel, Switzerland. This article is an open access article distributed under the terms and conditions of the Creative Commons Attribution (CC BY) license (http://creativecommons.org/licenses/by/4.0/).
Share and Cite
MDPI and ACS Style
Song, Q.; Sun, C.; Deng, Y.; Bai, H.; Zhang, Y.; Yu, H.; Zhang, J.; Sha, L.; Zhou, W.; Liu, Y. Tree Surface Temperature in a Primary Tropical Rain Forest. Atmosphere 2020, 11, 798. https://0-doi-org.brum.beds.ac.uk/10.3390/atmos11080798
AMA Style
Song Q, Sun C, Deng Y, Bai H, Zhang Y, Yu H, Zhang J, Sha L, Zhou W, Liu Y. Tree Surface Temperature in a Primary Tropical Rain Forest. Atmosphere. 2020; 11(8):798. https://0-doi-org.brum.beds.ac.uk/10.3390/atmos11080798
Chicago/Turabian StyleSong, Qinghai, Chenna Sun, Yun Deng, He Bai, Yiping Zhang, Hui Yu, Jing Zhang, Liqing Sha, Wenjun Zhou, and Yuntong Liu. 2020. "Tree Surface Temperature in a Primary Tropical Rain Forest" Atmosphere 11, no. 8: 798. https://0-doi-org.brum.beds.ac.uk/10.3390/atmos11080798
Note that from the first issue of 2016, this journal uses article numbers instead of page numbers. See further details here.