Validation of MODIS C6.1 and MERRA-2 AOD Using AERONET Observations: A Comparative Study over Turkey


1
Department of Geomatics Engineering, Graduate School of Science Engineering and Technology, Istanbul Technical University, Maslak, İstanbul 34469, Turkey
2
Department of Geomatics Engineering, Civil Engineering Faculty, Istanbul Technical University, Maslak, İstanbul 34469, Turkey
3
Department of Environmental Science, Stockholm University, 10691 Stockholm, Sweden
*
Authors to whom correspondence should be addressed.
Atmosphere 2020, 11(9), 905; https://0-doi-org.brum.beds.ac.uk/10.3390/atmos11090905
Submission received: 12 July 2020
/
Revised: 6 August 2020
/
Accepted: 23 August 2020
/
Published: 26 August 2020
(This article belongs to the Special Issue Air Quality and Sustainable Development of Urban Agglomerations in the Mediterranean Area: Science, Technology and Policies)
Abstract
:This study validated MODIS (Moderate Resolution Imaging Spectroradiometer) of the National Aeronautics and Space Agency, USA, Aqua and Terra Collection 6.1, and MERRA-2 (Modern-ERA Retrospective Analysis for Research and Application) Version 2 of aerosol optical depth (AOD) at 550 nm against AERONET (Aerosol Robotic Network) ground-based sunphotometer observations over Turkey. AERONET AOD data were collected from three sites during the period between 2013 and 2017. Regression analysis showed that overall, seasonally and daily statistics of MODIS are better than MERRA-2 by the mean of coefficient of determination (R2), mean absolute error (MAE), and relative root mean square deviation (RMSDrel). MODIS combined Terra/Aqua AOD and MERRA-2 AOD corresponding to morning and noon hours resulted in better results than individual sub datasets. A clear annual cycle in AOD was detected by the three platforms. However, overall, MODIS and MERRA-2 tend to overestimate and underestimate AOD, respectively, in comparison with AERONET. MODIS showed higher efficiency in detecting extreme events than MERRA-2. There was no clear relation found between the accuracy in MODIS/MERRA-2 AOD and surface relative humidity (RH).
1. Introduction
Anthropogenic aerosols influence the Earth’s radiation budget and climate directly by scattering solar light in the cloud-free atmosphere and indirectly by changing the cloud properties [1,2]. Anthropogenic aerosols on the whole cool the climate, while black carbon and mineral dust absorb solar radiation. Monitoring air quality parameters in the atmosphere, such as aerosols, is crucial to identify sources of pollutants and to estimate the effects of human exposure for air pollution, as well as providing early alerts to the public. Since aerosol optical depth (AOD) is related to aerosol loads in the atmosphere, it is a widely used parameter to study and monitor anthropogenic aerosols. By studying long-term variations and trends in AOD, the latter can be used to quantify aerosol’s impact on climate and air quality [3,4]. Ground-based remote sensing is widely used worldwide and can be used to estimate AOD accurately. Aerosol Robotic Network (AERONET) provides high-quality sunphotometer measurements of AOD at multiple wavelengths, where computerized procedures for cloud-screening and pre- and post-field calibration generalization are used [5]. However, these measurements are associated with sparse coverage over the Earth and a lack of long-term observations at many of the ground-based sites.
Sensors mounted on polar satellites provide large scenes of AOD at multiple spectral wavelengths that cover the Earth to a large extend. However, satellite-derived AOD is associated with low temporal resolution and relatively low pixel resolution, and no data are available if clouds are presented in the atmosphere [6]. Scenes of AOD are also available as gridded reanalysis, such as Modern-ERA Retrospective Analysis for Research and Application (MERRA-2), where satellite and ground-based measurements of AOD have been assimilated into Earth system modeling.
Recent advances in satellite sensors concerning spatial and spectral resolution mean that accurate historical aerosol related datasets are available for climate monitoring and air quality studies. Li et al. [7] has exploited various sensors’ spatial coverage, Moderate Resolution Imaging Spectroradiometer (MODIS), Microwave Integrated Retrieval System (MIRS), and Sea-Viewing Wide Field-of-View Sensor (SeaWiFS), along with the Environmental Protection Agency’s (EPA) in situ monthly mean PM2.5 data to investigate time series of AOD and PM2.5. The results obtained showed consistent interannual variation in satellite-derived AOD and PM2.5, where an R (correlation coefficient) of 0.89 was obtained for approximately 60% of the dataset’s total variance. R equal to 0.83 was obtained for approximately 35% of the total variance. In addition, MODIS and MIRS AOD were most compatible with AERONET measurements, both with respect to annual and seasonal variation. By combining data obtained from the Multi-Angle Implementation of Atmospheric Correction (MAIAC) satellite and Chemical Transport Method (CTM), and applying the Multiple Imputation (MI) method, Xiao et al. [8] created a complete daily time series of MODIS Aqua/Terra-derived PM2.5 over the Yangtze River Delta of China. For MODIS Terra/Aqua combined, this study also shows that days with high availability in AOD are associated with high R2 compared to days with low availability. Kahya et al. [9] studied spatio-temporal variation in PM2.5 over the Marmara region in Turkey according to 13 ground-based stations. They found that 70% of the PM2.5 dataset exceeded the WHO’s (World Health Organization) PM2.5 annual standards.
Li et al. [10] used AERONET AOD data to conduct a spatio-temporal comparison of four AOD satellite products (MODIS, MIRS, SeaWiFS, and Ozone Monitoring Instrument (OMI)) using the Combined Maximum Covariance Analysis (CMCA) decomposition technique. With this approach, they found that all four satellite sensors had a high ability to detect extreme events of dust and biomass burning aerosols. In addition, satellite-derived seasonal AOD agreed well with AERONET, where a mean R of 0.95 is obtained. Bhaskaran et al. [11] have studied the spatio-temporal variation in MODIS Terra AOD with respect to three different wavelengths. The study was conducted by validating MODIS AOD products against semi-simultaneous AERONET AOD measurements. It was found that MODIS AOD tends to overestimate AERONET AOD over most of the study sites and then particularly over inlands. Bhaskaran et al. [11] also found that the highest and lowest AOD, both for MODIS and AERONET, occur in May and June (up to 0.4), and at the end of the year, respectively.
The complexity between the Earth surface and atmosphere makes the satellite retrieval of AOD a challenging process, and it causes discrepancies between different sensors used [12,13]. Therefore, a combination of ground-based and satellite remote sensing of aerosols via comprehensive and regular validation processes is important [13,14]. Hauser et al. [15] used AVHRR NOAA-16 (Advanced Very High Resolution Radiometer of the National Oceanic and Atmospheric Administration) AOD in combination with eight AERONET stations to retrieve field maps of AOD over central Europe. AVHRR AOD scenes were found to be more spatially homogeneous than the MODIS Aqua and Terra AOD scenes. Although MODIS AOD correlated well with AERONET AOD, it biased significantly more than AVHRR, with approximately 0.2 on average. Sayer et al. [16] evaluated the initial version of the AVHRR-based AOD (V0001) by performing validation against AERONET land and ship-borne AOD datasets. This study also included a comparison of the dataset against NASA GESTAR (Goddard Earth Science Technology and Research) AVHRR AOD products. They stated that the AVHRR sensor tends to perform satisfied retrievals of AOD over densely vegetated surfaces, while sensor calibration-related bias was found for both MODIS Deep Blue and Dark Target algorithms. Tan et al. [17] validated POLDER(Polarization and Directionality of the Earth’s Reflectances)-delivered four aerosol parameters (AOD, Fine AOD, Coarse AOD, and Ångström Exponent (AE)) using AERONET AOD data over China, and the results were compared to MODIS AOD. The performances of POLDER-3 and MODIS AOD products were found to be close to each other; however, the POLDER-3 aerosol product is more sensitive to fine aerosol type than MODIS.
Aerosol optical properties in the atmosphere are sensitive to atmospheric relative humidity (RH) [18,19]. RH affects aerosols’ microphysical properties and the scattering of solar light due to hygroscopic growth by water uptake [20]. Shmirko et al. [21] computed light-scattering properties of three types of irregular particles. The authors aimed to study the impact of water coating on light scattering by irregularly shaped agglomerated debris particles. The relation between RH and aerosol optical properties are quantized by the scattering enhancement factor f (RH, λ), which describes the change in particle light scattering coefficient σsp(RH,λ) as a function of RH. This relationship was explained in detail in previous studies [20,22,23]. According to the World Meteorological Organization (WMO) and Global Atmosphere Watch (GAW), in situ aerosol measurements are recommended to be steered under low relative humidity (RH% < 40) [24]. Thus, atmospheric RH and water content are crucial to evaluate aerosol climatic influence [25]. It has been shown that assessment of the effects of RH on AOD derived from satellite observations is necessary as well [26,27].
In this study, MODIS C6.1 and MERRA-2 AOD at 550 nm were compared to each other and validated against AERONET AOD according to three ground-based stations in Mersin, Turkey, Cyprus and Athens, Greece (Mersin METU-ERDEMLI, Cyprus CUT-TEPAK, and Athens NOA, respectively). The work aims to assess the efficiency of MODIS Terra, MODIS Aqua, and MERRA-2 derived AOD datasets to retrieve aerosol-related AOD data over Turkey. In addition, the statistical and temporal differences between the datasets and the effect of atmospheric RH on AOD have been quantified. To the best of our knowledge, this study is the first that validates satellite-retrieved AOD over Turkey, and here, we provide spatial fields and time series of AOD. The numbers of extreme events caused by mineral dust and biomass burning aerosols are presented for AERONET, MODIS, and MERRA-2. Here, we also evaluate the possibility of using MERRA-2 AOD to compensate for missing MODIS data due to clouds present in the atmosphere. The present study assesses the reliability in MODIS and MERRA-2 AOD to be used in mapping PM2.5 over Turkey in a subsequent study.
2. Experiments
2.1. Study Area
The present study area (33° N–42° N, 21° E–44° E) for the satellite retrievals cover the whole Turkey (783,000 km2), for which 97% of the total area lies in Asia, while only 3% falls in the European continent. Agricultural areas cover 44% of the total area in Turkey, while only 15% is covered by forests [28]. Turkey’s population has increased by 1.09% in 2016 to reach 79.81 million inhabitants by 2017 [29]. The climate in Turkey is varying significantly. The Mediterranean climate is common in the Mediterranean and Aegean coastal regions, the continental climate is common in the Black Sea region, while the Anatolian plateau is characterized by the steppe climate. Industrialization, urbanization, massive construction movements, and high fuel consumption have dramatically influenced air quality in Turkey [9]. According to the European Environment Agency (EEA), 97.2% of Turkey’s population breathes harmful air [30], and Turkey contributes to more than half of the industry-originated PM10 emissions is in Europe [31].
2.2. Aerosol Products
2.2.1. MODIS-Derived AOD
MODIS operates on two satellite platforms, Aqua and Terra, to obtain spatial and spectral optical characteristics of aerosols. Terra was launched in 1999 and performs observations for morning hours (7:00 to 10:59 (EOS AM)) and Aqua was launched in 2002 for noon hours (11:00 to 13:00 (EOS PM)). The instrument has 36 channels, ranging from 0.4 µm to 14.4 µm with different spatial resolutions [32]. Eight of these channels (between 0.47 µm and 2.13 µm) are used to retrieve aerosol optical properties over land and ocean for different algorithms developed by the MODIS aerosol team.
The Level 2 Collection 6.1 (C6.1) aerosol product is provided at a nominal spatial resolution of 10 × 10 km2 at nadir. According to the surface Normalized Difference Vegetation Index (NDVI), values smaller than 0.2 and 0.3 are used in the Deep Blue (DB) and Dark Target (TG) algorithm, respectively [33]. Datasets obtained by combining the two algorithms (DTDB) applied on MODIS Terra and Aqua AOT at 550 nm of the period 2013–2017 have been investigated in the present study. The data investigated are associated with 10 × 10 km2 spatial resolution and 1-day temporal resolution.
2.2.2. MERRA-2 AOD Reanalysis
MERRA-2 is a second version of the MERRA global reanalysis model. It is the first satellite reanalysis data to include aerosol interaction with other climatic parameters. MERRA-2 uses MODIS C6.1 and MIRS satellite-derived AOD as well as AERONET ground-based observations assimilated in Earth system modeling. In this study, MERRA-2 AOD at 550 nm, with 62.5 × 50 km spatial resolution and hourly temporal resolution, was downloaded from the “Goddard Earth Sciences Data and Information Services Centre “GIOVANNI” platform [34]. AOD was averaged for MODIS Terra and Aqua separated and combined with respect to morning hours (7:30, 8:30, and 9:30 LT), noon hours (10:30, 11:30, and 12:30 LT) and combined morning and noon hours (semi-daily, 7:30 to 12:30 LT), respectively.
2.2.3. AERONET Ground-Based AOD
AERONET ground-based networks provide globally distributed AOD measurements. In this study, AERONET level 2 version 3 (L2/V3) AOD (cloud-screened and quality-assured) were downloaded from the AERONET official website [35] for three AERONET stations: METU-ERDEMLI in Mersin-Turkey, CUT-TEPAK in Cyprus, and Athens-NOA in Athens, Greece. One of the selected AERONET stations, METU-ERDEMLI, is located within the border of Turkey, while the other two stations, CUT-TEPAK and Athens-NOA, are located near Turkey (see Table 1). The hourly AERONET AOD at 440 nm and Ångström exponent (AE440/675) were used to derive AOD at the MODIS and MERRA-2 wavelength of 550 nm.
2.2.4. ECMWF Relative Humidity
Retrieving aerosol optical characteristics are sensitive to RH [39]. Five years (2013–2017) of gridded RH raster layers (12.5 km spatial resolution and 1-day temporal resolution) were downloaded for the present investigation area from the European Centre Medium-Range Weather Forecasts (ECMWF). Daily surface RH was averaged with respect to season to analyze the impact of relative humidity on the validation statistical results.
2.3. Methodology
In this study, MODIS and MERRA-2 AOD at 550 nm were validated against and seasonally compared to AERONET AOD with respect to the period 2013–2017. The following nine steps explain the approach used in the comparison between MODIS/MERRA-2 and AERONET. (i) AOD DB/DT retrievals were obtained from the MODIS Terra and Aqua scientific datasets of “Dark_Target_Deep_Blue_AOD_550_Combined” by extraction and georeferencing against corresponding geolocation files using ENVI IDL iterative script. (ii) Mosaicking was conducted to merge the adjacent layers in each dataset over the study area to produce daily layers using an ArcGIS automated model. (iii) MODIS Aqua and Terra AOD collocated pixels values were averaged separately and combined. (iv) MERRA-2 AOD hourly values were averaged over the morning and noon hours (7:00–11:00 and 11:00–14:00, respectively) as well as over these two periods (named with a semi-day period) and extracted over the three AERONET sites. (v) The mean wind speed in the study area is about 4.4 m s−1 [40], which means that aerosol particles can be transported approximately 16 km during one hour. Both MODIS and MERRA-2 daily values were extracted using a surface area of 30 × 30 km2 (3 × 3 MODIS pixels in line with (iv)) with the help of an automated ArcGIS extraction model. The nine pixels were selected so that the AERONET station is located in the centered satellite pixel. Pixel windows that contained at least four pixels out of 9 were included for MODIS. For MODIS AOD data quality assurance, we filtered the DTDB AODs retrievals for the high-quality flag (QF = 3) using Dark_Target_Deep _Blue_AOD_550_ Combined QA Flag. (vi) Since AERONET stations are not providing AOD at 550 nm wavelength, the AE440/675 and AOD at 440 nm were used to calculate AOD at the MODIS wavelength 550 nm using (1) (vii) AERONET AOD hourly observations were separated and averaged according to the three periods described in (iv). (viii) ECMWF daily RH was extracted over the three stations and averaged for each season. (ix) The statistical parameters coefficient of determination (R2), relative root mean square deviation (RMSDrel), root mean square error (RMSE), mean absolute error (MAE), and relative mean bias (RMB), obtained in the comparison between satellite and ground-based AOD, were investigated. RMB larger or lower than one indicates overestimation and underestimation, respectively, of MODIS/MERRA-2 AOD. N is the number of collocated points. Equations (2)–(6) are the formulas used to calculate the aforementioned statistical metrics, respectively.
AE440/550: Ångström Exponent represented for the 440 nm and 550 nm wavelengths; AOD (SD) = satellite-derived AOD (MODIS or MERRA-2) and AOD (AER) = AERONET AOD; µ = population mean, MAE = mean absolute error, R2 = coefficient of determination, RMB = relative mean bias, RMSDrel = relative root mean square deviation.
3. Results
3.1. Validation Against AERONET
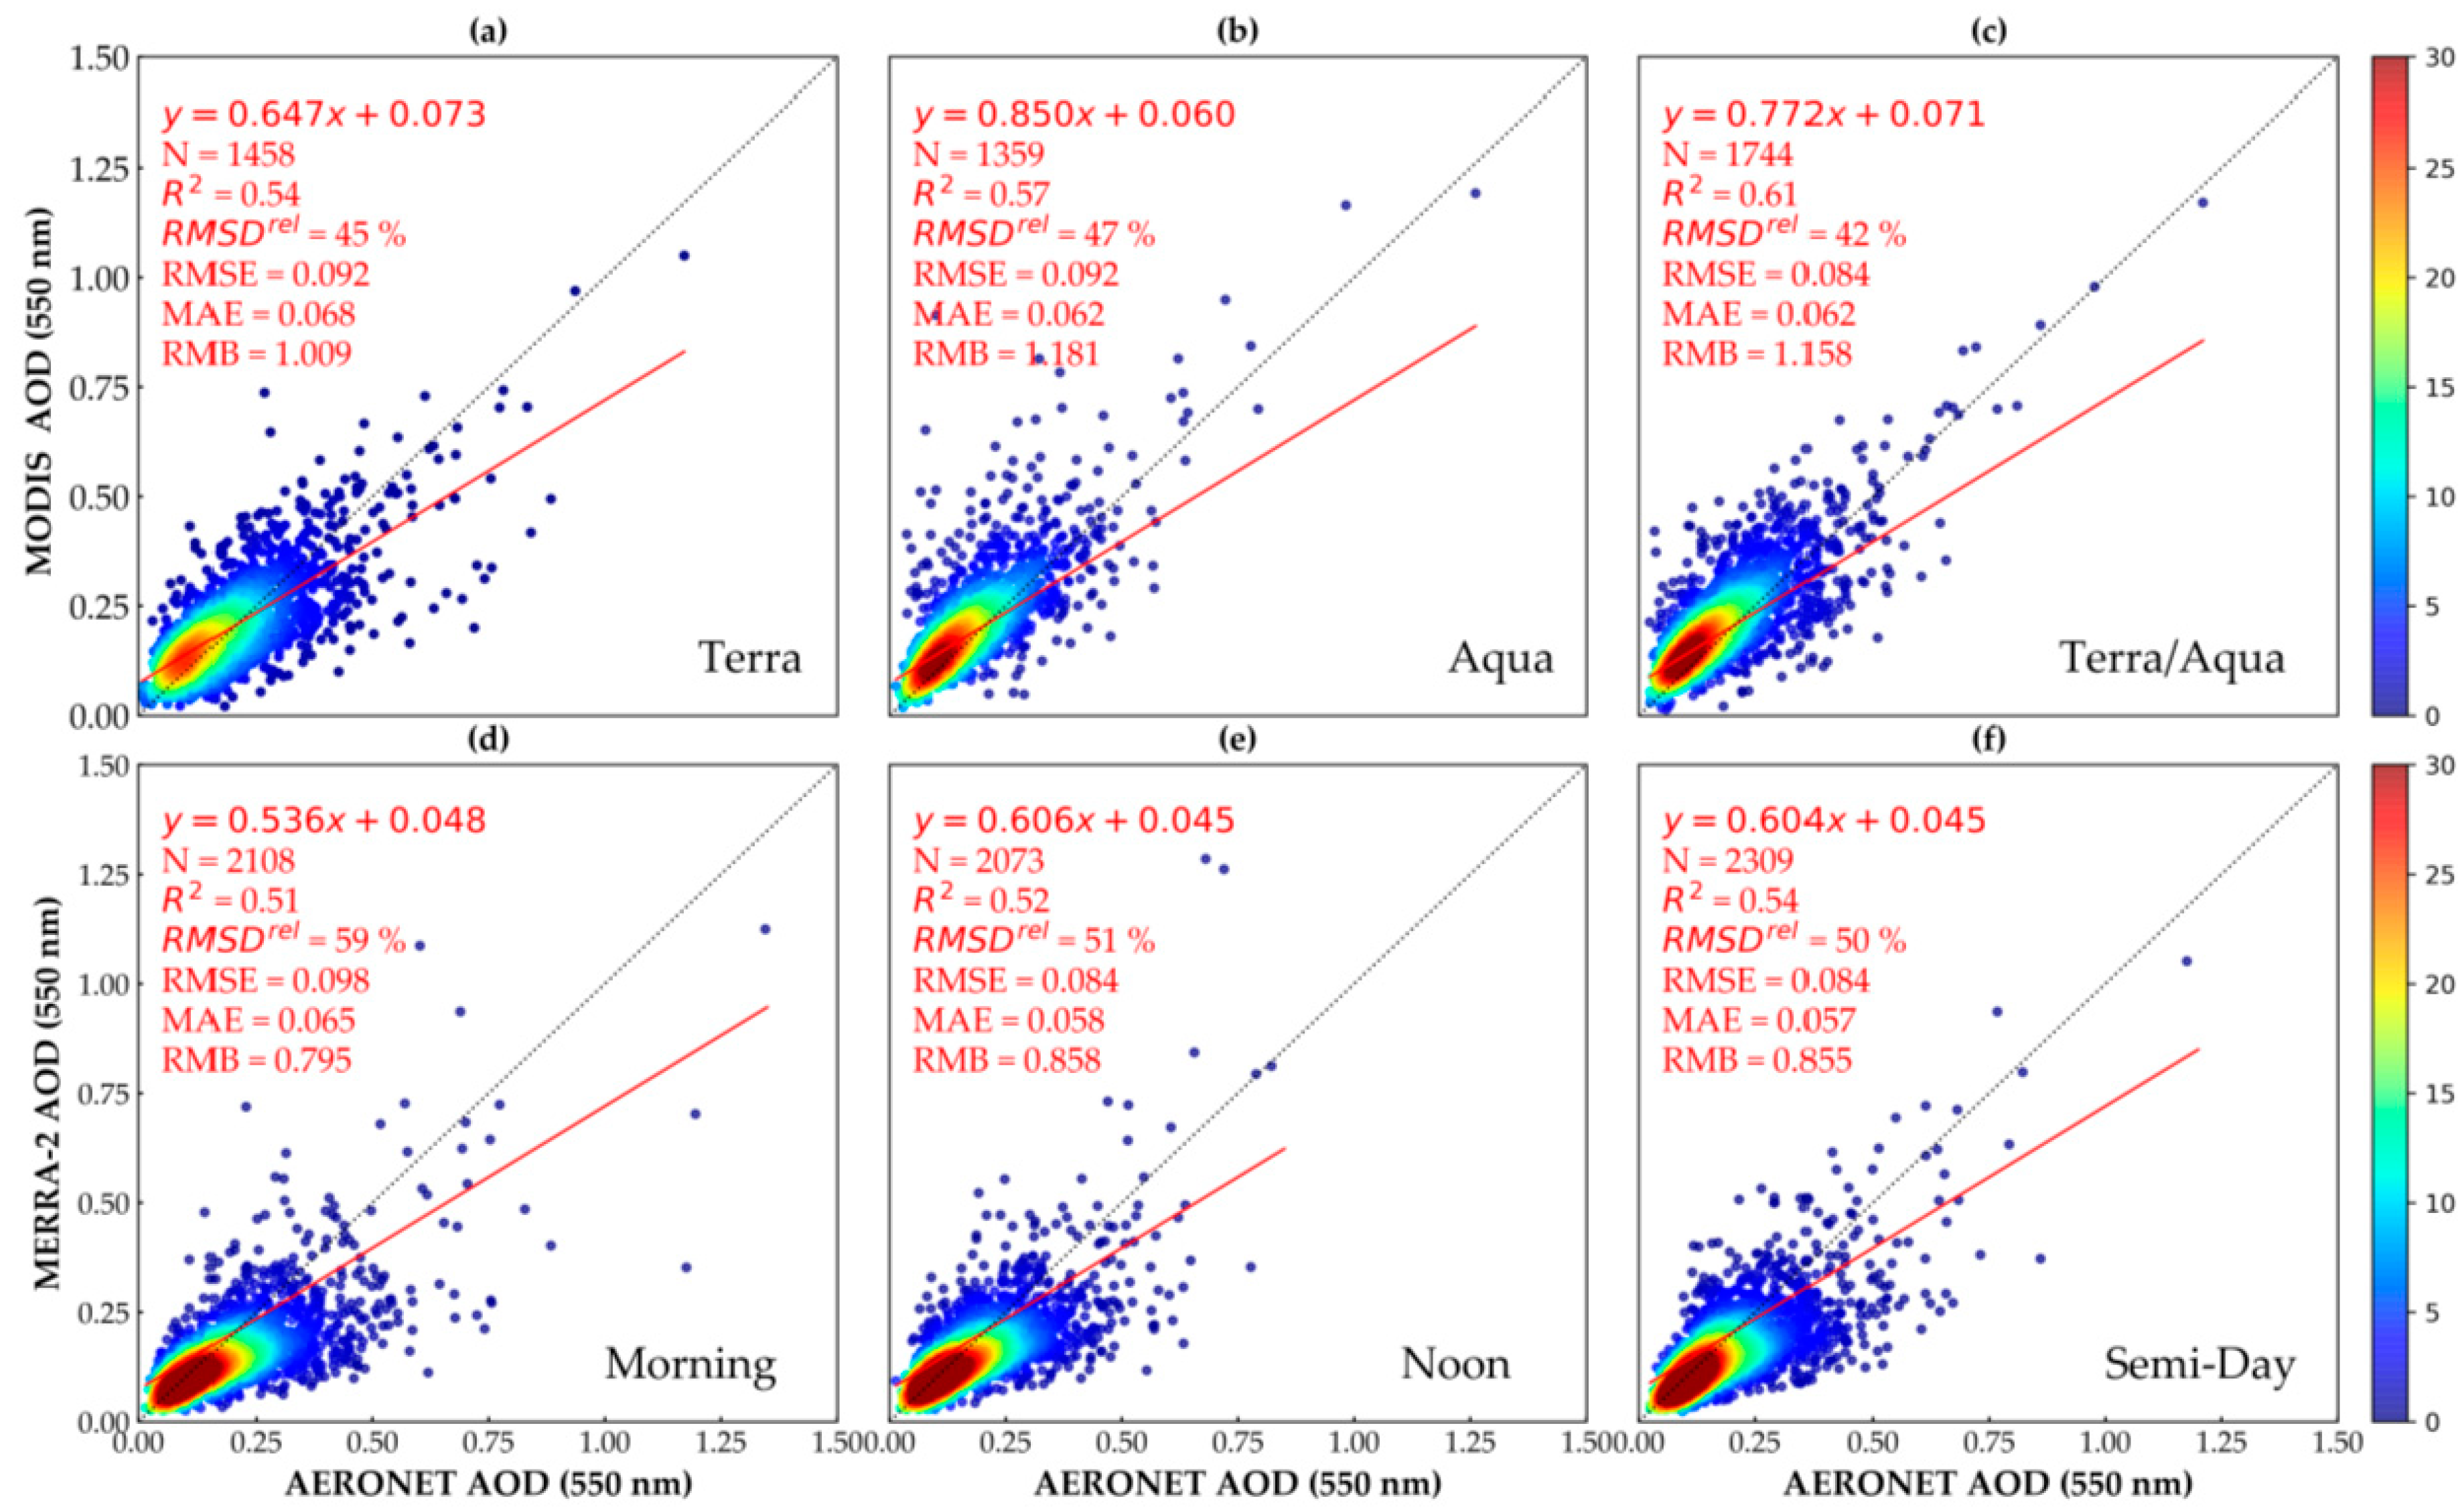
MODIS and MERRA-2 daily AOD are compared to the AERONET measurements in Figure 1, which are subdivided with respect to the time of the day. MERRA-2 reanalysis contain the highest number of collocated values (N), as it is a continual time series. The figures show that MODIS agree according to the 1:1 line and squared correlation coefficient somewhat better than MERRA-2. However, slightly lower RMSDrel and MAE values are found for MERRA-2. For AOD corresponding to MODIS Aqua and Terra combined, and MERRA-2 Semi-Day, higher R2 values and RMSDrel are found compared to separated platforms and for morning and noon hours, respectively. With respect to the 1:1 line and R2, in comparison with AERONET, Shaheen et al. [41] also found relatively good agreement for MODIS, although MERRA-2 AOD was found to be slightly closer to the 1:1 line and associated with less bias. The latter study suggests merging MODIS and MERRA-2 AOD to optimize the validation against AERONET and minimize bias. The present results obtained with MODIS and MERRA-2 over land surfaces are in line with the previous study by Sogacheva et al. [42]. The largest deviation to the 1:1 line was found for MODIS Terra and MERRA-2 AOD obtained for morning hours. The result obtained with MODIS Terra is consistent with that of Levy et al. [43], who found significantly larger bias for this satellite sensor compared to MODIS Aqua. Therefore, the MODIS Aqua AOD was generalized to represent the MODIS dataset by Schutgens et al. [44]. However, Georgoulas et al. [45] found that MODIS Terra AOD exhibited the best agreement with AERONET over the eastern Mediterranean.
3.2. Time Series of MODIS, MERRA-2, and AERONET AO
MODIS and MERRA-2 monthly averaged AOD were compared to AERONET AOD over the study period of 5 years. MODIS and AERONET observations are not continuous time series, while combining monthly values resulted in only one missing month out of 60 for both platforms. For MODIS, available days included in the monthly averaging ranged between 44% in January and 92% in August. Figure 2 shows for all three platforms that the highest and lowest AOD occur in summer and winter, respectively. Georgoulas et al. [45] explain this with transport of mineral dust aerosol in summer from North Africa and the Middle East over the Anatolian Plateau in Turkey. This is supported by Perez et al. [46].
Figure 2 shows that the MODIS AOD values are higher compared to both AERONET and MERRA-2 with respect to the period 2013–2015, while they are more comparable with AERONET for 2016 and 2017. Figure 2 shows also that MODIS and MERRA-2 somewhat overestimate and underestimate AOD, respectively, with respect to AERONET AOD when the full period is taken into consideration. The underestimation in AOD by MEERA-2 is in line with previous studies that investigated AOD globally (Che et al. [2]; Shi et al. [47]; Buchard et al. [48]). However, with a focus on storm episodes of mineral dust over four sunphotometer ground-based sites in Australia, Mukkavilli et al. [49] found overestimation in MEERA-2 AOD. In addition, with respect to MODIS DB/DT and DT algorithms in comparison with AERONET, significant overestimations in AOD were found by Shaheen et al. [41] and Tian et al. [50], respectively. A larger deviation in RMB is found in the present study for MODIS than MERRA-2, with respect to both monthly and daily averaging (Figure 1).
Table 2 presents statistics between MODIS and MERRA-2 against AERONET with respect to season and the three present AERONET sites. For the purpose of investigating seasonal variation, four seasons were classified: (i) winter (December, January, and February—DJF), (ii) spring (March, April, and May—MAM), (iii) summer (June, July, and August—JJA), and (iv) autumn (September, October, and November—SON). For MODIS, available days are 63%, 85%, 71%, and 51% for summer, autumn, and winter, respectively. The availability for AERONET AOD is largest in August (94%) and reached a minimum in January (44%), while the seasonal availability is 57%, 75%, 57%, and 44% for spring, summer, autumn, and winter, respectively. For the ATHENS-NOA station, Table 2 shows that the lowest RH and highest R2 were recorded in summer for both MODIS and MERRA-2. Similar findings are found for the stations METU-ERDEMLI and CUT-TEPAK according to spring/summer and winter, respectively. Considering the other statistical parameters in Table 2, no clear relation with RH is found.
Figure 3 shows annual mean scenes of MODIS Aqua and Terra combined and MERRA-2 AOD (left and middle column, respectively) and corresponding differences in AOD between the two platforms (right column) with respect to the present investigation period. For the years 2013, 2015, and 2016, the figures show that MODIS AOD is higher than MERRA-2 for nearly the full study area.
3.3. Extreme Events
Aerosol extreme events were specified for MODIS/MERRA-2 and AERONET as daily mean AOD greater than or equal to the threshold value 0.5 [51,52]. Extreme events were investigated separately for the three AERONET stations and included if daily mean values are available for all three platforms. According to AERONET-derived AOD, Athens, METU, and CUT-TEPAK have recorded 8, 20, and 7 extreme events, respectively, during the five years included in the present investigation. Table A1 in Appendix A shows that MODIS detected a total of 18 (54%) extreme events out of the 33 by AERONET, while MERRA-2 detected only 8 (24%). Previous studies such as that of Shi et al. [47] showed that AOD events of dust and haze were not detected very well by MERRA-2. Li et al. [53] demonstrated the poor performance of MODIS in detecting extreme loadings of mineral dust aerosol over 13 AERONET stations in China. Jin et al. [54] showed that although MODIS somewhat underestimated extreme aerosol events, the satellite sensor was actually effective in detecting extreme events recorded by four AERONET stations around the Yangtze River in China.
Among the current AERONET stations in this present study, the most extreme events were detected for the ATHENS-NOA’s station, which means 88% and 50% for MODIS and MERRA-2, respectively. The lowest number of extreme cases was found for the METU-ERDEMLI station: 25% and 10% for MODIS and MERRA-2, respectively. Previous studies such as that of Shi et al. [47] showed that AOD events of dust and haze were not detected very well by MERRA-2. Li et al. [53] found poor performance of MODIS in detecting extreme dust aerosol conditions over 13 AERONET stations in China. Jin et al. [54] showed that although MODIS underestimated very high aerosol loadings, the satellite sensor was actually effective in detecting extreme events, which was also recorded by four AERONET stations around the Yangtze River in China. A summary of results obtained from different remote sensing studies is presented in Table A2.
4. Discussion
The present study evaluated AOD (550 nm)-derived from MODIS observations and MERRA-2 reanalysis against three AERONET ground-based stations: one is located in Turkey, while the others are in Athens, Greece, and on Cyprus, with respect to the period 2013–2017. The availability in both MODIS Aqua and Terra AOD is found to be low due to cloudy conditions [2] and hazy days [55]. Even so, the statistics are higher when combining AOD from the two platforms. By considering MODIS Aqua and Terra combined, the availability in AOD is 37%, 32%, and 34% for the AERONET Athens-NOA, Mersin ERDEMLI, and Cyprus CUT-TEPAK stations, respectively. In the validation against AERONET, AOD derived by MODIS Aqua and Terra combined is associated with higher R2 and lower RMSDrel compared to AODs derived from separated platforms. These findings are in line with retrievals of AOD over land and ocean by [42] and [56], respectively. However, in the latter study, the opposite occurs for retrievals of AOD over land.
In the comparison with AERONET, it was found that MODIS overestimates AOD by about 20%, both considering daily and monthly averaging. This is in line with previous studies [53,57]. On the other hand, MERRA-2 underestimates AOD with 9–20% with respect to daily and monthly averaging. Shi et al. [47] found also an underestimation of MERRA-2 AOD. This might be due to nitrate pollutants that are not included in the AOD model [48]. The spatial resolution of MERRA-2 AOD is substantially lower than MODIS (62.5 × 50 km2 and 10 × 10 km2, respectively), which may contribute to the underestimation of the former platform. In addition, AODs derived from MISR (Microwave Integrated Retrieval System) are included in the MERRA-2 reanalysis, which are associated with higher uncertainties than the MODIS AODs. The Error Envelope (EE) is ± (0.2 AOD) and ± (0.05 + 0.15 AOD) for MISR and MODIS, respectively [58].
The discrepancies that are found in the present study between satellite-retrieved and ground-based measured AOD may be due to a variety of factors such as the selection of satellite pixels and the approach to reducing surface reflectance. Increasing the number of available AODs with respect to the box with the number of satellite pixels used and collocation window size during sampling increases correlation and declines bias [45]. Increasing the numbers of available MODIS and AERONET AOD values for each MODIS–AERONET pair reduces bias and improves the results of the validation [59]. Globally, satellite-derived AOD is usually associated with smaller bias compared to retrievals of AOD at a particular site, and the high spatial resolution of aerosol gridded data reveals aerosols features efficiently [43]. Inhomogeneous land cover and surface properties cause large uncertainties in the estimations of surface reflection and thus satellite AOD [54].
AOD derived from both MODIS observations and MERRA-2 reanalysis is the highest in summer and lowest in winter over Turkey. One reason for this finding might be due to soil moisture declining in summer associated with higher temperatures, which resuspends surface dusts [60]. The long-range transport of dust aerosols from the Middle East and North Africa probably also increases aerosol loadings over Turkey in the summer [61,62]. For example, the same results have been found for AOD over Saudi Arabia [48], India, and Nigeria [63,64]. Equation (2) shows that the R2 obtained in the comparison between MODIS/MERRA-2 and AERONET AOD is correlated to atmospheric RH. These results are compatible with previous studies [65,66,67]. However, when investigating other statistical parameters in the present study, such as slope, offset, RMSE, and RMB, a relation with RH does not occur when all three AEROENET sites are taken into consideration. Furthermore, extreme aerosol conditions such as dust events were detected more effectively by MODIS than MERRA-2. Furthermore, the accuracy of MERRA-2 AOD with respect to AERONET measurements was found to be lower than that of MODIS AOD. The latter was also found by Jin et al. [54]. These findings may be due to the spatial resolution, which is substantially higher for MODIS compared to MERRA-2. The results obtained in this study can be used to empirically relate AOD with in situ measurements of PM2.5 to study air quality effects over Turkey. This work is planned to be carried out in a subsequent investigation.
5. Conclusions
Combining MODIS Terra and Aqua observations over the present AERONET ground-based sites increases the number of available daily AODs from 30%, when only one platform was taken into consideration, to 34%. For MODIS, available days included in the monthly averaging ranged between 44% for January and 92% for August, while with respect to season, the range is between 51% and 85% for winter and summer, respectively. The comparison between MODIS and AERONET showed that the combined datasets of MODIS and MERRA-2 are associated with the highest R2 and lowest RMSDrel/MAE values. MODIS AOD agrees better with AERONET than MERRA-2, which means higher R2 and lower RMSDrel/MAE. There is a clear annual variation in AOD detected by the three platforms. However, MODIS and MERRA-2 overall tend to overestimate and underestimate AOD, respectively, in the comparison with AERONET. Furthermore, MODIS detected substantially more days with extreme events (AOD>0.5) than MERRA-2, which means 55% and 24%, respectively, in comparison to AERONET. Finally, based on the statistical analysis, there was no clear relation found between the accuracy in MODIS AOD and RH.
Author Contributions
This study was carried out in cooperation between three authors. The main author M.A. brought the idea of this study and performed the main analysis of the data. F.B.B. supervised during the process and contributed to manuscript writing. P.G. hosted M.A. at the Department of Environmental Science, Stockholm University, Sweden. He supervised during the analysis process and contributed to manuscript writing. All authors have read and agreed to the published version of the manuscript.
Funding
This research received no external funding.
Acknowledgments
PhD researcher at the Institute of Atmospheric Physics in the Chinese Academy of Science (CAS) in China-Beijing, Abdallah Shaheen, is acknowledged for his unlimited help in obtaining the data.
Conflicts of Interest
The authors declare no conflict of interest
Appendix A

Table A1.
Daily mean AOD for days classified as extreme events according to AERONET values equal or above the threshold 0.5, with respect to the three ground-based stations. The numbers 0 and 1 for MODIS and MERRA-2 indicate if detection of extreme events has been done or not, respectively.
Table A1.
Daily mean AOD for days classified as extreme events according to AERONET values equal or above the threshold 0.5, with respect to the three ground-based stations. The numbers 0 and 1 for MODIS and MERRA-2 indicate if detection of extreme events has been done or not, respectively.
| Station (I) ATHENS-NOA | ||||
| AERONET | MODIS | MERRA-2 | MODIS C6.1 | MERRA-2 |
| 0.722 | 0.841 | 0.552 | 1 | 1 |
| 0.621 | 0.632 | 0.228 | 1 | 0 |
| 1.210 | 1.171 | 1.107 | 1 | 1 |
| 0.810 | 0.707 | 0.167 | 1 | 0 |
| 0.575 | 0.591 | 0.422 | 1 | 0 |
| 0.694 | 0.833 | 0.549 | 1 | 1 |
| 0.532 | 0.676 | 0.264 | 0 | 0 |
| 0.607 | 0.592 | 0.614 | 1 | 1 |
| Number of extreme events with respect to AERONET (in %) | 88 | 50 | ||
| Station (II) METU-ERDEMLI | ||||
| 0.527 | 0.295 | 0.255 | 0 | 0 |
| 0.672 | 0.703 | 0.271 | 1 | 0 |
| 0.860 | 0.891 | 0.372 | 1 | 0 |
| 0.657 | 0.354 | 0.292 | 0 | 0 |
| 0.658 | 0.707 | 0.456 | 1 | 0 |
| 0.681 | 0.201 | 0.712 | 0 | 1 |
| 0.501 | 0.447 | 0.331 | 0 | 0 |
| 0.515 | 0.443 | 0.338 | 0 | 0 |
| 0.525 | 0.616 | 0.307 | 1 | 0 |
| 0.604 | 0.317 | 0.211 | 0 | 0 |
| 0.644 | 0.439 | 0.252 | 0 | 0 |
| 0.531 | 0.282 | 0.170 | 0 | 0 |
| 0.521 | 0.445 | 0.131 | 0 | 0 |
| 0.530 | 0.336 | 0.282 | 0 | 0 |
| 0.510 | 0.177 | 0.161 | 0 | 0 |
| 0.536 | 0.324 | 0.312 | 0 | 0 |
| 0.507 | 0.495 | 0.245 | 0 | 0 |
| 0.514 | 0.508 | 0.315 | 1 | 0 |
| 0.567 | 0.388 | 0.280 | 0 | 0 |
| 0.527 | 0.295 | 0.255 | 0 | 0 |
| Number of extreme events with respect to AERONET (in %) | 25 | 10 | ||
| Station (III) CUT-TEPAK | ||||
| 0.613 | 0.607 | 0.292 | 1 | 0 |
| 0.684 | 0.687 | 0.506 | 1 | 0 |
| 0.512 | 0.521 | 0.416 | 1 | 1 |
| 0.977 | 0.979 | 0.721 | 1 | 0 |
| 0.768 | 0.700 | 0.936 | 1 | 0 |
| 0.642 | 0.692 | 0.505 | 1 | 1 |
| 0.529 | 0.400 | 0.280 | 0 | 0 |
| Number of extreme events with respect to AERONET (in %) | 86 | 29 | ||
Table A2.
Comparison of a results of seven previous studies that were conducted over Europe, Asia, Middle East, and Africa. Comparison was done by the mean of (i) Study area, (ii) Number of ground stations included sites, (iii) Used gridded datasets, (iv) Overestimation and underestimation of ground station data by gridded data, (v) Ability of gridded data to detect extreme events that were measured by the ground stations, and (vi) Brief statistical numeric of the whole dataset regression of gridded data as a function of ground stations AOD.
| Study | Study Area | Ground Stations | Gridded Datasets | Overestimation/ Underestimation | Extreme Events | Statistical Results |
|---|---|---|---|---|---|---|
| [50] | Asia, Middle East and North Africa | 16 AERONET | DB, DT, and DB/DT of the MODIS C6.1 | DT and DB/DT overestimated AERONET. DB underestimated. | N/A | DB/DT: A = 0.934, b = 0.073, R2 = 0.707, RMSE = 0.238, RMB = 1.082. |
| [15] | Central Europe | 8 AERONET | AVHRR (NOAA-16), Aqua and Terra of MODIS C004 | Both Aqua and Terra overestimated AERONET, while AVHRR underestimate. | N/A | N/A |
| [47] | Global | 400 AERONET | MODIS C6.1, MERRA-2 and MERRAero | MODIS overestimated while MERRA-2 and MERRAero underestimated AERONET. | MODIS C6.1 detected extreme events better than MERRA-2 and MERRAero. | MODIS: a = 0.976, b = 0.016, R2 = 0.790, RMSE = 0.110, MBE = 0.011. MERRA-2: a = 0.726, b = 0.043, R2 = 0.700, RMSE = 0.119, MBE = −0.008. |
| [53] | China | 13 AERONET | MODIS C005 | Overestimated small AOD values; underestimated large ones. | Poor MODIS performance to detect extreme events. | MODIS: a = 1.008, b = 0.132, R2 = 0.661. RMSE and RMB are N/A. |
| [54] | Yangtze River China | One local station site in Wuhan University | MODIS C6.1 | Overestimated ground station data, though underestimated in extreme events. | Effective at detecting extreme events, though it underestimated them. | Terra: a = 0.747, b = 0.089, R2 = 0.795, RMSE = 0.129. Aqua: a = 0.703, b = 0.136, R2 = 0.788, RMSE = 0.181. |
| [45] | Eastern Mediterranean | 13 AERONET | MODIS C5.1 Terra and Aqua | MODIS overestimated AERONET in both Terra and Aqua. | Both Terra and Aqua were effective in extreme events detection. | Terra: a = 1.007, b = 0.022, R2 = 0.578, RMSE = 0.129, RMB = 11.59%. Aqua: a = 1.113, b = 0.027, R2 = 0.608, RMSE = 0.12, RMB = 25.18%. |
| [41] | Eastern Mediterranean | 9 AERONET | MODIS C6.1 and MERRA-2 | MODIS overestimated while MERRA-2 underestimated AERONET. | MODIS was more effective in detecting extreme events than MERRA2. | MODIS: a = 0.64, b = 0.12, R2 = 0.505, RMSE = 0.122, RMB = 1.198. MERRA-2: a = 0.59, b = 0.06, R2 = 0.576, RMSE = 0.104, RMB = 0.862%. |
N/A: Not Available, a: Slope, b: Intercept, DB: Deep Blue, DT: Dark Target, MBE: Mean Biased Error, NMB: Normalized Mean Bias.
References
- IPCC. Managing the Risks of Extreme Events and Disasters to Advance Climate Change Adaptation. In A Special Report of Working Groups I and II of the Intergovernmental Panel on Climate Change; Field, C.B., Barros, V., Stocker, T.F., Qin, D., Dokken, D.J., Ebi, K.L., Mastrandrea, M.D., Mach, K.J., Plattner, G.K., Allen, S.K., et al., Eds.; Cambridge University Press: Cambridge, UK; New York, NY, USA, 2012; p. 582. [Google Scholar]
- Che, H.; Gui, K.; Xia, X.; Wang, Y.; Holben, B.N.; Goloub, P.; Cuevas, E.A.; Wang, H.; Zheng, Y.; Zhao, H.; et al. Large contribution of meteorological factors to inter-decadal changes in regional aerosol optical depth. Atmos. Chem. Phys. 2019, 19, 10497–10523. [Google Scholar] [CrossRef] [Green Version]
- Li, X.; Zhang, C.; Zhang, B.; Liu, K. A comparative time series analysis and modeling of aerosols in the contiguous United States and China. Sci. Total Environ. 2019, 690, 799–811. [Google Scholar] [CrossRef] [PubMed]
- Gao, l.; Chen, L.; Li, J.; Heidinger, A.K.; Xu, X.; Qin, S. A long-term historical Aerosol Optical Depth data record (1982–2011) Over China From AVHRR. IEEE Trans. Geosci. Remote Sens. 2018, 57, 2467–2480. [Google Scholar] [CrossRef]
- Smirov, A.; Holben, B.N.; Eck, T.F.; Dubovik, K.O. Cloud-screening and quality control algorithms for the AERONET database. Remote Sens. Environ. 2000, 73, 337–349. [Google Scholar] [CrossRef]
- Gueymard, C.A.; George, A. Gridded Aerosol Optical Depth Climatological Datasets Over Continents for Solar Radiation Modeling. In Proceedings of the Solar World Congress, Orlando, FL, USA, 8–12 November 2005; American Solar Energy Society: Orlando, FL, USA, 2005. [Google Scholar]
- Li, J.; Carlson, B.; Lacis, A.A. How well do satellite AOD observations represent the spatial and temporal variability of PM2.5 concentration for the United States? Atmos. Environ. 2015, 102, 260–273. [Google Scholar] [CrossRef]
- Xiao, Q.; Wang, Y.; Chang, H.H.; Meng, X.; Geng, G.; Lyapustin, A.; Liu, Y. Full-coverage high-resolution daily PM2.5 estimation using MAIAC AOD in the Yangtze River Delta of China. Remote Sens. Environ. 2017, 199, 437–446. [Google Scholar] [CrossRef]
- Kahya, C.; Balcik, F.B.; Oztaner, Y.B.; Ozcomak, D.; Seker, D.Z. Spatio-temporal analysis of PM2.5 over Marmara region, Turkey. Fresenius Environ. Bull. 2017, 26, 310–317. [Google Scholar]
- Li, J.; Carlson, B.; Lacis, A.A. Application of spectral analysis techniques to the intercomparison of aerosol data—Part 4: Synthesized analysis of multisensor satellite and ground-based AOD measurements using combined maximum covariance analysis. Atmos. Meas. Tech. 2014, 7, 2531–2549. [Google Scholar] [CrossRef]
- Bhaskaran, S.; Philip, N.; Rahman, A.; Mallick, J. Applications of satellite data for Aerosol Optical Depth (AOD) retrievals and validation with AERONET data. Atmos. Clim. Sci. 2011, 1, 61–67. [Google Scholar] [CrossRef] [Green Version]
- Fan, X.; Xia, X.; Chen, H. Intercomparison of multiple satellite aerosol products against AERONET over the north China Plain. Atmosphere 2019, 10, 480. [Google Scholar] [CrossRef] [Green Version]
- Mei, L.; Xue, Y.; Leeuw, G.; Guang, J.; Wang, Y.; Li, Y.; Xu, H.; Yang, L.; Hou, T.; He, X.; et al. Integration of remote sensing data and surface observations to estimate the impact of the Russian wildfires over Europe and Asia during August 2010. Biogeosciences 2011, 8, 3771–3791. [Google Scholar] [CrossRef] [Green Version]
- Huang, J.; Kondragunta, S.; Laszlo, I.; Liu, H.; Remer, L.A.; Zhang, H.; Superczynski, S.; Ciren, P.; Holben, B.N.; Petrenko, M. Validation and expected error estimation of Suomi-NPP VIIRS aerosol optical thickness and Ångström exponent with AERONET. J. Geophys. Res. Atmos. 2016, 121, 7139–7160. [Google Scholar] [CrossRef] [Green Version]
- Hauser, A.; Oesch, D.; Foppa, N. Aerosol optical depth over land: Comparing AERONET, AVHRR and MODIS. Geophys. Res. Lett. 2005, 32, L17816. [Google Scholar] [CrossRef]
- Sayer, A.M.; Hsu, N.C.; Lee, J.; Carletta, N.; Chen, S.H.; Smirov, A. Evaluation of NASA Deep Blue/SOAR aerosol retrieval algorithms applied to AVHRR measurements. J Geophys. Res. Atmos. 2017, 122, 9945–9967. [Google Scholar] [CrossRef]
- Tan, Y.; Li, E.; Zhang, Z.; Lin, X.; Chi, Y.; Zhou, L.; Wu, C.; Wang, Q. Validation of POLDER-3/GRASP aerosol products using AERONET measurements over China. Atmos. Environ. 2019, 215, 116893. [Google Scholar] [CrossRef]
- Pilinis, C.; Seinfeld, J.H.; Grosjean, D. Water content of atmospheric aerosols. Atmos. Environ. 1989, 23, 1601–1606. [Google Scholar] [CrossRef]
- Malm, W.C.; Day, D.E.; Kreidenweis, S.M.; Collett, J.L.; Lee, T. Humidity-dependent optical properties of fine particles during the Big Bend Regional Aerosol and Visibility Observational Study. J. Geophys. Res. Atmos. 2003, 108, 4279. [Google Scholar] [CrossRef] [Green Version]
- Zieger, P.; Weingartner, E.; Henzing, J.; Moerman, M.; De Leeuw, J.; Mikkila, J.; Ehn, M.; Peteja, T.; Clemer, K.; Van Roozendael, M.; et al. Comparison of ambient aerosol extinction coefficients obtained from in-situ, MAX-DOAS and LIDAR measurements at Cabauw. Atmos. Chem. Phys. Discuss. 2010, 10, 29683–29734. [Google Scholar] [CrossRef] [Green Version]
- Shmirko, K.; Pavlov, A.; Zubko, E. Coating effect on light scattering by irregularly shaped particles. J. Quant. Spectrosc. Radiat. Transfer 2018, 215, 71–76. [Google Scholar] [CrossRef]
- Yan, P.; Pan, X.; Tang, J.; Zhou, X.; Zhang, R.; Zeng, L. Hygroscopic growth of aerosol scattering coefficient: Acomparative analysis between urban and suburban sites at winter in Beijing. Particuology 2009, 7, 52–60. [Google Scholar] [CrossRef]
- Coen, M.C.; Weingartner, E.; Apituley, A.; Ceburnis, D. Minimizing light absorption measurement artifacts of the Aethalometer: Evaluation of five correction algorithms. Atmos. Meas. Tech. 2010, 3, 457–474. [Google Scholar] [CrossRef] [Green Version]
- WMO and GAW. Report: World Meteorological Organization and Global Atmosphere Watch Report: Aerosol Measurement Procedures, Guidelines and Recommendations, 2nd ed.; Baltensperger, U., Benedetti, A., Fiebig, M., Popp, T.H., Kinne, S., Laj, P., Li, S.M., Ogren, J.A., Pappalarado, G., Petzold, A., et al., Eds.; GAW Report No. 227; Chairperson Publication Board: Geneva, Switzerland, 2016.
- Burgos, M.A.; Andrews, E.; Titos, G.; Arboledas, L.A.; Baltensperger, U.; Day, D.; Jefferson, A.; Kalivitis, N.; Mihalopoulos, N.; Sherman, J.; et al. A global view on the effect of water uptake on aerosol particle light scattering. Sci. Data 2019, 6, 157. [Google Scholar] [CrossRef] [PubMed] [Green Version]
- Morgan, W.T.; Allan, J.D.; Bower, K.N.; Esselborn, M.; Harris, B.; Henzing, J.S.; Highwood, E.J.; Scharr, A.K.; McMeeking, G.R.; Mensah, A.A.; et al. Enhancement of the aerosol direct radiative effect by semi-volatile aerosol components: Airborne measurements in North-Western Europe. Atmos. Chem. Phys. 2010, 10, 8151–8171. [Google Scholar] [CrossRef] [Green Version]
- Voss, K.J.; Welton, E.J.; Quinn, P.K.; Frouin, R.; Miller, M.; Michael, R. Aerosol optical depth measurements during the Aerosols99 experiment. J. Geophys. Res. Atmos. 2001, 106, 20811–20819. [Google Scholar] [CrossRef]
- Organization of Economic Cooperation and Development. Report: OECD Country Fact Sheet, the Governance of Land Use, Turkey; OECD Online Publication: Paris, France, 2017. [Google Scholar] [CrossRef]
- European Commission. Report: Country Report, Turkey. Communication from the Commission to the European Parliament, the council, the European Economic and Social Committee and the Committee of the Regions, No: SWD(2019) 220 Final, Com.(2019) 260 Final; European Commission Online Publication: Brussels, Belgium, 29 May 2019. [Google Scholar]
- Health and Environment Alliance (HEAL). Report: Air Pollution and Health in Turkey: Facts, Figures and Recommendation; HEAL Online Publication: Brussels, Belgium, 2015. [Google Scholar]
- European Environment Agency. Report: EEA, Air Quality in Europe, 2019; Report No: 10/2019; European Environmental Agency: Copenhagen, Denmark, 2019; ISSN 1977-8449. ISBN 978-92-9480-088-6. [Google Scholar] [CrossRef]
- NASA MODIS Webpage. Available online: http://modis.gsfc.nasa.gov (accessed on 3 May 2020).
- Hsu, N.C.; Jeong, M.J.; Bettenhausen, C.; Sayer, A.M.; Hansell, R.; Seftor, C.S.; Huang, J.; Tsay, S.C. Enhanced Deep Blue aerosol retrieval algorithm: The second generation. J. Geophys. Res. Atmos 2013, 118, 9296–9315. [Google Scholar] [CrossRef]
- NASA Earth Data Giovanni Webpage. Available online: https://giovanni.gsfc.nasa.gov/giovanni/ (accessed on 3 May 2020).
- NASA GODDARD Space Flight Center AERONET. Available online: https://aeronet.gsfc.nasa.gov/ (accessed on 3 May 2020).
- Tutsak, E.; Kocak, M. Long-term measurements of aerosol optical and physical properties over the Eastern Mediterranean: Hygroscopic nature and source regions. Atmos. Environ. 2019, 207, 1–15. [Google Scholar] [CrossRef]
- Hadjimitsis, D.G.; Mamouri, R.E.; Nisantzi, A.; Kouremerti, N.; Retalis, A.; Paronis, D.; Tymvios, F.; Perdikou, S.; Achilleos, S.; Hadjicharalambous, M.A.; et al. Chapter 7: Air Pollution from Space. In Remote Sensing of Environment: Integrated Approaches, 1st ed.; InTech: Rijeka, Croatia, 2013; pp. 181–211. [Google Scholar] [CrossRef] [Green Version]
- Raptis, I.P.; Kazadsiz, S.; Amiridis, V.; Gkikas, A.; Gerasopoulos, E.; Mihalopoulos, N. A decade of aersols optical properties over Athens, Greece. Atmosphere 2020, 11, 154. [Google Scholar] [CrossRef] [Green Version]
- Altaratz, O.; Bar-Or1, R.Z.; Wollner, U.; Koren, I. Relative humidity and its effect on aerosol optical depth in the vicinity of convective clouds, 2018. Environ. Res. Lett. 2013, 8, 034025. [Google Scholar] [CrossRef]
- Wather Spark. Available online: https://weatherspark.com/y/95434/Average-Weather-in-%C4%B0stanbul-Turkey-Year-Round (accessed on 3 May 2020).
- Shaheen, A.; Wu, R.; Aldabash, M. Long-term AOD trend assessment over the Eastern Mediterranean region: A comparative study including a new merged aerosol product. Atmos. Environ. 2020, 238, 117736. [Google Scholar] [CrossRef]
- Sogacheva, L.; Popp, T.; Sayer, A.M.; Dubovik, O.; Garay, M.J.; Heckel, A.; Hsu, N.C.; Jethva, H.; Kahn, R.A.; Kolmonen, P.; et al. Merging regional and global aerosol optical depth records from major available satellite products. Atmos. Chem. Phys. 2020, 20, 2031–2056. [Google Scholar] [CrossRef] [Green Version]
- Levy, R.; Mattoo, S.; Sawyer, V.; Shi, Y.; Colarco, P.; Lyapustin, A.I. Exploring systematic offsets between aerosol products from the two MODIS sensors. Atmos. Meas. Tech. 2018, 11, 4073–4092. [Google Scholar] [CrossRef] [PubMed] [Green Version]
- Schutgens, N.; Sayer, A.M.; Heckel, A.; Hsu, C.; Jethva, H.; de Leeuw, G.; Leonard, P.J.T.; Levy, R.C.; Lipponen, A.; Lyapustin, A.; et al. Intercomparison of satellite AOD datasets for aerosol model evaluation. Atmos. Chem. Phys. Discuss. 2020. [Google Scholar] [CrossRef]
- Georgoulas, A.K.; Alexandri, G.; Kourtidis, K.A.; Lelieveld, J.; Zains, P.; Poschl, U.; Levy, R.; Amiridis, A.; Marinou, E.; Tsikerdekis, A. Spatiotemporal variability and contribution of different aerosol types to the aerosol optical depth over the Eastern Mediterranean. Atmos. Chem. Phys. Discuss. 2016. [Google Scholar] [CrossRef] [PubMed] [Green Version]
- Perez, C.; Nickovic, S.; Baldasano, M.; Sicard, M.; Rocadenbosch, F.; Cachorro, V.E. A long Saharan dust event over the western Mediterranean: Lidar, Sun photometer observations, and regional dust modeling. J. Geophys. Res. 2006, 111, D152214. [Google Scholar] [CrossRef]
- Shi, H.; Xiao, Z.; Zhan, X.; Ma, H.; Tian, X. Evaluation of MODIS and two reanalysis aerosol optical depth products over AERONET sites. Atmos. Res. 2019, 220, 75–90. [Google Scholar] [CrossRef]
- Buchard, V.; Randles, C.A.; Da Silva, A.M.; Darmenov, A.; Colarco, P.R.; Govindaraju, R.; Ferrare, R.; Hair, J.; Beyersdorf, A.J.; Ziemba, L.D.; et al. The MERRA-2 aerosol reanalysis, 1980 onward Part II: Evaluation and case studies. J. Clim. 2017, 30, 6851–6872. [Google Scholar] [CrossRef]
- Mukkavilli, S.K.; Prasad, A.A.; Taylor, R.A.; Huang, J.; Mitchell, R.M.; Troccoli, A.; Kay, M.J. Assessment of atmospheric aerosols from two reanalysis products over Australia. Atmos. Res. 2018. [Google Scholar] [CrossRef] [Green Version]
- Tian, X.; Gao, Z. Validation and accuracy assessment of MODIS C6.1 aerosol products over the heavy aerosol loading area. Atmosphere 2019, 10, 548. [Google Scholar] [CrossRef] [Green Version]
- Donkelaar, A.V.; Martin, R.V.; Levy, R.C.; Da Silva, A.M.; Krzyzanowski, M.; Chubarova, N.E.; Semutnikova, E.; Cohen, A.J. Satellite-based estimates of ground-level fine particulate matter during extreme events: A case study of the Moscow fires in 2010. Atmos. Environ. 2011, 45, 6225–6232. [Google Scholar] [CrossRef]
- Sehatkashani, S.; Vazifedoust, M.; Kamali, G.; Bidokhti, A.A. Dust detection and AOT estimation using combined VIR and TIR satellite images in urban areas of Iran. Sci. Iran. A 2016, 23, 1984–1993. [Google Scholar] [CrossRef] [Green Version]
- Li, B.; Yuan, H.; Feng, N.; Tao, S. Comparing MODIS and AERONET aerosol optical depth over China. Int. J. Remote Sens. 2009, 30, 6519–6529. [Google Scholar] [CrossRef]
- Jin, S.; Ma, Y.; Zhang, M.; Gong, W.; Dubovik, O.; Liu, B.; Shi, Y.; Yang, C. Retrieval of 500 m Aerosol Optical Depths from MODIS measurements over urban surfaces under heavy aerosol loading conditions in winter. Remote Sens. 2019, 11, 2218. [Google Scholar] [CrossRef] [Green Version]
- Mao, F.; Duan, M.; Min, Q.; Gong, W.; Pan, Z.; Liu, G. Investigating the impact of haze on MODIS cloud detection. J. Geophys. Res. Atmos. 2015, 120, 12237–12247. [Google Scholar] [CrossRef]
- McPhetres, A.; Aggarwal, S. An evaluation of MODIS-retrieved Aerosol Optical Depth over AERONET Sites in Alaska. Remote Sens. 2018, 10, 1384. [Google Scholar] [CrossRef] [Green Version]
- Xiang’ao, X. Significant overestimation of global aerosol optical thickness by MODIS over land. Chin. Sci. Bull. 2006, 51, 2905–2912. [Google Scholar] [CrossRef]
- Kahn, R.A.; Gaitley, B.J.; Martonchik, J.V.; Diner, D.J.; Crean, K.A. Multiangle Imaging Spectroradiometer (MISR) global aerosol optical depth validation based on 2 years of coincident Aerosol Robotic Network (AERONET) observations. J. Geophys. Res. Atmos. 2005, 110, D10S04. [Google Scholar] [CrossRef] [Green Version]
- Levy, R.C.; Remer, L.; Kleidman, R.; Mattoo, S. Global evaluation of the Collection 5 MODIS dark-target aerosol products over land. Atmos. Chem. Phys. 2010, 10399–10420. [Google Scholar] [CrossRef] [Green Version]
- Prasad, A.K.; Singh, R.P.; Kafatos, M.; Singh, A. Effect of the Growing Population on the Air Pollution, Climatic Variability and Hydrological Regime of the Ganga Basin, India. In Proceedings of the Symposium S6 Held during the Seventh IAHS Scientific Assembly, Foz do Iguaçu, Brazil, 3–9 April 2005; IAHS Publication: Foz do Iguaçu, Brazil, 2005; p. 295. [Google Scholar]
- Ali, A.; Assiri, M.; Dambul, R. Seasonal Aerosol Optical Depth (AOD) Variability Using Satellite Data and its Comparison over Saudi Arabia for the Period 2002–2013. Aerosol Air Qual. Res. 2019, 17, 1267–1280. [Google Scholar] [CrossRef]
- Li, F.; Ramanthan, V. Winter to summer monsoon variation of aerosol optical depth over the tropical Indian Ocean. J. Geophys. Res. 2002, 107, 4284. [Google Scholar] [CrossRef]
- Sivaprasad, P.; Babu, C.A. Seasonal variation and classification of aerosols over an inland station in India. Meteorol. Appl. 2012, 21, 241–248. [Google Scholar] [CrossRef]
- Ayanlade, A.; Atai, G.; Jegede, M.O. Spatial and seasonal variations in atmospheric aerosols over Nigeria: Assessment of influence of intertropical discontinuity movement. J. Ocean Clim. 2019, 9, 1759313118820306. [Google Scholar] [CrossRef] [Green Version]
- Schutgens, N.A.J.; Nakata, M.; Nakajima, T. Validation and empirical correction of MODIS AOT and AE over ocean. Atmos. Meas. Tech. 2013, 6, 2455–2475. [Google Scholar] [CrossRef] [Green Version]
- Kent, G.S.; Trepte, C.R.; Skeens, K.M.; Winker, D.M. LITE and SAGE II measurements of aerosols in the Southern Hemisphere upper troposphere. J. Geophys. Res. Atmos. 1998, 103, 111–127. [Google Scholar] [CrossRef]
- Hobbs, P. Clean air slots amid atmospheric pollution. Nature 2002, 415, 861. [Google Scholar] [CrossRef]
Figure 1.
Validation of Moderate Resolution Imaging Spectroradiometer (MODIS) Aqua and Terra, and Modern-ERA Retrospective Analysis for Research and Application (MERRA-2) AOD against Aerosol Robotic Network (AERONET). (a) MODIS TERRA vs. AERONET, (b) MODIS Aqua vs. AERONET, (c) MODIS Aqua and Terra combined vs. AERONET, (d) MERRA-2 morning vs. AERONET, (e) MERRA-2 noon vs. AERONET, (f) MERRA-2 combined (semi-day) vs. AERONET. The color bars indicate the frequency of match points values.

Figure 2.
MERRA-2, MODIS, and AERONET monthly mean AOD, averaged according to three ground-based sites in Turkey (Section 2.2.3), and with corresponding statistics.
Figure 2.
MERRA-2, MODIS, and AERONET monthly mean AOD, averaged according to three ground-based sites in Turkey (Section 2.2.3), and with corresponding statistics.

Figure 3.
First and second columns present average annual scenes of MODIS Aqua and Terra combined and MERRA-2 AOD over Turkey, according to 50 × 50 km2 grid cells. MODIS 10 × 10 km2 and MERRA-2 50 × 62.5 km2 pixel sizes were converted to a grid of 50 × 50 km2 to obtain the same spatial resolution when comparing the two datasets. The third column shows the difference in AOD between MODIS and MERRA-2. A positive pixel value indicates that the MODIS annual AOD value is higher than that of MERRA-2, while a negative pixel value indicates the opposite.

Table 1.
Aerosol Robotic Network (AERONET) ground-based stations and obtained mean aerosol optical depth (AOD) for the period 2013–2017.
Table 1.
Aerosol Robotic Network (AERONET) ground-based stations and obtained mean aerosol optical depth (AOD) for the period 2013–2017.
| Station | City/Country | Coordinates | AMSL a (m) | Land Use | AOD b (550 nm) |
|---|---|---|---|---|---|
| METU-ERDEMLI | Mersin/Turkey | 36.34° N/34.14° E | 71 | Rural Area | 0.213 |
| CUT-TEPAK | Limassol/Cyprus | 34.68° N/33.04° E | 11 | Urbanized Area | 0.168 |
| Athens-NOA | Athens/Greece | 37.97° N/23.72° E | 105 | Moderately Populated Area | 0.157 |
Table 2.
Statistical metrics of MODIS and MERRA-2 AOD against AERONET AOD according to season for the stations (I) Athens-NOA, (II) METU-ERDEMLI, and (III) CUT-TEPAK.
Table 2.
Statistical metrics of MODIS and MERRA-2 AOD against AERONET AOD according to season for the stations (I) Athens-NOA, (II) METU-ERDEMLI, and (III) CUT-TEPAK.
| Dataset | MODIS C6.1 | MERRA-2 | ||||||
|---|---|---|---|---|---|---|---|---|
| Season | Winter | Spring | Summer | Autumn | Winter | Spring | Summer | Autumn |
| Station (I) | ATHENS-NOA Athens | |||||||
| RH(%) | 73 | 67 | 64 | 72 | 73 | 67 | 64 | 72 |
| N | 51 | 95 | 241 | 148 | 148 | 157 | 322 | 235 |
| Slope | 0.604 | 0.831 | 0.882 | 0.673 | 0.564 | 0.662 | 0.691 | 0.540 |
| Intercept | 0.061 | 0.063 | 0.072 | 0.094 | 0.031 | 0.054 | 0.033 | 0.062 |
| R2 | 0.545 | 0.590 | 0.666 | 0.527 | 0.533 | 0.576 | 0.652 | 0.511 |
| RMSE | 0.051 | 0.079 | 0.083 | 0.125 | 0.059 | 0.074 | 0.062 | 0.073 |
| MAE | 0.036 | 0.061 | 0.063 | 0.079 | 0.039 | 0.053 | 0.044 | 0.047 |
| Station (II) | METU-ERDEMLI Mersin | |||||||
| RH(%) | 64 | 56 | 56 | 63 | 64 | 56 | 56 | 63 |
| N | 101 | 176 | 277 | 183 | 120 | 235 | 323 | 215 |
| Slope | 0.771 | 0.819 | 0.746 | 0.804 | 0.653 | 0.596 | 0.559 | 0.464 |
| Intercept | 0.069 | 0.079 | 0.053 | 0.067 | 0.016 | 0.050 | 0.015 | 0.042 |
| R2 | 0.563 | 0.641 | 0.614 | 0.560 | 0.503 | 0.567 | 0.539 | 0.520 |
| RMSE | 0.071 | 0.086 | 0.079 | 0.078 | 0.069 | 0.084 | 0.137 | 0.082 |
| MAE | 0.054 | 0.067 | 0.058 | 0.056 | 0.052 | 0.060 | 0.114 | 0.058 |
| Station (III) | CUT-TEPAK Cyprus | |||||||
| RH(%) | 56 | 64 | 65 | 63 | 56 | 64 | 65 | 63 |
| N | 105 | 170 | 100 | 97 | 140 | 201 | 103 | 110 |
| Slope | 0.780 | 0.794 | 0.723 | 0.921 | 0.567 | 0.646 | 0.668 | 0.435 |
| Intercept | 0.054 | 0.102 | 0.111 | 0.050 | 0.030 | 0.053 | 0.062 | 0.063 |
| R2 | 0.798 | 0.645 | 0.639 | 0.699 | 0.634 | 0.589 | 0.542 | 0.573 |
| RMSE | 0.047 | 0.104 | 0.085 | 0.066 | 0.062 | 0.087 | 0.062 | 0.093 |
| MAE | 0.036 | 0.075 | 0.060 | 0.048 | 0.040 | 0.048 | 0.049 | 0.053 |
© 2020 by the authors. Licensee MDPI, Basel, Switzerland. This article is an open access article distributed under the terms and conditions of the Creative Commons Attribution (CC BY) license (http://creativecommons.org/licenses/by/4.0/).
Share and Cite
MDPI and ACS Style
Aldabash, M.; Bektas Balcik, F.; Glantz, P. Validation of MODIS C6.1 and MERRA-2 AOD Using AERONET Observations: A Comparative Study over Turkey. Atmosphere 2020, 11, 905. https://0-doi-org.brum.beds.ac.uk/10.3390/atmos11090905
AMA Style
Aldabash M, Bektas Balcik F, Glantz P. Validation of MODIS C6.1 and MERRA-2 AOD Using AERONET Observations: A Comparative Study over Turkey. Atmosphere. 2020; 11(9):905. https://0-doi-org.brum.beds.ac.uk/10.3390/atmos11090905
Chicago/Turabian StyleAldabash, Midyan, Filiz Bektas Balcik, and Paul Glantz. 2020. "Validation of MODIS C6.1 and MERRA-2 AOD Using AERONET Observations: A Comparative Study over Turkey" Atmosphere 11, no. 9: 905. https://0-doi-org.brum.beds.ac.uk/10.3390/atmos11090905
Note that from the first issue of 2016, this journal uses article numbers instead of page numbers. See further details here.