Article

Spatial Characteristics of PM2.5 Pollution among Cities and Policy Implication in the Northern Part of the North China Plain

1
School of Environmental and Chemical Engineering, Shanghai University, Shanghai 200444, China
2
Key Laboratory of Organic Compound Pollution Control Engineering, Shanghai University, Shanghai 200444, China
3
Institute of Urban Meteorology (IUM), China Meteorological Administration (CMA), Beijing 100089, China
4
School of Economics, Shanghai University, Shanghai 200444, China
5
The Joint Graduate School of Energy and Environment, King Mongkut’s University of Technology Thonburi, Bangkok 10140, Thailand
6
Center of Excellence on Energy Technology and Environment, Ministry of Higher Education, Science, Research and Innovation, Bangkok 10140, Thailand
7
Research Institute of Chemical Defense, Beijing 102205, China
*
Authors to whom correspondence should be addressed.
These two authors contribute equally.
Submission received: 12 November 2020 / Revised: 27 December 2020 / Accepted: 31 December 2020 / Published: 6 January 2021
(This article belongs to the Special Issue Air Quality Management)

Abstract

:
In the recent decade, the North China Plain (NCP) has been among the region’s most heavily polluted by PM2.5 in China. For the nonattainment cities in the NCP, joint pollution control with related cities is highly needed in addition to the emission controls in their own cities. However, as the basis of decision-making, the spatial characteristics of PM2.5 among these cities are still insufficiently revealed. In this work, the spatial characteristics among all nonattainment cities in the northern part of the North China Plain (NNCP) region were revealed based on data mining technologies including clustering, coefficient of divergence (COD), network correlation model, and terrain and meteorology analysis. The results indicate that PM2.5 pollution of cities with a distance of less than 180 km exhibits homogeneity in the NCP region. Especially, the sub-region, composed of Xinxiang, Hebi, Kaifeng, Zhengzhou, and Jiaozuo, was strongly homogeneous and a strong correlation exists among them. Compared with spring and summer, much stronger correlations of PM2.5 between cities were found in autumn and winter, indicating a strong need for joint prevention and control during these periods. All nonattainment cities in this region were divided into city-clusters, depending on the seasons and pollution levels to further helping to reduce their PM2.5 concentrations effectively. Air stagnation index (ASI) analysis indicates that the strong correlations between cities in autumn were more attributed to the transport impacts than those in winter, even though there were higher PM2.5 concentrations in winter. These results provided an insight into joint prevention and control of pollution in the NCP region.

Graphical Abstract

1. Introduction

Fine particulate matter (PM2.5; particulate matter with an aerodynamic diameter less than 2.5 μm) has been linked to negative impacts on human health [1,2,3]. As one of the rapidly developing countries, China has experienced rapid economic growth in the past two decades, but it has also triggered serious air pollution problems, especially in the northern and central regions [4]. Since a record-breaking severe haze episode occurred in January 2013, PM2.5 pollution in China has attracted wide attention [5,6]. With the launch of the three-year action plan in 2018 (i.e., to win the battle to protect the blue sky), clear targets have been set to improve air quality. For instance, an 18% reduction in PM2.5 concentration is required for all nonattainment cities at the prefecture-level and above. Moreover, compared with 2015, it is required to reduce the number of heavy pollution days by more than 25% by the end of 2020. Although air quality has improved significantly, haze pollution episode characterized by high concentrations of PM2.5 is still the most concerning issue in China [7,8,9], especially in the North China Plain (NCP) [10,11]. Reducing PM2.5 concentration for cities that do not meet the standards will still be an important task for air quality management in the next few years.
As revealed in many studies [12,13,14,15,16,17], the variations of PM2.5 concentrations are related to many processes, such as emission, transport, wet deposition, dry deposition, chemical reaction, and physical changes, but essentially these processes are controlled by emission and meteorological conditions. Many meteorological factors have significant impacts on PM2.5 concentrations. For instance, a shorter planetary boundary layer (PBL) usually leads to a higher PM2.5 concentration for constant emissions [18,19]. Accordingly, PM2.5 concentrations of two cities with the same change pattern of PBL height are usually strongly correlated. In addition, the transport of PM2.5 aided by winds can affect the PM2.5 concentration of neighboring cities, as a result, the correlations of PM2.5 concentrations among these cities can be enhanced. Hence, air pollution is usually not confined to certain cities but tends to show regional transport characteristics.
Many studies have shown that the concentration of PM2.5 in one city is caused not only by local emissions but also by transport contribution from nearby cities [20,21,22] For instance, it was found that PM2.5 in Baoding, a city in Hebei Province near Beijing, was transported to Beijing, while bidirectional PM2.5 transport was evident between Beijing and Tianjin [23]. Furthermore, PM2.5 concentration in China’s top three urban agglomerations was found to increase by 0.34% for every 1% increase in the average urbanization level of its neighboring cities [24], especially in Beijing–Tianjin–Hebei (BTH) where PM2.5 spillover effects were notably strong [25,26]. Therefore, the “territorial” environmental management system can not cope with the PM2.5 pollution problem of regional transport, and the establishment of a regional mechanism for joint prevention and control of air pollution is urgently needed.
As the initial effort of regional prevention, the Ministry of Ecology and Environment of the People’s Republic of China (MEEP) launched an air pollution prevention and control project called “One City One Policy” in the BTH region and its surrounding areas. The project involved Beijing, Tianjin, and other 26 cities (i.e., “2 + 26” cities) [27]. However, the understanding of joint prevention and control of PM2.5 was far from sufficient, which was attributed to the fact that the policy for joint prevention and control highly depends on the spatial correlation features of PM2.5 pollution among cities. Thus, a number of studies that had analyzed the spatial patterns of PM2.5 pollution in the “2 + 26” cities [27,28]. The results showed that the pollution centers of the “2 + 26” cities were located in Xingtai and Handan, and gradually moved southwestwards. It also stated that the reduction of PM2.5 pollution in this region is important for the mitigation of pollution in the whole NCP region.
Admittedly, PM2.5 pollution varies greatly with changes in meteorology conditions and emissions, and similarly, the correlation between the PM2.5 concentrations of the two cities also varies greatly. Some studies [26,29] provided analyses of the spatio-temporal pattern of PM2.5 pollution but they focus on a large scale, the whole China mainland, or only 13 cities in the BTH region. Moreover, they did not pay attention to non-nonattainment cities and did not give city-scale suggestions for joint prevention and control that vary with pollution seasons and pollution levels. There are other some studies [30,31,32] that proposed an approach for joint control between cities in the region (i.e., BTH and surrounding cities and the Yangtze River Delta), but they also did not pay attention to non-nonattainment cities in their research domain. Moreover, they did not discuss more the impact of meteorological conditions such as air stagnation index (ASI) which can greatly affect the spatial pattern of PM2.5. In addition, these studies did not take the pollution levels into account for joint control. Therefore, to bridge this gap, a more specific spatial relationship of PM2.5 pollution needs to be studied for the different seasons among these nonattainment cities to enhance the benefits from joint prevention and control and enable timely achievement of air quality targets in the nonattainment cities of this region.
This study applied multiple data mining techniques to reveal the spatial relationship of PM2.5 pollution over 42 prefecture-level cities in the northern part of the North China Plain (NNCP), expanding the coverage of the “2 + 26” cities. Section 2 describes the methods that were used in this study, including the clustering analysis, network correlation analysis, coefficient of divergence analysis (COD), and ASI. Section 3 presents the results on spatial clustering, heterogeneity, and correlation, particularly for the nonattainment cities. Different levels of joint prevention and control city groups are given for different seasons. Besides, analyses of the terrain and meteorology conditions using ASI are conducted to reinforce the understanding of spatial correlations of PM2.5 among these cities. Finally, conclusions and policy implications were given in Section 4.

2. Data Source and Methods

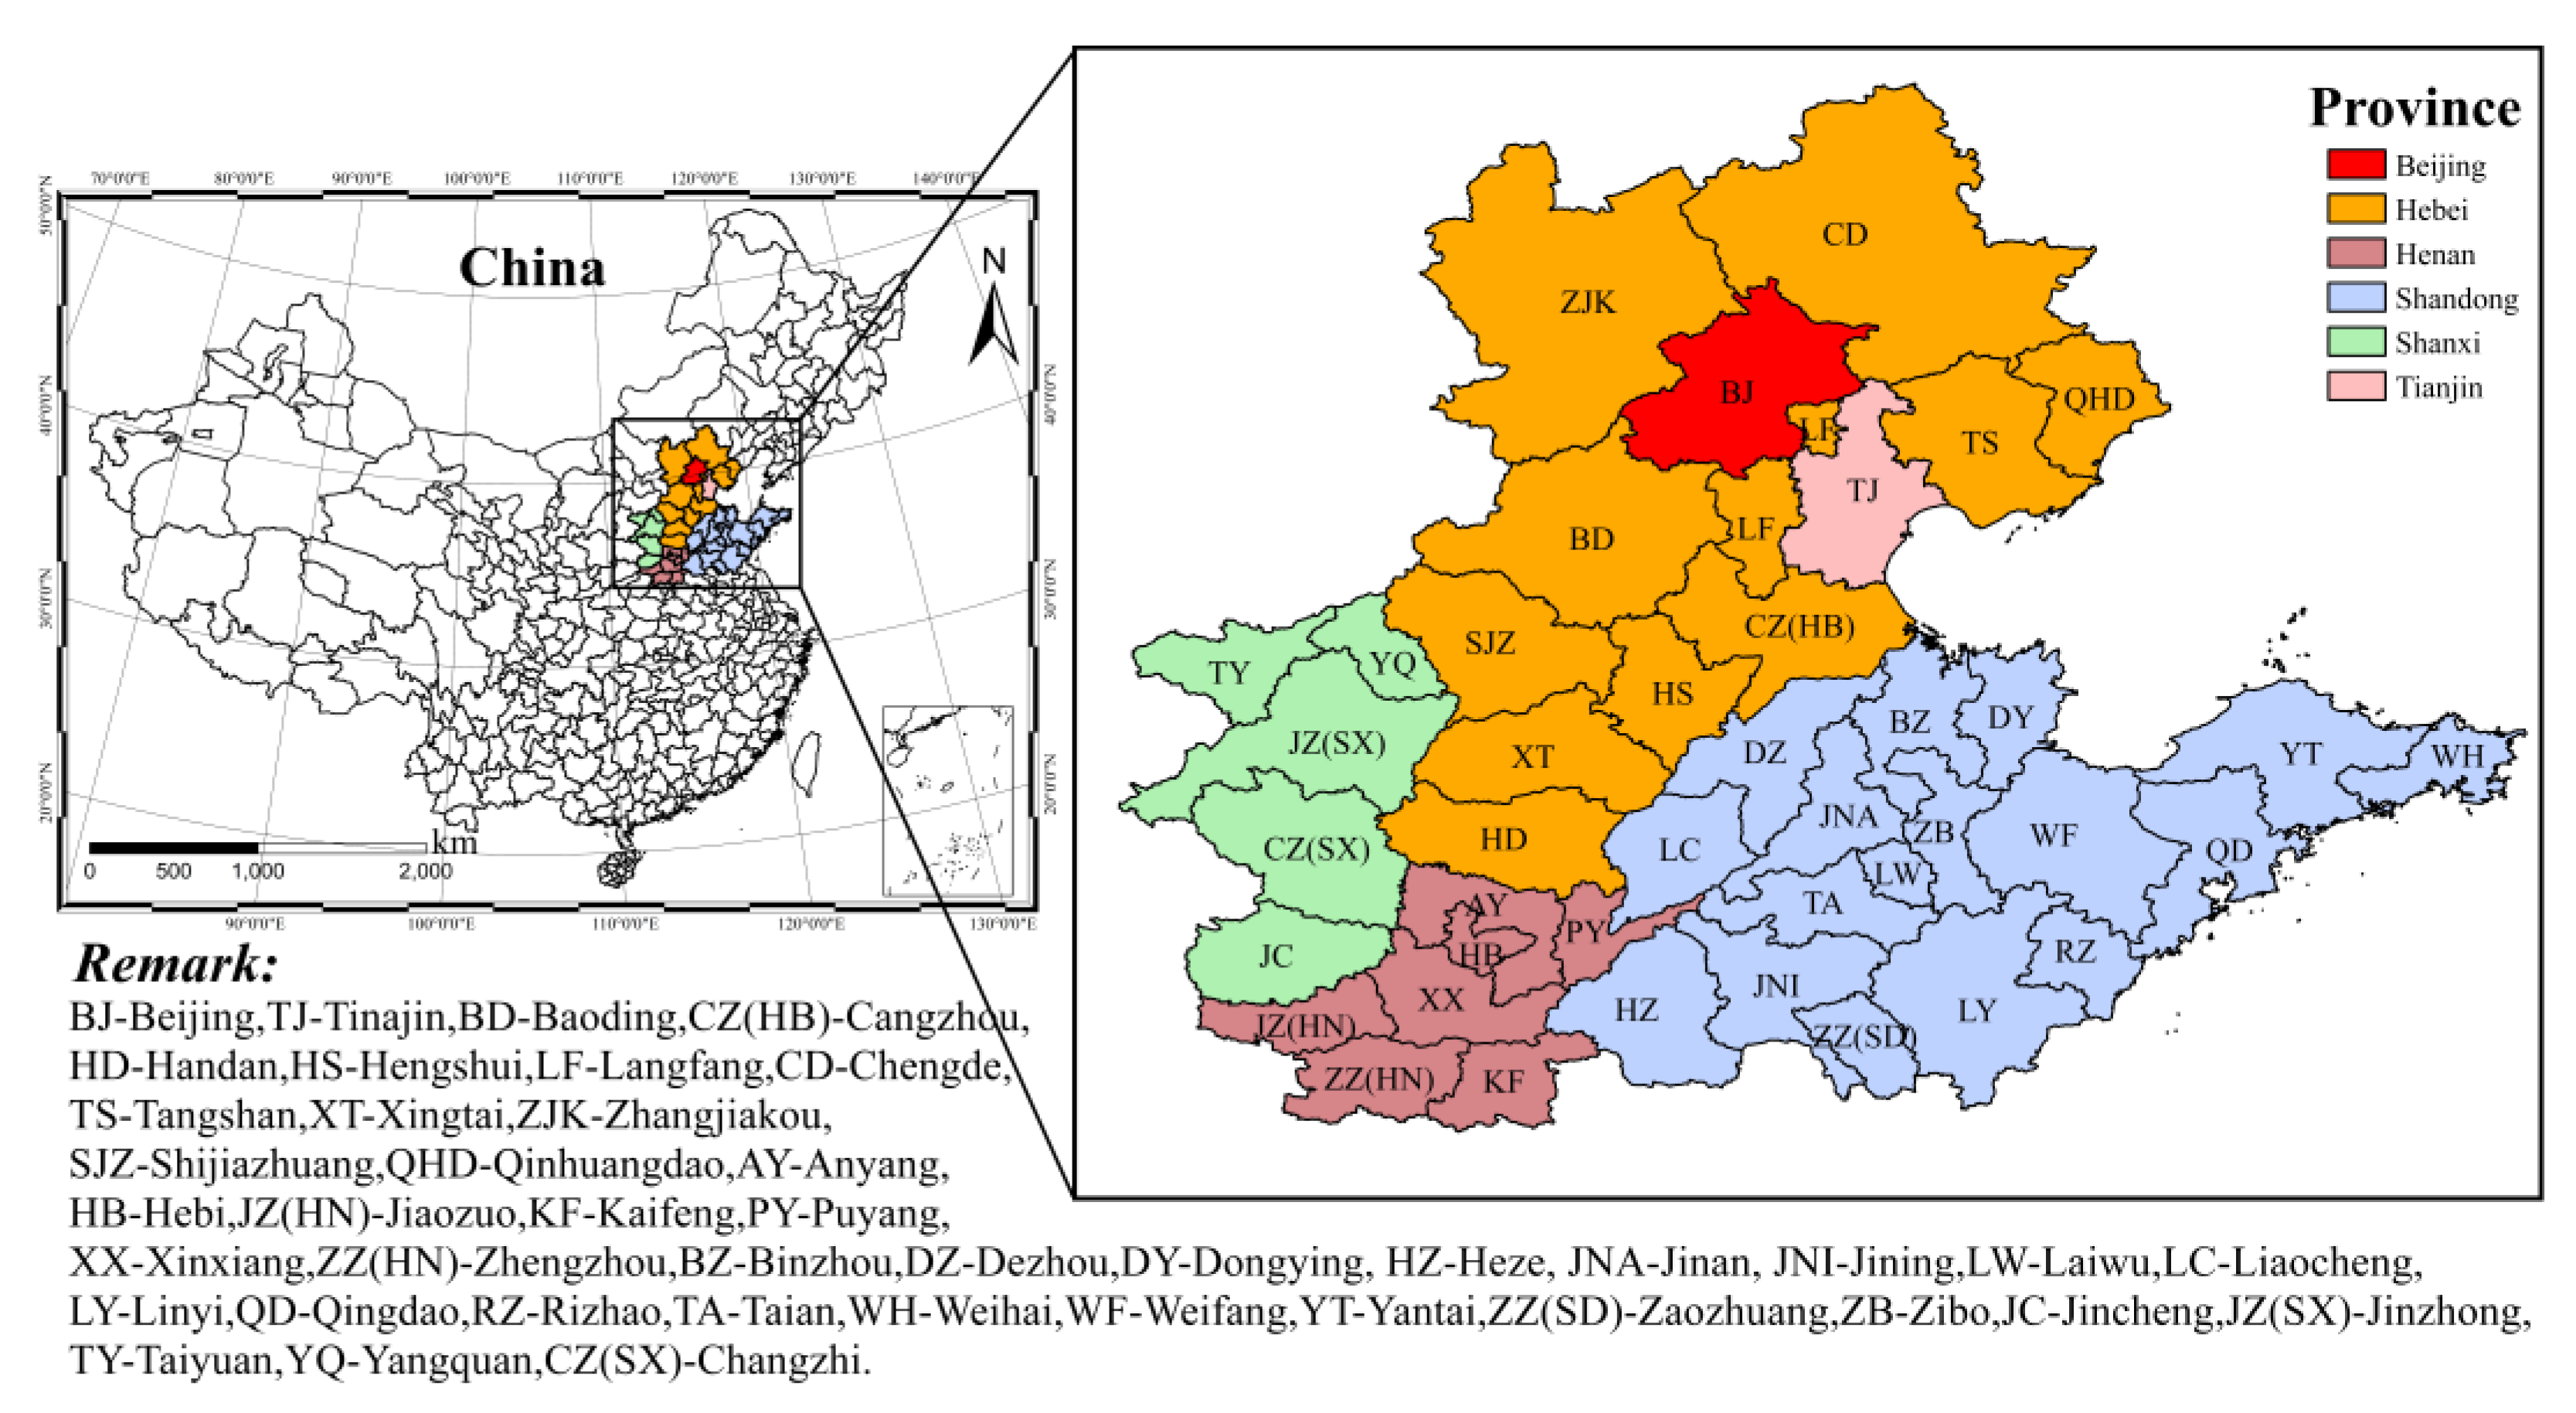
2.1. Research Region and Data Source

The research domain covers 42 cities, composed of Beijing, Tianjin, other 11 cities in Hebei Province, 17 cities in Shandong province, 7 cities in Henan Province, and 5 cities in Shanxi Province, as shown in Figure 1. Most of these cities are located in the NNCP region. Few cities in Shanxi province are outside but close to the NNCP region. The study domain also includes the “2 + 26” cities as the important air pollution transport corridors in the Beijing-Tianjin-Hebei region. The data of PM2.5 concentration from 1 January 2015 to 31 December 2018, were obtained from China Urban Air Quality Real-Time Publishing Platform (http://106.37.208.233:20035), which is supported by the MEEP. Hourly meteorological data were obtained from the National Centers for Environmental Information in the National Oceanic and Atmospheric Administration (NOAA) (https://www.ncei.noaa.gov/access/search/data-search/global-hourly). Data are accessible from FTP (ftp://ftp.ncdc.noaa.gov/pub/data/noaa, last access: 30 November 2020).

2.2. Methods

2.2.1. Agglomerative Hierarchical Clustering Model

Agglomerative Hierarchical clustering (AHC) is a bottom-up statistical method that initially treats each object as a single cluster, merges it according to certain distance algorithm and similarity algorithm criteria, and iterates until the requirements are met [33,34]. This method can be used to study spatial characteristics of air quality at the regional scale [35,36,37]. In this work, the daily average concentrations of PM2.5 for each prefecture-level city in the NNCP region were considered as one initial object. Therefore, there were 42 initial objects which were input into the clustering model.
The distance between every two clusters was computed with the Euclidean distance [38], which can be used to calculate the degree of similarity between PM2.5 concentrations in two cities, as shown in Equation (1).
E u i j = k = 1 m x i , k x j , k 2
where E u i j is the Euclidean distance between the i t h city and the j t h city, m is the number of daily mean concentrations of PM2.5 in city i over the study period.

2.2.2. Coefficient of Divergence

The coefficient of divergence (COD) was used to measure the relative consistency in concentrations between cities, ranging from 0 to 1.0 in some studies [39,40,41]. Usually, 0.2 is considered the boundary value of COD [42,43]. Such that, COD value larger than 0.2 indicates the heterogeneous spatial distribution of PM2.5, while a COD value less than 0.2 represents a uniform spatial distribution of PM2.5. Therefore, COD points out the degree of spatial differences in PM2.5 concentration within each city-cluster region. The COD was defined according to Equation (2). Representative cities within the city-cluster are selected as the benchmark by Equations (3) and (4). The city with the highest I n d e x i value is regarded as the representative city of the city-cluster.
C O D i j = 1 n k = 1 n ( x k i x k j x k i + x k j ) 2
where xki and xkj represent the average daily PM2.5 concentration for day k at cities i and j of the city cluster, and n is the studied days.
E u i * = E u i m a x ( E u i )
I n d e x i = R i E u i *
where E u i is a normalized Euclidean distance and E u i ∈ (0, 1), R i refers to Pearson’s correlation coefficient between the PM2.5 concentration of any city i in the city-cluster and the average PM2.5 concentration of the city-cluster.

2.2.3. Complex Network Correlation Model

The network correlation model can be used to calculate the correlation between the research objects. It has been used in the analysis of the PM2.5 correlation on a regional scale [44,45,46]. The network correlation model based on Pearson’s correlation coefficient was applied to measure the correlation strength between every two cities in the NNCP region, describing the direct and indirect interaction of daily mean PM2.5 concentrations. For any two cities, their daily average PM2.5 concentration were taken as the matrixes X = {x1,x2,…,xn} and Y = {y1,y2,…,yn}, respectively, and then their Pearson’s correlation coefficient ρ (X, Y) [47] was calculated based on Equation (5). The ρ value of any two cities is less than 1.0. The closer to 1.0, the greater the correlation. Pearson’s correlation distance is another distance based on the correlation coefficient [48], which was calculated by Equation (6).
ρ X ,   Y = i = 1 n x i x ¯ y i y ¯ i = 1 n x i x ¯ 2 i = 1 n y i y ¯ 2
D c o r X ,   Y = 1 ρ ( X , Y )
where ρ (X, Y) is the Pearson’s correlation coefficient between X and Y. xi and yi were daily PM2.5 concentration of ith city and jth city. x ¯ and y ¯ were the average concentration of PM2.5 in the city i and city j.

2.2.4. Air Stagnation Index

The air stagnation index (ASI) is an important meteorological indicator of the ability of the atmosphere to dilute air pollutants. The ASI was originally developed by the National Oceanic and Atmospheric Administration (NOAA). Using geopotential height, Planetary boundary layer height (PBLH), and precipitation variables from the Modern-Era Retrospective Analysis for Research and Applications, version 2 (MERRA-2) dataset, Feng et al. have developed the ASI for the NCP in China [49,50]. ASI data used in this study for autumn and winter in 2018 is from the previous study by Feng et al.

3. Results and Discussion

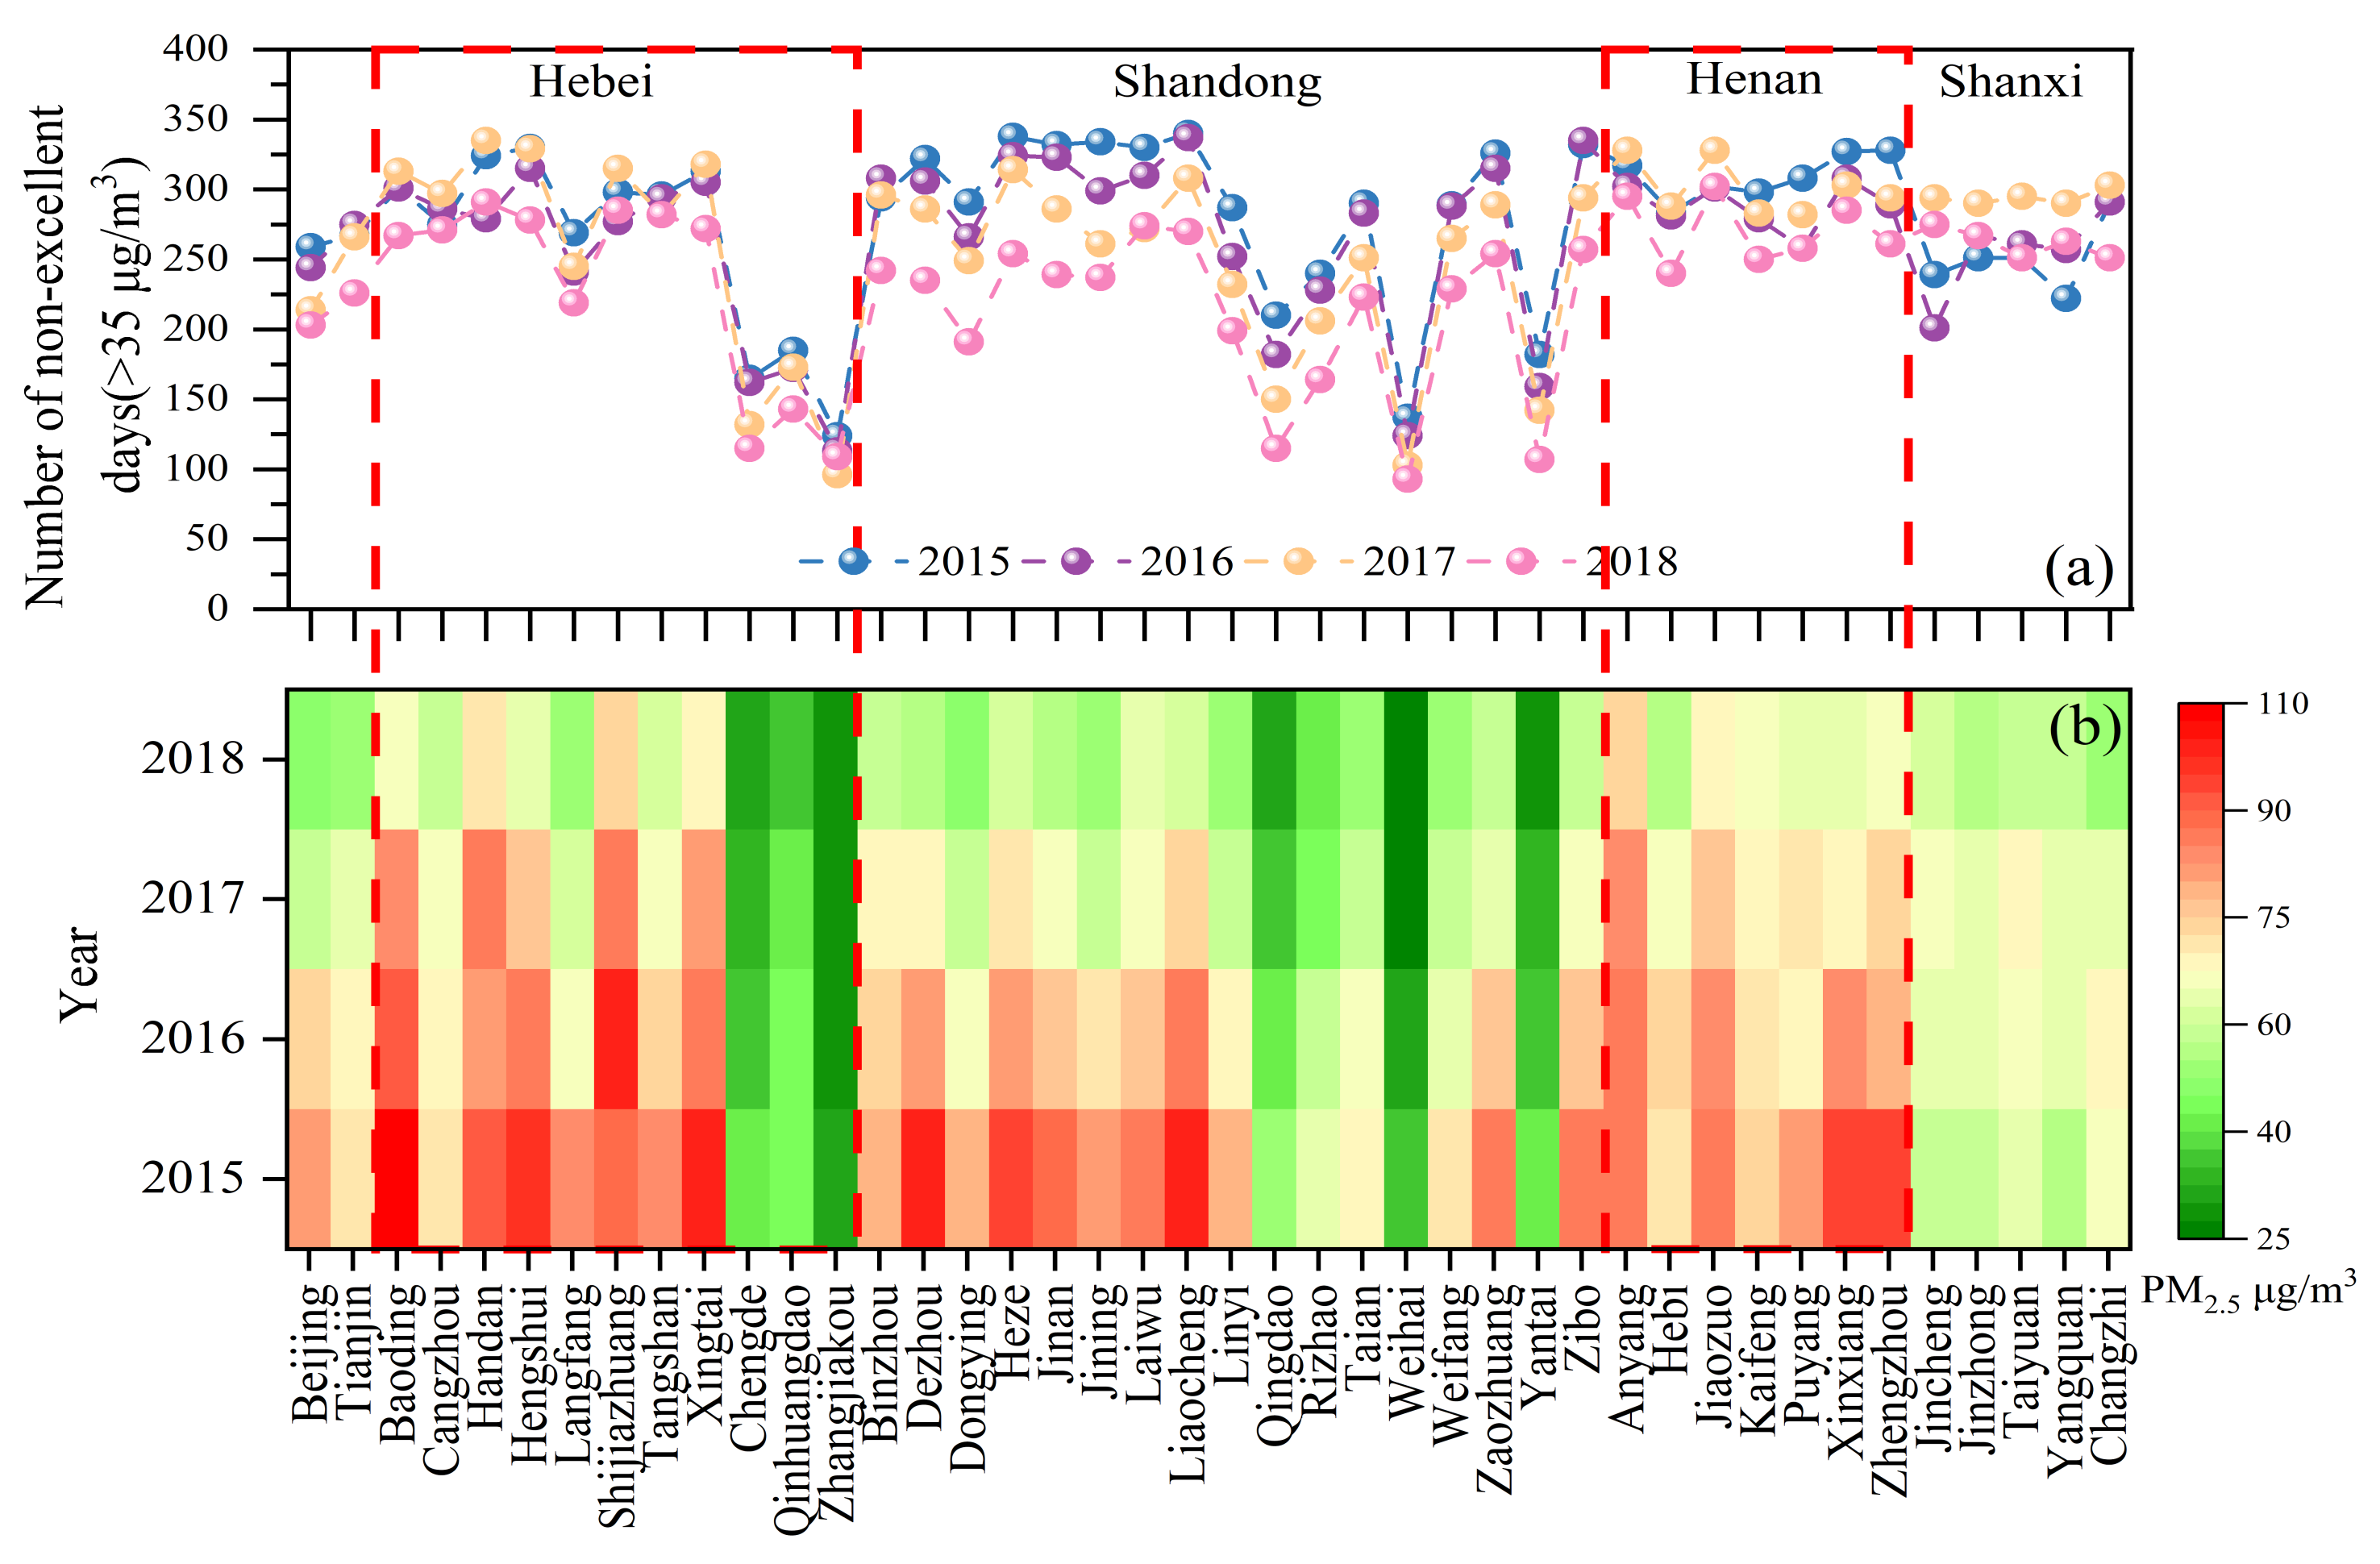
3.1. Basic Temporal-Spatial Distribution

The annual mean concentrations of PM2.5 from 2015 to 2018 were 75.7 μg·m−3, 69.3 μg·m−3, 62.8 μg·m−3, and 54.8 μg·m−3, respectively, as shown in Figure 2. This is synonymous with annual decrease ratios of 8%, 10%, and 13% in 2016, 2017, and 2018, respectively. It is evident that the highest average concentration of PM2.5 were witnessed in the seven cities of Henan Province. This is a clear indication that Henan province suffers from severe PM2.5 pollution and therefore more attention is required. It was also worth noting that, the concentration trend of PM2.5 in the five cities of Shanxi province inconsistent with the whole NNCP region. Clearly, while PM2.5 concentrations declined year after year since 2015–2018 in the rest of the NNCP region, PM2.5 pollution in the five cities of Shanxi Province worsened in 2016 and 2017 with slight fluctuations in 2018. Generally, Beijing, Tianjin, Henan, Shandong, and “2 + 26” urban agglomerations all gained significant reduction of PM2.5 concentrations between 2015–2018. Nevertheless, their PM2.5 concentrations were still higher than the National Ambient Air Quality Standards (NAAQS) of 35 μg·m−3.
The details about classification standards of air quality pollution levels and some discussion on the variations of the number of pollution days in the whole NNCP region during 2015–2018 (Figures S1 and S2) can be referred to the supporting information file. As shown in Figure 3a, the number of non-excellent days shows a declining trend with years. An average of 53% decrease is noticeable in the number of days heavily polluted days and above in 2018 relative to 2015, indicating a great improvement in air quality. However, there is a notable rebound (in 2017) in Hebei, Henan, and Shanxi. The cities with the greatest improvement in the number of non-excellent days from 2015 to 2018 were Qingdao (−45%), Yantai (−41%), Dongying (−34%), Weihai (−32%), Rizhao (−31%), and Linyi (−31%). Compared with the high PM2.5 concentration in 2015, non-excellent days in 2018 increased by 18% in Yangquan. In general, Shanxi Province has benefited less from the national implementation of air quality control plans and thus require more attention.
As shown in Figure S3, high PM2.5 pollution was mainly concentrated in the central and southern parts of Hebei as well as the northern part of Henan. In 2015, only one city (Zhangjiakou), met the target of PM2.5, and by 2018, four more cities (Chengde, Qingdao, Yantai, and Weihai) achieved attainment. These cities with low PM2.5 concentrations are distributed over the northernmost and easternmost parts of the entire NNCP region. It is noted that Langfang was the city with the biggest drop rate (39%) of PM2.5 in the whole NNCP region. In 2015, the highest annual concentration of PM2.5 in the NNCP region was found in Baoding (106.7 μg·m−3), more than three times the PM2.5 limit value in NAAQS (35 μg·m−3). Anyang, located in the north of Henan Province and near Hebei Province, had a higher annual PM2.5 concentration (74.4 μg·m−3) than any other city in the NNCP region in 2018. Overall, there were 37 nonattainment cities in the NNCP region in 2018.

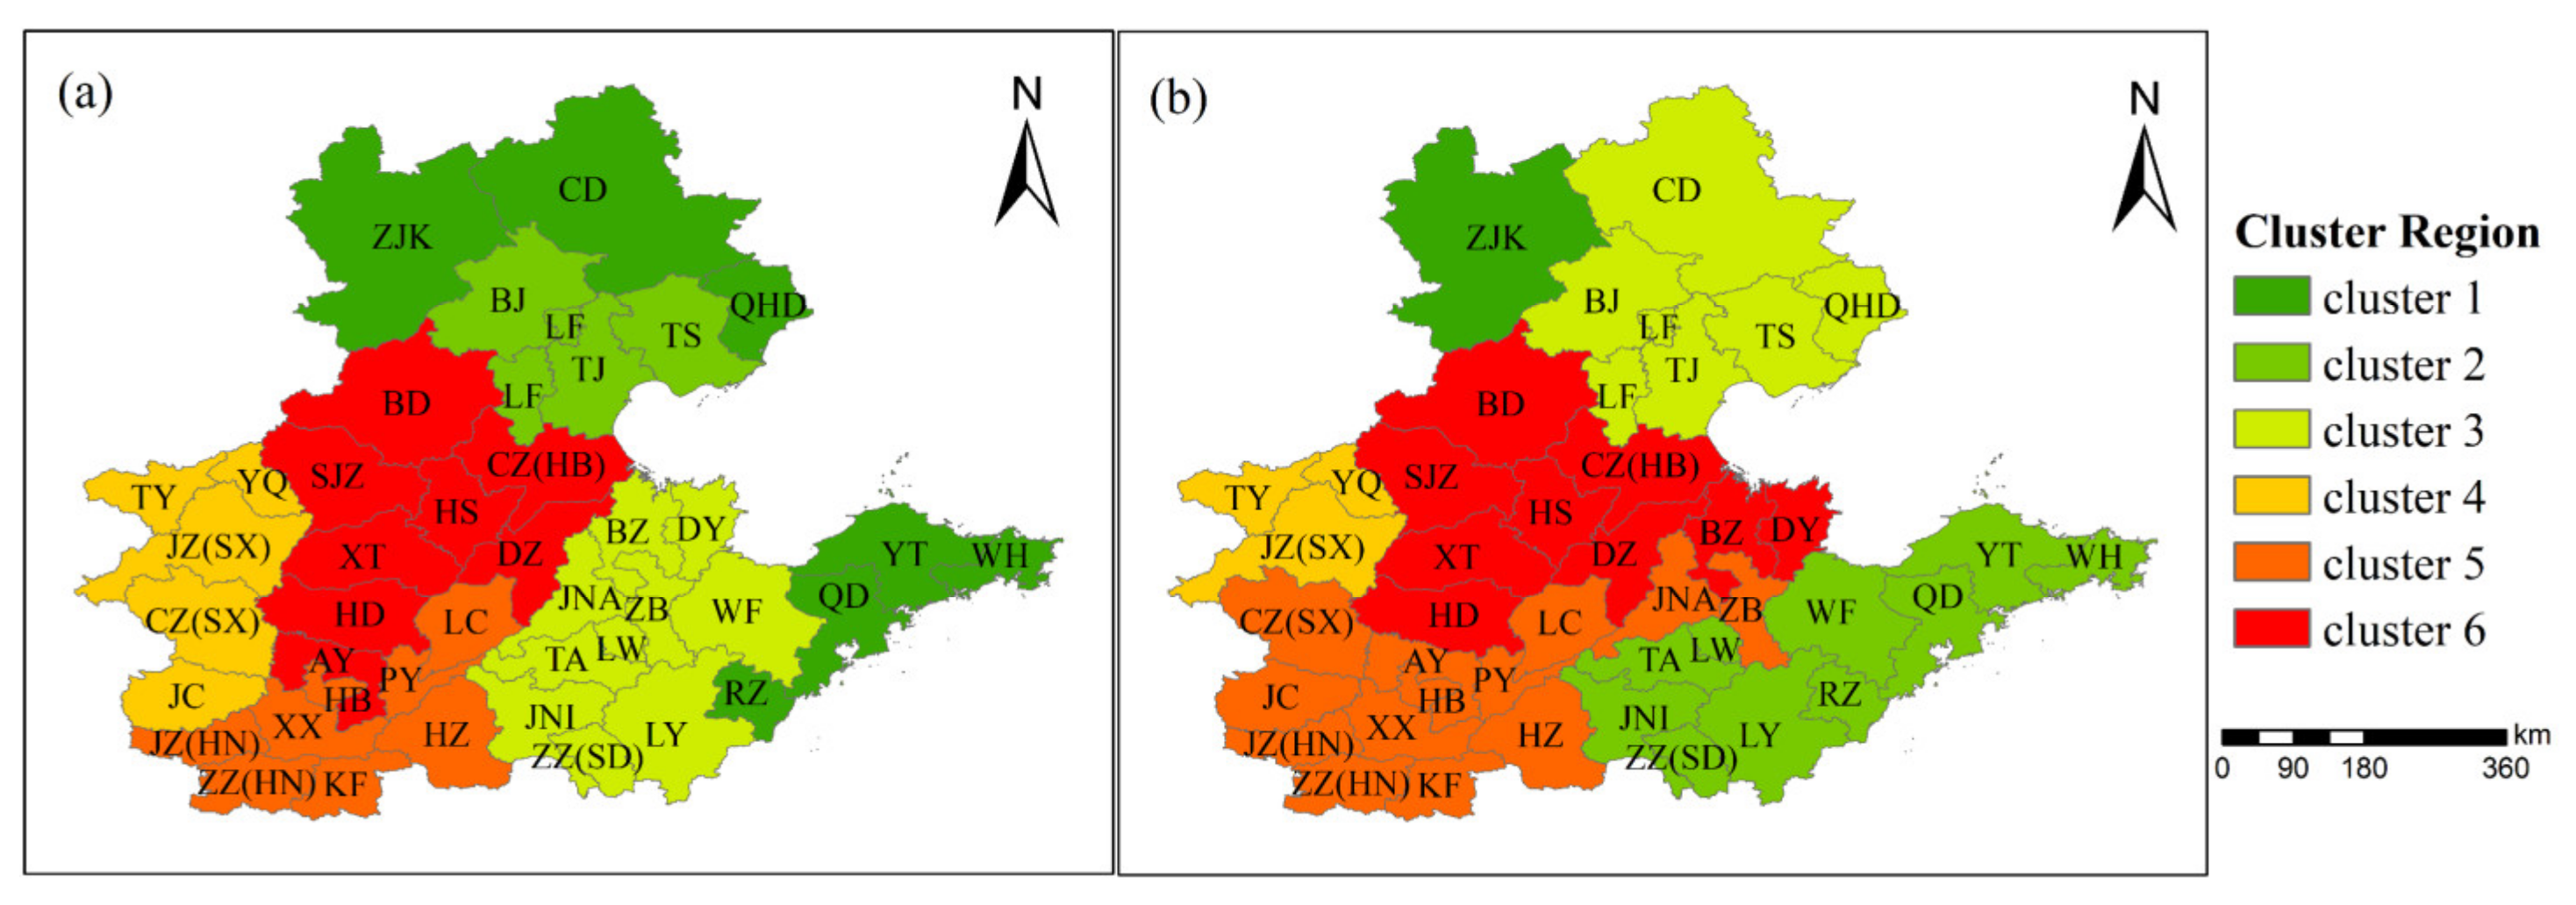
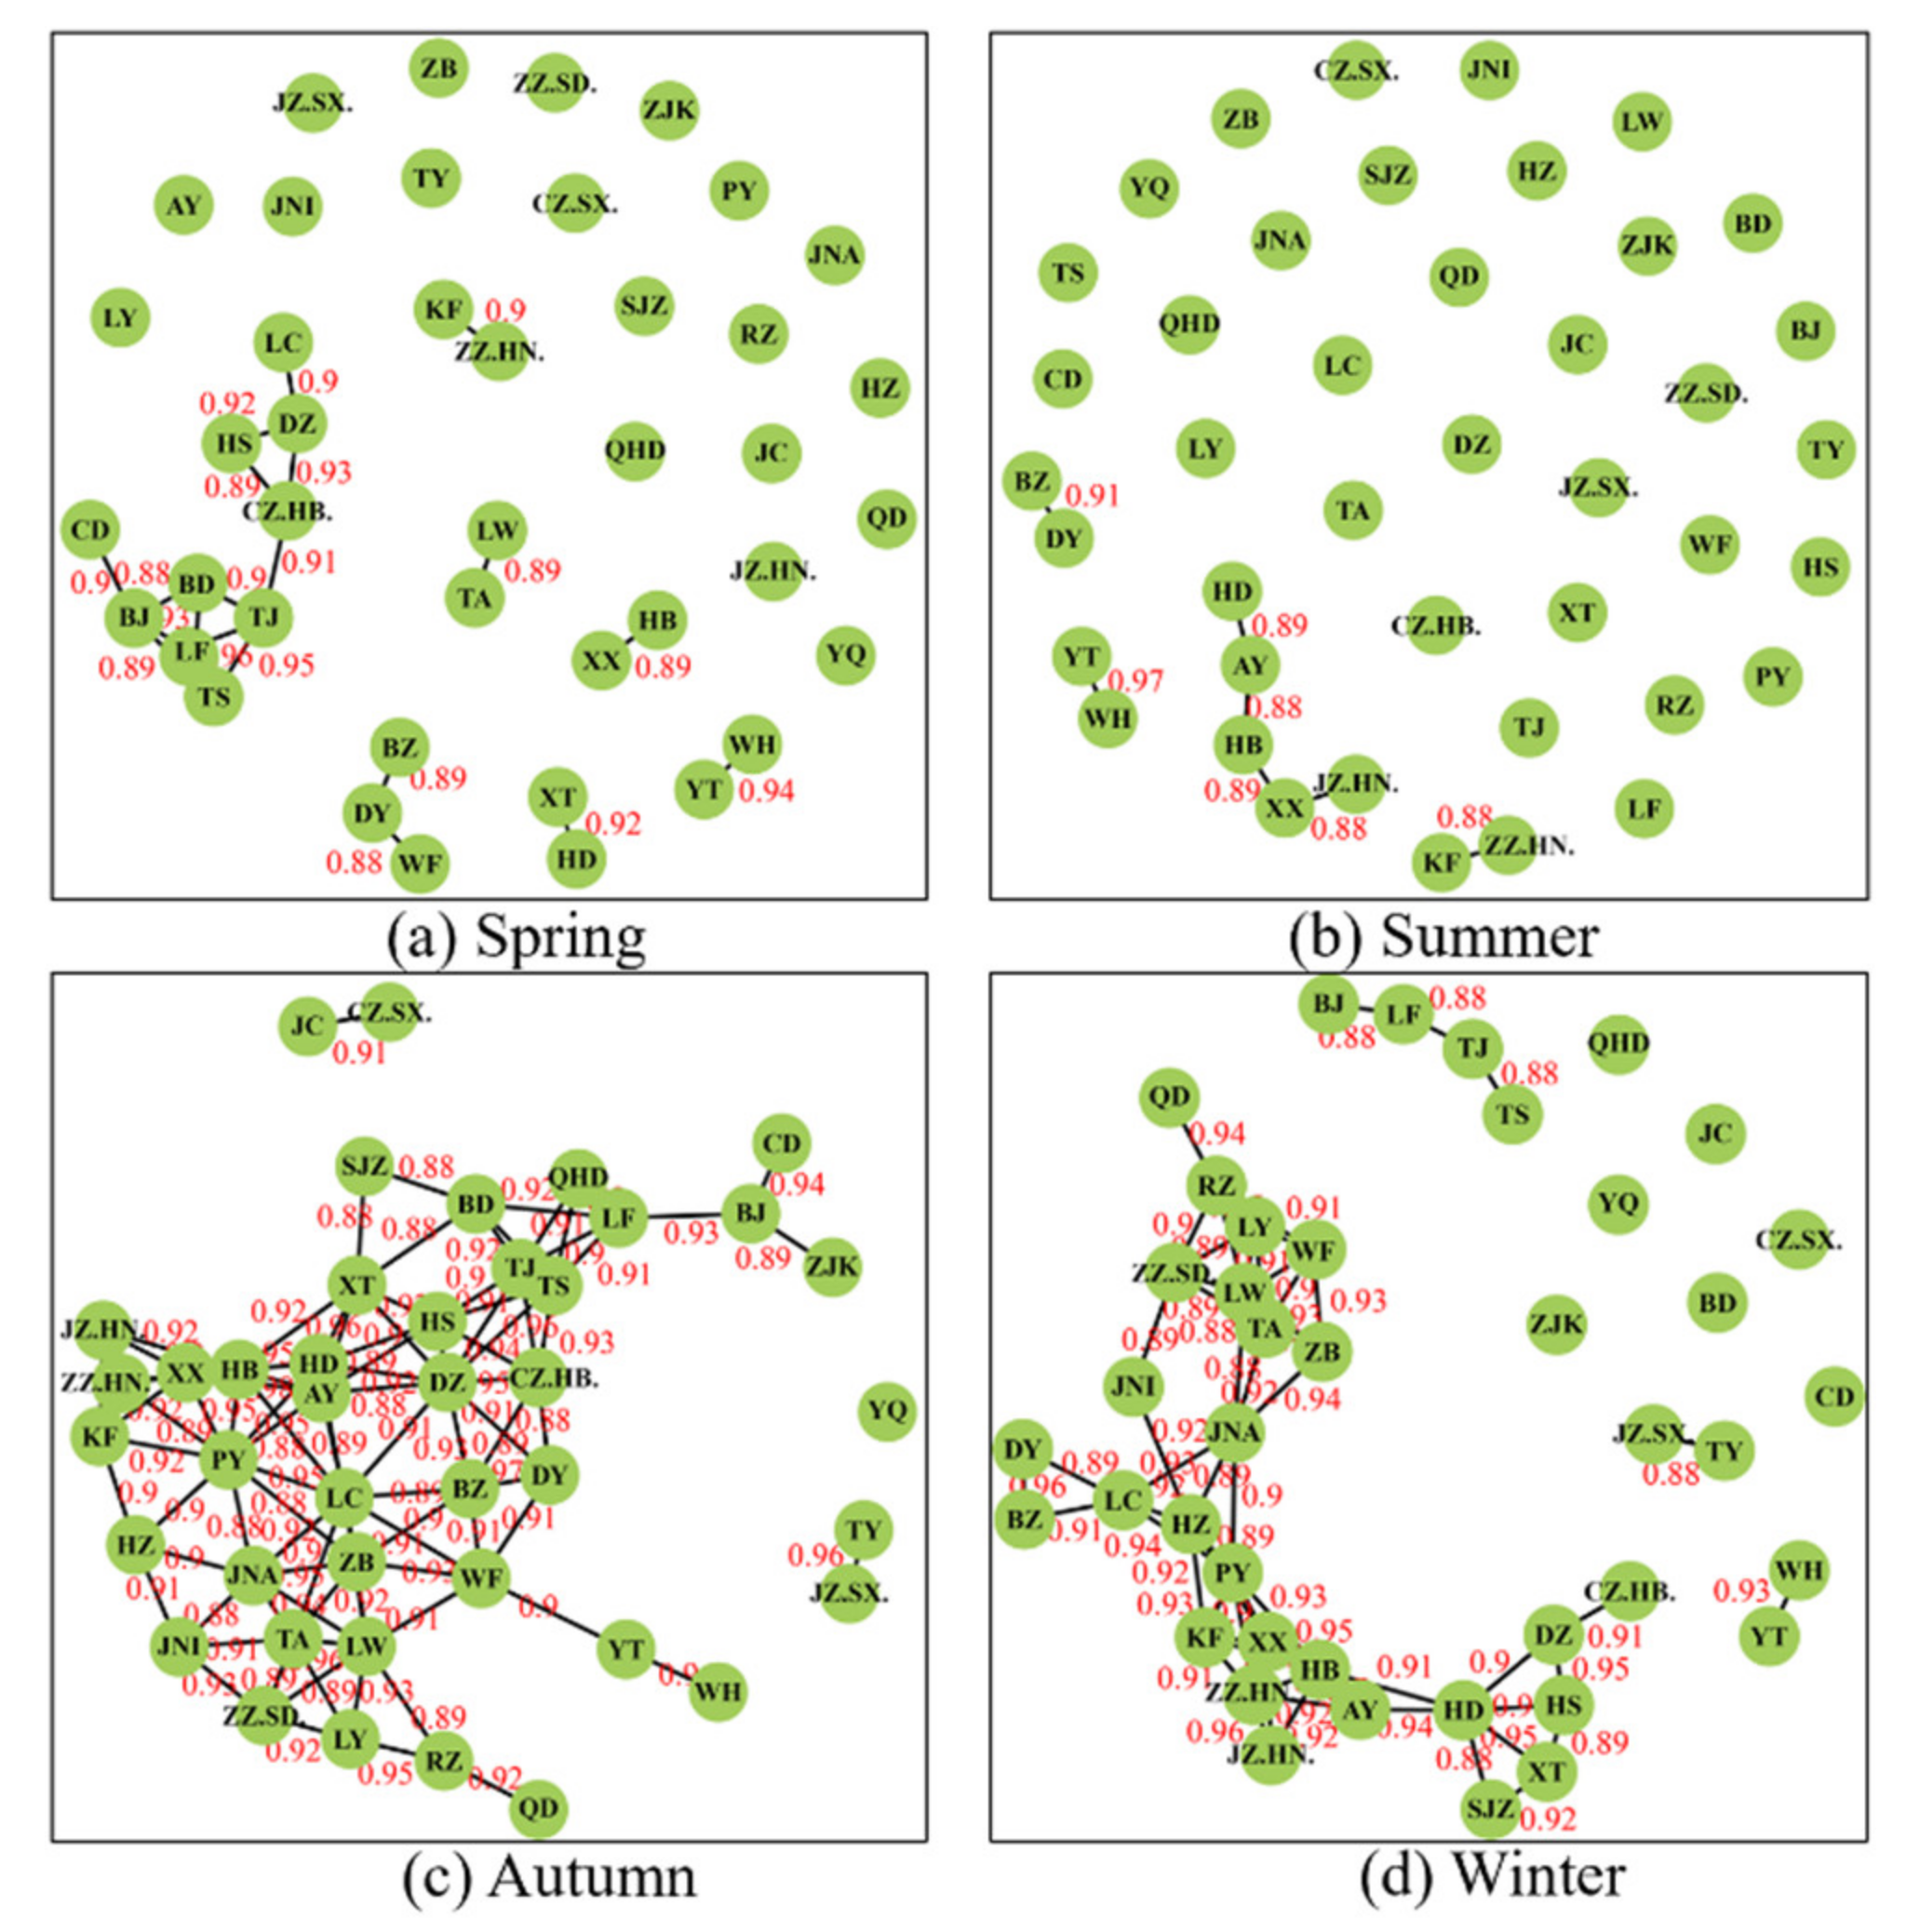
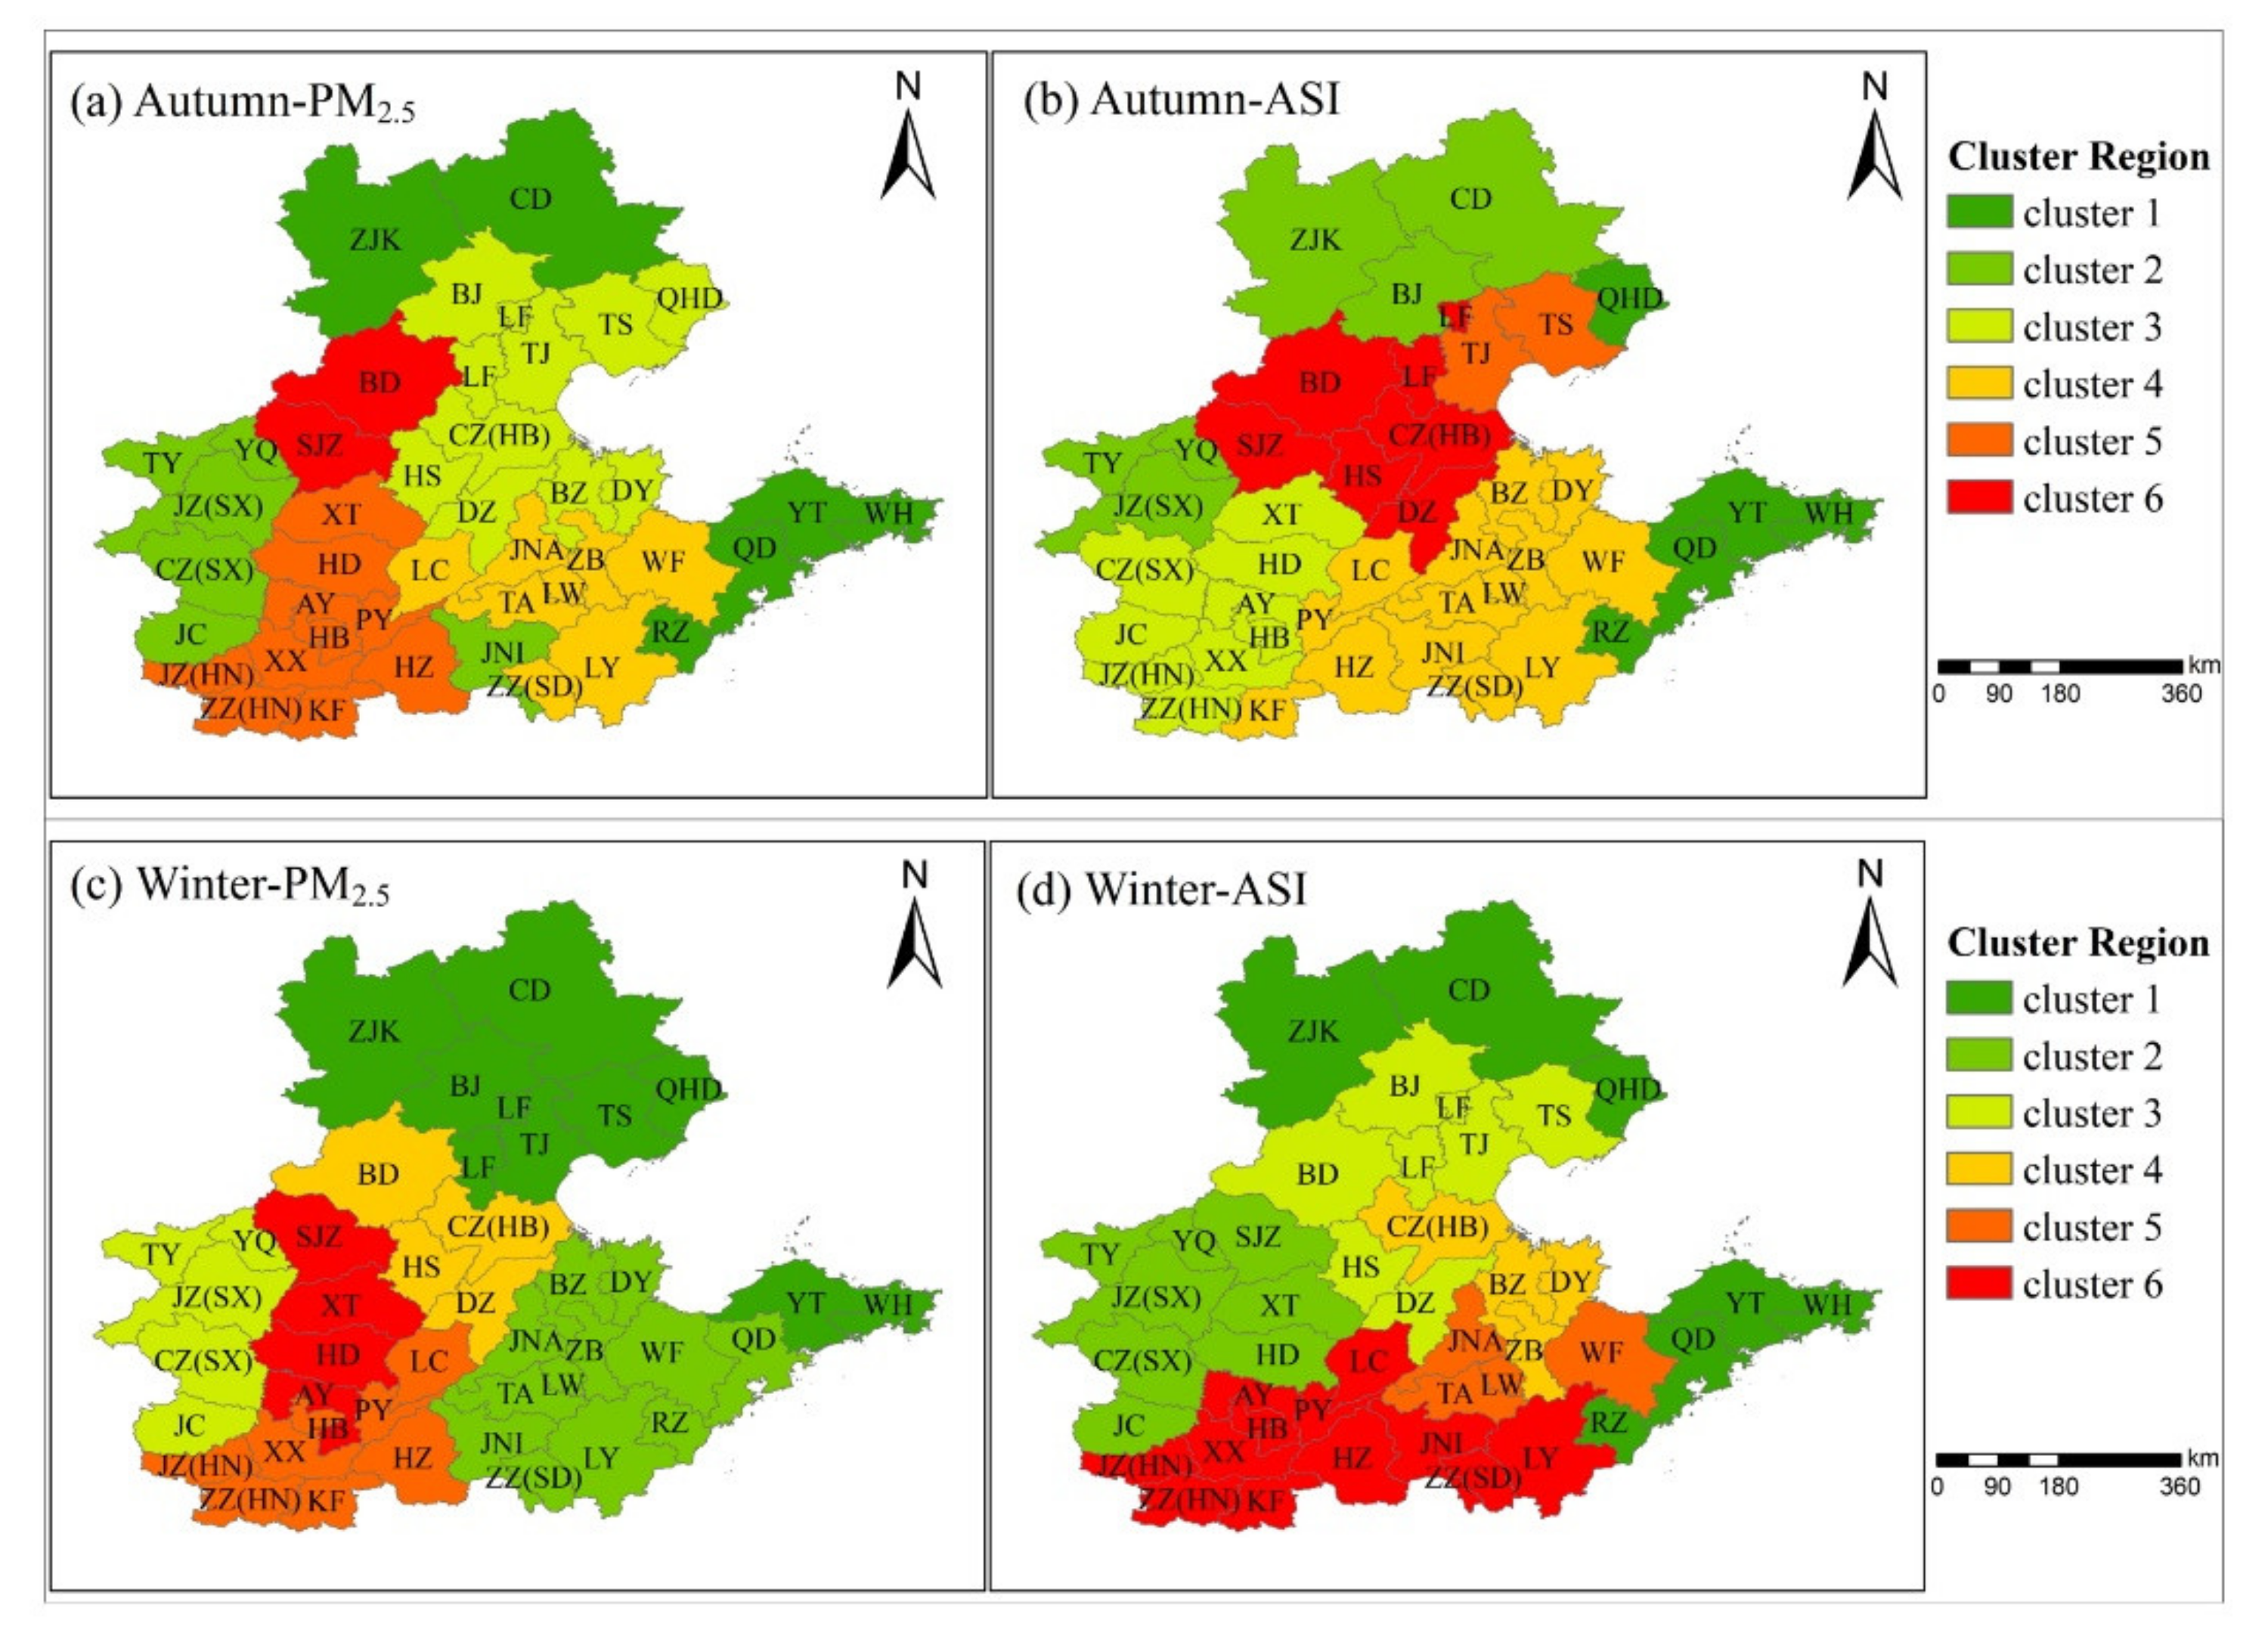
3.2. Spatial Clustering Analysis

According to hierarchical clustering based on the clustering of Euclidean distance and Pearson’s correlation distance, the NNCP region was divided into 6 sub-regions as shown in Figure 4a,b, respectively. Determination of the number of clusters was based on the elbow method, see Figure S4. Euclidean distance clustering grouped cities with comparable daily average PM2.5 concentrations into one category or similar cluster. Evidently, the first cluster comprises the eastern coastal cities and the northern cities, including Yantai, Weihai, Qingdao, Rizhao, Chengde, and Qinhuangdao, with an annual average PM2.5 concentration ranged from 26.6 to 42.1 μg·m−3. The second cluster includes Beijing, Tianjin, Tangshan, and Langfang, with an annual average concentration of PM2.5 ranged from 50.5 to 60.2 μg·m−3. One of the most polluted clusters covered the cities in central and southern Hebei, and the northern city of Anyang in Henan with annual average PM2.5 concentration ranged from 55.2 to 74.4 μg·m−3.
Pearson’s correlation distance clustering reveals contrasting results (Figure 4b). Basically, the Pearson’s correlation distance measures the similarity of the correlation between cities based on PM2.5 concentrations. For instance, the stronger the correlation between PM2.5 concentrations of two cities, the smaller the Pearson’s correlation distance. By comparison, it is clear from Figure 4a,b that clustering results for cities close to Taishan Mountain were different. In addition, Chengde, Zhangjiakou, Qingdao, Weihai, and Yantai, which were attainment cities in 2018, were not in the same sub-region in Pearson’s distance clustering results. In particular, Zhangjiakou, located in the northwest of the Taihang Mountains, was in its own category. Moreover, Jincheng and Changzhi were no longer in the same cluster as Jinzhong in Shanxi Province. Essentially, topographical features and meteorological conditions were two important factors that affect the clustering results in Pearson’s correlation distance [51]. As mentioned earlier, PM2.5 concentration is impacted by the combined effect of emission and meteorological conditions. However, some meteorological conditions, especially wind speed and direction are also greatly impacted by topographical features. Meteorological conditions (particularly PBL and wind, that control the transport of pollutants) are the main factors that influence the correlation of PM2.5 concentration between cities.

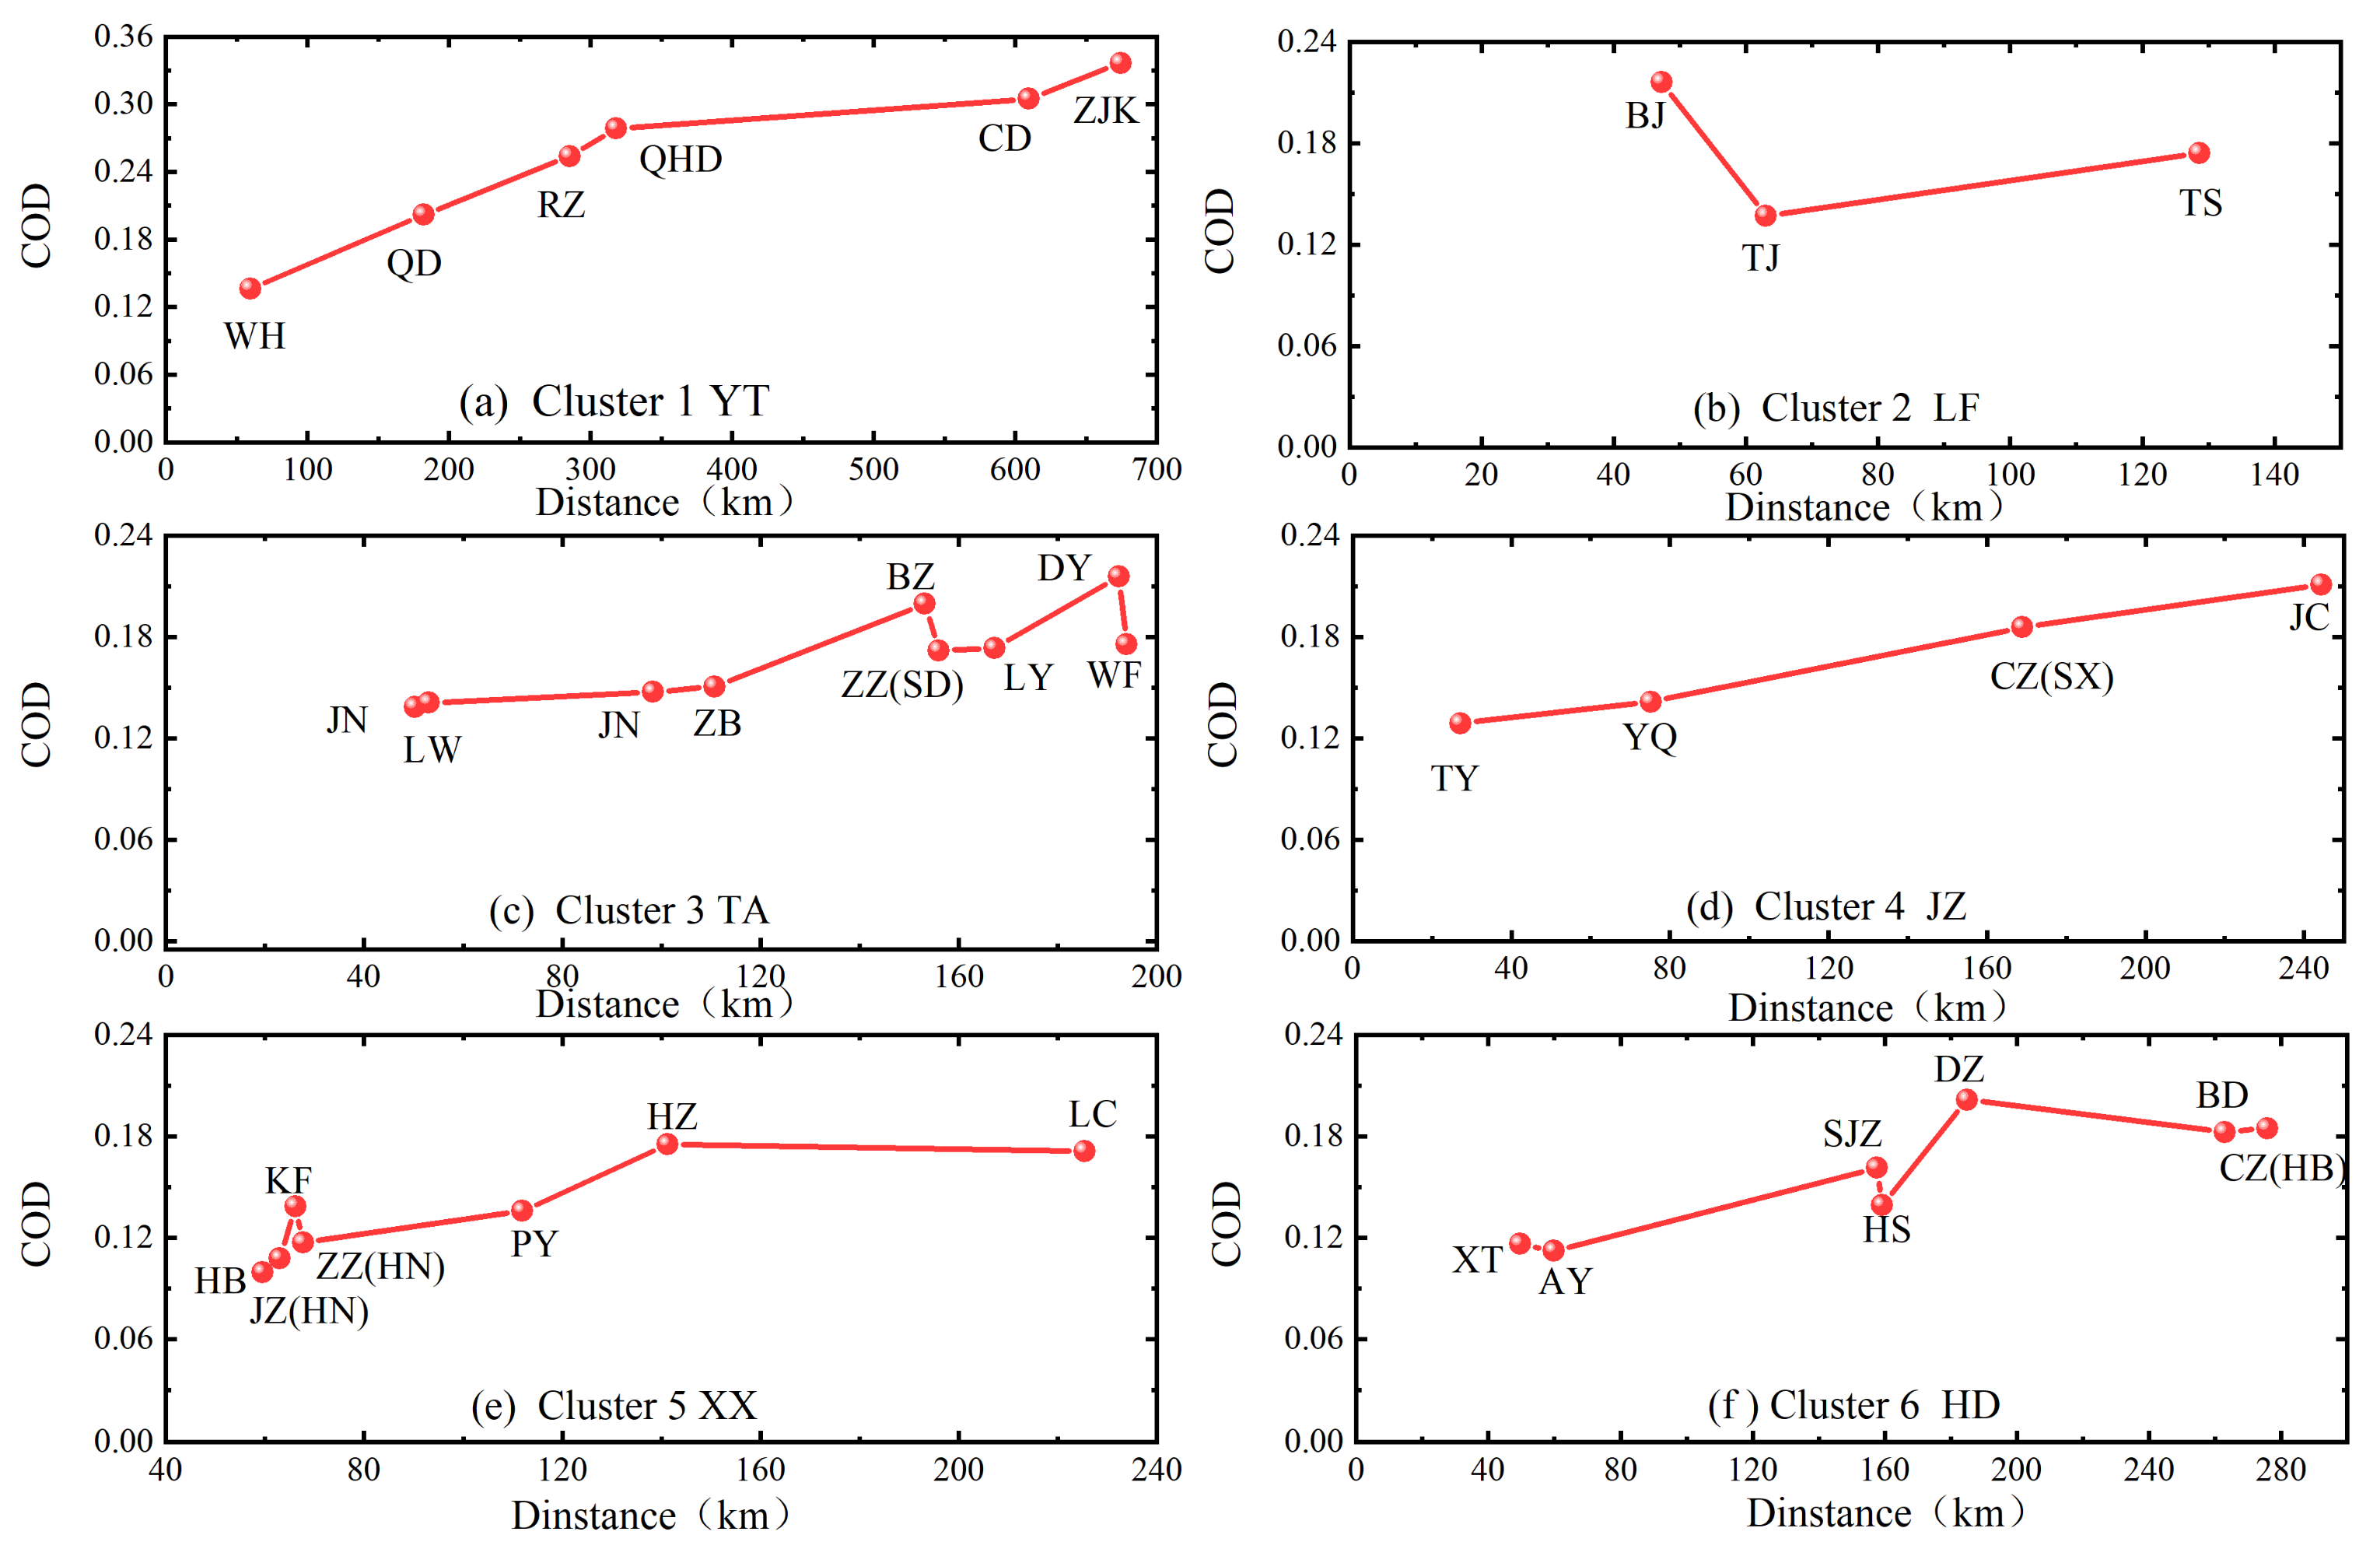
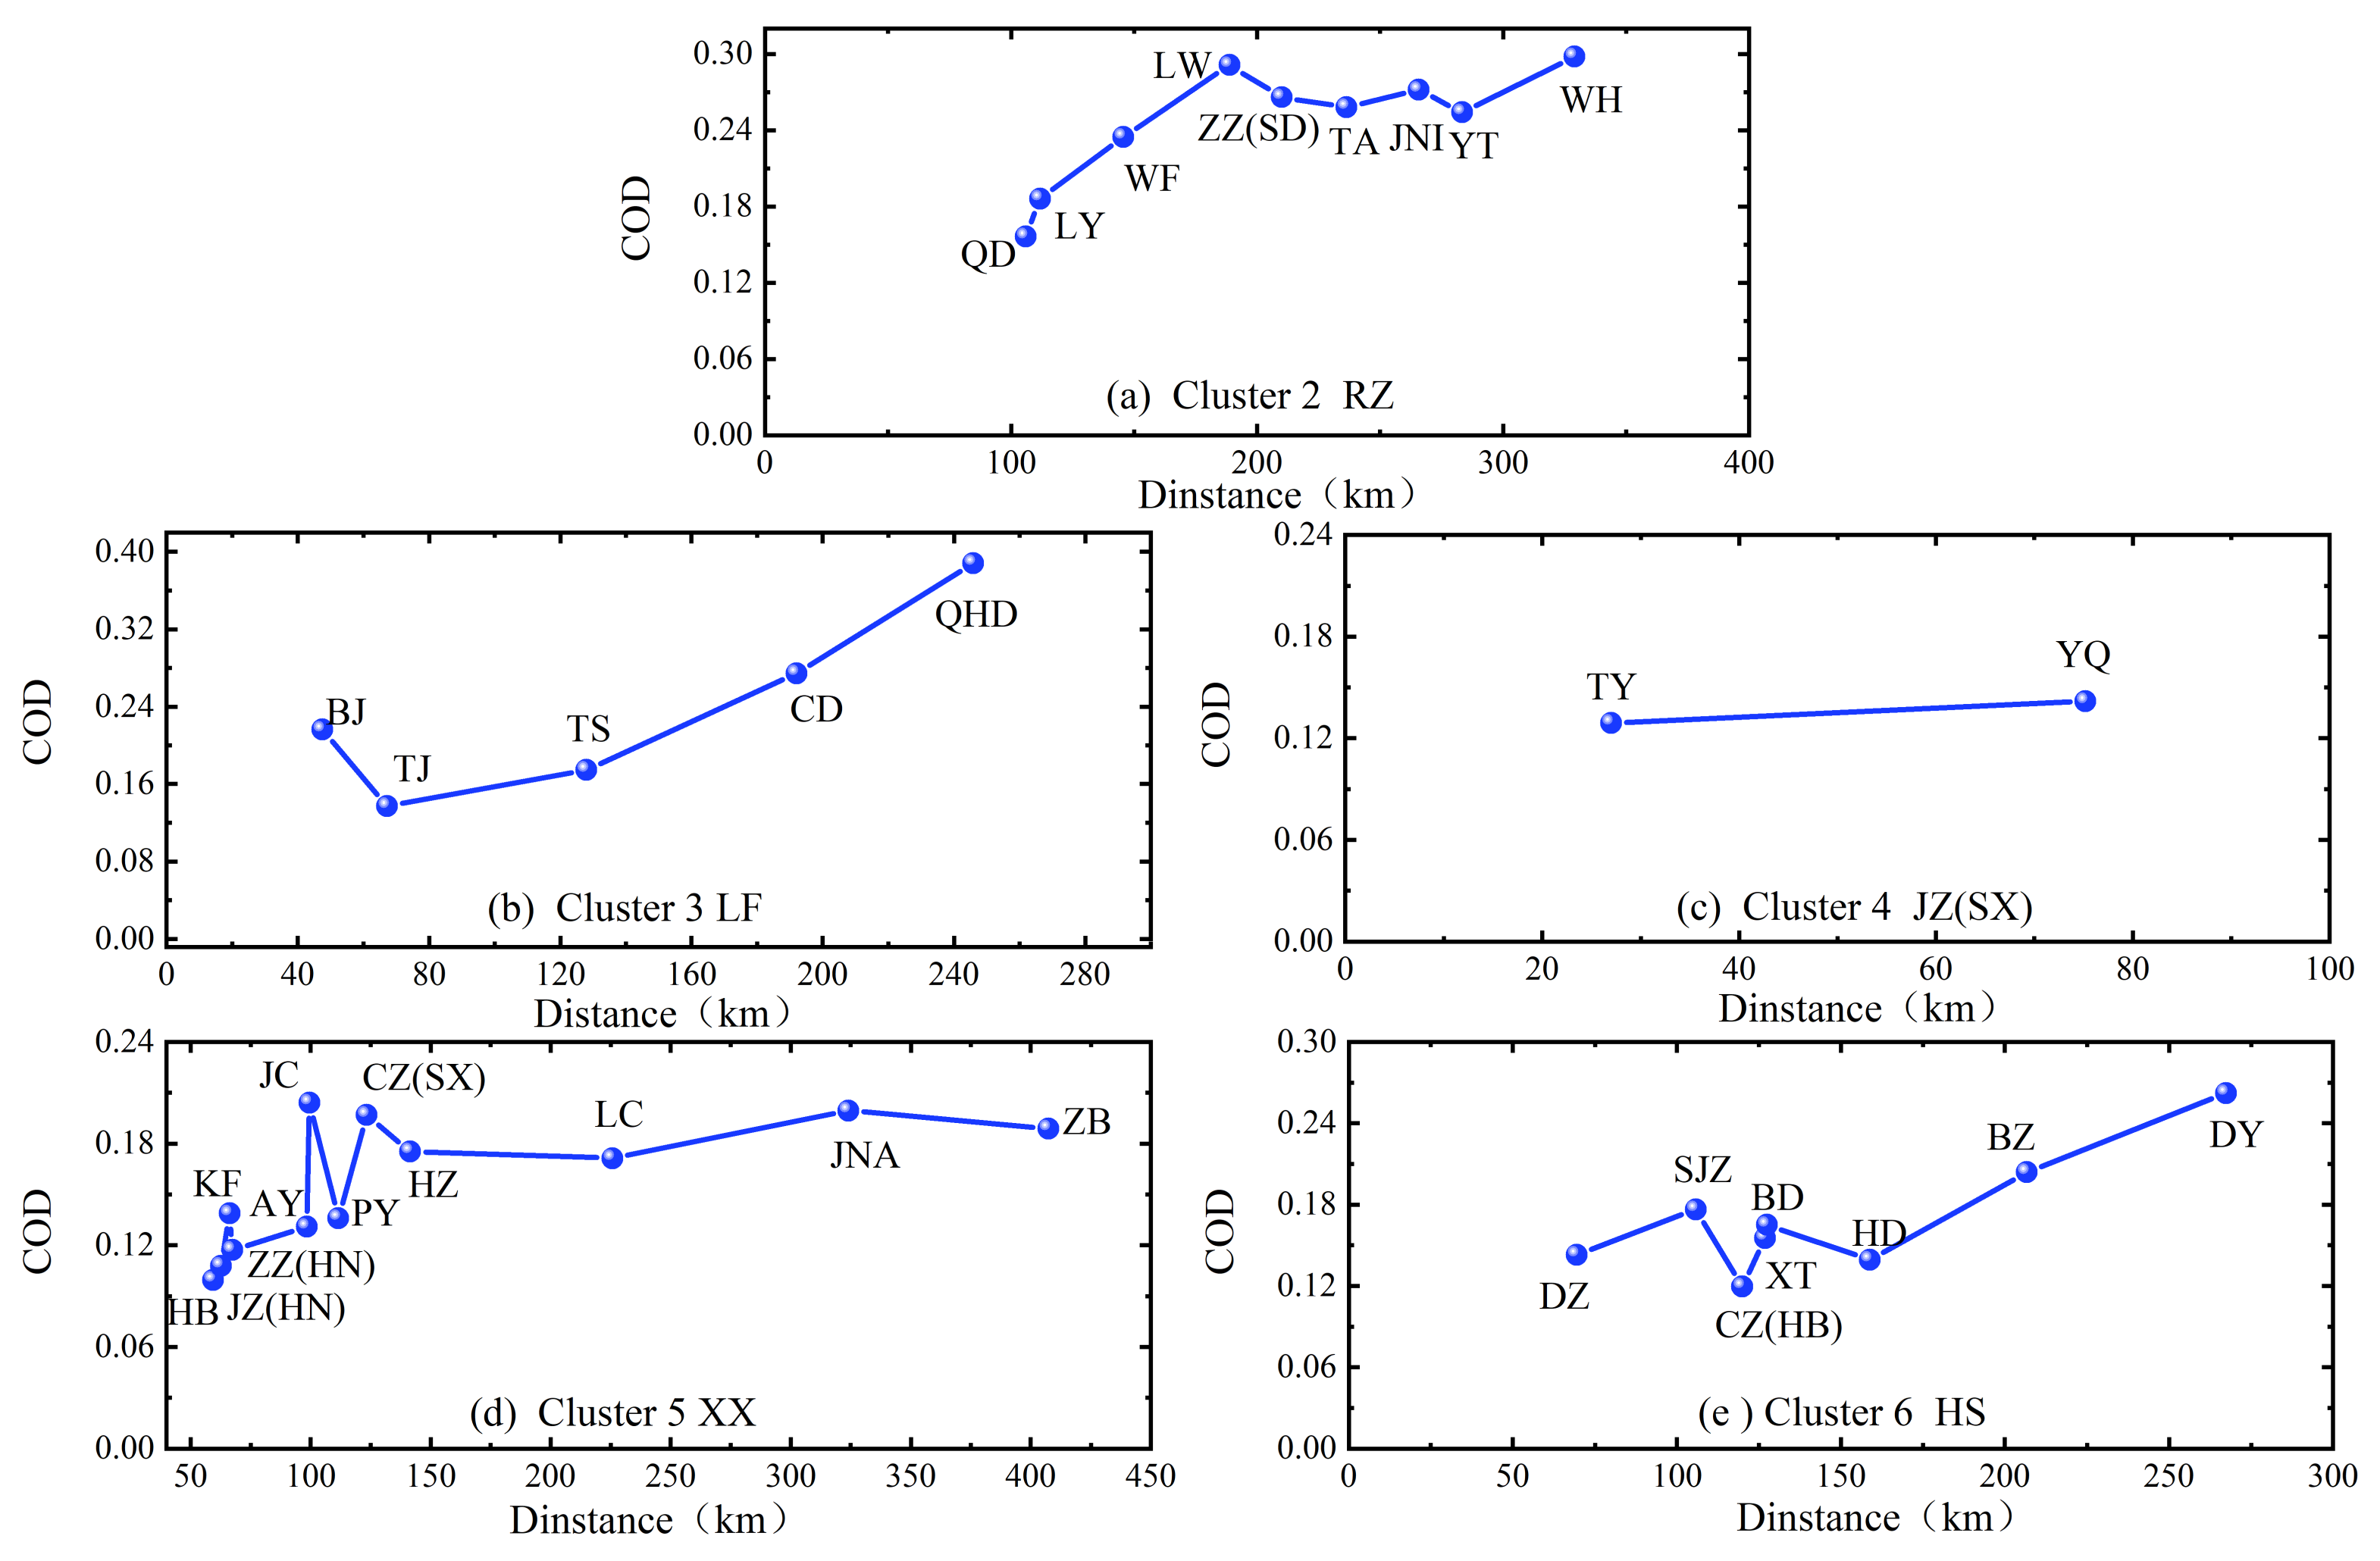
3.3. Spatial Heterogeneity Analysis

The city with the highest representative index S i among the cities in the same region is regarded as the representative city for that region. The representative cities of the six clusters based on Euclidean clustering were Yantai, Langfang, Taian, Jinzhong, Xinxiang, and Handan, respectively. However, Zhangjiakou, Rizhao, Langfang, Jinzhong, Xinxiang, and Hengshui were the representative cities based on Pearson’s correlation distance clustering. The COD was used to measure the relative consistency of PM2.5 concentrations between cities. The COD values between these representative cities based on the two kinds of clustering distances are shown in Tables S1 and S2. Except for Handan and Xinxiang, the COD value of every two representative cities was greater than 0.2 (Table S1), indicating the obvious heterogeneity of PM2.5 pollution between the representative cities. COD values of Yantai and any other representative city were greater than 0.38, suggesting that the PM2.5 pollution in Yantai was significantly different from that of other representative cities. On the contrary, the COD values of Handan and Xinxiang were 0.14, less than 0.2, indicating that the pollution homogeneity of both cities was strong.
Furthermore, the COD results for Pearson’s correlation distances shows that Zhangjiakou and any other representative city had COD value greater than 0.37 (Table S2). This signifies strongly heterogeneous PM2.5 pollution in Zhangjiakou in relation to other representative cities in the NNCP region. Besides, Langfang, Jinzhong, and Xinxiang belong to the same representative cities for the two kinds of clustering results but have different PM2.5 pollution features.
Additionally, a detailed analysis of the regional homogeneity of PM2.5 concentrations is shown in Figure 5. This was achieved by computing the COD between the representative city and any other city in a given cluster. The values in horizontal axis are the geographical distances between the representative city and any other city in the same cluster. The COD value in the cluster 1, 3, 4, and 6 (based on Euclidean distances clustering), was less than 0.2 when the geographical distance between the corresponding city and the representative city was less than 180 km. This means that PM2.5 pollution was homogeneous. However, when the distance exceeded 180 km, COD was greater than 0.2. Thus, the spatial scale of PM2.5 pollution in the clusters was about 180 km. Notably, in clusters 1 and 4, COD values increased monotonically with distance. Whereas, in cluster 2, the COD value was directly proportional to the increase in the distance except for Beijing. Remarkably, Beijing is closest to the representative city (Langfang, 47.2 km), but the COD value is 0.21, indicating a lack of homogeneity in the PM2.5 pollution of Beijing and Langfang. This is mainly attributed to the different industrial structures between these two cities, more so because Beijing is the capital city and the cultural center of China. While, the results of clusters 3, 4, and 6 were slightly more complicated, the results of cluster 5 present vital information. It is important to note that, COD between Xinxiang and any other city of Hebi, Kaifeng, Zhengzhou, and Jiaozuo were all less than 0.14, far less than the judgment standard of 0.2. This means that there is a very strong homogeneity of PM2.5 pollution among them. In addition, the geographical locations of Hebi, Kaifeng, Zhengzhou, and Jiaozuo are a short distance from Xinxiang (≤70 km). Within such short distances coupled with relatively flat terrain, PM2.5 can be easily transported among these cities. Therefore, joint prevention and control among these cities can be very important to alleviate PM2.5 pollution.
In the same way, as mentioned above, the corresponding analysis was conducted for the clusters based on Pearson’s correlation distances clustering as shown in Figure 6. In cluster 3, 4, and 6, the COD values (<0.2) further demonstrate a uniform distribution of PM2.5 pollution in these clusters when the distance of one city to the representative city is less than 180 km. In cluster 2, COD values of both Qingdao and Linyi were less than 0.2 and their distances are both about 100 km away from Rizhao. It was noteworthy that all cities had COD values less than 0.20 in sub-region 5 except for the cities of Jincheng and Changzhi. Similar to Figure 5e, strong homogeneity of PM2.5 pollution is also observed in Figure 6d among Hebi, Jiaozuo, Kaifeng, Zhengzhou, and Xinxiang. In addition, there exists a slight pollution homogeneity between Xinxiang and some northern cities of Mount Tai, namely Liaocheng, Jinan, and Zibo, which are more than 200–450 km away from Xinxiang. This phenomenon is mainly due to the prevalence of northeast winds during winter in Xinxiang. Therefore, in addition to local pollution sources, the results indicate that the impact of transport of seriously polluted urban pollutants in this (northeast) direction is significant [52]. Notably, all these four cities belong to the “2 + 26” city agglomeration as the transport corridor of PM2.5. Here, the special terrain of Mount Tai plays an important role in the transport impact of PM2.5 pollution between these cities. Ultimately, the impact of inter-city transport of PM2.5 cannot be ignored to effectively reduce the pollution level for these cities.

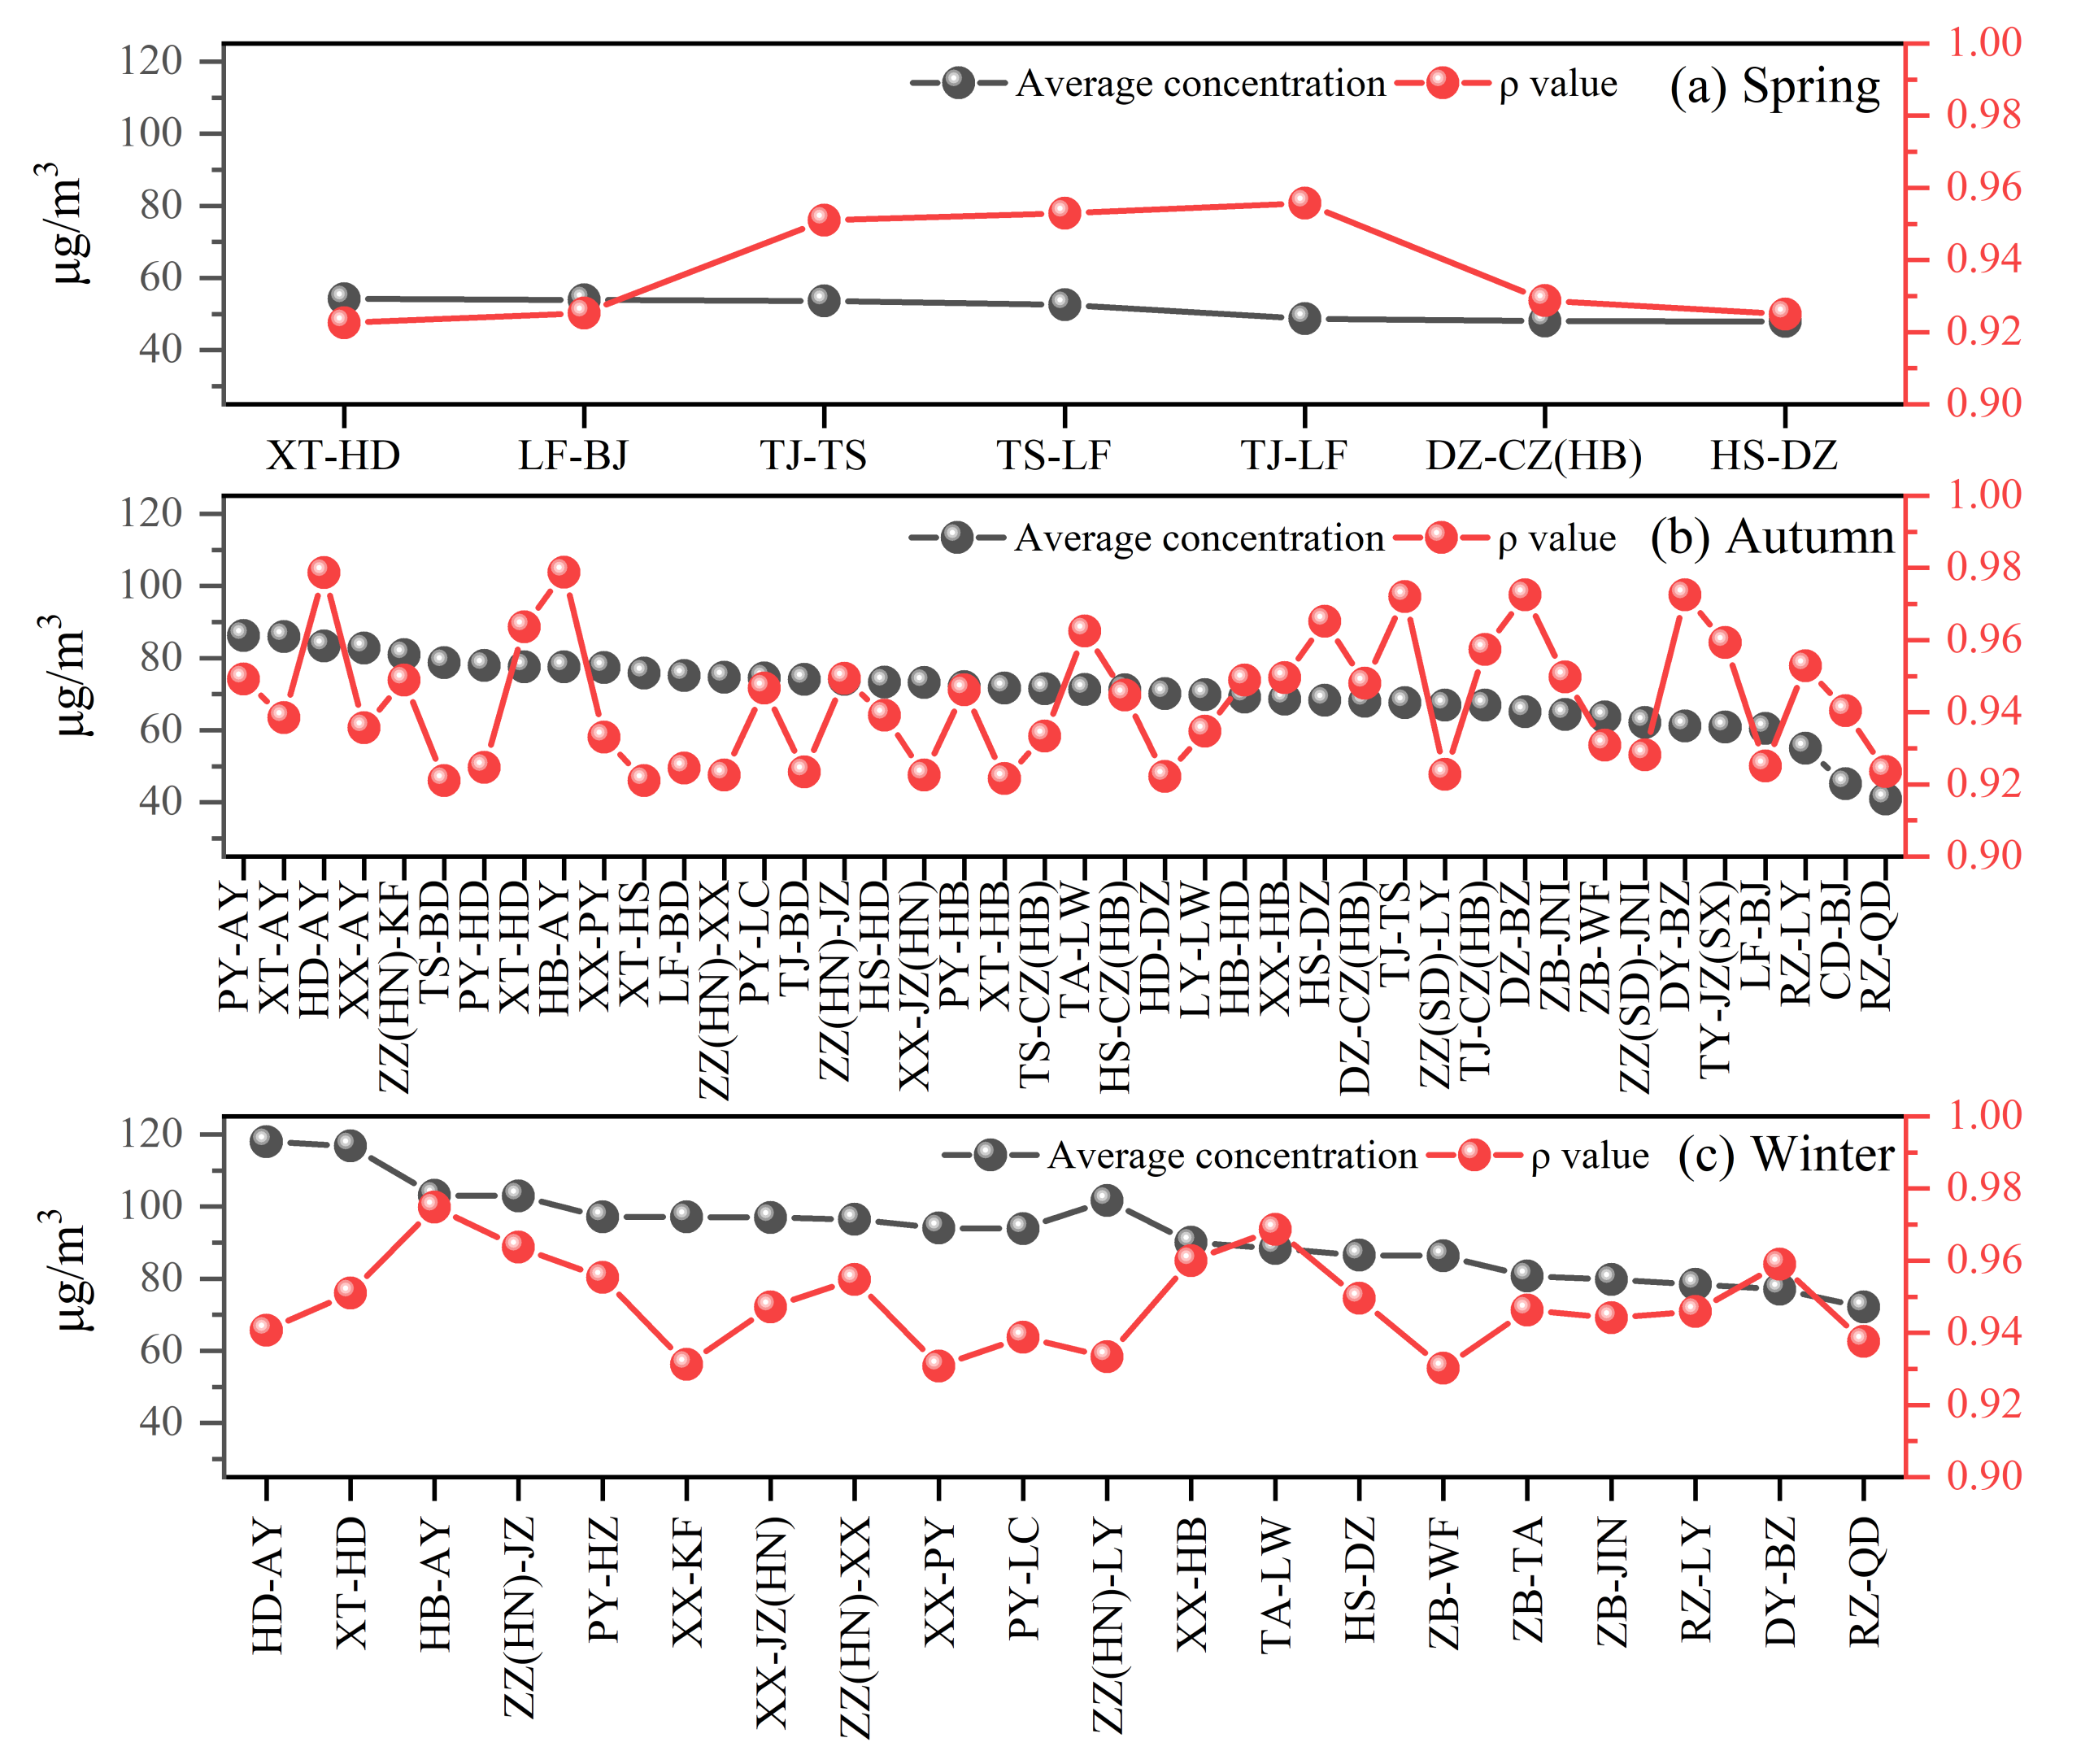
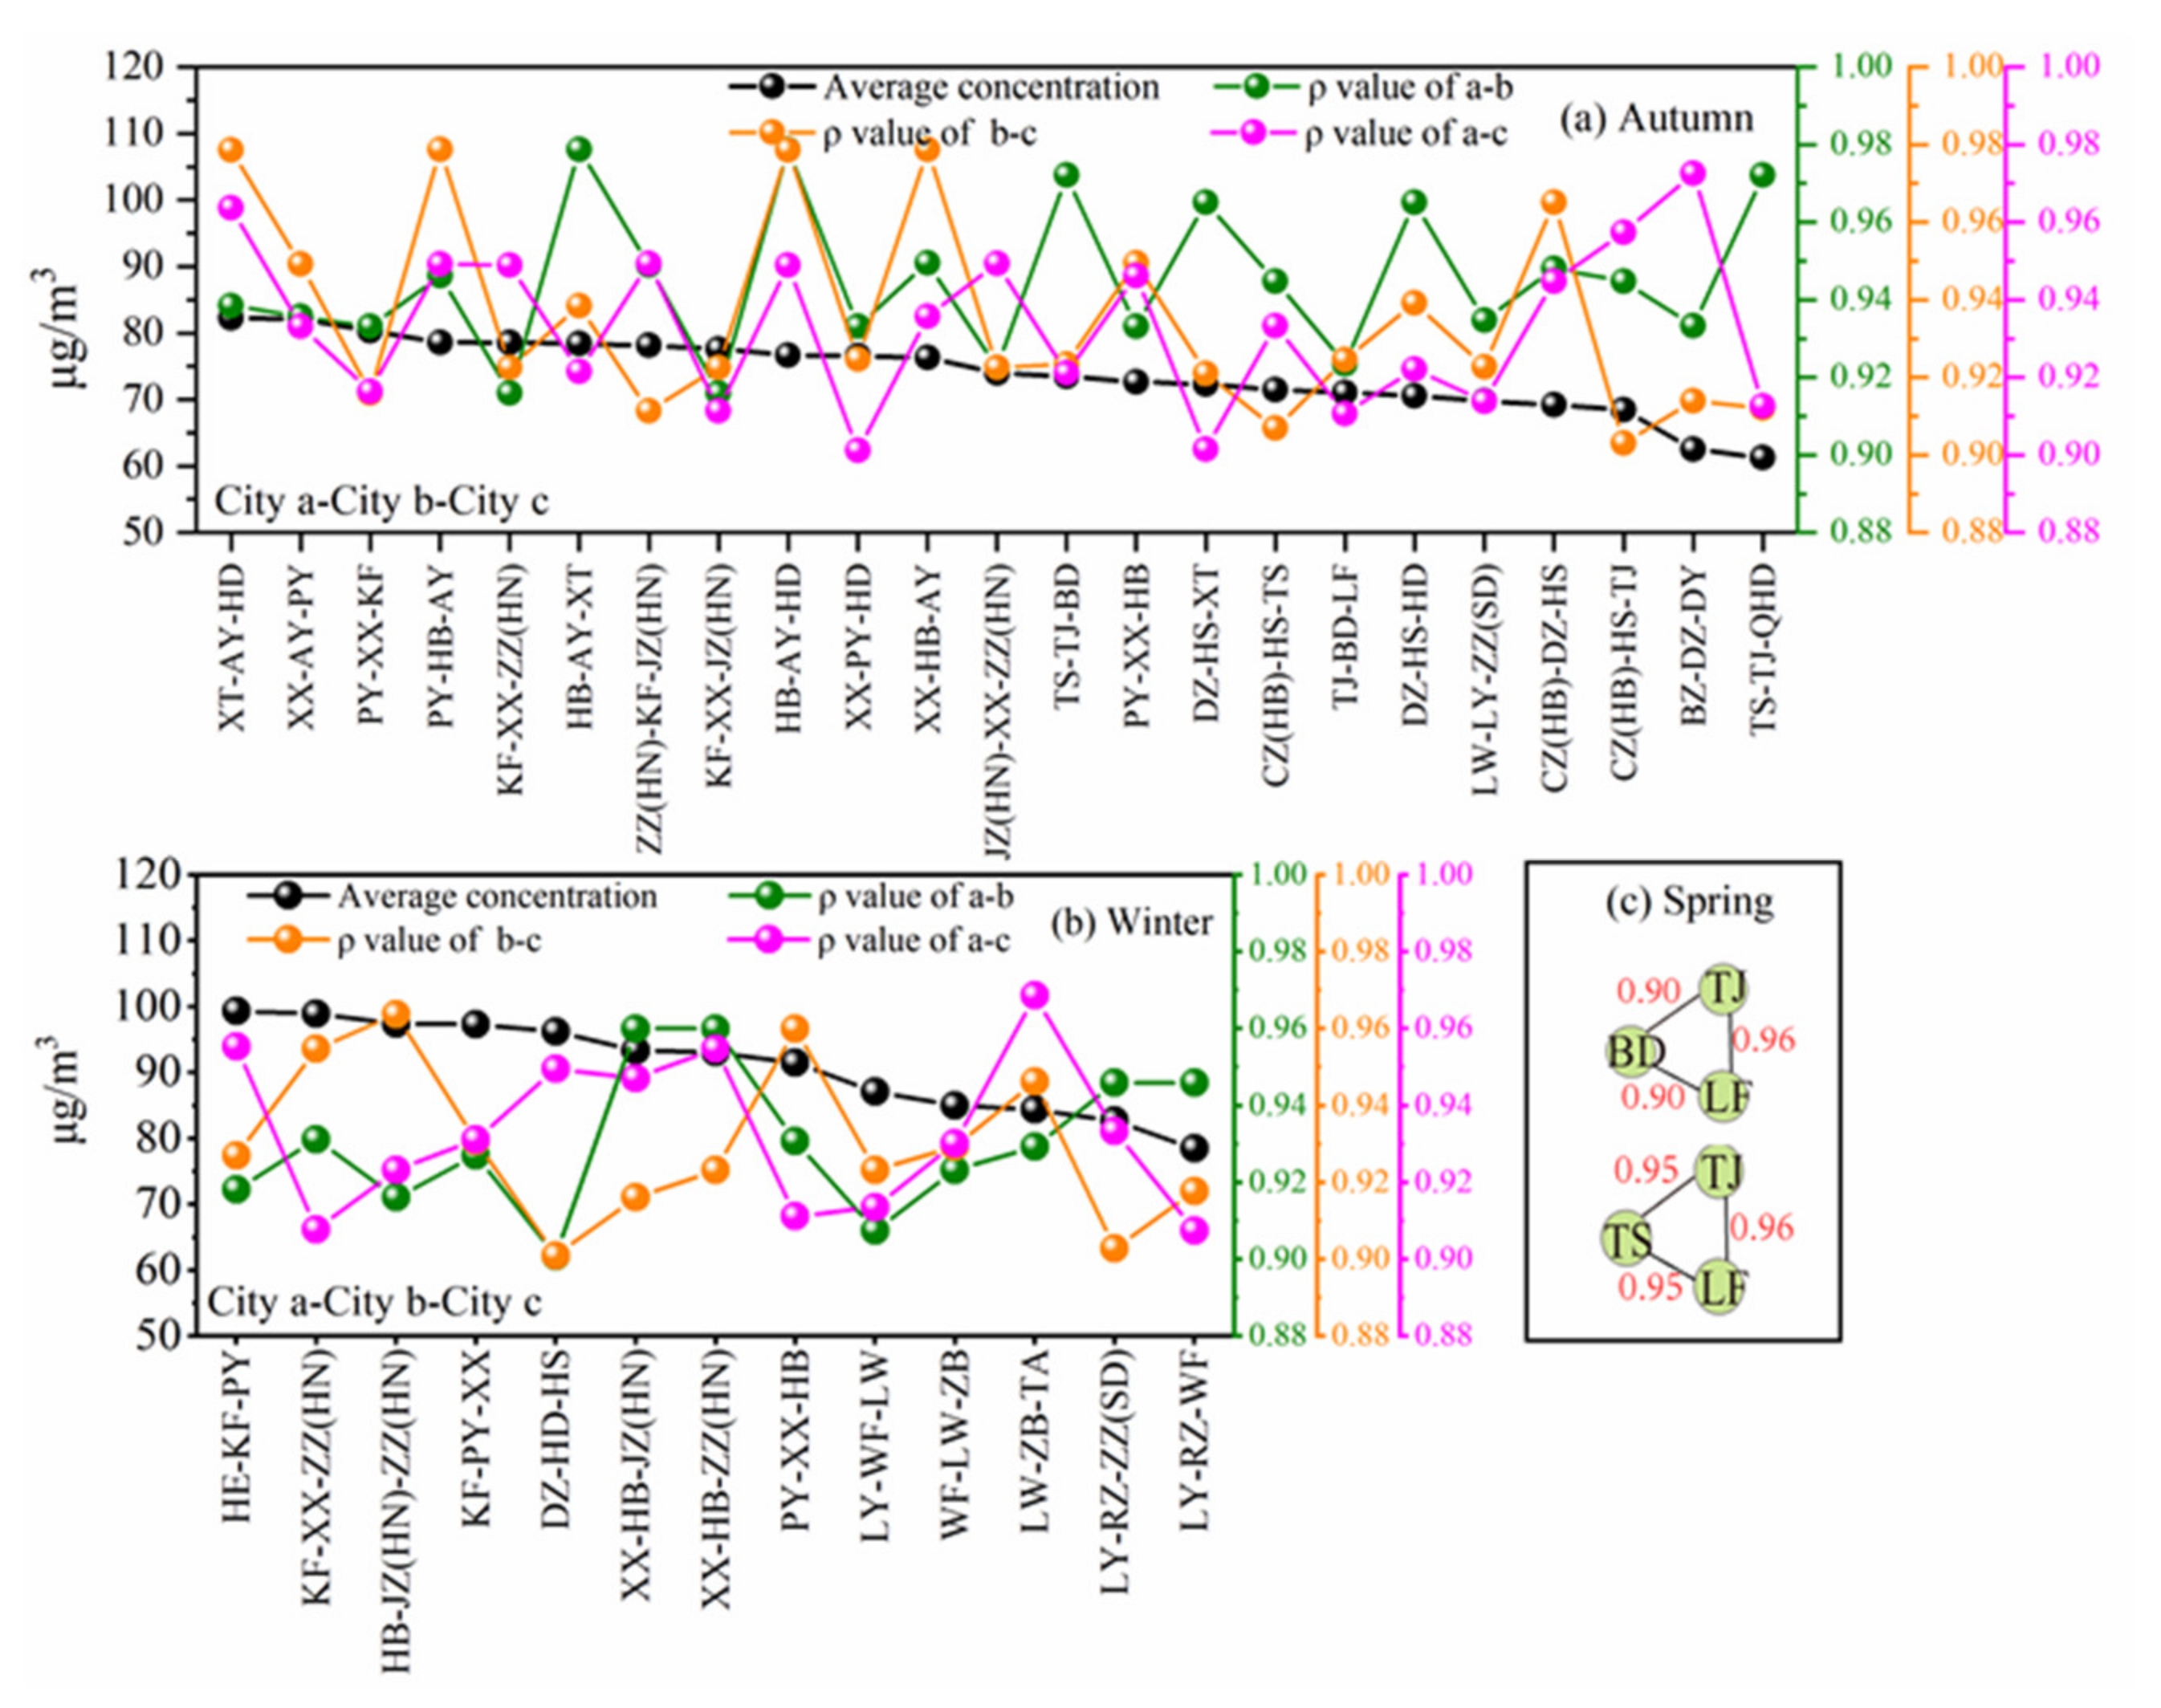
3.4. Network Correlation Analysis

Essentially, the network correlation model focuses on the correlation coefficient (ρ value) between every two cities. In principle, the larger the ρ value, the stronger the correlation of PM2.5 concentrations in the two cities (i.e., the impact of PM2.5 transport between the two cities is substantial). To clearly present the connection between cities, a provisional threshold value of ρ was set at 0.88. The results of the PM2.5 network correlation model in different seasons of the NNCP region in 2018 are presented in Figure 7. Note that, the connection between two cities with ρ values less than 0.88 are not displayed. It is evident that the network correlation between cities in the NNCP region is strong in autumn and winter, as opposed to spring and summer. This shows that autumn and winter seasons have potentially greater impacts of PM2.5 transport on surrounding cities or rather in cities with stronger common meteorological conditions.
For two nonattainment cities, the greater the impact of PM2.5, the greater the need for joint prevention and control. On the contrary, when more cities unite, the more difficult it is to implement a joint control strategy. According to the necessity and difficulty of the joint prevention and joint control between cities, different threshold values of ρ s can be used to further categorize city-clusters into three levels. The threshold for the first level of joint control with the least difficulty is 0.92, the second level is 0.90 and the third level is 0.88. Results of the complex network correlation model also suggest that, for nonattainment cities to realize the timely achievement of PM2.5 targets in NAAQS, then joint prevention and control need to be implemented in city-clusters. Therefore, cities with daily average concentrations of PM2.5 between 35–75 μg·m−3 need to implement the first level joint prevention and control, while those with PM2.5 concentrations between 75 μg·m−3 and 115 μg·m−3 are recommended to execute the second level, along with the first level of joint prevention and control. However, cities with PM2.5 concentrations above 115 μg·m−3 are recommended to perform the third level, besides the first and second levels.
The city-clusters of the first, second, and third levels of joint prevention and control are presented in Figure 8, Figure 9, and Figure S5 for all the seasons in 2018. Comparatively, the number of city-clusters in the first level is highest but lowest in the third level. It worth mentioning that, when the city-cluster of a certain level is not presented, it means that there was no proposed city-cluster of joint control for that level. What is more, there were no city-clusters for all levels during summer. In general, the average PM2.5 concentrations of city-clusters in winter were much higher than those in autumn. Besides, there were most city-clusters in autumn, followed by winter.
The results of the first-level joint prevention and control are presented in Figure 8. Clearly, in spring, Tianjin-Tangshan, Tangshan-Langfang, and Tianjin-Lanfang city-clusters all have higher ρ values (>0.94), indicating a strong correlation between them. However, there were only two city-clusters in the second level and one city-cluster in the third level, due to the relatively low PM2.5 concentration. During autumn, the ρ values for many city-clusters in the first-level, including Handan-Anyang, Xingtai-Handan, Hebi-Anyang, Taian-Laiwu, Hengshui-Dezhou, Tianjin-Tangshan, Tianjin-Cangzhou, Dezhou-Binzhou, Zibo-Jining, Dongying-Binzhou, Taiyuan-Jinzhong, Rizhao-Linyi, were obviously higher than 0.94, with even more than five city-clusters whose ρ values were higher than 0.96. For the first-level city-clusters in autumn and winter, the most polluted city-clusters are located in adjacent areas of Henan and Hebei provinces.
For the second-level in autumn, the PM2.5 concentrations in the city-cluster of Xingtai-Anyang-Handan were the highest, followed by the city-cluster of Xinxiang-Anyang-Puyang (Figure 9). For the third-level, the city-cluster of Heze-Puyang-Liaocheng-Jinan-Handan-Hebi-Xinxiang-Zhengzhou suffered from severe PM2.5 pollution in autumn (Figure S5). The cities in this city-cluster belong to different provinces (i.e., Henan, Hebei, and Shandong Provinces, respectively). This is an indication that joint control between cities across provincial boundaries is feasible and essential in autumn.
During the winter, the two city-clusters exhibiting severe PM2.5 pollution include Heze-Kaifeng-Puyang and Kaifeng-Xinxiang-Zhengzhou for the second-level (Figure 9). For the third-level, there were only two city-clusters. Handan-Shijiazhuang-Xingtai-Hengshui-Dezhou ranked first and Hebi-Jiaozuo-Kaifeng-Puyang-Zhengzhou-Xinxiang city cluster ranked second in terms of average PM2.5 concentrations, as shown in Figure S5. Except for Dezhou, all four cities in the first city-cluster belong to Hebei Province, and all six cities in the second city-cluster belong to Henan Province, indicating that pollution control in Hebei and Henan Provinces should be paid more attention. As mentioned above, Xinxiang was the representative city of the fifth cluster according to both the Euclidean distance and Pearson’s correlation distance. The COD values between Xinxiang and any other city in the same city-cluster, such as Hebi, Jiaozuo, Kaifeng, Puyang, and Zhengzhou, were all less than 0.14. This is proof that cities in the city-cluster of Hebi-Jiaozuo-Kaifeng-Puyang-Zhengzhou-Xinxiang were strongly related to each other. Based on the clustering of Pearson’s correlation distances, Hengshui was the representative city in the city-cluster, and the COD value was less than 0.15 for Dezhou, which is about 50 km away from Hengshui. The COD values of Shijiazhuang, Xingtai, and Handan, which are 100–180 km away from Hengshui, were also less than 0.18. This indicates a strong homogeneity and strong correlation between these five cities. In addition to the emission reduction of their own cities, strengthening joint prevention and control is highly needed to mitigate PM2.5 pollution, not only for themselves but also for other cities.

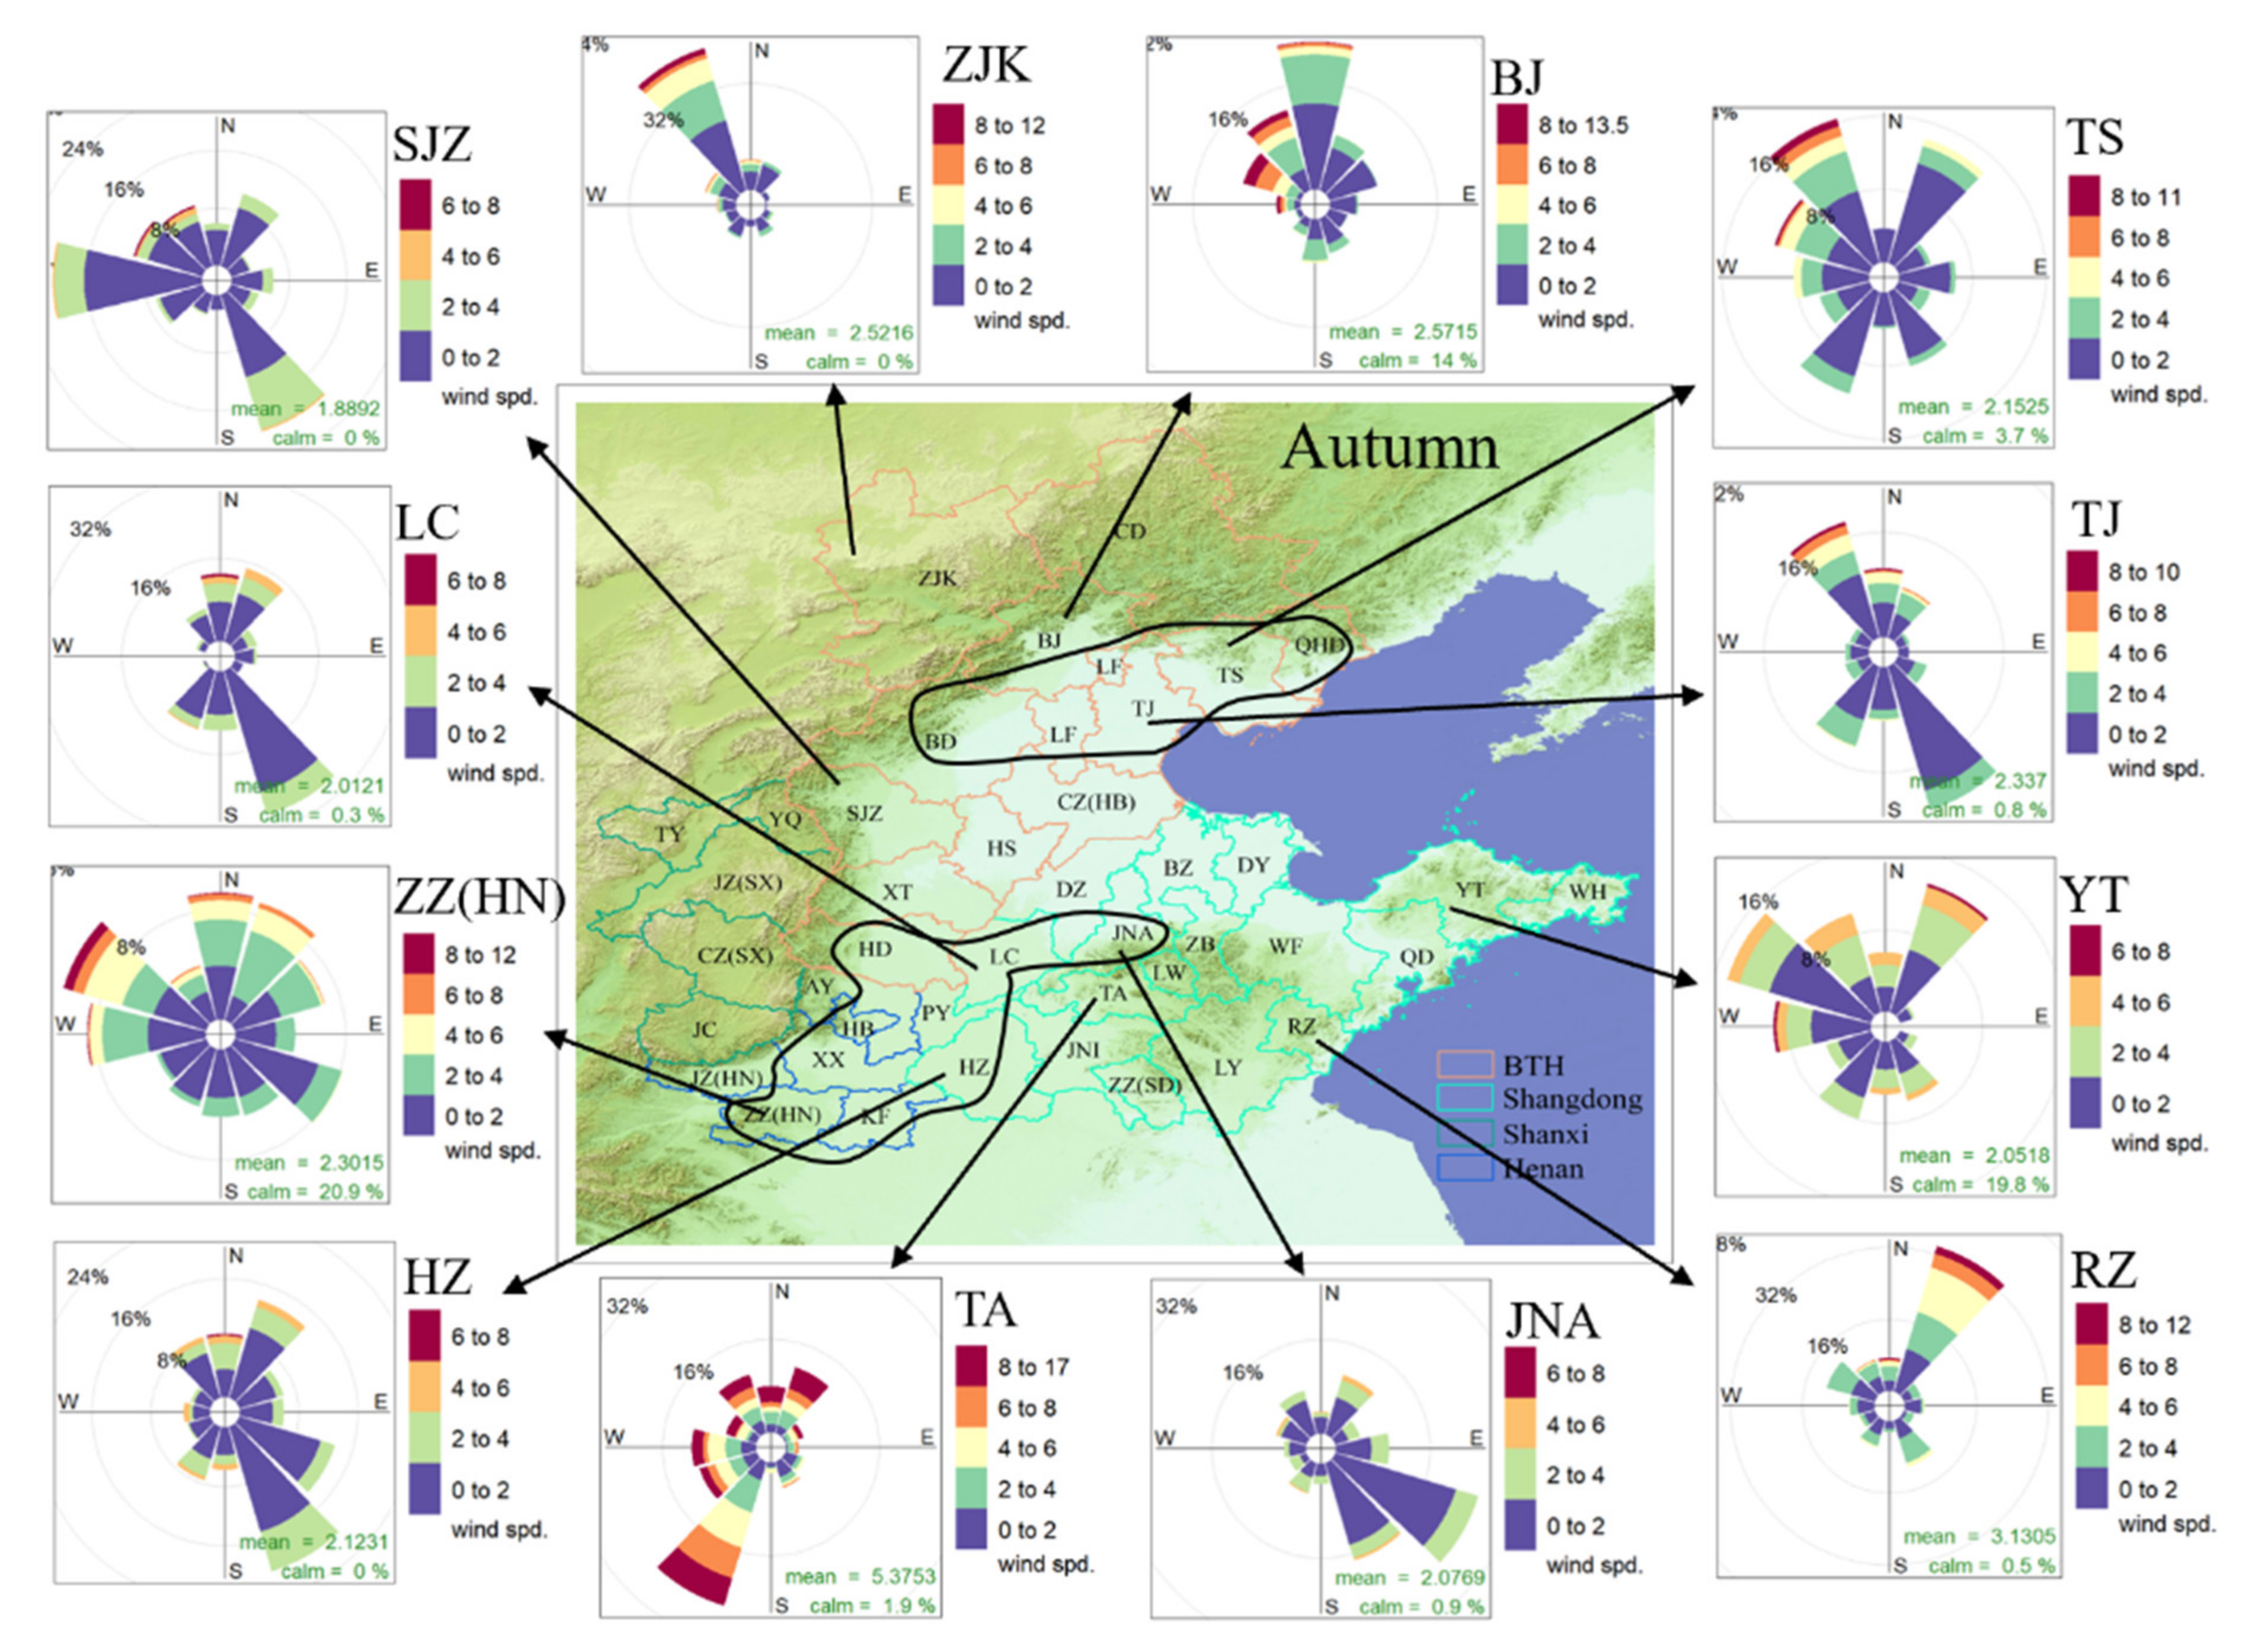
3.5. Topographic, Meteorological, and Air Stagnation Index Analysis

Mountain terrain significantly changes the wind speed and direction, and thus affects the transport strength and pathway of PM2.5. As shown in Figure 10 and Figure S6 for autumn and winter, respectively, Taihang Mountains and Yan Mountain are located in the west and northwest of Hebei. The two cities of Jinan and Taian are separated by Mount Tai, and the transport impact between them is relatively small. The dominant wind of Zhangjiakou in autumn and winter was the northwest wind, and 16% of the frequency wind in Beijing came from the direction of Zhangjiakou, mostly on days when the air quality was excellent. The transport between Zhangjiakou and Beijing was weak due to the low PM2.5 concentration in Zhangjiakou and the interference from Yan Mountain. As a result, Zhangjiakou alone became one cluster according to Pearson’s correlation clustering. Correspondingly, the ρ value between Zhangjiakou and Beijing was not large, which was not high enough to be combined with other cities in the first-level.
In autumn, the wind frequency from the northwest direction in Tangshan was relatively high, and the fastest wind speed about 10 m s−1, (Figure 10). Such, high wind speed is very beneficial to diffuse PM2.5 and to prevent the formation of heavy haze pollution. In addition, there also exists northwest winds around 2 m s−1 in the path of Langfang, (northwest of Tangshan) with the potential of a large impact on PM2.5 transport. This is consistent with the result of the network correlation model, indicating a strong correlation between PM2.5 concentrations in Tangshan and Langfang. The significant frequency of the winds from northeast and southwest of Tangshan with moderate speeds influences Tianjin, an adjacent city to Tangshan. This is also evidenced by the fact that wind frequencies in the southwest direction of Tangshan predominantly occur on non-excellent days. This was consistent with the results of the autumn in third-level based on the network correlation model. The terrain of Zhengzhou, Xinxiang, Hebi, Kaifeng, and Puyang is very flat, and the distances between cities are very close. The high frequency of northeast winds in Zhengzhou facilitates obvious transport impact on Xinxiang and Kaifeng cities, which is consistent with the results of the network correlation model. Similarly, Zhengzhou was also strongly related to cities like Xinxiang and Kaifeng in winter.
In addition, the Air Stagnation Index (ASI) is also a very important factor of meteorology to describe the ability of the atmosphere to dilute air pollutants. Neighboring cities with high ASI usually show a similar change pattern of PM2.5 concentrations. Hebi and Anyang were grouped into one city-cluster with the strongest correlation in autumn (0.98) (Figure 8), while their mean PM2.5 concentration and ASI were 77.5 μg·m−3 and 1.31, respectively. In winter, the ASI of 1.69 was much higher than that in autumn, suggesting that weather conditions in winter were closer to stagnation, as a result, their mean PM2.5 concentration (103.1 μg·m−3) was much higher than that in autumn. However, the correlation of PM2.5 concentrations between the two cities in winter was 0.97, which was slightly lower than that in autumn. Zhengzhou and Kaifeng are also a noteworthy city-cluster, with a mean ASI of 1.39 in autumn and 2.10 in winter, and corresponding average PM2.5 concentrations of 80.9 μg·m−3 and 103.1 μg·m−3 in autumn and winter, respectively. However, the correlation (0.95) in autumn was significantly higher than that in winter (0.91). Therefore, it can be concluded that higher ASI does not always contribute to a higher correlation of PM2.5 concentrations. In other words, the transport of PM2.5 concentrations can be attributed to the higher correlation of PM2.5 concentrations between cities.
Clustering analyses based on PM2.5 concentrations and ASI for autumn and winter are shown in Figure 11, respectively. In autumn, only Baoding and Shijiazhuang had both the highest concentrations and ASI. Cities in northeastern Shandong have the lowest ASI and also the lowest concentrations. However, cities in Henan belong to cluster 5 in the concentration clustering, and cluster 3 in the ASI clustering. The main reason for the big difference between the two clustering results is that pollutant transport was strong in these cities in Henan, which is consistent with the above analysis. In winter, the difference between the two clustering results in these cities in Henan is minimal, indicating a static stability index in winter with a significant effect on the correlation of PM2.5 concentrations.
Table 1 shows the mean distribution of PM2.5 concentration, ρ value, and air stagnation index for the different sub-regions with the Euclidian distance in autumn and winter respectively. It can be seen that the ASI is significantly higher in winter than autumn, indicating that the NNCP region is more prone to stagnant weather, correspondingly with higher PM2.5 concentrations, during winter. However, from Figure 7 and Figure 8, we can see that the correlations between cities are usually stronger in autumn than those in winter, suggesting that the strong correlations between cities in autumn are more attributed to the transport impacts than those in winter. Nevertheless, the transport contribution to high correlations in winter cannot be ignored due to the existing winds. Overall, the spatial correlation of PM2.5 concentrations between neighboring cities is not only influenced by the common stationary meteorological conditions but also impacted by the transport between cities.

4. Conclusions

This work focused on the spatial characteristics of PM2.5 pollution in the NNCP region, one of the key PM2.5 pollution regions in China. Through data mining technologies, insight was provided for better joint prevention and control in nonattainment cities. The main conclusions include:
(1) The distance between cities with PM2.5 pollution homogeneity in the NNCP region is less than 180 km based on the clustering analysis and coefficient of divergence analysis. It is necessary to strengthen joint prevention and control for cities with strong PM2.5 pollution homogeneity in the same clustering region.
(2) The COD values between Xinxiang and any one of Hebi, Kaifeng, Zhengzhou, and Jiaozuo were all less than 0.14, far lower than the judgment standard, indicating that there was a strong PM2.5 pollution homogeneity among them. Geographically, PM2.5 in these four cities was easily transported to neighboring cities due to such a short distance and flat terrain. It is very important to carry out joint prevention and control between these cities.
(3) According to the correlation of PM2.5 concentration between cities, three levels of city-clusters were proposed. City-clusters for the nonattainment cities were recommended to perform joint prevention and control depending on seasons and PM2.5 pollution levels.
(4) Overall, the spatial correlation of PM2.5 concentrations between neighboring cities is not only influenced by the common meteorological conditions but also impacted by the transport between cities. However, the correlations of PM2.5 between cities were generally stronger in autumn than those in winter but there were higher ASI values in winter, suggesting that the strong correlations between cities in autumn are more attributed to the transport impacts than those in winter. Therefore, these above policy implications are reasonable based on the spatial characteristics of PM2.5 concentrations in the NNCP region.

Supplementary Materials

The following are available online at https://0-www-mdpi-com.brum.beds.ac.uk/2073-4433/12/1/77/s1. Figure S1: The occurrence frequency of different PM2.5 pollution levels in NNCP region year by year during 2015-2018 (left) and month by month in 2018 (right), Figure S2: The variations of the monthly average concentration of PM2.5 in the NNCP region in different years, Figure S3: The spatial distribution of PM2.5 average annual concentrations in the NNCP region from 2015 to 2018, Figure S4: Elbow method for determining the number of clusters based on Euclidean distance (a) and Pearson’s correlation distance (b), Figure S5: The city-clusters with their average PM2.5 concentrations and ρ values for the s third-level in seasons (a): Autumn, (b): Winter, (c): Spring, Figure S6: Topographic map and winds rose diagrams of some cities for the winter of in 2018 in the NNCP region, Table S1: The COD values for six sub-regions based on Euclidean distance clustering, Table S2: The COD values for six sub-regions based on Pearson’s correlation distance clustering.

Author Contributions

Y.W.: Conceptualization and writing; H.L.: formal analysis and writing; J.F.: formal analysis; W.W.: conceptualization; Z.L.: visualization; L.H.: conceptualization; G.L.: methodology; K.M.: writing—review and editing; Y.G.: editing; D.T.: formal analysis; E.Y.: writing—review and editing; L.L.: conceptualization. All authors have read and agreed to the published version of the manuscript.

Funding

This research was funded by the National Key R&D Program of China (No.2018YFC0213600), National Natural Science Foundation of China (NO. 41875161), and Shanghai Science and Technology Innovation Plan (NO.19DZ1205007).

Institutional Review Board Statement

Not applicable.

Informed Consent Statement

Not applicable.

Data Availability Statement

Data sharing not applicable.

Acknowledgments

The authors would like to thank the China National Environmental Monitoring Center for providing the data used in our analysis.

Conflicts of Interest

The authors declare that they have no known competing financial interests or personal relationships that could have appeared to influence the work reported in this paper.

References

  1. Xu, P.; Chen, Y.; Ye, X. Haze, Air Pollution, and Health in China. Lancet 2013, 382, 2067. [Google Scholar] [CrossRef]
  2. Lu, F.; Xu, D.; Cheng, Y.; Dong, S.; Guo, C.; Jiang, X.; Zheng, X. Systematic Review and Meta-Analysis of the Adverse Health Effects of Ambient PM2.5 and PM10 Pollution in the Chinese Population. Environ. Res. 2015, 136, 196–204. [Google Scholar] [CrossRef]
  3. Zhao, B.; Wang, S.; Ding, D.; Wu, W.; Chang, X.; Wang, J.; Xing, J.; Jang, C.; Fu, J.S.; Zhu, Y.; et al. Nonlinear Relationships between Air Pollutant Emissions and PM2.5-Related Health Impacts in the Beijing-Tianjin-Hebei Region. Sci. Total Environ. 2019, 661, 375–385. [Google Scholar] [CrossRef]
  4. Shao, M.; Tang, X.; Zhang, Y.; Li, W. City Clusters in China: Air and Surface Water Pollution. Front. Ecol. Environ. 2006, 4, 353–361. [Google Scholar] [CrossRef]
  5. Zhao, X.J.; Zhao, P.S.; Xu, J.; Meng, W.; Pu, W.W.; Dong, F.; He, D.; Shi, Q.F. Analysis of a Winter Regional Haze Event and Its Formation Mechanism in the North China Plain. Atmos. Chem. Phys. 2013, 13, 5685–5696. [Google Scholar] [CrossRef] [Green Version]
  6. Wang, Y.; Yao, L.; Wang, L.; Liu, Z.; Ji, D.; Tang, G.; Zhang, J.; Sun, Y.; Hu, B.; Xin, J. Mechanism for the Formation of the January 2013 Heavy Haze Pollution Episode over Central and Eastern China. Sci. China Earth Sci. 2014, 57, 14–25. [Google Scholar] [CrossRef]
  7. Liu, L.; Bei, N.; Hu, B.; Wu, J.; Liu, S.; Li, X.; Wang, R.; Liu, Z.; Shen, Z.; Li, G. Wintertime Nitrate Formation Pathways in the North China Plain: Importance of N2O5 Heterogeneous Hydrolysis. Environ. Pollut. 2020, 266, 115287. [Google Scholar] [CrossRef]
  8. Tang, M.; Liu, Y.; He, J.; Wang, Z.; Wu, Z.; Ji, D. In Situ Continuous Hourly Observations of Wintertime Nitrate, Sulfate and Ammonium in a Megacity in the North China Plain from 2014 to 2019: Temporal Variation, Chemical Formation and Regional Transport. Chemosphere 2021, 262, 127745. [Google Scholar] [CrossRef] [PubMed]
  9. Wei, Y.; Chen, H.; Sun, H.; Zhang, F.; Shang, X.; Yao, L.; Zheng, H.; Li, Q.; Chen, J. Nocturnal PM2.5 Explosive Growth Dominates Severe Haze in the Rural North China Plain. Atmos. Res. 2020, 242, 105020. [Google Scholar] [CrossRef]
  10. Chen, C.; Zhang, H.; Li, H.; Wu, N.; Zhang, Q. Chemical Characteristics and Source Apportionment of Ambient PM1.0 and PM2.5 in a Polluted City in North China Plain. Atmos. Environ. 2020, 242, 117867. [Google Scholar] [CrossRef]
  11. Pang, N.; Gao, J.; Che, F.; Ma, T.; Liu, S.; Yang, Y.; Zhao, P.; Yuan, J.; Liu, J.; Xu, Z.; et al. Cause of PM2.5 Pollution during the 2016-2017 Heating Season in Beijing, Tianjin, and Langfang, China. J. Environ. Sci. 2020, 95, 201–209. [Google Scholar] [CrossRef] [PubMed]
  12. Zhang, Q.; Xue, D.; Liu, X.; Gong, X.; Gao, H. Process Analysis of PM2.5 Pollution Events in a Coastal City of China Using CMAQ. J. Environ. Sci. 2019, 79, 225–238. [Google Scholar] [CrossRef] [PubMed]
  13. Zhang, W.; Wang, H.; Zhang, X.; Peng, Y.; Zhong, J.; Wang, Y.; Zhao, Y. Evaluating the Contributions of Changed Meteorological Conditions and Emission to Substantial Reductions of PM2.5 Concentration from Winter 2016 to 2017 in Central and Eastern China. Sci. Total Environ. 2020, 716, 136892. [Google Scholar] [CrossRef] [PubMed]
  14. Dang, R.; Liao, H. Severe Winter Haze Days in the Beijing–Tianjin–Hebei Region from 1985 to 2017 and the Roles of Anthropogenic Emissions and Meteorology. Atmos. Chem. Phys. 2019, 19, 10801–10816. [Google Scholar] [CrossRef] [Green Version]
  15. Li, X.; Zhang, Q.; Zhang, Y.; Zheng, B.; Wang, K.; Chen, Y.; Wallington, T.J.; Han, W.; Shen, W.; Zhang, X.; et al. Source Contributions of Urban PM2.5 in the Beijing–Tianjin–Hebei Region: Changes between 2006 and 2013 and Relative Impacts of Emissions and Meteorology. Atmos. Environ. 2015, 123, 229–239. [Google Scholar] [CrossRef] [Green Version]
  16. Zhang, X.; Zhang, Q.; Hong, C.; Zheng, Y.; Geng, G.; Tong, D.; Zhang, Y.; Zhang, X. Enhancement of PM2.5 Concentrations by Aerosol-Meteorology Interactions Over China. J. Geophys. Res. Atmos. 2018, 123, 1179–1194. [Google Scholar] [CrossRef]
  17. Li, M.; Hu, M.; Du, B.; Guo, Q.; Tan, T.; Zheng, J.; Huang, X.; He, L.; Wu, Z.; Guo, S. Temporal and Spatial Distribution of PM2.5 Chemical Composition in a Coastal City of Southeast China. Sci. Total Environ. 2017, 605–606, 337–346. [Google Scholar] [CrossRef]
  18. Jin, X.; Cai, X.; Yu, M.; Song, Y.; Wang, X.; Kang, L.; Zhang, H. Diagnostic Analysis of Wintertime PM2.5 Pollution in the North China Plain: The Impacts of Regional Transport and Atmospheric Boundary Layer Variation. Atmos. Environ. 2020, 224, 117346. [Google Scholar] [CrossRef]
  19. Huang, Q.; Cai, X.; Wang, J.; Song, Y.; Zhu, T. Climatological Study of the Boundary-Layer Air Stagnation Index for China and Its Relationship with Air Pollution. Atmos. Chem. Phys. 2018, 18, 7573–7593. [Google Scholar] [CrossRef] [Green Version]
  20. Chang, X.; Wang, S.; Zhao, B.; Xing, J.; Liu, X.; Wei, L.; Song, Y.; Wu, W.; Cai, S.; Zheng, H.; et al. Contributions of Inter-City and Regional Transport to PM2.5 Concentrations in the Beijing-Tianjin-Hebei Region and Its Implications on Regional Joint Air Pollution Control. Sci. Total Environ. 2019, 660, 1191–1200. [Google Scholar] [CrossRef]
  21. Chen, D.; Liu, X.; Lang, J.; Zhou, Y.; Wei, L.; Wang, X.; Guo, X. Estimating the Contribution of Regional Transport to PM2.5 Air Pollution in a Rural Area on the North China Plain. Sci. Total Environ. 2017, 583, 280–291. [Google Scholar] [CrossRef] [PubMed]
  22. Wang, Q.; Luo, K.; Fan, J.; Gao, X.; Cen, K. Spatial Distribution and Multiscale Transport Characteristics of PM2.5 in China. Aerosol Air Qual. Res. 2019, 19, 1993–2007. [Google Scholar] [CrossRef] [Green Version]
  23. Jiang, L.; Bai, L. Spatio-Temporal Characteristics of Urban Air Pollutions and Their Causal Relationships: Evidence from Beijing and Its Neighboring Cities. Sci. Rep. 2018, 8, 1279. [Google Scholar] [CrossRef] [PubMed] [Green Version]
  24. Du, Y.; Sun, T.; Peng, J.; Fang, K.; Liu, Y.; Yang, Y.; Wang, Y. Direct and Spillover Effects of Urbanization on PM2.5 Concentrations in China’s Top Three Urban Agglomerations. J. Clean. Prod. 2018, 190, 72–83. [Google Scholar] [CrossRef]
  25. Li, H.; Qi, Y.; Li, C.; Liu, X. Routes and Clustering Features of PM2.5 Spillover within the Jing-Jin-Ji Region at Multiple Timescales Identified Using Complex Network-Based Methods. J. Clean. Prod. 2019, 209, 1195–1205. [Google Scholar] [CrossRef]
  26. Yan, D.; Lei, Y.; Shi, Y.; Zhu, Q.; Li, L.; Zhang, Z. Evolution of the Spatiotemporal Pattern of PM2.5 Concentrations in China—A Case Study from the Beijing-Tianjin-Hebei Region. Atmos. Environ. 2018, 183, 225–233. [Google Scholar] [CrossRef] [Green Version]
  27. Xiao, C.; Chang, M.; Guo, P.; Gu, M.; Li, Y. Analysis of Air Quality Characteristics of Beijing–Tianjin–Hebei and Its Surrounding Air Pollution Transport Channel Cities in China. J. Environ. Sci. 2020, 87, 213–227. [Google Scholar] [CrossRef]
  28. Jiang, L.; He, S.; Zhou, H. Spatio-Temporal Characteristics and Convergence Trends of PM2.5 Pollution: A Case Study of Cities of Air Pollution Transmission Channel in Beijing-Tianjin-Hebei Region, China. J. Clean. Prod. 2020, 256, 120631. [Google Scholar] [CrossRef]
  29. Shen, Y.; Zhang, L.; Fang, X.; Ji, H.; Li, X.; Zhao, Z. Spatiotemporal Patterns of Recent PM2.5 Concentrations over Typical Urban Agglomerations in China. Sci. Total Environ. 2019, 655, 13–26. [Google Scholar] [CrossRef]
  30. Xie, Y.; Zhao, L.; Xue, J.; Gao, H.O.; Li, H.; Jiang, R.; Qiu, X.; Zhang, S. Methods for Defining the Scopes and Priorities for Joint Prevention and Control of Air Pollution Regions Based on Data-Mining Technologies. J. Clean. Prod. 2018, 185, 912–921. [Google Scholar] [CrossRef]
  31. Wang, H.; Zhao, L. A Joint Prevention and Control Mechanism for Air Pollution in the Beijing-Tianjin-Hebei Region in China Based on Long-Term and Massive Data Mining of Pollutant Concentration. Atmos. Environ. 2018, 174, 25–42. [Google Scholar] [CrossRef]
  32. Sun, L.; Du, J.; Li, Y. A New Method for Dividing the Scopes and Priorities of Air Pollution Control Based on Environmental Justice. Environ. Sci. Pollut. Res. 2020. [Google Scholar] [CrossRef] [PubMed]
  33. Yu, T. Delineation of Air-Quality Basins Utilizing Multivariate Statistical Methods in Taiwan. Atmos. Environ. 2001, 35, 3155–3166. [Google Scholar] [CrossRef]
  34. Sasirekha, K.; Baby, P. Agglomerative Hierarchical Clustering Algorithm—A Review. Int. J. Sci. Res. Publ. 2013, 3, 1–3. [Google Scholar] [CrossRef]
  35. Qu, W.J.; Arimoto, R.; Zhang, X.Y.; Zhao, C.H.; Wang, Y.Q.; Sheng, L.F.; Fu, G. Spatial Distribution and Interannual Variation of Surface PM10 Concentrations over Eighty-Six Chinese Cities. Atmos. Chem. Phys. 2010, 10, 5641–5662. [Google Scholar] [CrossRef] [Green Version]
  36. Austin, E.; Coull, B.A.; Zanobetti, A.; Koutrakis, P. A Framework to Spatially Cluster Air Pollution Monitoring Sites in US Based on the PM2.5 Composition. Environ. Int. 2013, 59, 244–254. [Google Scholar] [CrossRef]
  37. Zhang, J.; Zhang, L.; Du, M.; Zhang, W.; Huang, X.; Zhang, Y.; Yang, Y.; Zhang, J.; Deng, S.; Shen, F.; et al. Indentifying the Major Air Pollutants Base on Factor and Cluster Analysis, a Case Study in 74 Chinese Cities. Atmos. Environ. 2016, 144, 37–46. [Google Scholar] [CrossRef]
  38. Jiang, Y.; Guo, H.; Jia, Y.; Cao, Y.; Hu, C. Principal Component Analysis and Hierarchical Cluster Analyses of Arsenic Groundwater Geochemistry in the Hetao Basin, Inner Mongolia. Geochemistry 2015, 75, 197–205. [Google Scholar] [CrossRef]
  39. Gao, H.; Chen, J.; Wang, B.; Tan, S.-C.; Lee, C.M.; Yao, X.; Yan, H.; Shi, J. A Study of Air Pollution of City Clusters. Atmos. Environ. 2011, 45, 3069–3077. [Google Scholar] [CrossRef]
  40. Wongphatarakul, V.; Friedlander, S.K.; Pinto, J.P. A Comparative Study of PM2.5 Ambient Aerosol Chemical Databases. Environ. Sci. Technol. 1998, 32, 3926–3934. [Google Scholar] [CrossRef]
  41. Xie, M.; Coons, T.L.; Dutton, S.J.; Milford, J.B.; Miller, S.L.; Peel, J.L.; Vedal, S.; Hannigan, M.P. Intra-Urban Spatial Variability of PM2.5-Bound Carbonaceous Components. Atmos. Environ. 2012, 60, 486–494. [Google Scholar] [CrossRef] [PubMed] [Green Version]
  42. Brauer, M.; Hystad, P.; Poplawski, K. Assessing the Spatial Representativeness of PM2.5 and O3 Measurements from the National Air Pollutant Surveillance System. 2011. Available online: https://www.researchgate.net/profile/Michael_Brauer/publication/266171830-Assessing-the-Spatial-Representativeness-of-PM25-and-O3-Measurements-from-the-National-Air-Pollutant-Surveillance-System/links/562c4b5608aef25a2441cff3.pdf (accessed on 31 December 2020). (In Canada).
  43. Bravo, M.A.; Bell, M.L. Spatial Heterogeneity of PM10 and O3 in São Paulo, Brazil, and Implications for Human Health Studies. J. Air Waste Manag. Assoc. 2011, 61, 69–77. [Google Scholar] [CrossRef] [PubMed]
  44. Yan, S.; Wu, G. Network Analysis of Fine Particulate Matter (PM2.5) Emissions in China. Sci. Rep. 2016, 6, 33227. [Google Scholar] [CrossRef] [PubMed] [Green Version]
  45. Wang, Y.; Wang, H.; Chang, S.; Liu, M. Higher-Order Network Analysis of Fine Particulate Matter (PM2.5) Transport in China at City Level. Sci. Rep. 2017, 7, 1–9. [Google Scholar] [CrossRef] [Green Version]
  46. Zhang, N.-N.; Ma, F.; Qin, C.-B.; Li, Y.-F. Spatiotemporal Trends in PM2.5 Levels from 2013 to 2017 and Regional Demarcations for Joint Prevention and Control of Atmospheric Pollution in China. Chemosphere 2018, 210, 1176–1184. [Google Scholar] [CrossRef]
  47. Mu, Y.; Liu, X.; Wang, L. A Pearson’s Correlation Coefficient Based Decision Tree and Its Parallel Implementation. Inf. Sci. 2018, 435, 40–58. [Google Scholar] [CrossRef]
  48. Rosner, B.; Glynn, R.J. Estimation of Rank Correlation for Clustered Data: Estimation of Rank Correlation for Clustered Data. Stat. Med. 2017, 36, 2163–2186. [Google Scholar] [CrossRef]
  49. Feng, J.; Quan, J.; Liao, H.; Li, Y.; Zhao, X. An Air Stagnation Index to Qualify Extreme Haze Events in Northern China. J. Atmos. Sci. 2018, 75, 3489–3505. [Google Scholar] [CrossRef]
  50. Feng, J.; Liao, H.; Li, Y.; Zhang, Z.; Tang, Y. Long-Term Trends and Variations in Haze-Related Weather Conditions in North China during 1980–2018 Based on Emission-Weighted Stagnation Intensity. Atmos. Environ. 2020, 240, 117830. [Google Scholar] [CrossRef]
  51. Hu, J.; Wang, Y.; Ying, Q.; Zhang, H. Spatial and Temporal Variability of PM2.5 and PM10 over the North China Plain and the Yangtze River Delta, China. Atmos. Environ. 2014, 95, 598–609. [Google Scholar] [CrossRef]
  52. Feng, J.; Yu, H.; Liu, S.; Su, X.; Li, Y.; Pan, Y.; Sun, J. PM2.5 Levels, Chemical Composition and Health Risk Assessment in Xinxiang, a Seriously Air-Polluted City in North China. Environ. Geochem. Health 2017, 39, 1071–1083. [Google Scholar] [CrossRef] [PubMed]
Figure 1. The study domain and cities in the northern part of the North China Plain (NNCP) region.
Atmosphere 12 00077 g001
Figure 2. Average PM2.5 concentrations in the different sub-regions of NNCP (2015–2018).
Atmosphere 12 00077 g002
Figure 3. The number of non-excellent days (a) and variations of annual PM2.5 concentrations (b) by city from 2015 to 2018 in the NNCP region.
Atmosphere 12 00077 g003
Figure 4. Clustering results based on daily PM2.5 concentrations of Euclidean distance (a) and Pearson’s correlation distance (b) in 2018.
Atmosphere 12 00077 g004
Figure 5. The variations of coefficient of divergence (COD) values with the geographical distance of any other city away from the representative city for the six clustered regions (af) based on Euclidean distances clustering.
Atmosphere 12 00077 g005
Figure 6. The variations of COD values with the geographical distance of any city relative to the representative city for the five clustered regions (ae) are based on Pearson’s correlation distances clustering.
Atmosphere 12 00077 g006
Figure 7. Network correlations between cities in different seasons (a): Spring, (b): Summer, (c): Autumn, (d): Winter, in the NNCP region (ρ ≥ 0.88).
Atmosphere 12 00077 g007
Figure 8. The city-clusters with their average PM2.5 concentrations and ρ values for the first level in seasons (a): Spring, (b): Autumn, (c): Winter.
Atmosphere 12 00077 g008
Figure 9. The city-clusters with their average PM2.5 concentrations and ρ values for the second-level in seasons (a): Autumn, (b): Winter, (c): Spring.
Atmosphere 12 00077 g009
Figure 10. Topographic map and winds rose diagrams of some cities for the autumn of 2018 in the NNCP region.
Atmosphere 12 00077 g010
Figure 11. Clustering results based on Euclidean distance for average daily PM2.5 concentrations (a,c) and daily air stagnation index (ASI) (b,d) in autumn 2018.
Atmosphere 12 00077 g011
Table 1. Mean of PM2.5 concentrations, ρ value, and ASI for cluster sub-regions based Euclidian distance in autumn and winter 2018, respectively.
Sub-RegionAutumnWinter
PM2.5 Concentration
(μg·m−3)
ρ ValueASIPM2.5 Concentration
(μg·m−3)
ρ ValueASI
133.40.62 0.9844.00.55 1.43
257.50.64 1.2678.50.82 1.74
363.50.85 1.3981.40.72 1.51
466.50.89 1.3786.90.81 1.79
577.10.88 1.3696.30.89 1.90
684.50.88 1.49114.60.90 1.61
Publisher’s Note: MDPI stays neutral with regard to jurisdictional claims in published maps and institutional affiliations.

