Article

Impact of Agricultural Drought on Sunflower Production across Hungary

1
Faculty of Agricultural and Food Sciences and Environmental Management, Institute of Land Utilization, Technology and Regional Development, University of Debrecen, 4032 Debrecen, Hungary
2
Department of Civil Engineering, College of Engineering, King Saud University, Riyadh 11421, Saudi Arabia
3
Department of Transport Infrastructure and Water Resources Engineering, Széchenyi István University, 9026 Győr, Hungary
4
School of Geographical Sciences, Nanjing University of Information Science and Technology, Nanjing 210044, China
5
Institute of Crop Science and Resource Conservation (INRES), University of Bonn, 53115 Bonn, Germany
6
Department of Agronomy, MNS-University of Agriculture, Multan 60000, Pakistan
*
Author to whom correspondence should be addressed.
Submission received: 23 September 2021 / Revised: 7 October 2021 / Accepted: 8 October 2021 / Published: 13 October 2021

Abstract

:
In the last few decades, agricultural drought (Ag.D) has seriously affected crop production and food security worldwide. In Hungary, little research has been carried out to assess the impacts of climate change, particularly regarding droughts and crop production, and especially on regional scales. Thus, the main aim of this study was to evaluate the impact of agricultural drought on sunflower production across Hungary. Drought data for the Standardized Precipitation Index (SPI) and the Standardized Precipitation Evapotranspiration Index (SPEI) were collected from the CARBATCLIM database (1961–2010), whereas sunflower production was collected from the Hungarian national statistical center (KSH) on regional and national scales. To address the impact of Ag.D on sunflower production, the sequence of standardized yield residuals (SSYR) and yield losses YlossAD was applied. Additionally, sunflower resilience to Ag.D (SRAg.D) was assessed on a regional scale. The results showed that Ag.D is more severe in the western regions of Hungary, with a significantly positive trend. Interestingly, drought events were more frequent between 1990 and 2010. Moreover, the lowest SSYR values were reported as −3.20 in the Hajdu-Bihar region (2010). In this sense, during the sunflower growing cycle, the relationship between SSYR and Ag.D revealed that the highest correlations were recorded in the central and western regions of Hungary. However, 75% of the regions showed that the plantation of sunflower is not resilient to drought where SRAg . D x < 1. To cope with climate change in Hungary, an urgent mitigation plan should be implemented.

1. Introduction

Climate change is one of the most challenging and complex issues facing the world today [1]. Over the last few centuries, the burning of fossil fuels and widespread deforestation have resulted in increased atmospheric greenhouse gas (GHG) concentrations, which have led to significant climate shifts across the planet [2]. Since 1750, the concentrations of GHGs such as methane (CH4), carbon dioxide (CO2), and nitrous oxide (N2O) have risen by 156%, 47%, and 23%, respectively [1,3]. Due to anthropogenic activities, the average temperature rose by 0.99 °C, in the first two decades of the 21st century (2001–2020), and according to predictions, by 2050, the temperature increase is expected to reach 1.5 °C, or perhaps even higher than the average temperature in the preindustrial period (1850–1900) [1]. This accelerated rise in temperature has caused a spike in droughts, floods, irregular precipitation patterns, heat waves, and other extreme climate events around the world [4,5].
According to the annual report of Weather, Climate, and Catastrophe Insight [6], natural disasters alone caused direct losses and damage totaling over USD 268 billion worldwide in 2020; on average, losses due to natural disasters and emergencies have exceeded USD 200 billion per year since 2016. Approximately 95% of these losses are linked to weather-related events, where hurricanes, floods and droughts are the major contributors and have a direct link to climate change [6]. Overall, the impact of climate change is extensive, but its effects are now clearly visible on the agricultural sector [7], on which the world’s food production and economy relies. It is also important to highlight that the world population is predicted to hit 9.7 billion by 2050 [8], which would increase the pressure on the agricultural sector to fulfill the growing food demands already impacted by climate change.
Among natural disasters caused by weather and climate change, drought is a unique issue; the global trend towards more or less frequent drought episodes is still a highly discussed topic [9,10,11,12,13,14]. This is attributed to the complicated characteristics of droughts, which usually develop slowly but can extend for months or even years [15,16]. Furthermore, the consequences can have a variety of effects on several sectors [17,18,19,20]. Additionally, the lack of a unified universal definition [21,22] and the wide range of indicators used to assess meteorological, agricultural, hydrological, and socioeconomic droughts [23] enhance the complexity.
Drought impacts all socioeconomic and environmental systems [24], with significant effects on anthropogenic fields including agriculture, forestry, water resource management, energy generation, and health [25]. Drought impacts can be divided into two categories: direct and indirect [25]. Direct effects include decreased crop production [26], increased numbers of forest fires [27], decreased water levels [28], and increased livestock mortality rates [29]. Indirect effects of drought include highly unstable food prices, which may be exacerbated by market effects in the agricultural sector [30]. As a result, estimating total costs and losses at the regional and national levels is difficult. Indirect losses are mostly greater than direct losses [31], although they are more difficult to link to a specific event.
In order to detect, monitor, and characterize drought events, many drought indices have been developed, such as the Palmer Drought Severity Index Standardized (PDSI) [32], Precipitation Index (SPI) [33], and the Standardized Precipitation Evapotranspiration Index (SPEI) [34]. Table 1 presents more details about the most commonly used drought indices in the literature.
In Europe, the accelerated warming in this region [42], in comparison with many other parts of the world, has intensified drought events for prolonged periods, accompanied by rising temperatures and low rainfall, particularly in the center of the continent (i.e., Hungary) [43,44].
Hungary, similarly to other European countries in the Carpathians, is affected by droughts and climate change [45,46]. Droughts have been common in Hungarian history, leading to reduced crops, animal devastation, and the risk of hunger and illnesses [47]. The frequency of drought events has also increased significantly in Hungary [47]. Generally, every two years, Hungary experiences a moderate drought, and every three years, it experiences a severe drought [48]; these drought conditions are projected to continue for the rest of the 21st century [45,49]. In this sense, little research has been conducted in Hungary to assess the impact of climate change on crop production, especially on a regional scale. Hence, our understanding of the direct impacts of different drought cycles on crop production is still limited. Thus, the main aims of this research were: (1) to track agricultural drought (Ag.D) evolution across Hungarian counties between 1960 and 2010 by using the Standardized Precipitation Index (SPI) and the Standardized Precipitation Evapotranspiration Index (SPEI); (2) to analyze the dynamic interaction between sunflower yield and drought cycles; and (3) to identify the counties most prone to drought. In this study, sunflower crops were chosen due to their economic importance, where it is considered one of the most important oil crops (550,000 ha) across Hungary.

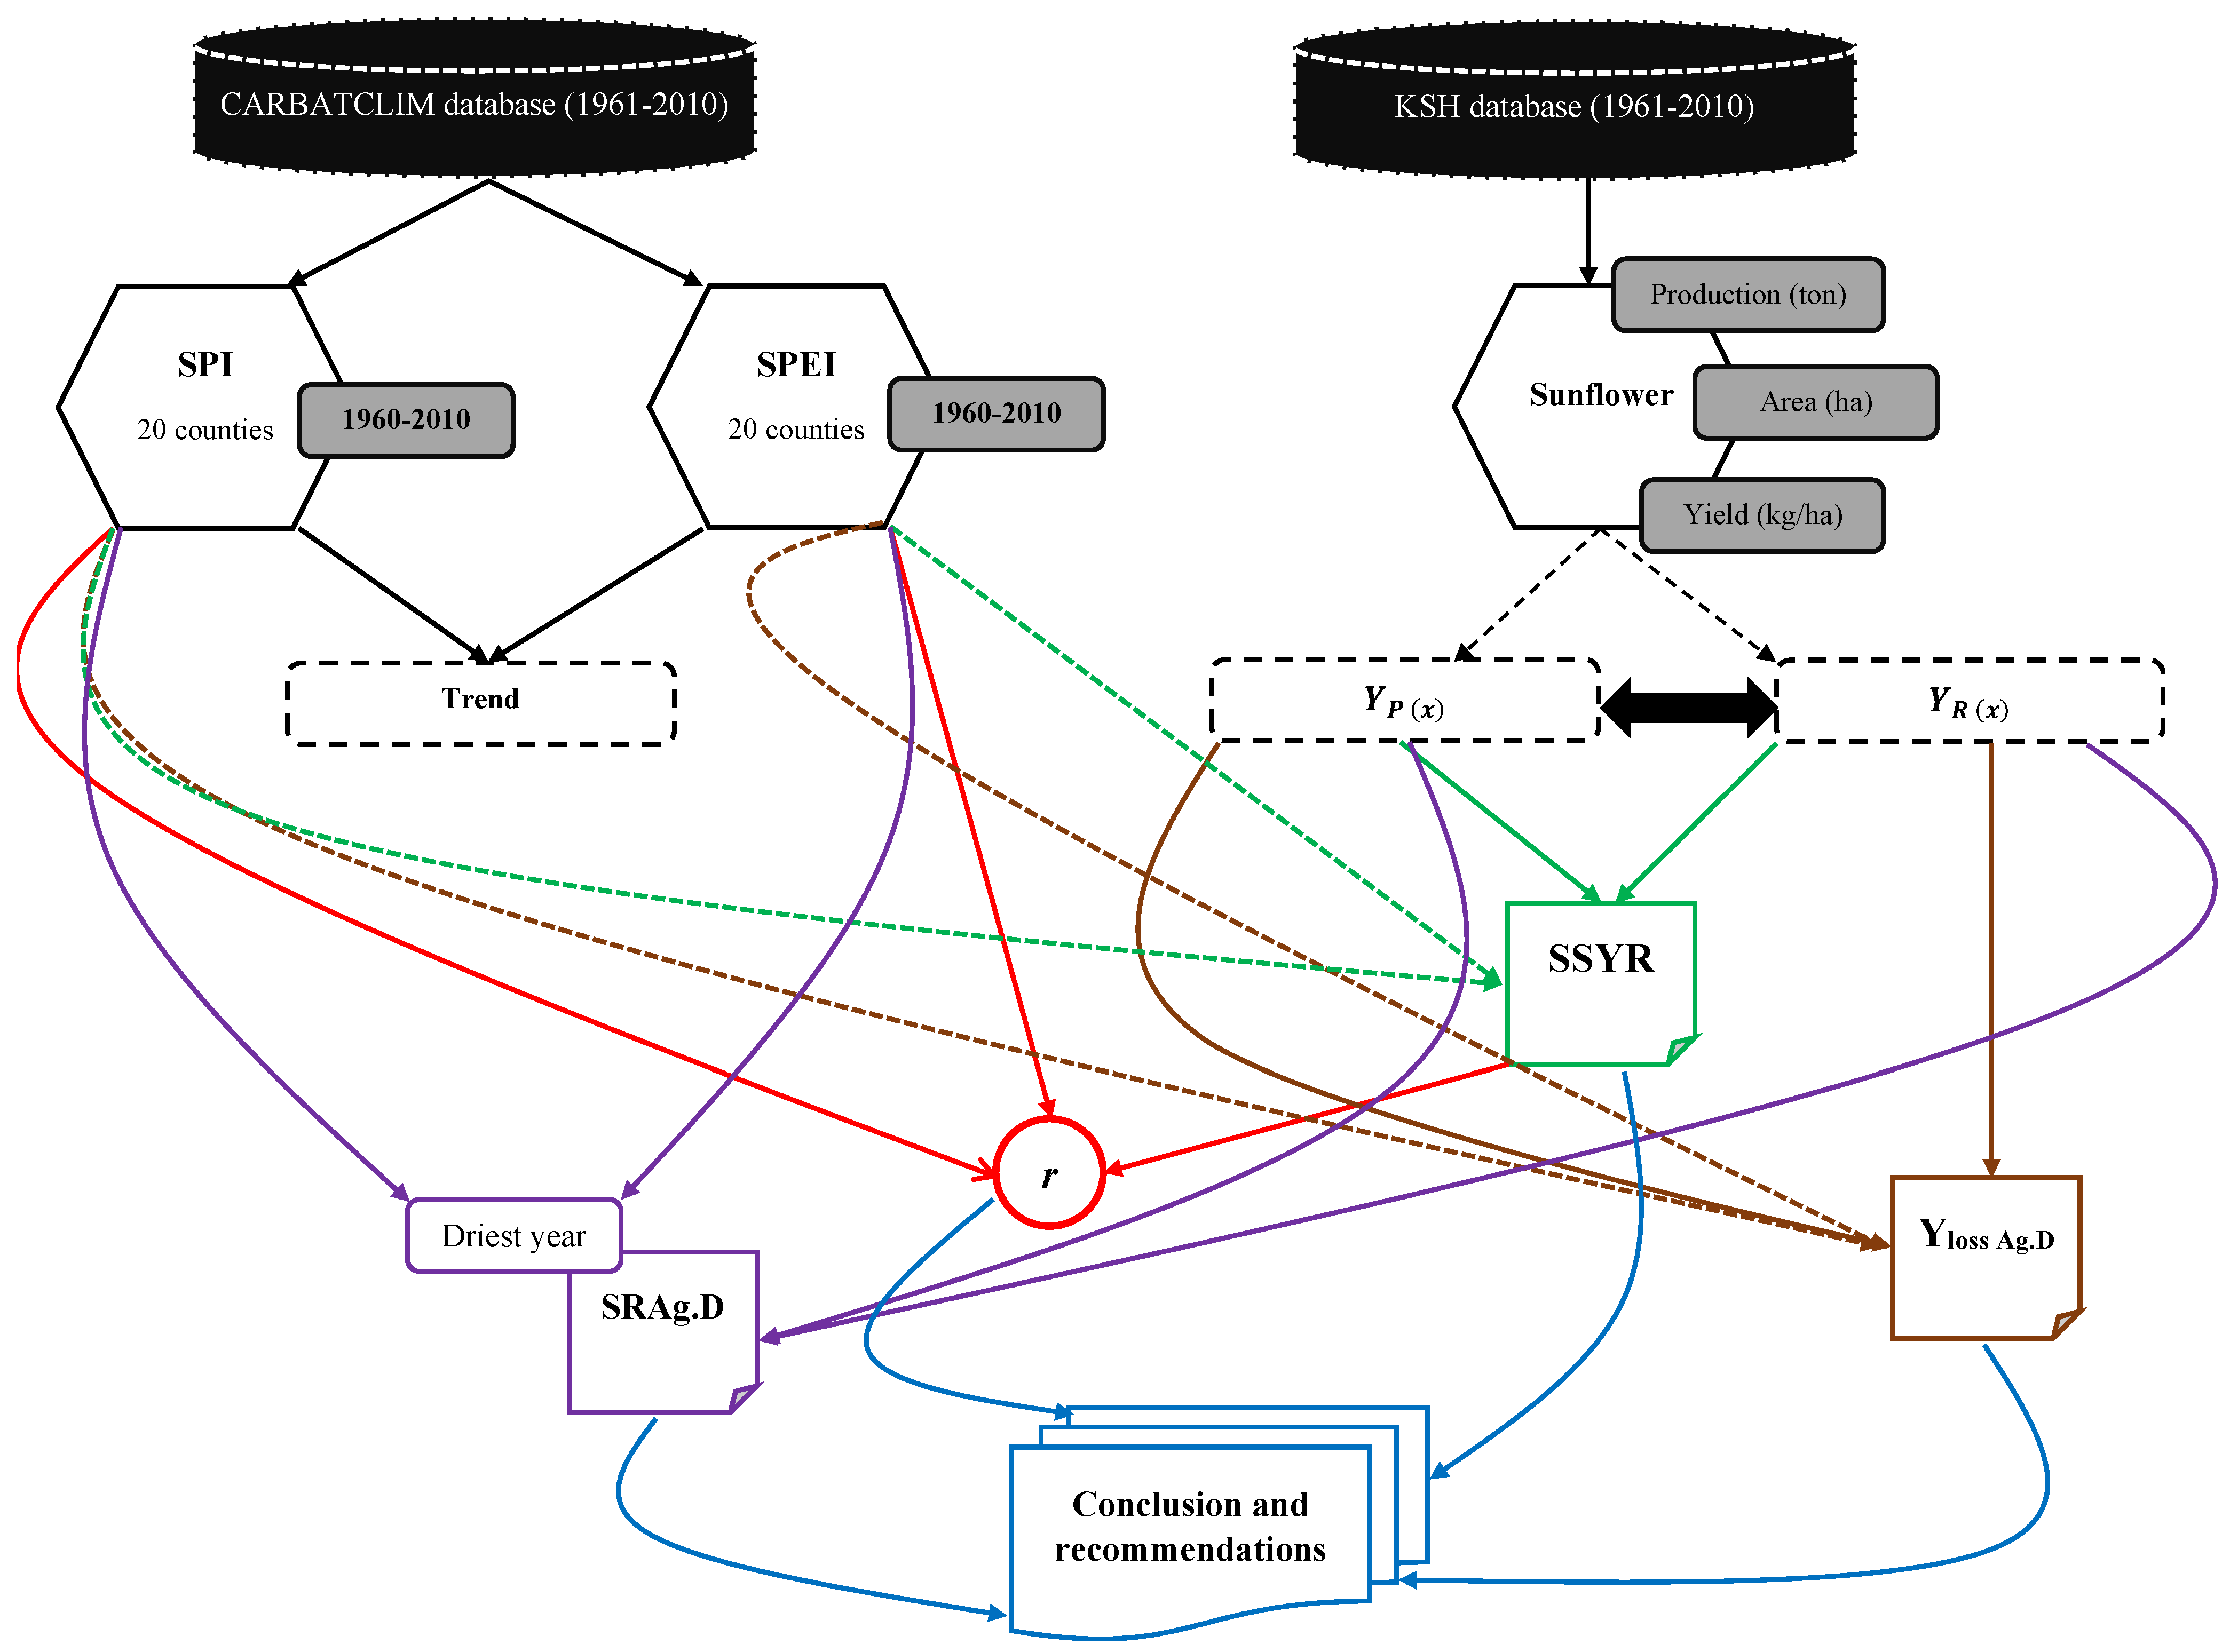
2. Materials and Methods

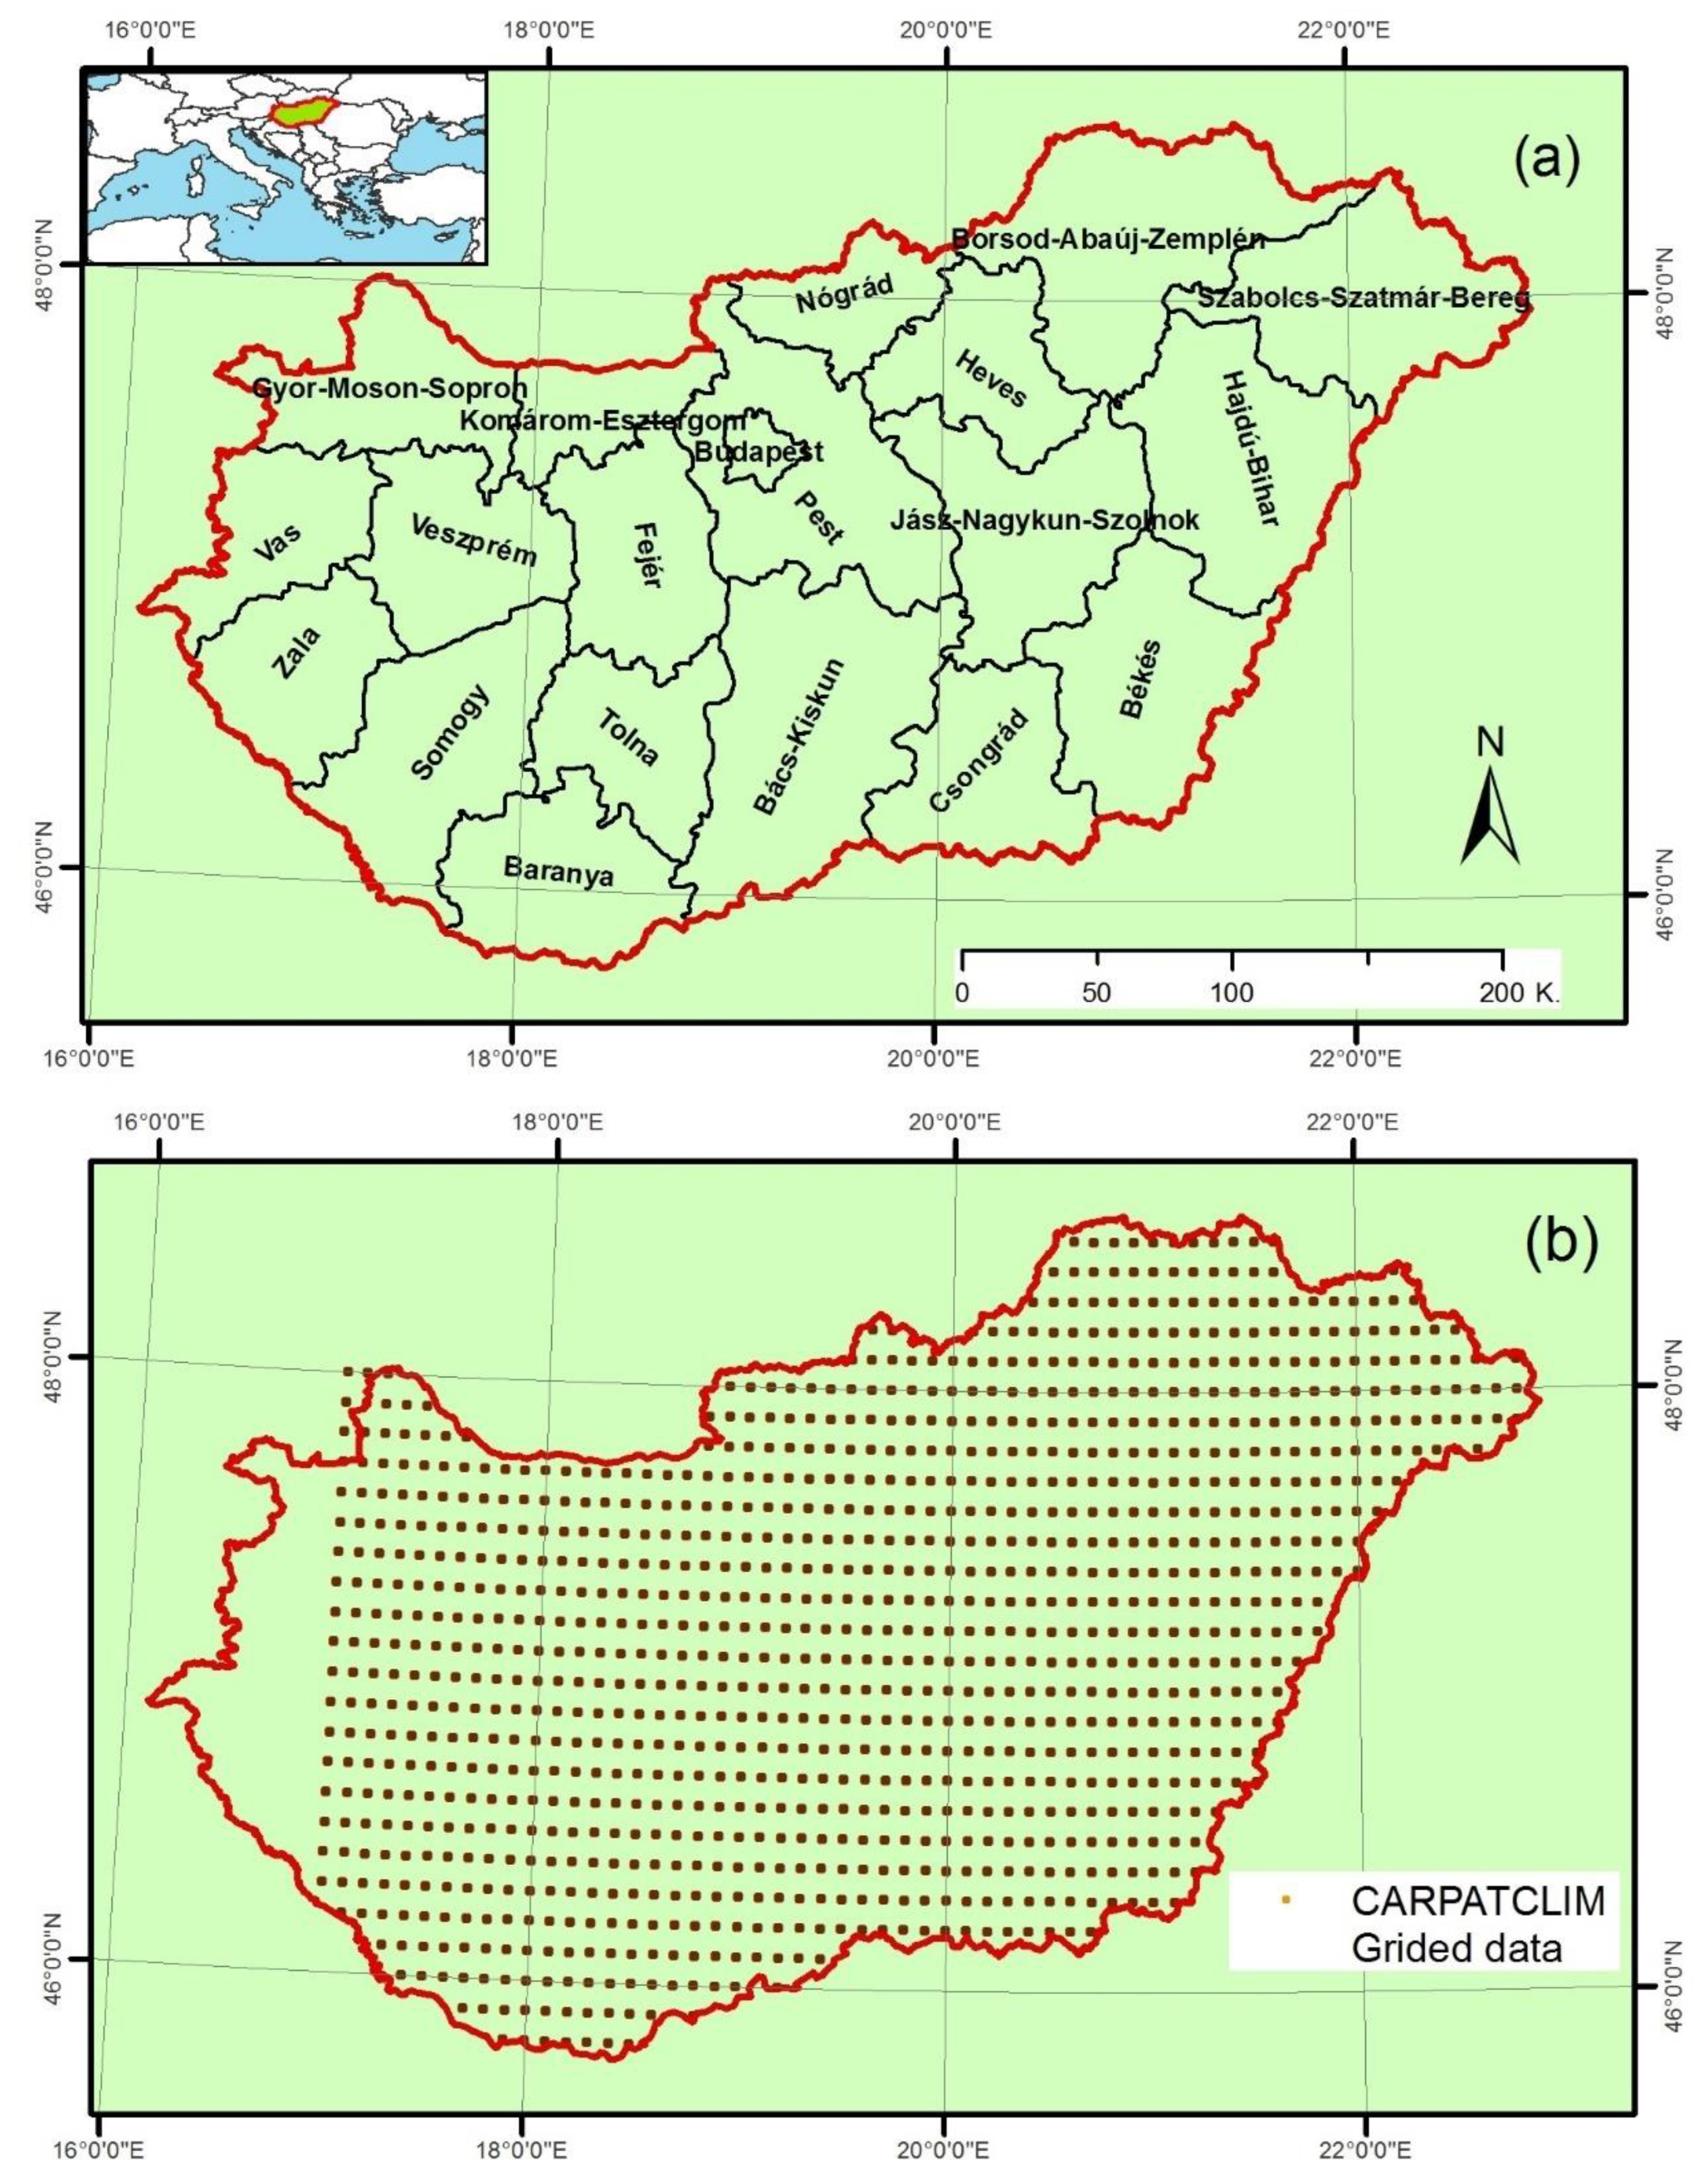
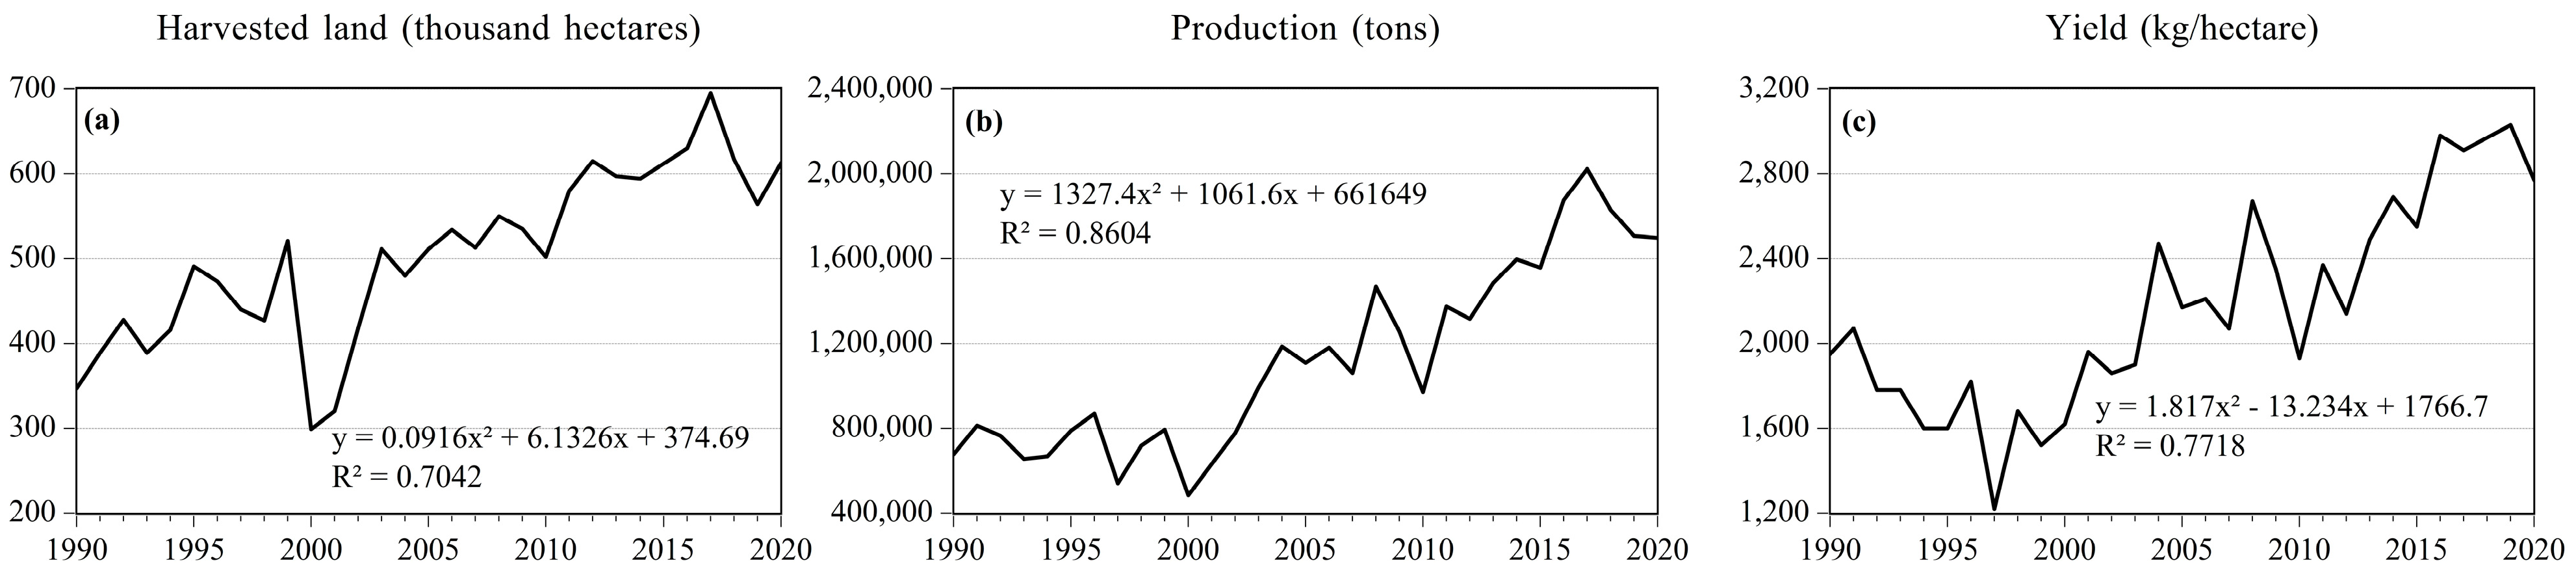
2.1. Data Collection and Trend Analysis

Agricultural drought (Ag.D) data were collected from the CARBATCLIM database [50]. The CARBATCLIM platform provides researchers with necessary climate data between 1960 and 2010 for the whole Carpathian Region (44° N and 50° N, 17° E and 27° E). This project was supported by the European Commission, and the output is a climate atlas with spatial resolution 0.1° × 0.1° [51,52]. Within the CARBATCLIM database, Hungary is covered by 1045 grid points (Figure 1), where each point contains all climate variables. In this study, we downloaded the data for both the Standardized Precipitation Index (SPI) and the Standardized Precipitation Evapotranspiration Index (SPEI) for six months (i.e., SPI-6, SPEI-6), as a proxy of Ag.D. Notably, homogeneity of the data and their quality were assessed by the CARBATCLIM team. Later on, gridded points were sorted into groups according to their Hungarian counties; then, the average of each group was calculated and adopted as a representative value of Ag.D (Figure 1).
The sunflower database was built using information from the Hungarian national statistical center (KSH) (https://www.ksh.hu/stadat_eng accessed on 6 May 2020). This database contains the planted area (ha), production (thousand tons) and yield (kg/ha), at a national scale (1990–2019), as represented in Figure 2. However, to address the specific study goals, available sunflower yield data were collected on a county scale from 2000 to 2019.
For trend analysis, Mann–Kendall (MK) [53] tests were performed and Sen slopes (β) [54] were calculated for the studied variables. Both the MK test and Sen slope (β) are non-parametric tests; MK is used to indicate trends (i.e., increase or decrease) in the studied time series, whereas the Sen slope computes the value of the change (slope).

2.2. Agricultural Drought Indices

To quantify drought characteristics (severity, spatial extent, duration, and frequency), several drought indices could be employed, which mainly depend on the research questions and data availability [55,56,57]. Many ecosystem elements such as rainfall, evapotranspiration, temperature, river discharge, soil moisture, and change in vegetation cover could be used as inputs for modeling and monitoring drought [58,59,60]. Scientifically, the Ag.D indicates a shortage in soil moisture, which inhibits soil from providing necessary amounts of water to attain optimal crop production requirements [56,61]. In this study, the SPI and SPEI in a six-month time scale were adopted as a proxy for Ag.D (1961–2010).

2.2.1. Standardized Precipitation Index (SPI)

The SPI [33] is one of the most common indices used for tracking and monitoring drought episodes [62], and is recommended by the World Meteorological Organization [55,63]. Monthly rainfall data are the only input for calculating drought in several time scales [33]. Through different transformations, from gamma distribution to normal distribution, the final equations for SPI can be drawn as follows:
SPI = ( t 2.515517 + 0.802853 t + 0.010328 t 2 1 + 1.432788 t + 0.189269 t 2 + 0.001308 t 3 ) f o r   0 < H ( x ) 0.5                            
SPI = + ( t 2.515517 + 0.802853 t + 0.010328 t 2 1 + 1.432788 t + 0.189269 t 2 + 0.001308 t 3 )   f o r   0 < H ( x ) < 1                                
where:
H ( x ) = q + ( 1 q ) G ( x )
More details about SPI calculation, (t, q, G ( x ) ), was presented in detail by McKee et al. [33]. Drought classifications according to SPI values are presented in Table 2.

2.2.2. SPEI

The SPEI [34] is a developed indicator from the same background as SPI [52]. Monthly rainfall and potential evapotranspiration are the main inputs for calculating the SPEI [34]. The final equation of SPEI could be drawn as follows:
SPEI = W C 0 + C 1 W + C 2 W 1 + d 1 W + d 2 W 2 + d 3 W 3  
where   W = { 2 l n   ( P )                       w h e n   P 0.5 2 l n   ( 1 P )     w h e n   P > 0.5
The equation constant (C0, C1…); and other mathematical approaches was presented in detail by Vicente-Serrano et al. [34]. Drought classifications according to SPEI values are presented in Table 2.
Despite the fact that both indices have the same background, the SPEI has been proven to be superior to SPI in drought monitoring and climate change assessments [33,52].

2.3. Impact of Agricultural Drought

2.3.1. Sequence of Standardized Yield Residuals ( SSYR )

To address the impact of Ag.D on crop yield, the bias attributed to technological factors (i.e., pest control, fertilization, and high-yield varieties) should be removed. To do so, polynomial regression was calculated for observed yield ( Y R   ( x ) ) on the county scale (2000–2019); then, the data were detrended ( Y P   ( x ) ), and the residuals were calculated (i.e., Y R   ( x ) Y P   ( x ) ). Finally, the SSYR was computed using the following equation [64,65]:
SSYR = Y P   ( x ) P   ( x ) P   ( x )
where Y P   ( x ) is the potential yield (detrended), P   ( x ) is the mean of Y P   ( x ) , and P   ( x ) is the standard deviation Y P   ( x ) . The classifications of SSYR values are presented in Table 3. Additionally, the correlation coefficients (r) between SSYR and both the SPI and SPEI were calculated (2000–2010) on a monthly scale.

2.3.2. Yield Losses, Yloss Ag.D

The direct impacts of Ag.D on sunflower production and yield losses across the Hungarian counties were calculated using the approach suggested by Tigkas et al. [66]:
Y lossAg . D   ( x ) = Y R   ( x ) Y P   ( x ) Y P   ( x ) × 100
where Y l o s s A g . D   ( x ) is the yield loss due to agricultural drought, Y R   ( x ) is the recorded yield (observed), Y P   ( x ) is the potential yield (detrended), and x is the year. Y P   ( x ) refers to the development of crop production without any environmental constraints such as water shortages, heat waves, or other environmental factors [66].

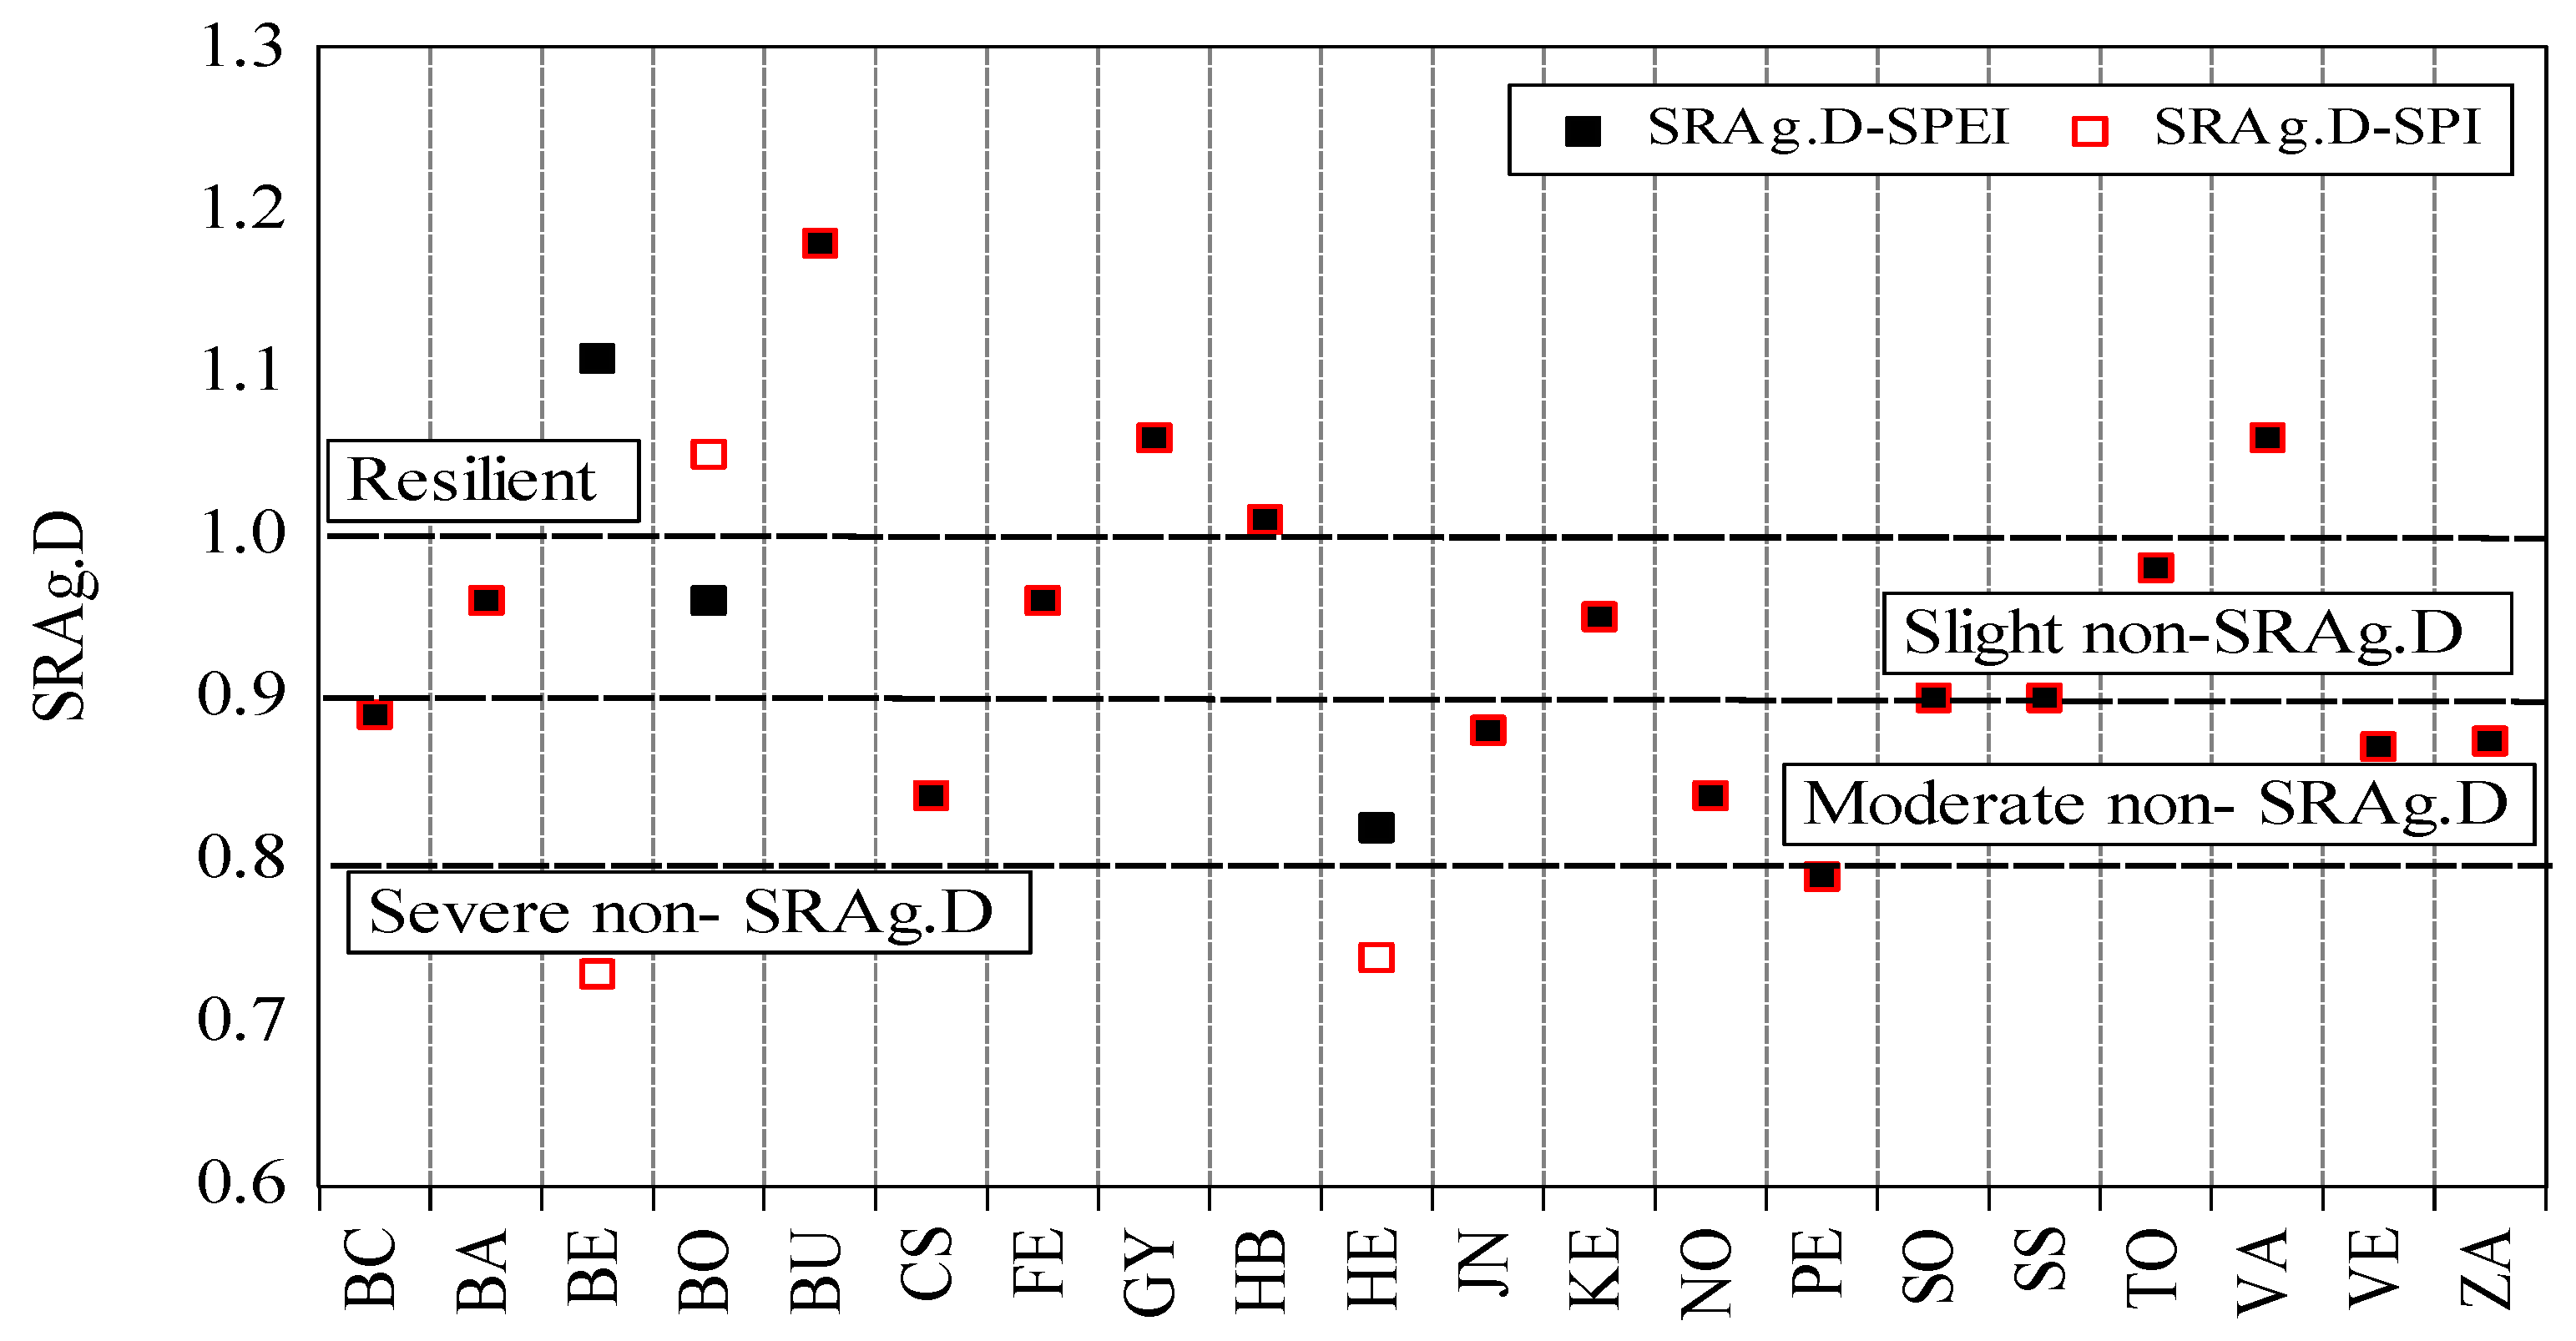
2.3.3. Sunflower Resilience to Ag.D (SRAg.D):

The SRAg.D was calculated for each county in Hungary using the equation suggested by Sharma and Goyal [67]:
SRAg . D x = Y R   ( x ) d Y P   ( x ) d                                        
where SRAg . D x is the sunflower resilience to Ag.D in each county, Y R   ( x ) d is the recorded yield in the driest year (2000–2010), and Y P   ( x ) d is the potential yield. The SRAg.D ranged from >1 (resilient) to <0.8 (severely non-resilient). The classification of SRAg.D values are presented in Table 4.
For simplification, Figure 3 depicts a flowchart of the study steps.

3. Results

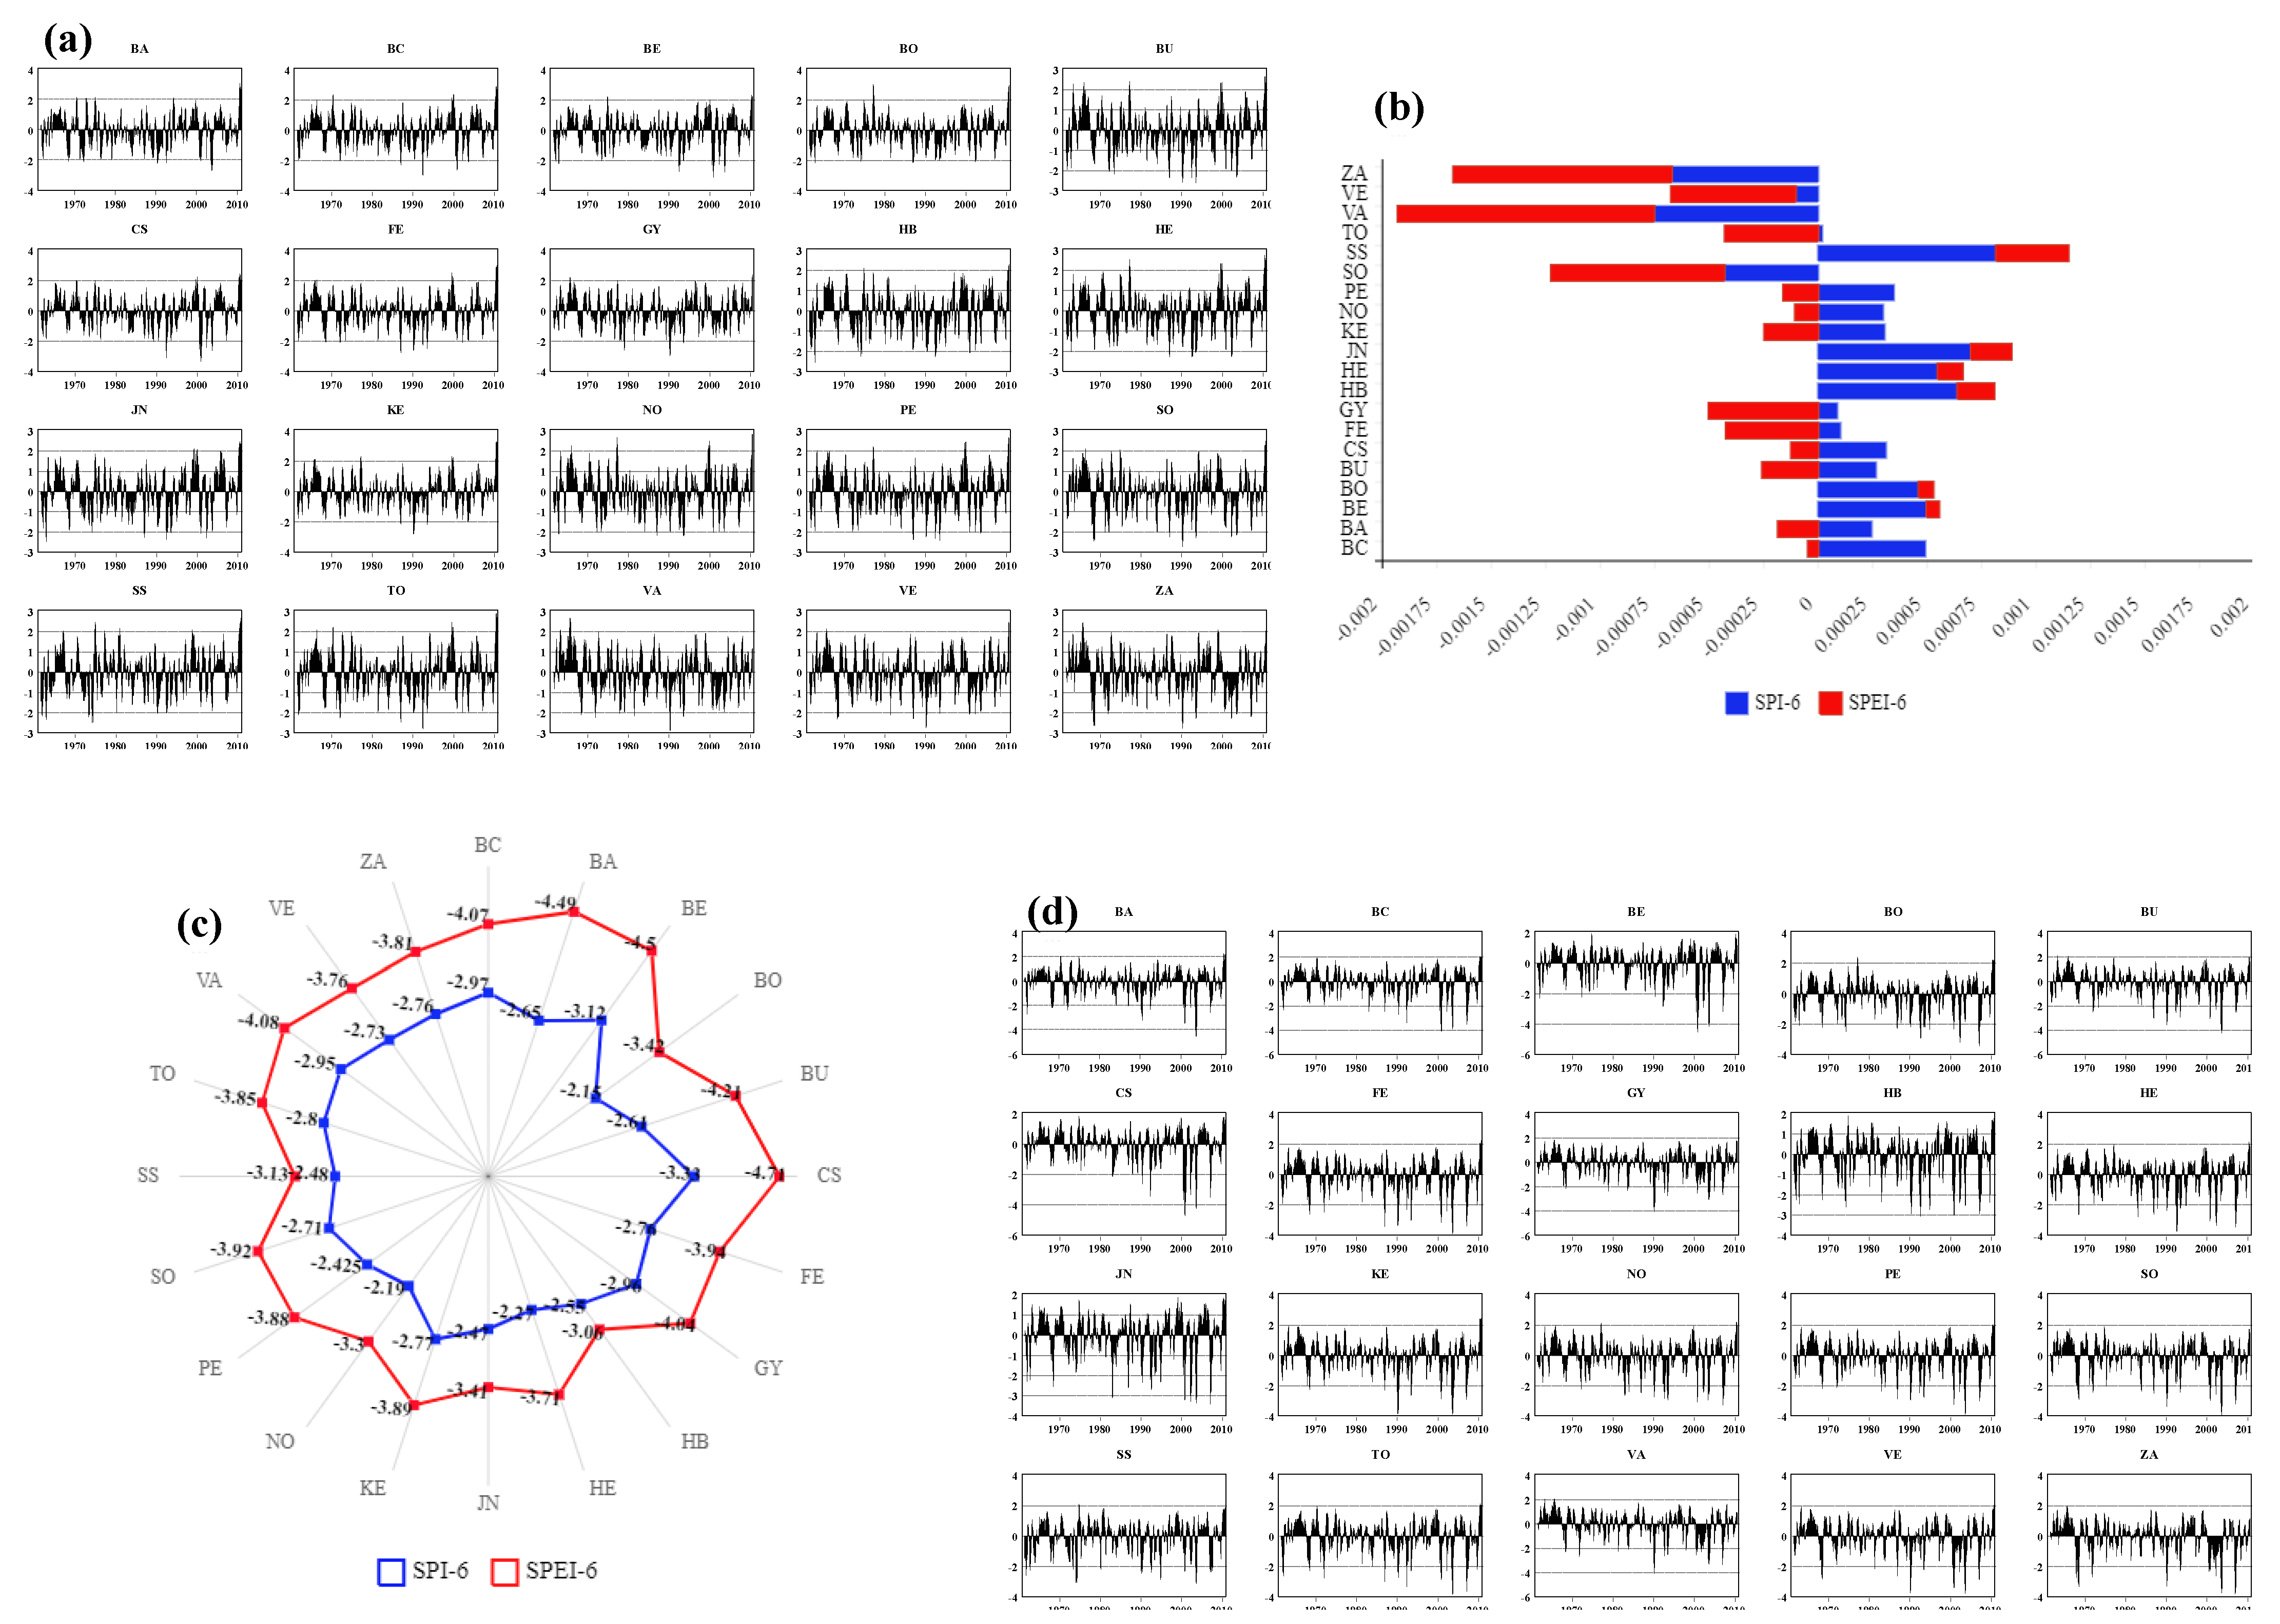
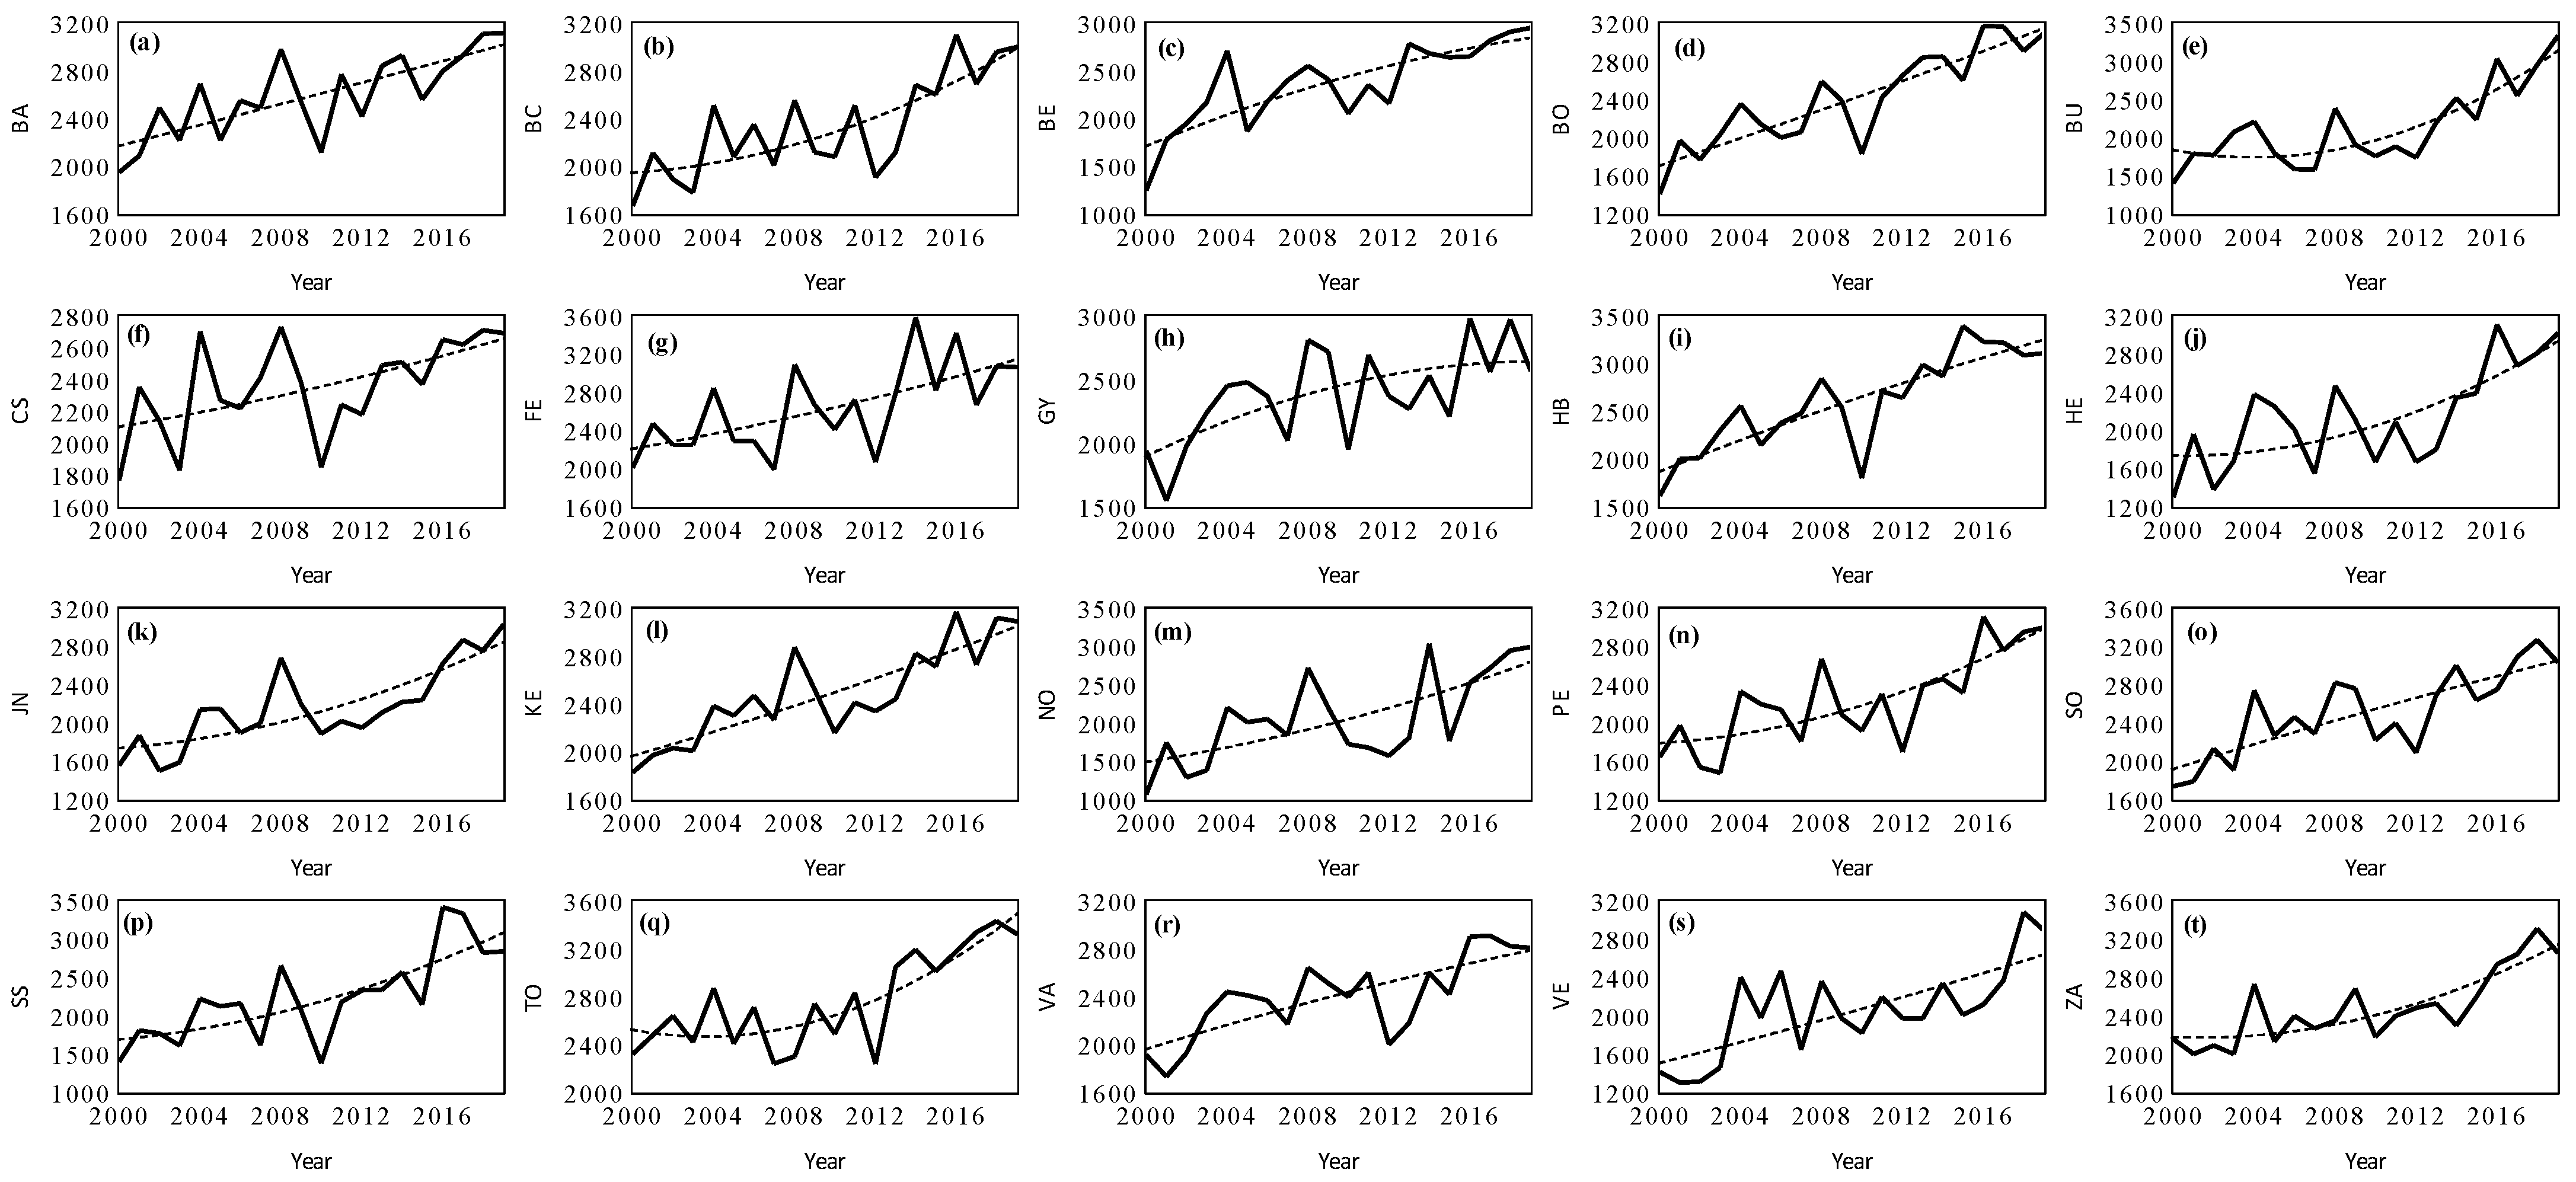
3.1. Trend in Ag.D across Hungarian Counties:

Hungary experienced Ag.D cycles several times, as can be seen in Figure 4. Figure 4a,d demonstrate that Ag.D episodes were more intense in western and central Hungary (i.e., ZA, VE, VA, and GY) compared with the eastern region of the country (i.e., HB, HE, JN, and SS). Notably, Ag.D cycles have become more frequent since 1990, when more negative values were recorded (Figure 4a,d).
Trend analyses by MK test and Sen slope also indicate that western Hungarian counties are more prone to Ag.D compared with other country regions (Table 5). In terms of SPI-6 (1960–2010), the majority of the counties (14 out of 20) exhibited a positive trend, which indicate less susceptibility to Ag.D. In fact, only four counties, HB, HE, JN, and SS, which are located in eastern Hungary, exhibited a significantly positive trend (p < 0.05) (Table 5).
For SPEI, most of counties exhibited a negative trend for SPEI-6 (1960–2010), except for HB, HE, JN, and SS. Nonetheless, significantly negative (p < 0.05) trends in SPEI-6 (1960–2010) were recorded in GY, SO, VA, VE, and ZA (western regions) (Table 5). Notably, both drought indices agreed on negative trends in each of the following counties: GY, SO, TO, VA, VE, and ZA, as shown in Figure 4b.
Despite the differences in identifying drought events between SPI-6 and SPEI-6 due to different inputs and mathematical equations, both indices highlighted the following years: 1962, 1968, 1972, 1983, 1986, 1990, 1992–1993, 2000–2003, and 2007 as drastic periods (SPI-6 and SPEI-6 values of less than −1.28) in terms of Ag.D (Figure 4a,d).
The lowest recorded values of SPI-6 and SPEI-6 (i.e., the highest recorded levels of drought) in each county are presented in Figure 4c. For SPI-6, the lowest values were recorded in CS (−3.33), GY (−2.96), VA (−2.95), and TO (−2.8). Unexpectedly, the lowest values of SPEI-6 were recorded in central and southern counties. For instance, the lowest value of SPEI-6 was recorded in Csongrád-Csanád (CS) (−4.71), which is located in southern Hungary, followed by BU (−4.21) (central), then GY (−4.04) (western) (Figure 4c).
As depicted in Figure 4c, the SPEI-6 (red line) represents higher Ag.D values than the SPI-6 (blue line); this can mainly be explained by the fact that the SPEI-6 employs both evapotranspiration and rainfall for drought computation, whereas the SPI-6 depends only on the monthly changes in rainfall. Notably, the conjunction of evapotranspiration and rainfall inflated the drought values in the study area.

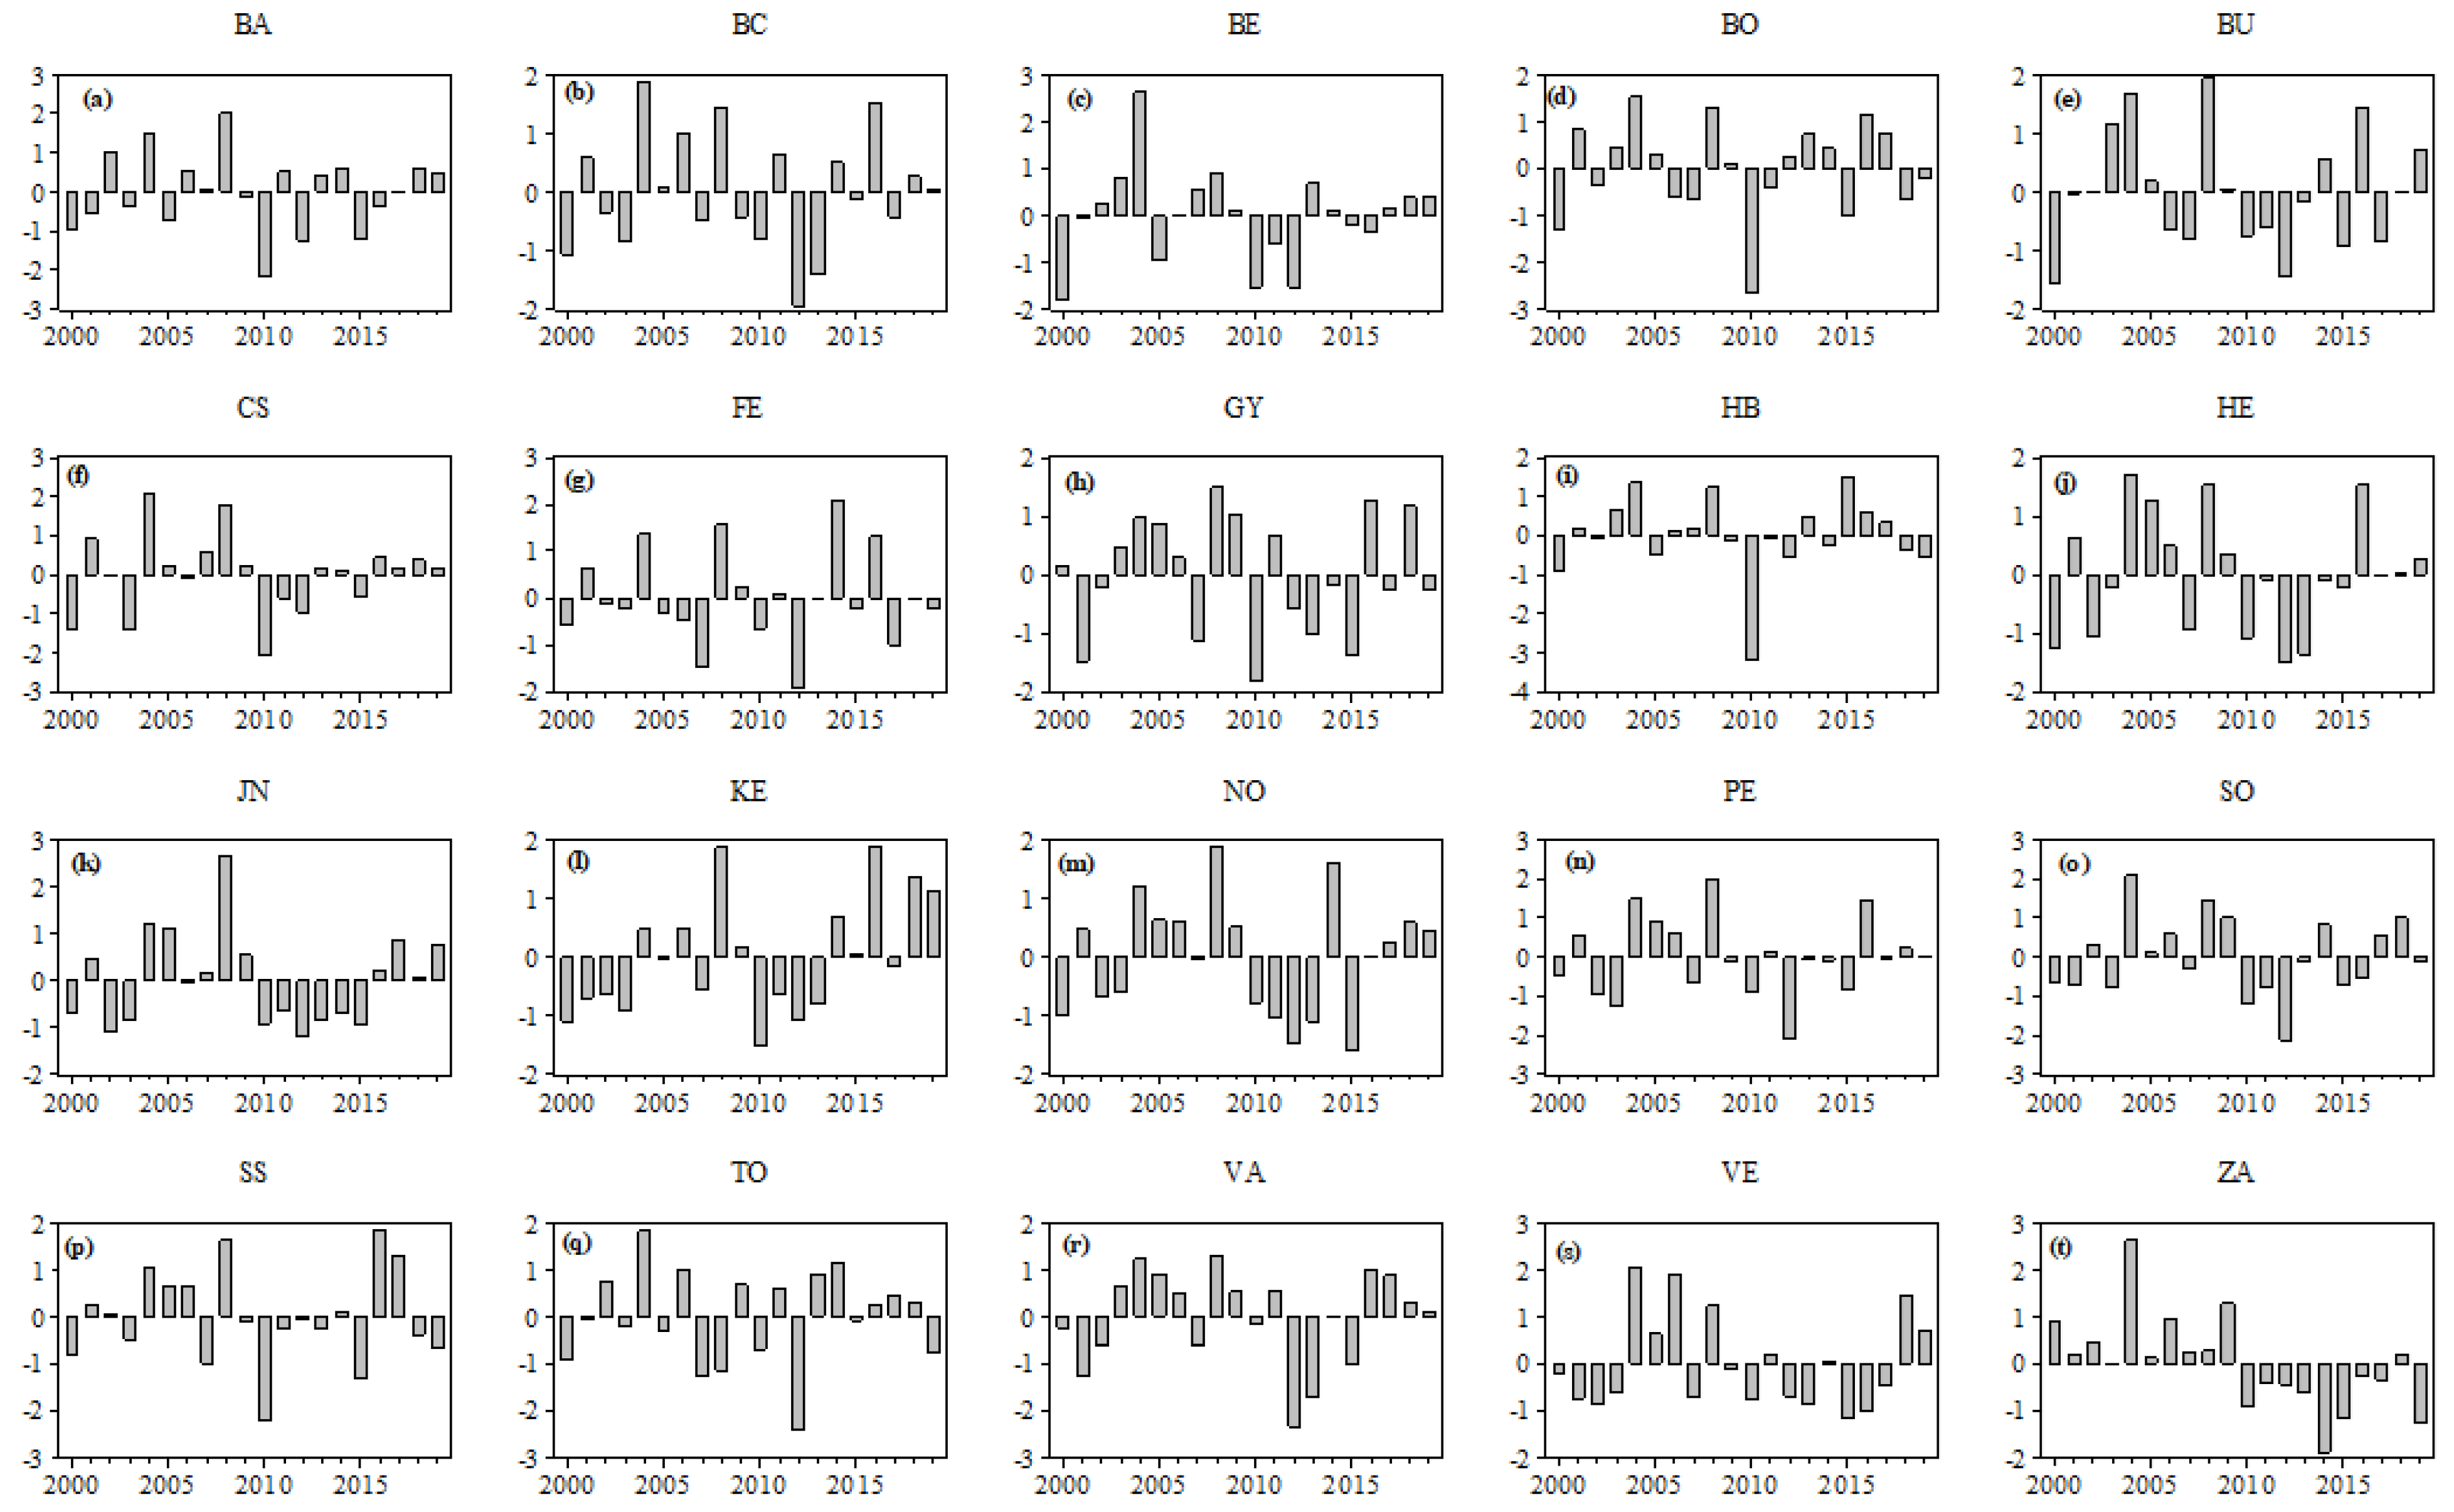
3.2. Sequence of Standardized Yield Residuals ( SSYR )

According to the MK tests and Sen slopes, sunflower yield (kg/ha) exhibited a positive trend across Hungarian counties between 2000 and 2019 (Table 5, Figure 5). The greatest increase in sunflower yield was observed in BO (+75.19 kg/ha, p < 0.05), followed by SS (+72.58 kg/ha, p < 0.05), then HB (+71.6 kg/ha, p < 0.05). Notably, these counties are located in eastern Hungary, and experienced positive but non-significant trends for both SPI-6 and SPEI-6 (Table 5, Figure 5).
Thus, to isolate the positive impact of human intervention which include, but are not limited to, the selection of new varieties, pest control, advance field irrigation technology, and precision agriculture, the sequence of standardized yield residuals (SSYRs) was applied.
The output of the SSYR analysis highlighted the yeEars 2000, 2010, and 2012 as the years most affected by Ag.D ( SSYR ≤ −1) in terms of sunflower production, as shown in Figure 6. The lowest SSYR was recorded in HB (−3.2, extreme impact in 2010), followed by TO (−2.41, extreme impact in 2012), and VA (−2.34, extreme impact in 2010) (Figure 6).
During the growing cycle (April–October), a high correlation between SSYR and Ag.D was observed, especially in summer seasons (Figure 7 and Figure 8). For SPI-6, the highest correlation (Max. r SSYR vs. SPI-6) was recorded in VA (r SSYR vs. SPI-6 = 0.6, July, western Hungary) and BC (r SSYR vs. SPI-6 = 0.55, August, central Hungary) (Figure 7). Similarly, central and western counties exhibited the highest r values between SSYR and SPEI-6. For instance, the Max. r SSYR vs. SPEI-6 was obtained in PE (r SSYR vs. SPEI-6 = 0.63, July, central Hungary), BC (r SSYR vs. SPEI-6 = 0.59, July, central Hungary), and VE (r SSYR vs. SPEI-6 = 0.51, July, western Hungary) (Figure 8). However, both Ag.D indices indicate that drought cycles affected the sunflower yield during the summer months, where the western counties were classified as the most affected by drought.

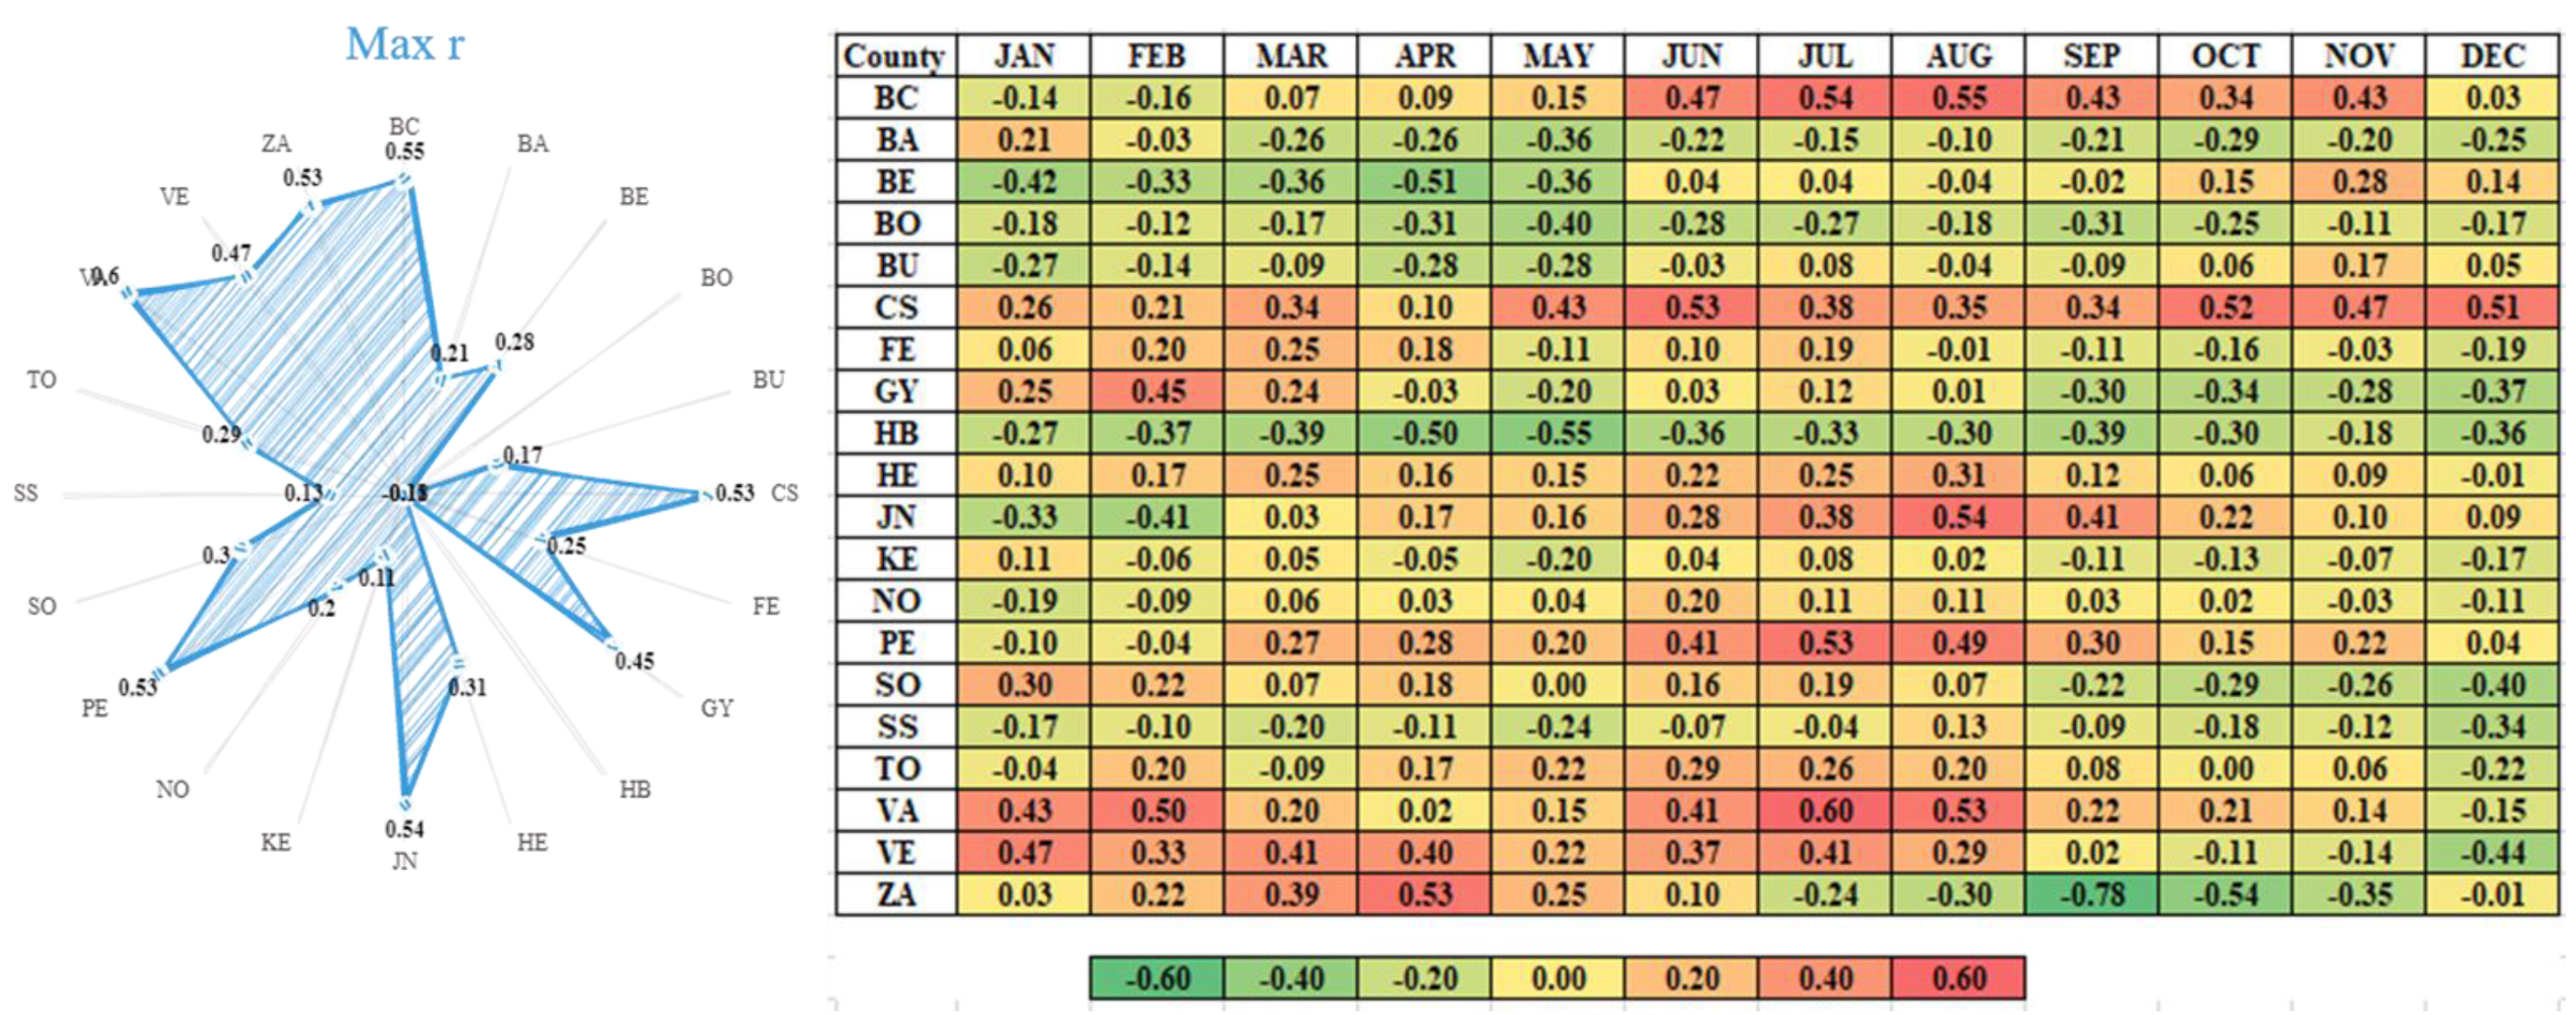
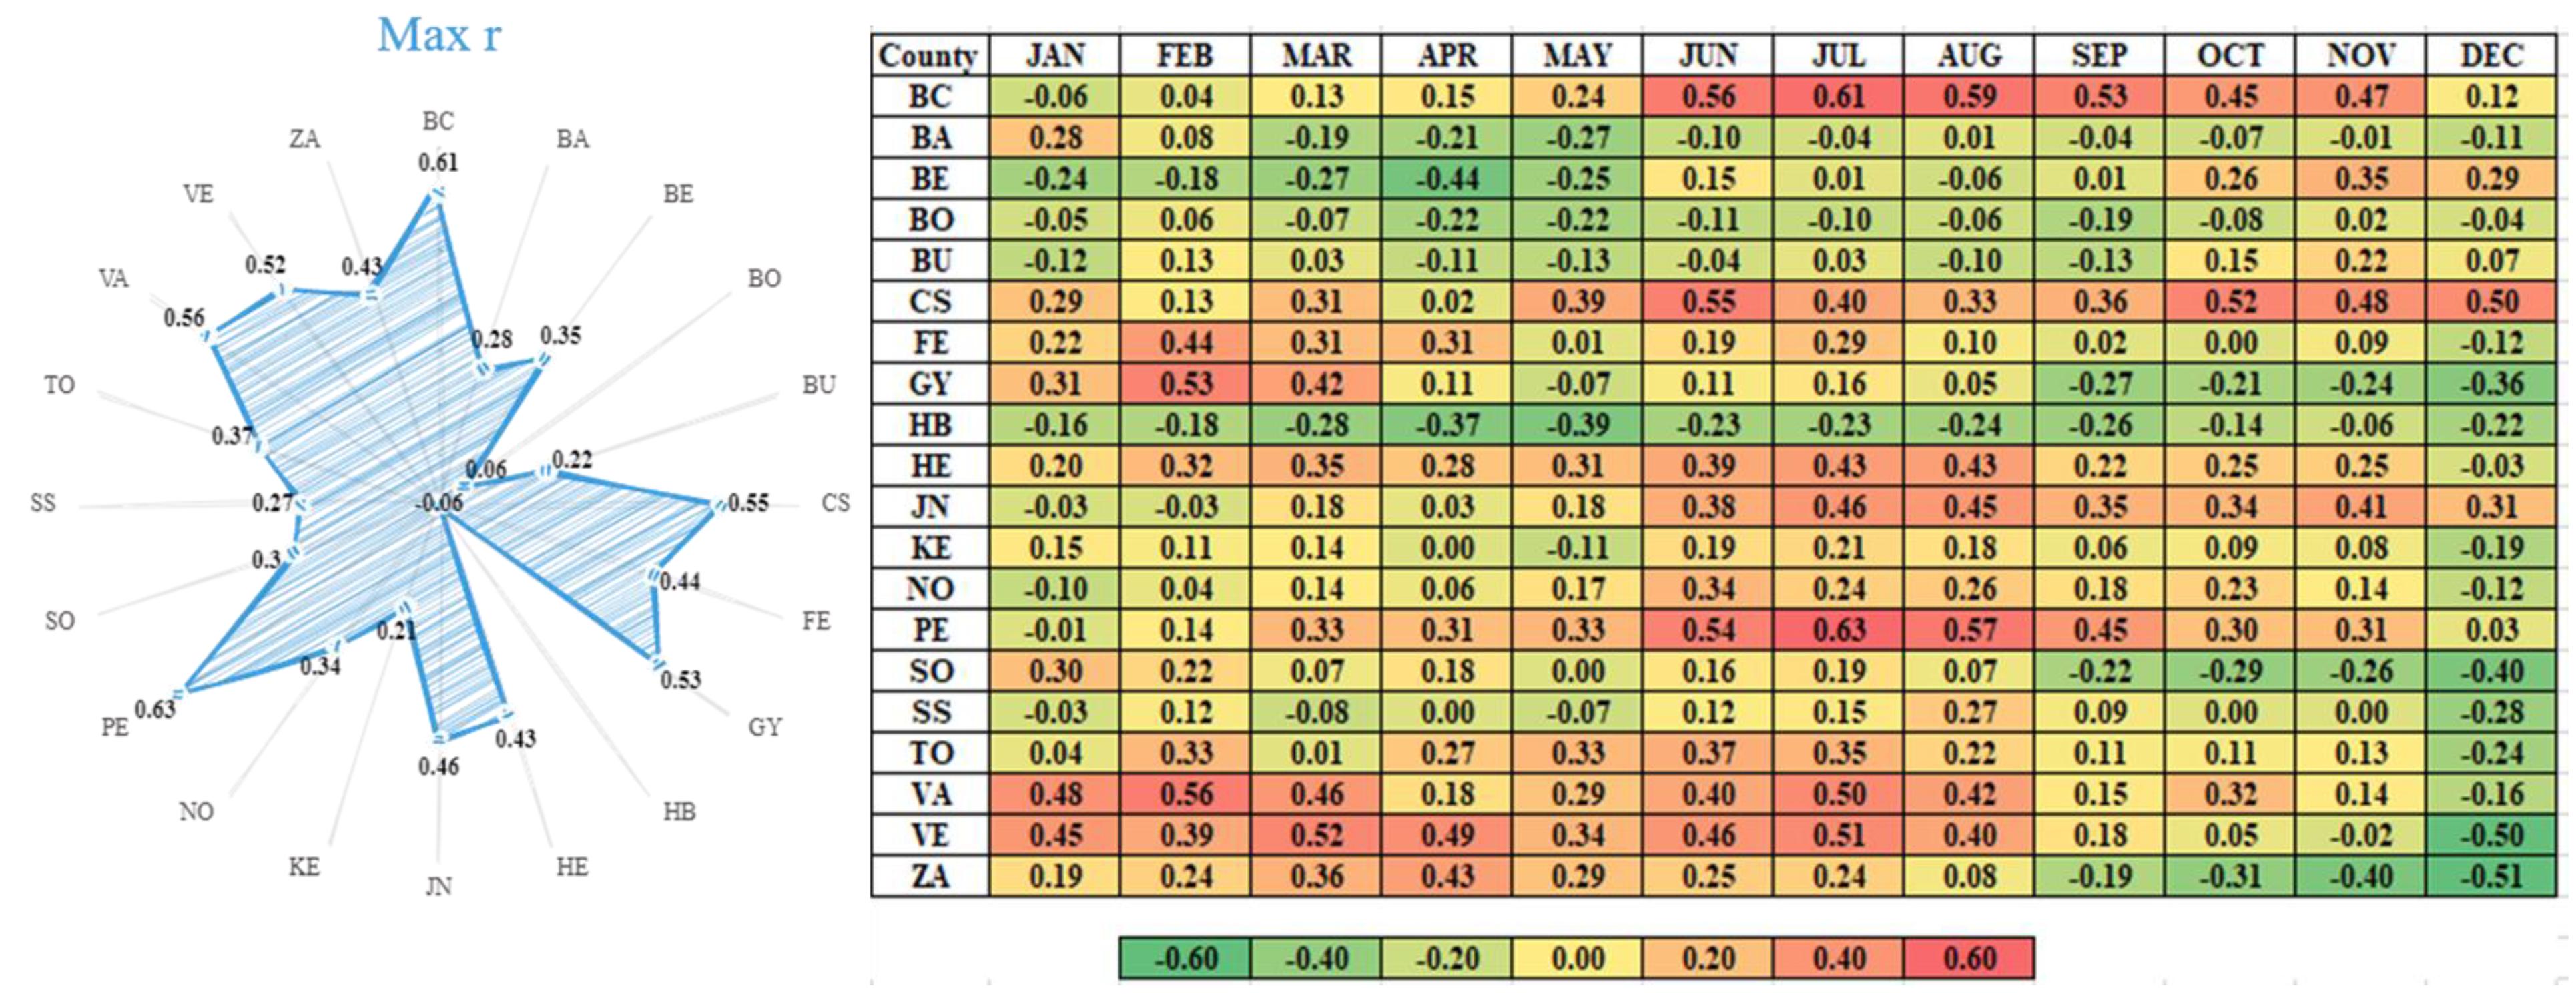
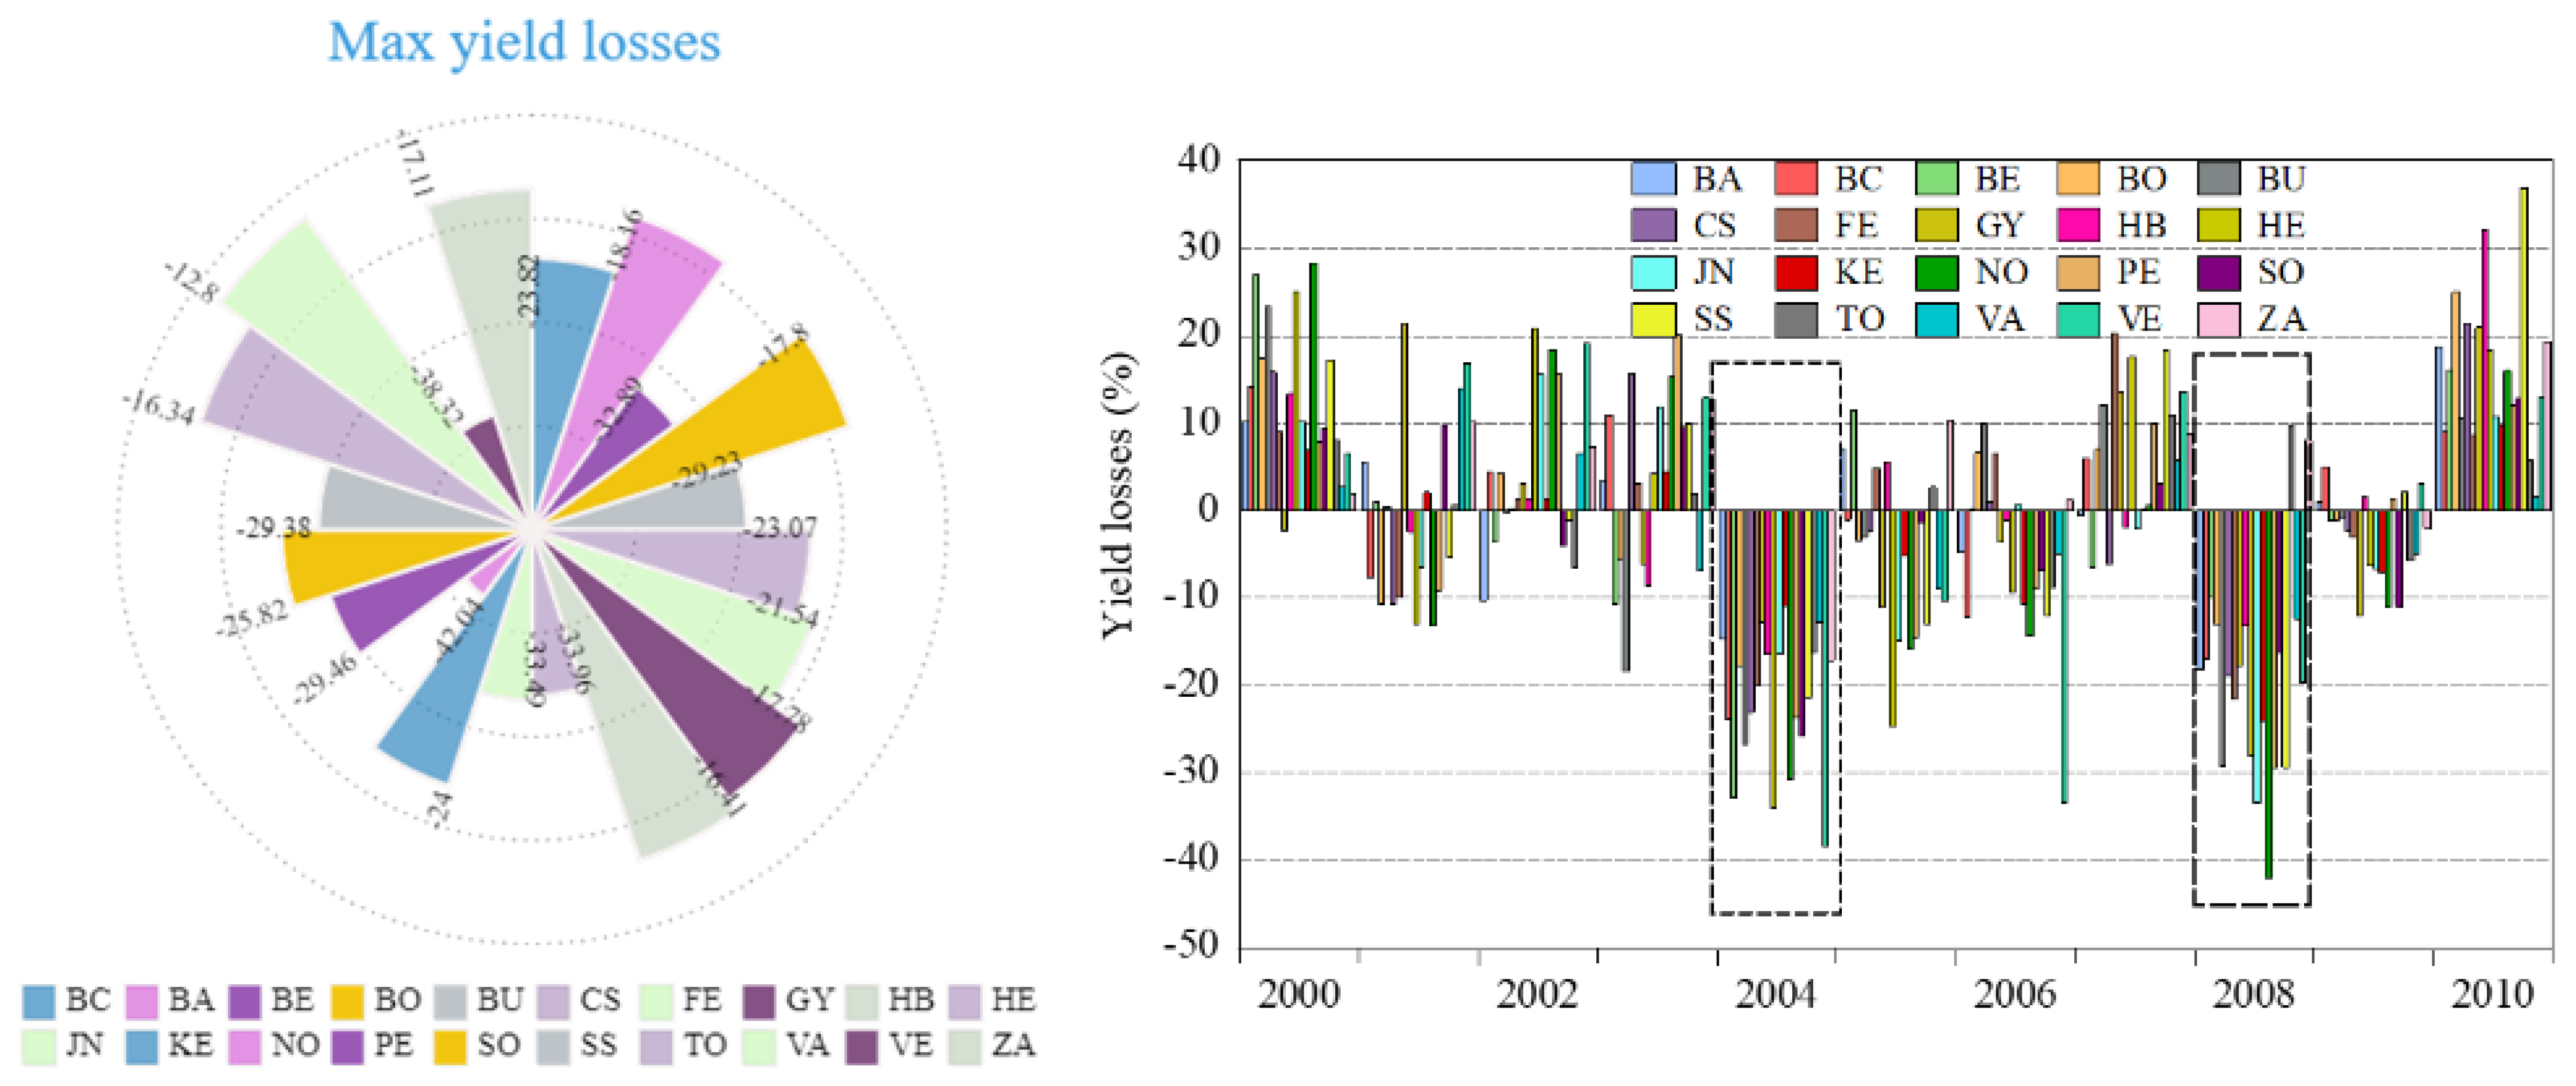
3.3. Yield Losses Yloss Ag.D

Between 2000 and 2010, the loss of sunflower yield was distinguished in two different years, as depicted in Figure 9. In 2004, the highest Yloss Ag.D was recorded in VE (Yloss Ag.D = −38.32%, western Hungary), followed by HE (Yloss Ag.D = −33.95%, eastern Hungary) and then BE (Yloss Ag.D = −32.89%, central Hungary) (Figure 9). However, in 2008, all counties across Hungary experienced yield losses, where the highest losses were observed in NO (Yloss Ag.D = −42.03%, northern Hungary), JN (Yloss Ag.D = −33.49%, central Hungary), and SS (Yloss Ag.D = −29.37%, eastern Hungary).
By calculating the SRAg.D, the resistance of sunflower crops to drought events could be distinguished across Hungarian counties (Figure 10). The results showed that the crop yields in central and western regions were more prone to loss due to drought events. The SRAg.D value reached 0.74 (severely non-SRAg.D) in HE, and 0.79 (also severely non-SRAg.D) in PE. In contrast, the highest value was recorded in eastern Hungary (BE; 1.11).

4. Discussion

In the last few decades, drought cycles have become more intense and frequent all over the world due to rapid climate change [9,68,69,70]; for instance, in Brazil [71], Syria [63], Hungary [52], China [72], and southern Europe [73]. Subsequently, many industries have been affected either directly or indirectly, such as the agricultural sector [74,75,76,77,78,79], hydrology [80,81,82,83], the economy [76,84], human health [85,86,87], and tourism [88,89,90]. In this sense, our research shows a negative trend in agricultural drought episodes across Hungarian counties (Figure 4; Table 5). Additionally, the results emphasize the direct impact of Ag.D on sunflower production (Figure 6), where the yield losses reached 40% in some counties (Figure 9).
Many studies have been carried out across Europe for monitoring and assessing drought evolution, identifying a positive trend, especially in southern and central regions [73,91,92,93]. Hungary, which is in the center of the Pannonian basin (central Europe), suffers from drought episodes. For instance, Alsafadi et al. [52] reported an increase in drought trends in western Hungary comparing with the east; however, drought frequency was more intense in central Hungary. Mohammed et al. [49] indicated a positive strong correlation between Ag.D (SPI-3, SPI-6) and NDVI (Normalized Difference Vegetation Index). However, future climate projections indicate an increase in drought cycles due to changing future rainfall patterns (2071–2100) [45]. At the regional scale (county scale), drought evolution has been more intense in central and western Hungary than the east. Similar results were reported by Szabó et al. [94], where western Hungary was identified as being more susceptible to climate change. This issue could be explained by the fact that the central region receives less rainfall than other areas [52]; thus, the SPI and SPEI values are decreased, which directly lead to the evolution of drought. In this case, soil moisture will be decreased, and less water will be available for use on agricultural crops (i.e., sunflowers), which will lead to water stress and yield losses (Figure 6, Figure 9 and Figure 10) due to the inhibition of physiological functioning in some crops [69]. Interestingly, this phenomenon could affect all crops, especially maize, which is very sensitive [79]. In this sense, Adrienn and Janos [95] reported that agricultural drought is the main constraint for crop production across Hungary.
Both SPI and SPEI have drawbacks, which generates some uncertainty in the results. For SPI, using only monthly rainfall data without considering their temporal distribution could affect the interpretation of results, along with failure in predicting the exact times of the drought evolution cycle (i.e., start and end) [34,96]. For SPEI, heat waves can be misinterpreted as droughts in some areas [97]. Additionally, calculating evapotranspiration based only on temperature is not sufficient [98]. However, both indices are widely used all over the world, and their outputs can be used for monitoring drought [72,99,100,101].
The interaction between crop yield and drought indices during the growing cycle (April–October) could be linked to increasing crop evapotranspiration (crop-ET0) and temperature. In this sense, Stagge et al. [73] reported an increase in crop-ET0 and temperature. However, the resistance of sunflower to drought was tracked across Hungarian counties. The results also showed that crop yield in central and eastern Hungary was less resilient to drought, where the SRAg.D value reached 0.74 (severely non-SRAg.D) in Heves and 0.79 (severely non-SRAg.D) in Pest. However, the highest value was recorded in eastern Hungary (Bekes, 1.11). In fact, climate change has affected crop production for both irrigated and rainfed agricultural systems, where drought has significantly reduced crop yield [79,102,103]. Globally, temperature and rainfall directly influence crop production, where they behave nonlinearly [103,104,105,106]. Thus, any changes in these climate variables or even the interaction between them will affect agricultural production, not only for sunflowers, but for all crop types. Shortage of rainfall is linked to abnormal atmospheric circulation (at high pressure) that prevents clouds and precipitation from forming [68,107], or a change in the rain belt [68]. However, less cloud and precipitation lead to drier conditions, increased temperature, decreased humidity, and increased evapotranspiration demand, which amplify drought conditions [68]. Scientifically, drought causes a shortage in soil water content and leads to a water deficit which directly affects crop yields [65,79,108]. Unfortunately, most agricultural land across Hungary is cultivated as a rainfed agricultural system; thus, climate change (precipitation patterns), and especially drought, will negatively affect the agricultural sector and crop production [49].
There were some limitations to this study, such as drought trends being assessed based on the average of gridded point data that represent each county, instead of using the whole gridded points. Additionally, only 10 years were available as a record of sunflower yield across Hungarian counties, which used to calculate the direct impact of Ag.D on sunflower yields; more years would have been better for interpreting the relationship between drought and crop production. On the other hand, both SPI and SPEI have their own limitations in identifying drought cycles. In this context, for calculating drought by using SPI, we only need monthly rainfall data; other climate variables are neglected, which could affect the credibility of the SPI [52]. Even though SPEI involves more climate variables (rainfall and potential evapotranspiration (PET)), and is based on the Thorn Thwaite equation, other climate variables are not considered [52]. However, the output from our analysis is enough to draw the attention of decision makers to the evolution of drought and climate change in central Europe.

5. Conclusions

Drought is a multifaceted and complicated natural hazard, which slowly evolves in the ecosystem and is affected by a multitude of physical and biological factors. Hungary, which is located in central Europe (Pannonian basin), frequently suffers from drought events and climate change. However, little research has been conducted in Hungary to assess the impacts of climate change on crop production, especially on a regional scale. In this context, this study was designed to track the evolution of agricultural drought (SPI-6, SPEI-6) across Hungary (1960–2010), and to investigate the dynamic interactions between sunflower yield and drought cycles. The results showed that agricultural drought episodes were more intense in western and central Hungary (i.e., ZA, VE, VA, and GY) compared with the eastern region of the country. Nonetheless, the Ag.D cycles had become more frequent since 1990, where more negative values of Ag.D were recorded.
Sunflower production was badly affected by agricultural drought in 2000, 2010, and 2012, where SSYR ≤ −1. The lowest SSYR values were recorded in HB (−3.2, extreme impact in 2010), followed by TO (−2.41, extreme impact in 2012), and VA (−2.34, extreme impact in 2010). Notably, yield losses (Yloss Ag.D) were experienced in all Hungarian counties in 2004 and 2008 due to agricultural drought. The results also reveal that crop yield in central and western Hungary were more prone to yield loss due to drought events.
The outputs of this study will be of great interest to stakeholders and decision makers for formulating climate mitigation and adaptation plans for the agricultural sector in Hungary. However, more research to develop new varieties of sunflowers, which are tolerant to drought and other extreme climate events, is highly recommended. In our future research, we will involve other drought indices such as the Crop Moisture Index and Crop Specific Drought Index to highlight the impacts of drought on sunflowers and other strategic crops in Hungary.

Author Contributions

Conceptualization, S.M.; Data curation, A.S.; Formal analysis, K.A.; Funding acquisition, B.B. and A.A.; Investigation, S.M.; Methodology, K.A. and S.M.; Supervision, E.H.; Visualization, S.M.; Writing—original draft preparation, F.A.; Writing—review and editing, E.H., B.B., A.A., A.S., M.H.u.R., I.B., C.J., T.R., and S.M. All authors have read and agreed to the published version of the manuscript.

Funding

This research was supported by RESEARCHERS SUPPORTING PROJECT, grant number RSP-2021/296, King Saud University, Riyadh, Saudi Arabia.

Institutional Review Board Statement

Not applicable.

Informed Consent Statement

Not applicable.

Data Availability Statement

http://www.carpatclim-eu.org/pages/download/ (accessed on 6 October 2021).

Acknowledgments

The authors are grateful to CARBATCLIM team for providing data used in this study. Authors would like to thank Debrecen University (Hungary) and King Saud University for their unlimited support.

Conflicts of Interest

The authors declare no conflict of interest.

References

  1. Zhu, Z.; Lu, L.; Zhang, W.; Liu, W. AR6 Climate Change 2021: The Physical Science Basis; IPCC: Geneva, Switzerland, 2021. [Google Scholar]
  2. Shukla, P.R.; Skea, J.; Calvo Buendia, E.; Masson-Delmotte, V.; Pörtner, H.O.; Roberts, D.C.; Zhai, P.; Slade, R.; Ferrat, M.; Neogi, S.; et al. Climate Change and Land. IPCC Special Report on Climate Change, Desertification, Land Degradation, Sustainable Land Management, Food Security, and Greenhouse Gas Fluxes in Terrestrial Ecosystems; IPCC: Geneva, Switzerland, 2019. [Google Scholar]
  3. Mohammed, S.; Gill, A.R.; Alsafadi, K.; Hijazi, O.; Yadav, K.K.; Khan, A.H.; Islam, S.; Cabral-Pinto, M.M.S.; Harsanyi, E. An overview of greenhouse gases emissions in Hungary. J. Clean. Prod. 2021, 127865. [Google Scholar] [CrossRef]
  4. Pachauri, R.K.; Allen, M.R.; Barros, V.R.; Broome, J.; Cramer, W.; Christ, R.; Church, J.A.; Clarke, L.; Dahe, Q.; Dasgupta, P.; et al. Climate Change 2014: Synthesis Report. Contribution of Working Groups I, II and III to the Fifth Assessment Report of the Intergovernmental Panel on Climate Change; IPCC: Geneva, Switzerland, 2014. [Google Scholar]
  5. Boris, O.; Seneviratne, S.I. Global changes in extreme events: Regional and seasonal dimension. Clim. Chang. 2012, 110, 669–696. [Google Scholar]
  6. Podlaha, A.; Lörinc, M.; Srivastava, G.; Bowen, S.; Kerschner, B. 2020 Annual Report. Weather, Climate & Catastrophe Insight; AON: Londan, UK, 2020. [Google Scholar]
  7. Gurdeep Singh, M.; Kaur, M.; Kaushik, P. Impact of climate change on agriculture and its mitigation strategies: A review. Sustainability 2021, 13, 1318. [Google Scholar]
  8. United Nations. World Population Prospects 2019: Highlights; United Nations: New York, USA, 2019. [Google Scholar]
  9. Dai, A. Drought under global warming: A review. Wiley Interdiscip. Rev. Clim. Chang. 2011, 1, 45–65. [Google Scholar] [CrossRef] [Green Version]
  10. Dai, A. Increasing drought under global warming in observations and models. Nat. Clim. Chang. 2012, 3, 52–58. [Google Scholar] [CrossRef]
  11. Sheffield, J.; Wood, E.; Roderick, M. Little change in global drought over the past 60 years. Nature 2012, 491, 435–438. [Google Scholar] [CrossRef] [PubMed]
  12. Jonathan, S.; Naumann, G.; Carrao, H.; Barbosa, P.; Vogt, J. World drought frequency, dura-tion, and severity for 1951–2010. Int. J. Climatol. 2014, 34, 2792–2804. [Google Scholar]
  13. Trenberth, K.E.; Dai, A.; Van Der Schrier, G.; Jones, P.; Barichivich, J.; Briffa, K.; Sheffield, J. Global warming and changes in drought. Nat. Clim. Chang. 2013, 4, 17–22. [Google Scholar] [CrossRef]
  14. Siegfried, D.S.; Stewart, R.E.; Wang, H.; Barlow, M.; Berbery, E.H.; Cai, W.; Ho-erling, M.P.; Kanikicharla, K.K.; Koster, R.D.; Lyon, B.; et al. Global meteorological drought: A synthesis of current understanding with a focus on SST drivers of precipitation deficits. J. Clim. 2016, 29, 3989–4019. [Google Scholar]
  15. Jürgen, V.; Somma, F. (Eds.) Drought and Drought Mitigation in Europe; Springer Science & Business Media: Berlin, Germany, 2013; p. 14. [Google Scholar]
  16. Raza, A.; Hussain, I.; Ali, Z.; Faisal, M.; Elashkar, E.E.; Shoukry, A.M.; Al-Deek, F.F.; Gani, S. A seasonally blended and regionally integrated drought index using Bayesian network theory. Meteorol. Appl. 2021, 28, e1992. [Google Scholar] [CrossRef]
  17. Roger, C.S. Agricultural drought indices in current use in Australia: Strengths, weaknesses, and limitations. In Proceedings of the Agricultural Drought Indices Proceedings of an Expert Meeting, Murcia, Spain, 2–4 June 2011; p. 85. [Google Scholar]
  18. Ding, Y.; Hayes, M.J.; Widhalm, M. Measuring economic impacts of drought: A review and discussion. Disaster Prev. Manag. Int. J. 2011, 20, 434–446. [Google Scholar] [CrossRef] [Green Version]
  19. Blauhut, V.; Gudmundsson, L.; Stahl, K. Towards pan-European drought risk maps: Quantifying the link between drought indices and reported drought impacts. Environ. Res. Lett. 2015, 10. [Google Scholar] [CrossRef]
  20. Blauhut, V.; Stahl, K.; Stagge, J.H.; Tallaksen, L.M.; Stefano, L.D.; Vogt, J. Estimating drought risk across Europe from reported drought impacts, drought indices, and vulnerability factors. Hydrol. Earth Syst. Sci. 2016, 20, 2779–2800. [Google Scholar] [CrossRef] [Green Version]
  21. Mishra, A.K.; Singh, V.P. A review of drought concepts. J. Hydrol. 2010, 391, 202–216. [Google Scholar] [CrossRef]
  22. Lloyd-Hughes, B. The impracticality of a universal drought definition. Theor. Appl. Clim. 2013, 117, 607–611. [Google Scholar] [CrossRef] [Green Version]
  23. Heim Richard, R., Jr. A review of twentieth-century drought indices used in the United States. Bull. Am. Meteorol. Soc. 2002, 83, 1149–1166. [Google Scholar] [CrossRef] [Green Version]
  24. Vicente-Serrano, S.M.; Lopez-Moreno, I.; Beguería, S.; Lorenzo-Lacruz, J.; Sanchez-Lorenzo, A.; García-Ruiz, J.M.; Azorin-Molina, C.; Morán-Tejeda, E.; Revuelto, J.; Trigo, R.; et al. Evidence of increasing drought severity caused by temperature rise in southern Europe. Environ. Res. Lett. 2014, 9, 044001. [Google Scholar] [CrossRef]
  25. Stahl, K.; Kohn, I.; Blauhut, V.; Urquijo, J.; De Stefano, L.; Acácio, V.; Dias, S.; Stagge, J.H.; Tallaksen, L.M.; Kampragou, E.; et al. Impacts of European drought events: Insights from an international database of text-based reports. Nat. Hazards Earth Syst. Sci. 2016, 16, 801–819. [Google Scholar] [CrossRef] [Green Version]
  26. Tigchelaar, M.; Battisti, D.S.; Naylor, R.L.; Ray, D. Future warming increases probability of globally synchronized maize production shocks. Proc. Natl. Acad. Sci. USA 2018, 115, 6644–6649. [Google Scholar] [CrossRef] [PubMed] [Green Version]
  27. Allen, C.D.; Breshears, D.D.; McDowell, N.G. On underestimation of global vulnerability to tree mor-tality and forest die-off from hotter drought in the Anthropocene. Ecosphere 2015, 6, 1–55. [Google Scholar] [CrossRef]
  28. Payus, C.; Huey, L.A.; Adnan, F.; Rimba, A.B.; Mohan, G.; Chapagain, S.K.; Roder, G.; Gasparatos, A.; Fukushi, K. Impact of Extreme Drought Climate on Water Security in North Borneo: Case Study of Sabah. Water 2020, 12, 1135. [Google Scholar] [CrossRef]
  29. Murray-Tortarolo, G.N.; Jaramillo, V.J. The impact of extreme weather events on livestock populations: The case of the 2011 drought in Mexico. Clim. Chang. 2019, 153, 79–89. [Google Scholar] [CrossRef]
  30. Auerbach, R.; Piek, H.; Battersby, J.; Devereux, S.; Olivier, N. The Likely Impact of the 2015–2018 Drought in South Africa: Lessons from the 2008 Food Price Crisis and Future Implications; Cabi: Wallingford, UK, 2020; pp. 81–99. [Google Scholar]
  31. Wilhite, D.A.; Svoboda, M.D.; Hayes, M.J. Understanding the complex impacts of drought: A key to enhancing drought mitigation and preparedness. Water Resour. Manag. 2007, 21, 763–774. [Google Scholar] [CrossRef] [Green Version]
  32. Alley, W.M. The Palmer drought severity index: Limitations and assumptions. J. Appl. Meteorol. Climatol. 1984, 23, 1100–1109. [Google Scholar] [CrossRef] [Green Version]
  33. McKee Thomas, B.; Doesken, N.J.; Kleist, J. The relationship of drought frequency and duration to time scales. In Proceedings of the 8th Conference on Applied Climatology, Anaheim, VA, USA, 17–22 January 1993; Volume 17, pp. 179–183. [Google Scholar]
  34. Vicente-Serrano, S.M.; Beguería, S.; Lopez-Moreno, I. A Multiscalar Drought Index Sensitive to Global Warming: The Standardized Precipitation Evapotranspiration Index. J. Clim. 2010, 23, 1696–1718. [Google Scholar] [CrossRef] [Green Version]
  35. Palmer, W.C. Keeping Track of Crop Moisture Conditions, Nationwide: The New Crop Moisture Index. Weatherwise 1968, 21, 156–161. [Google Scholar] [CrossRef]
  36. Meyer, S.J.; Hubbard, K.; Wilhite, D.A. A Crop-Specific Drought Index for Corn: II. Application in Drought Monitoring and Assessment. Agron. J. 1993, 85, 396–399. [Google Scholar] [CrossRef]
  37. Gommes, R.; Petrassi, F. Rainfall Variability and Drought in Sub-Saharan Africa; Food and agriculture organization of the United Nations: Rome, Italy, 1996. [Google Scholar]
  38. Weghorst, K.M. The Reclamation Drought Index: Guidelines and Practical Applications; Bureau of Reclamation: Denver, CO, USA, 1996.
  39. Byun, H.-R.; Wilhite, D.A. Objective quantification of drought severity and duration. J. Clim. 1999, 12, 2747–2756. [Google Scholar] [CrossRef]
  40. Bhalme, H.N.; Mooley, D.A. Large-scale droughts/floods and monsoon circulation. Mon. Weather Rev. Am. Meteorol. Soc. 1980, 108, 8. [Google Scholar] [CrossRef] [Green Version]
  41. Shukla, S.; Wood, A. Use of a standardized runoff index for characterizing hydrologic drought. Geophys. Res. Lett. 2008, 35. [Google Scholar] [CrossRef] [Green Version]
  42. Hong, X.W.; Lu, R.Y.; Li, S.L. Amplified summer warming in Europe–West Asia and Northeast Asia after the mid-1990s. Environ. Res. Lett. 2017, 12, 9. [Google Scholar] [CrossRef] [Green Version]
  43. Hanel, M.; Rakovec, O.; Markonis, Y.; Máca, P.; Samaniego, L.; Kyselý, J.; Kumar, R. Revisiting the recent European droughts from a long-term perspective. Sci. Rep. 2018, 8, 9499. [Google Scholar] [CrossRef] [PubMed]
  44. Spinoni, J.; Vogt, J.V.; Naumann, G.; Barbosa, P.; Dosio, A. Will drought events become more frequent and severe in Europe? Int. J. Climatol. 2018, 38, 1718–1736. [Google Scholar] [CrossRef] [Green Version]
  45. Bartholy, J.; Pongracz, R.; Hollósi, B. Analysis of projected drought hazards for Hungary. Adv. Geosci. 2013, 35, 61–66. [Google Scholar] [CrossRef] [Green Version]
  46. Mezősi, G.; Bata, T.; Meyer, B.C.; Blanka, V.; Ladányi, Z. Climate Change Impacts on Environmental Hazards on the Great Hungarian Plain, Carpathian Basin. Int. J. Disaster Risk Sci. 2014, 5, 136–146. [Google Scholar] [CrossRef] [Green Version]
  47. Ceglar, A.; Croitoru, A.-E.; Cuxart, J.; Djurdjevic, V.; Güttler, I.; Ivančan-Picek, B.; Jug, D.; Lakatos, M.; Weidinger, T. PannEx: The pannonian basin experiment. Clim. Serv. 2018, 11, 78–85. [Google Scholar] [CrossRef]
  48. Gálos, B.; Lorenz, P.; Jacob, D. Will dry events occur more often in Hungary in the future? Environ. Res. Lett. 2007, 2. [Google Scholar] [CrossRef]
  49. Mohammed, S.; Alsafadi, K.; Daher, H.; Gombos, B.; Mahmood, S.; Harsányi, E. Precipitation pattern changes and response of vegetation to drought variability in the eastern Hungary. Bull. Natl. Res. Cent. 2020, 44, 1–10. [Google Scholar] [CrossRef] [Green Version]
  50. CARBATCLIM. Available online: http://www.carpatclim-eu.org/pages/about/ (accessed on 9 September 2021).
  51. Szalai, S.; Vogt, J. CARPATCLIM–high resolution gridded database of the Carpathian Region and calculation of drought indices as a contribution to the European Drought Observatory. In Proceedings of the WRCP Conference, Denver, CO, USA, 24–28 October 2011; pp. 24–28. [Google Scholar]
  52. Alsafadi, K.; Mohammed, S.A.; Ayugi, B.; Sharaf, M.; Harsányi, E. Spatial–temporal evolution of drought characteristics over Hungary between 1961 and 2010. Pure Appl. Geophys. 2020, 177, 3961–3978. [Google Scholar] [CrossRef] [Green Version]
  53. Mann, H.B. Nonparametric tests against trend. Econom. J. Econom. Soc. 1945, 1, 245–259. [Google Scholar] [CrossRef]
  54. Sen, P.K. Estimates of the regression coefficient based on Kendall’s tau. J. Am. Stat. Assoc. 1968, 1, 1379–1389. [Google Scholar] [CrossRef]
  55. Stagge, J.H.; Tallaksen, L.M.; Gudmundsson, L.; Van Loon, A.F.; Stahl, K. Candidate distributions for climatological drought indices (SPI and SPEI). Int. J. Climatol. 2015, 35, 4027–4040. [Google Scholar] [CrossRef]
  56. Yang, J.; Chang, J.X.; Wang, Y.M.; Li, Y.Y.; Hu, H.; Chen, Y.T.; Huang, Q.; Yao, J. Comprehensive drought characteristics analysis based on a nonlinear multivariate drought index. J. Hydrol. 2018, 557, 651–667. [Google Scholar] [CrossRef]
  57. Zargar, A.; Sadiq, R.; Naser, G.; Khan, F.I. A review of drought indices. Environ. Rev. 2011, 19, 333–349. [Google Scholar] [CrossRef]
  58. Chang, K.Y.; Xu, L.; Starr, G. A drought indicator reflecting ecosystem responses to water availability: The normalized ecosystem drought index. Agric. For. Meteorol. 2018, 250, 102–117. [Google Scholar] [CrossRef]
  59. Sims, A.P.; Niyogi, D.D.S.; Raman, S. Adopting drought indices for estimating soil moisture: A North Carolina case study. Geophys. Res. Lett. 2002, 29, 24-1–24-4. [Google Scholar] [CrossRef] [Green Version]
  60. Ogunrinde, A.T.; Oguntunde, P.G.; Akinwumiju, A.S.; Fasinmirin, J.T. Analysis of recent changes in rainfall and drought indices in Nigeria, 1981–2015. Hydrol. Sci. J. 2019, 64, 1755–1768. [Google Scholar] [CrossRef]
  61. Hao, Z.; Singh, V.P. Drought characterization from a multivariate perspective: A review. J. Hydrol. 2015, 527, 668–678. [Google Scholar] [CrossRef]
  62. Park, J.; Sung, J.H.; Lim, Y.-J.; Kang, H.-S. Introduction and application of non-stationary standardized precipitation index considering probability distribution function and return period. Theor. Appl. Clim. 2018, 136, 529–542. [Google Scholar] [CrossRef]
  63. Mohammed, S.; Alsafadi, K.; Al-Awadhi, T.; Sherief, Y.; Harsanyie, E.; El Kenawy, A.M. Space and time variability of meteorological drought in Syria. Acta Geophys. 2020, 68, 1877–1898. [Google Scholar] [CrossRef]
  64. Potopová, V.; Štěpánek, P.; Možný, M.; Türkott, L.; Soukup, J. Performance of the standardised precipitation evapotranspiration index at various lags for agricultural drought risk assessment in the Czech Republic. Agric. For. Meteorol. 2015, 202, 26–38. [Google Scholar] [CrossRef]
  65. Liu, X.; Pan, Y.; Zhu, X.; Yang, T.; Bai, J.; Sun, Z. Drought evolution and its impact on the crop yield in the North China Plain. J. Hydrol. 2018, 564, 984–996. [Google Scholar] [CrossRef]
  66. Tigkas, D.; Vangelis, H.; Tsakiris, G. Drought characterisation based on an agriculture-oriented standardised precipitation index. Theor. Appl. Climatol. 2019, 135, 1435–1447. [Google Scholar] [CrossRef]
  67. Sharma, A.; Goyal, M.K. Assessment of ecosystem resilience to hydroclimatic disturbances in India. Glob. Chang. Biol. 2017, 24, e432–e441. [Google Scholar] [CrossRef] [PubMed]
  68. Dai, A.; Zhao, T.; Chen, J. Climate Change and Drought: A Precipitation and Evaporation Perspective. Curr. Clim. Chang. Rep. 2018, 4, 301–312. [Google Scholar] [CrossRef]
  69. Berg, A.; Sheffield, J. Climate Change and Drought: The Soil Moisture Perspective. Curr. Clim. Chang. Rep. 2018, 4, 180–191. [Google Scholar] [CrossRef]
  70. Cook, B.I.; Mankin, J.S.; Anchukaitis, K.J. Climate Change and Drought: From Past to Future. Curr. Clim. Chang. Rep. 2018, 4, 164–179. [Google Scholar] [CrossRef]
  71. Wang, Z.; Zhong, R.; Lai, C.; Zeng, Z.; Lian, Y.; Bai, X. Climate change enhances the severity and variability of drought in the Pearl River Basin in South China in the 21st century. Agric. For. Meteorol. 2018, 249, 149–162. [Google Scholar] [CrossRef]
  72. Pei, Z.; Fang, S.; Wang, L.; Yang, W. Comparative Analysis of Drought Indicated by the SPI and SPEI at Various Timescales in Inner Mongolia, China. Water 2020, 12, 1925. [Google Scholar] [CrossRef]
  73. Stagge, J.H.; Kingston, D.G.; Tallaksen, L.M.; Hannah, D.M. Observed drought indices show increasing divergence across Europe. Sci. Rep. 2017, 7, 1–10. [Google Scholar] [CrossRef]
  74. Kuwayama, Y.; Thompson, A.; Bernknopf, R.; Zaitchik, B.; Vail, P. Estimating the Impact of Drought on Agriculture Using the U.S. Drought Monitor. Am. J. Agric. Econ. 2018, 101, 193–210. [Google Scholar] [CrossRef]
  75. Peña-Gallardo, M.; Vicente-Serrano, S.M.; Domínguez-Castro, F.; Beguería, S. The impact of drought on the productivity of two rainfed crops in Spain. Nat. Hazards Earth Syst. Sci. 2019, 19, 1215–1234. [Google Scholar] [CrossRef] [Green Version]
  76. Ziolkowska, J.R. Socio-economic implications of drought in the agricultural sector and the state economy. Economies 2016, 4, 19. [Google Scholar] [CrossRef]
  77. Nath, R.; Nath, D.; Li, Q.; Chen, W.; Cui, X. Impact of drought on agriculture in the Indo-Gangetic Plain, India. Adv. Atmos. Sci. 2017, 34, 335–346. [Google Scholar] [CrossRef]
  78. Parsons, D.J.; Rey, D.; Tanguy, M.; Holman, I.P. Regional variations in the link between drought indices and reported agricultural impacts of drought. Agric. Syst. 2019, 173, 119–129. [Google Scholar] [CrossRef]
  79. Ray, R.L.; Fares, A.; Risch, E. Effects of Drought on Crop Production and Cropping Areas in Texas. Agric. Environ. Lett. 2018, 3, 170037. [Google Scholar] [CrossRef] [Green Version]
  80. Van Lanen, H.A.; Laaha, G.; Kingston, D.G.; Gauster, T.; Ionita, M.; Vidal, J.; Vlnas, R.; Tallaksen, L.M.; Stahl, K.; Hannaford, J.; et al. Hydrology needed to manage droughts: The 2015 European case. Hydrol. Process. 2016, 30, 3097–3104. [Google Scholar] [CrossRef] [Green Version]
  81. Van Loon, A.F. Hydrological drought explained. Wiley Interdiscip. Rev. Water 2015, 2, 359–392. [Google Scholar] [CrossRef]
  82. Herrera-Estrada, J.E.; Diffenbaugh, N.S.; Wagner, F.; Craft, A.; Sheffield, J. Response of electricity sector air pollution emissions to drought conditions in the western United States. Environ. Res. Lett. 2018, 13, 124032. [Google Scholar] [CrossRef]
  83. Myronidis, D.; Fotakis, D.; Ioannou, K.; Sgouropoulou, K. Comparison of ten notable meteorological drought indices on tracking the effect of drought on streamflow. Hydrol. Sci. J. 2018, 63, 2005–2019. [Google Scholar] [CrossRef]
  84. Musolino, D.; de Carli, A.; Massarutto, A. Evaluation of socio-economic impact of drought events: The case of Po river basin. Eur. Countrys. 2017, 9, 163. [Google Scholar] [CrossRef] [Green Version]
  85. Edwards, B.; Gray, M.; Hunter, B. The Impact of Drought on Mental Health in Rural and Regional Australia. Soc. Indic. Res. 2014, 121, 177–194. [Google Scholar] [CrossRef]
  86. Yusa, A.; Berry, P.J.; Cheng, J.; Ogden, N.; Bonsal, B.; Stewart, R.; Waldick, R. Climate change, drought and human health in Canada. Int. J. Environ. Res. Public Health 2015, 12, 8359–8412. [Google Scholar] [CrossRef] [PubMed]
  87. Ebi, K.L.; Bowen, K. Extreme events as sources of health vulnerability: Drought as an example. Weather. Clim. Extrem. 2016, 11, 95–102. [Google Scholar] [CrossRef] [Green Version]
  88. Smith, T.; Fitchett, J.M. Drought challenges for nature tourism in the Sabi Sands Game Reserve in the eastern region of South Africa. Afr. J. Range Forage Sci. 2020, 37, 107–117. [Google Scholar] [CrossRef]
  89. Lwoga, N.B.; Asubisye, E. Effects of drought on cultural tourism: Selected cases of Maasai tourism groups surrounding Ta-rangire National Park in Tanzania. J. Tour. Cult. Chang. 2018, 16, 248–264. [Google Scholar] [CrossRef]
  90. Rosselló, J.; Becken, S.; Gallego, M.S. The effects of natural disasters on international tourism: A global analysis. Tour. Manag. 2020, 79, 104080. [Google Scholar] [CrossRef]
  91. Bordi, I.; Fraedrich, K.; Sutera, A. Observed drought and wetness trends in Europe: An update. Hydrol. Earth Syst. Sci. 2009, 13, 1519–1530. [Google Scholar] [CrossRef] [Green Version]
  92. Lloyd-Hughes, B.; Saunders, M.A. A drought climatology for Europe. Int. J. Climatol. A J. R. Meteorol. Soc. 2002, 22, 1571–1592. [Google Scholar] [CrossRef]
  93. Trnka, M.; Balek, J.; Zahradníček, P.; Eitzinger, J.; Formayer, H.; Turňa, M.; Nejedlík, P.; Semerádová, D.; Hlavinka, P.; Brázdil, R. Drought trends over part of Central Europe between 1961 and 2014. Climate Res. 2016, 70, 143–160. [Google Scholar] [CrossRef] [Green Version]
  94. Szabó, S.; Szopos, N.M.; Bertalan-Balázs, B.; László, E.; Milošević, D.D.; Conoscenti, C.; Lázár, I. Geospatial analysis of drought tendencies in the Carpathians as reflected in a 50-year time series. Hung. Geogr. Bull. 2019, 68, 269–282. [Google Scholar] [CrossRef] [Green Version]
  95. Adrienn, V.S.; Janos, N. Effects of nutrition and water supply on the yield and grain protein content of maize hybrids. Aust. J. Crop Sci. 2012, 6, 381–390. [Google Scholar]
  96. Paltineanu, C.R.; Mihailescu, I.F.; Prefac, Z.; Dragota, C.; Vasenciuc, F.; Claudia, N. Combining the standardized precipitation index and climatic water deficit in characterizing droughts: A case study in Romania. Theor. Appl. Climatol. 2009, 97, 219. [Google Scholar] [CrossRef]
  97. Spinoni, J.; Antofie, T.; Barbosa, P.; Bihari, Z.; Lakatos, M.; Szalai, S.; Szentimrey, T.; Vogt, J. An overview of drought events in the Carpa-thian Region in 1961–2010. Adv. Sci. Res. 2013, 10, 21–32. [Google Scholar] [CrossRef] [Green Version]
  98. Wang, W.; Zhu, Y.; Xu, R.; Liu, J. Drought severity change in China during 1961–2012 indicated by SPI and SPEI. Nat. Hazards 2014, 75, 2437–2451. [Google Scholar] [CrossRef]
  99. Won, J.; Choi, J.; Lee, O.; Kim, S. Copula-based Joint Drought Index using SPI and EDDI and its application to climate change. Sci. Total Environ. 2020, 744, 140701. [Google Scholar] [CrossRef] [PubMed]
  100. Chen, X.; Li, Y.; Yao, N.; Liu, D.L.; Javed, T.; Liu, C.; Liu, F. Impacts of multi-timescale SPEI and SMDI variations on winter wheat yields. Agric. Syst. 2020, 185, 102955. [Google Scholar] [CrossRef]
  101. Ma, B.; Zhang, B.; Jia, L.; Huang, H. Conditional distribution selection for SPEI-daily and its revealed meteorological drought characteristics in China from 1961 to 2017. Atmos. Res. 2020, 246, 105108. [Google Scholar] [CrossRef]
  102. Li, Y.; Ye, W.; Wang, M.; Yan, X. Climate change and drought: A risk assessment of crop-yield impacts. Clim. Res. 2009, 39, 31–46. [Google Scholar] [CrossRef]
  103. Matiu, M.; Ankerst, D.P.; Menzel, A. Interactions between temperature and drought in global and regional crop yield variability during 1961–2014. PLoS ONE 2017, 12, 178339. [Google Scholar] [CrossRef] [Green Version]
  104. Lobell, D.B.; Schlenker, W.; Costa-Roberts, J. Climate Trends and Global Crop Production Since 1980. Science 2011, 333, 616–620. [Google Scholar] [CrossRef] [PubMed] [Green Version]
  105. Lobell, D.; Field, C.B. Global scale climate–crop yield relationships and the impacts of recent warming. Environ. Res. Lett. 2007, 2. [Google Scholar] [CrossRef]
  106. Schlenker, W.; Roberts, M.J. Nonlinear temperature effects indicate severe damages to U.S. crop yields under climate change. Proc. Natl. Acad. Sci. USA 2009, 106, 15594–15598. [Google Scholar] [CrossRef] [PubMed] [Green Version]
  107. Hoerling, M.P.; Eischeid, J.; Kumar, A.; Leung, R.; Mariott, A.; Mo, K.; Schubert, S.; Seager, R. Causes and predictability of the 2012 Great Plains drought. Bull. Amer. Meteor. Soc. 2014, 95, 269–282. [Google Scholar] [CrossRef] [Green Version]
  108. Foster, T.; Brozović, N.; Butler, A.P. Why well yield matters for managing agricultural drought risk. Weather Clim. Extremes 2015, 10, 11–19. [Google Scholar] [CrossRef]
Figure 1. Map of Hungary: (a) Hungarian counties, and (b) distribution of 1045 gridded points across Hungary.
Atmosphere 12 01339 g001
Figure 2. Evolution of sunflower cultivation across Hungary at a national scale (1990–2019): (a) harvested sunflower land between 1990 and 2019 (left graph); (b) production in tons across Hungary (middle graph); and (c) sunflower yield between 1990 and 2019 (right graph).
Atmosphere 12 01339 g002
Figure 3. Flowchart of the study process from obtaining the data through to providing conclusions and recommendations. SPI, SPEI: drought indices. Trend: MK test. Y R   ( x ) : observed yield (2000–2019), Y P   ( x ) : potential yield (detrended). SSYR : sequence of standardized yield residuals, Yloss Ag.D: yield losses, SRAg . D x : sunflower resilience to Ag.D.
Atmosphere 12 01339 g003
Figure 4. Ag.D evolution across Hungary (1960–2010): (a) Evolution of SPI-6 across Hungarian counties (1960–2010); (b) trends in SPI-6 and SPEI-6 based on MK tests and Sen slopes; (c) lowest recorded values of SPI-6 and SPEI-6 across Hungarian counties (1960–2010); (d) Evolution of SPEI-6 across Hungarian counties (1960–2010).
Atmosphere 12 01339 g004
Figure 5. Sunflower yield in the studied Hungarian counties (2000–2019). (a) BA, (b) BC, (c) BE, (d) BO, (e) BU, (f) CS, (g) FE, (h) GY, (i) HB, (j) HE, (k) JN, (l) KE, (m) NO, (n) PE, (o) SO, (p) SS, (q) TO, (r) VA, (s) VE, (t) ZA.
Atmosphere 12 01339 g005
Figure 6. Evolution of S S Y R in the studied Hungarian counties (2000–2019). (a) BA, (b) BC, (c) BE, (d) BO, (e) BU, (f) CS, (g) FE, (h) GY, (i) HB, (j) HE, (k) JN, (l) KE, (m) NO, (n) PE, (o) SO, (p) SS, (q) TO, (r) VA, (s) VE, (t) ZA.
Atmosphere 12 01339 g006
Figure 7. Correlation values between SSYR and SPI during the sunflower growing cycle (2000–2010) (right table), and max correlation (Max. r) between the SSYR and SPI (left figure).
Atmosphere 12 01339 g007
Figure 8. Correlation values between the SSYR and SPEI during the sunflower growing cycle (2000–2010) (right table), and max correlation (Max. r) between the SSYR and SPEI (left figure).
Atmosphere 12 01339 g008
Figure 9. Sunflower resilience to Ag.D (SRAg.D) (right), and max yield losses (left).
Atmosphere 12 01339 g009
Figure 10. Resilience of sunflower production to Ag.D across Hungarian counties (2000–2010).
Atmosphere 12 01339 g010
Table 1. Common drought indices.
IndexDefinitionFactorCalculation Time Scale
PDSI [32]Palmer Drought Severity IndexPrecipitation, temperature, soil moisture and evapotranspirationMonthly
CMI [35]Crop Moisture IndexMean temperature and precipitationWeekly
CSDI [36]Crop Specific Drought IndexEvapotranspirationSeasonal
RI [37]National Rainfall IndexPrecipitationAnnually and every century
RDI [38]Reclamation Drought IndexLevel of river water, snowfall, stream flows, reservoirs level and temperatureMonthly
EPI [39]Effective Precipitation IndexPrecipitationDaily
BMDI [40]Bhalme and Mooley Drought IndexPrecipitationMonthly, annually
SPI [33]Standardized Precipitation IndexPrecipitation3-, 6-, 12-, 24- and 48-month periods.
SPEI [34]Standardized Precipitation Evapotranspiration IndexPrecipitation, evapotranspirationMonthly
SRI [41]Standardized Runoff IndexPrecipitation3-, 6-, 12-, 24- and 48-month periods.
Table 2. Drought classes based on SPI and SPEI values.
SPI ValueSPEI ValueAg.D Class
>0>0NA
−0.84–0−0.84–0Moderate Ag.D
−1.28–−0.84 −1.28–−0.84 Severe Ag.D
−1.65–−1.28 −1.65–−1.28 Extreme Ag.D
>−1.65>−1.65Very extreme Ag.D
Table 3. Classification of the sequence of standardized yield residual ( SSYR ) values which ranged from normal conditions to extreme drought impacts.
SSYR   Value Impacts of Ag.D
−0.5 <  SSYR  ≤ 0.5Normal
−1.0 <  SSYR  ≤ −0.5Mild
−1.5 <  SSYR  ≤ −1.0Moderate
−2.0 <  SSYR  < −1.5High
SSYR ≤ −2.0Extreme
Table 4. Classification of sunflower resilience to Ag.D (SRAg.D) values, which ranged from resilient to severely non-resilient.
SRAg.D ValueSRAg.D
SRAg.D > 1Resilient
0.9 < SRAg.D < 1Slightly non-SRAg.D
0.8 < SRAg.D < 0.9Moderately non-SRAg.D
SRAg.D < 0.8Severely non-SRAg.D
Table 5. Trends in Ag.D indices (SPI-6, SPEI-6) and sunflower production (kg/ha) across Hungary.
CountyCodeSPI-6SPEI-6Sunflower
MK and βpMK and βpMK and βp
Bács-KiskunBC0.00050.05−5 × 10−50.83+55.830
BaranyaBA0.00020.32−2 × 10−40.40+48.040
BékésBE0.00050.056 × 10−50.79+59.03<0.0001
Borsod-Abaúj-ZemplénBO0.00050.067 × 10−50.75+75.19<0.0001
BudapestBU0.00030.28−3 × 10−40.27+70.280
Csongrád-CsanádCS0.00030.21−1 × 10−40.55+32.180.01
FejérFE0.00010.67−4 × 10−40.06+47.990.01
Győr-Moson-SopronGY0.00010.74−5 × 10−40.03+38.330.01
Hajdú-BiharHB0.00060.012 × 10−40.46+71.6<0.0001
HevesHE0.00050.021 × 10−40.60+71.340
Jász-Nagykun-SzolnokJN0.00070.002 × 10−40.44+60<0.0001
Komárom-EsztergomKE0.00030.21−2 × 10−40.26+58.06<0.0001
NógrádNO0.00030.24−1 × 10−40.65+650.01
PestPE0.00030.16−2 × 10−40.48+65.150
SomogySO−0.00040.07−8 × 10−40.00+61.460
Szabolcs-Szatmár-BeregSS0.00080.003 × 10−40.15+72.580
TolnaTO0.00000.94−4 × 10−40.06+53.540
VasVA−0.00080.00−1 × 10⁻³<0.0001+44.770
VeszprémVE−0.00010.69−6 × 10−40.01+56.570
ZalaZA−0.00070.01−1 × 10⁻³<0.0001+50<0.0001
* Gray and bold values indicate a significance level of 0.05 (p < 0.05). MK, trend; β, Sen slope.
Publisher’s Note: MDPI stays neutral with regard to jurisdictional claims in published maps and institutional affiliations.

