
Physiological and Yield Responses of Spring Wheat Cultivars under Realistic and Acute Levels of Ozone


1
Department of Vegetable and Field Crop Research, Agricultural Research Organization, Gilat Research Center, Negev 8531100, Israel
2
Department of Soil and Water Sciences, The Institute of Environmental Sciences, The Robert H. Smith Faculty of Agriculture, Food and Environment, The Hebrew University of Jerusalem, Rehovot 76100, Israel
3
Department of Environmental Science, School of Earth Sciences, Central University of Rajasthan, Rajasthan 305817, India
*
Author to whom correspondence should be addressed.
Atmosphere 2021, 12(11), 1392; https://0-doi-org.brum.beds.ac.uk/10.3390/atmos12111392
Submission received: 25 August 2021
/
Revised: 19 October 2021
/
Accepted: 20 October 2021
/
Published: 24 October 2021
(This article belongs to the Special Issue Ozone Effects on Vegetation under a Climate Change Scenario)
Abstract
:Tropospheric ozone (O3) is widely recognized as the cause of substantial yield and quality reduction in crops. Most of the previous studies focused on the exposure of wheat cultivars to elevated O3 levels. Our main objectives were to: (i) investigate the consistency of wheat cultivars’ physiological responses across two different realistic O3 levels; and (ii) compare these physiological responses with those under short acute O3 exposure. Three commercially available hard spring wheat cultivars bred under semiarid and Eastern Mediterranean conditions were exposed to two different O3 levels during two consecutive seasons (2016–2018)—36 and 71 ppbv 7 h mean O3 mixing ratios in open-top chambers. The results were compared to those following short acute O3 exposure (102.8 ppbv, 7 h mean for 10 days) in a greenhouse. Non-stomatal responses were significantly more pronounced than stomatal responses in all cultivars under different levels of O3. The specific cultivar was observed as the most O3-tolerant under all experiments. The fact that the same cultivar was found remarkably tolerant to the local semiarid ambient conditions according to other studies and to O3 exposure based on the present study supports a link between cultivar resistance to drought conditions and O3.
1. Introduction
Tropospheric ozone (O3) is a phytotoxic secondary air pollutant formed by complex photochemical reactions of O3 precursors such as nitrogen oxides, carbon monoxide, methane, and volatile organic compounds [1]. O3 has substantial deleterious impacts on both crops and perennial plants [2,3]. Von Schneidemesser et al. [4] highlighted the complex manner in which climate change and O3 are linked in affecting both human health and crops. O3 causes damage in plants following its penetration into leaves through the stomata; this leads to oxidative stress, initiating metabolically affluent defense mechanisms and accelerating senescence and reduction in photosynthesis, growth, biomass, and yield [5,6]. Both chronic and acute O3 exposure are known to affect photosynthesis, induce variation in stomatal responses, decrease in carboxylation efficiency of ribulose 1,5-bisphosphate carboxylase/oxygenase (Rubisco), and reduce biomass and yield [2].
Furthermore, exposure to O3 can damage leaves depending on the level and the duration, manifested as foliar injury symptoms on natural vegetation and crop plants [7]. Emberson et al. [8] reported foliar injury and decreased unit leaf area available for photosynthesis under high episodes of O3 exposure and accelerated senescence under moderate O3 exposure. Under elevated levels of O3, different crop plants also showed visible foliar injury symptoms [9,10].
Wheat (Triticum aestivum L.) is one of the most O3-sensitive crops identified to date [10,11]. Chuwah et al. [12] estimated crop damage of up to 20% locally in 2050 due to higher O3 concentration based on existing exposure–response studies. Schauberger et al. [13] estimated global wheat reductions of about 27% and 39% in Western and Asian wheat, respectively, also causing human health burdens, particularly in Asian countries. Exposure of spring wheat to slightly elevated O3 concentrations caused a reduction in photosynthesis and yield under glasshouse conditions [14]. Pleijel [15] reviewed 18 wheat genotypes from nine countries that reported an 8.4% reduction in grain yield in non-filtered air compared to charcoal-filtered OTCs after 62% removal of O3. Similarly, based on a meta-analysis, Feng and Kobayashi [16] estimated decreases in the wheat yield of ~10% and 20% in the present ambient (31–50 ppb) and elevated (51–75 ppb) O3 levels as compared to charcoal-filtered air-exposed plants. Modeling studies predicted 9–18% global wheat yield losses despite assuming that presently approved air quality legislation will be fully implemented by 2030 [17].
According to Emberson et al. [8], under the present O3 levels, significant global yield loss of crop plants such as wheat, rice, maize, and soybean is estimated at 2–16%. Based on a meta-analysis, Feng et al. [9] estimated a decrease of ~29% in the yield of wheat exposed to average 73 ppb O3 in open-top chambers (OTCs), growth chambers, and greenhouses (GHs) as compared to carbon-filtered air. The performance of wheat cultivars was also altered by environmental conditions and O3 required to involve in crop breeding programs [18,19]. Potential interactions between O3 concentration and plant responses can be expressed by exposure index for O3, i.e., accumulated exposure over a threshold of 40 ppb (AOT40), or preferably by phytotoxic ozone dose (POD) and validated by various greenhouse, controlled environment, and field experiments [5,19]. AOT40 or POD were frequently studied by assuming a linear relationship between the O3 indices, while deviation from linearity was often observed, particularly at low O3 exposure [10,20]. From a physiological point of view, studying the effects of exposure to low O3 levels can provide an advantageous insight into the plant’s response mechanisms across different realistic O3 exposure levels, including low levels, and is also useful for assessment requirements [18,21].
The same cultivars would respond fundamentally differently to long moderate chronic exposure versus short and acute exposure to O3, raising the need to use robust metrics for O3 exposure or several different metrics. For instance, Sinha et al. [22] estimated crop-specific exposure–yield functions based on the AOT40 and the mean 7-h day time O3 mixing ratio (M7) exposure metrics to assess O3 exposure effects at different growing seasons. Environmental conditions such as drought can also lead to variability in plant response to O3 exposure; for instance, by affecting stomatal conductance, changes in vapor pressure deficit (VPD) can alter the O3 uptake [23]. The plant’s biochemical mechanism can alter the degree of the O3 damage through stomatal conductance, which is an additional cause for variation in response of different cultivars to O3 exposure [2,5].
Wheat responses to high O3 levels vary significantly among cultivars and ~30% in yield loss due to O3 exposure [10,11,19,20,24]. Emberson et al. [8] reported that selecting O3 tolerant cultivars by 12% in 2030 and assessing physiological response to O3 by crop modeling would improve crop production [8,18].
Therefore, directly including ‘sensitivity to ambient O3’ as part of the breeding process can significantly improve the response of particular cultivars to specific ambient conditions. Identifying intraspecific alterations in cultivars’ responses to O3 is thus fundamentally important for breeding, and exposure–response experiments are crucial to studying the response mechanisms of different cultivars to O3.
We hypothesized that exposing wheat cultivars to two different realistic models—slightly and moderately elevated O3 levels—and comparing their physiological responses to short acute exposure would demonstrate the fundamental difference in cultivars responses to O3. Exposure to different levels of O3 with different meteorological conditions can also provide important insights for the process of selecting particular wheat cultivars for a specific growing area.
To address this hypothesis, we exposed three wheat cultivars with different phenological characteristics to two different realistic—slightly and moderately elevated—O3 levels over two entire wheat-growing seasons in near-natural OTCs [10]. We compared the results per cultivar with those from control OTCs (no O3 enrichment) and those from short-term acute O3 exposure in the GH. Another key aspect of this study is the potential link between resistance to O3 and prevailing ambient conditions addressed by focusing on cultivars bred under semiarid conditions. To the best of our knowledge, this is the first report of the effects of O3 on spring wheat cultivars bred under semiarid and Eastern Mediterranean climate conditions and commercially available for use in Israel.
2. Materials and Methods
2.1. Experimental Overview
An O3 exposure–response study was conducted on two experimental platforms: OTCs and GHs (Table 1). OTCs were installed in the field at the Gilat Research Center of the Agricultural Research Organization, Negev, Israel (31°21′ N, 34°42′ E, 150 m above sea level). The GH experiment was carried out at the Hebrew University of Jerusalem in Rehovot, Israel (34°47′ N, 31°54′ E, 54 m above sea level). The OTC experiment study area situated in the Eastern Mediterranean region experiences slight rain from December to April (230 mm annual average) and a mean temperature (T) (December to April) of 15 °C. The study of the effect of chronic O3 exposure was carried out for two wheat-growing seasons, December 2016 to April 2017 (season I) and December 2017 to April 2018 (season II). The timelines of seed sowing, emergence, O3 fumigation, crop phenology, and harvest are detailed in Table 2.
2.2. Experimental Plants
Hard spring bread wheat (T. aestivum L.) cultivars Zahir, Gedera, and Ruta, bred and commercially available in Israel, were used for this study. Having no previous information about the response of these cultivars to O3, these cultivars were selected according to phenological characteristics [25]. ‘Zahir’ is a very early-maturing genotype, ‘Gedera’ is an intermediate-maturing genotype, and ‘Ruta’ is a late-maturing genotype. A preparatory study was also conducted on four cultivars—Zahir, Omer, Beit Hashita, and Yuval—to test their physiological responses under direct leaf-level O3 exposure of 65 ppbv (see Section S1 of the Supplementary Information).
2.3. GH Experimental Setup
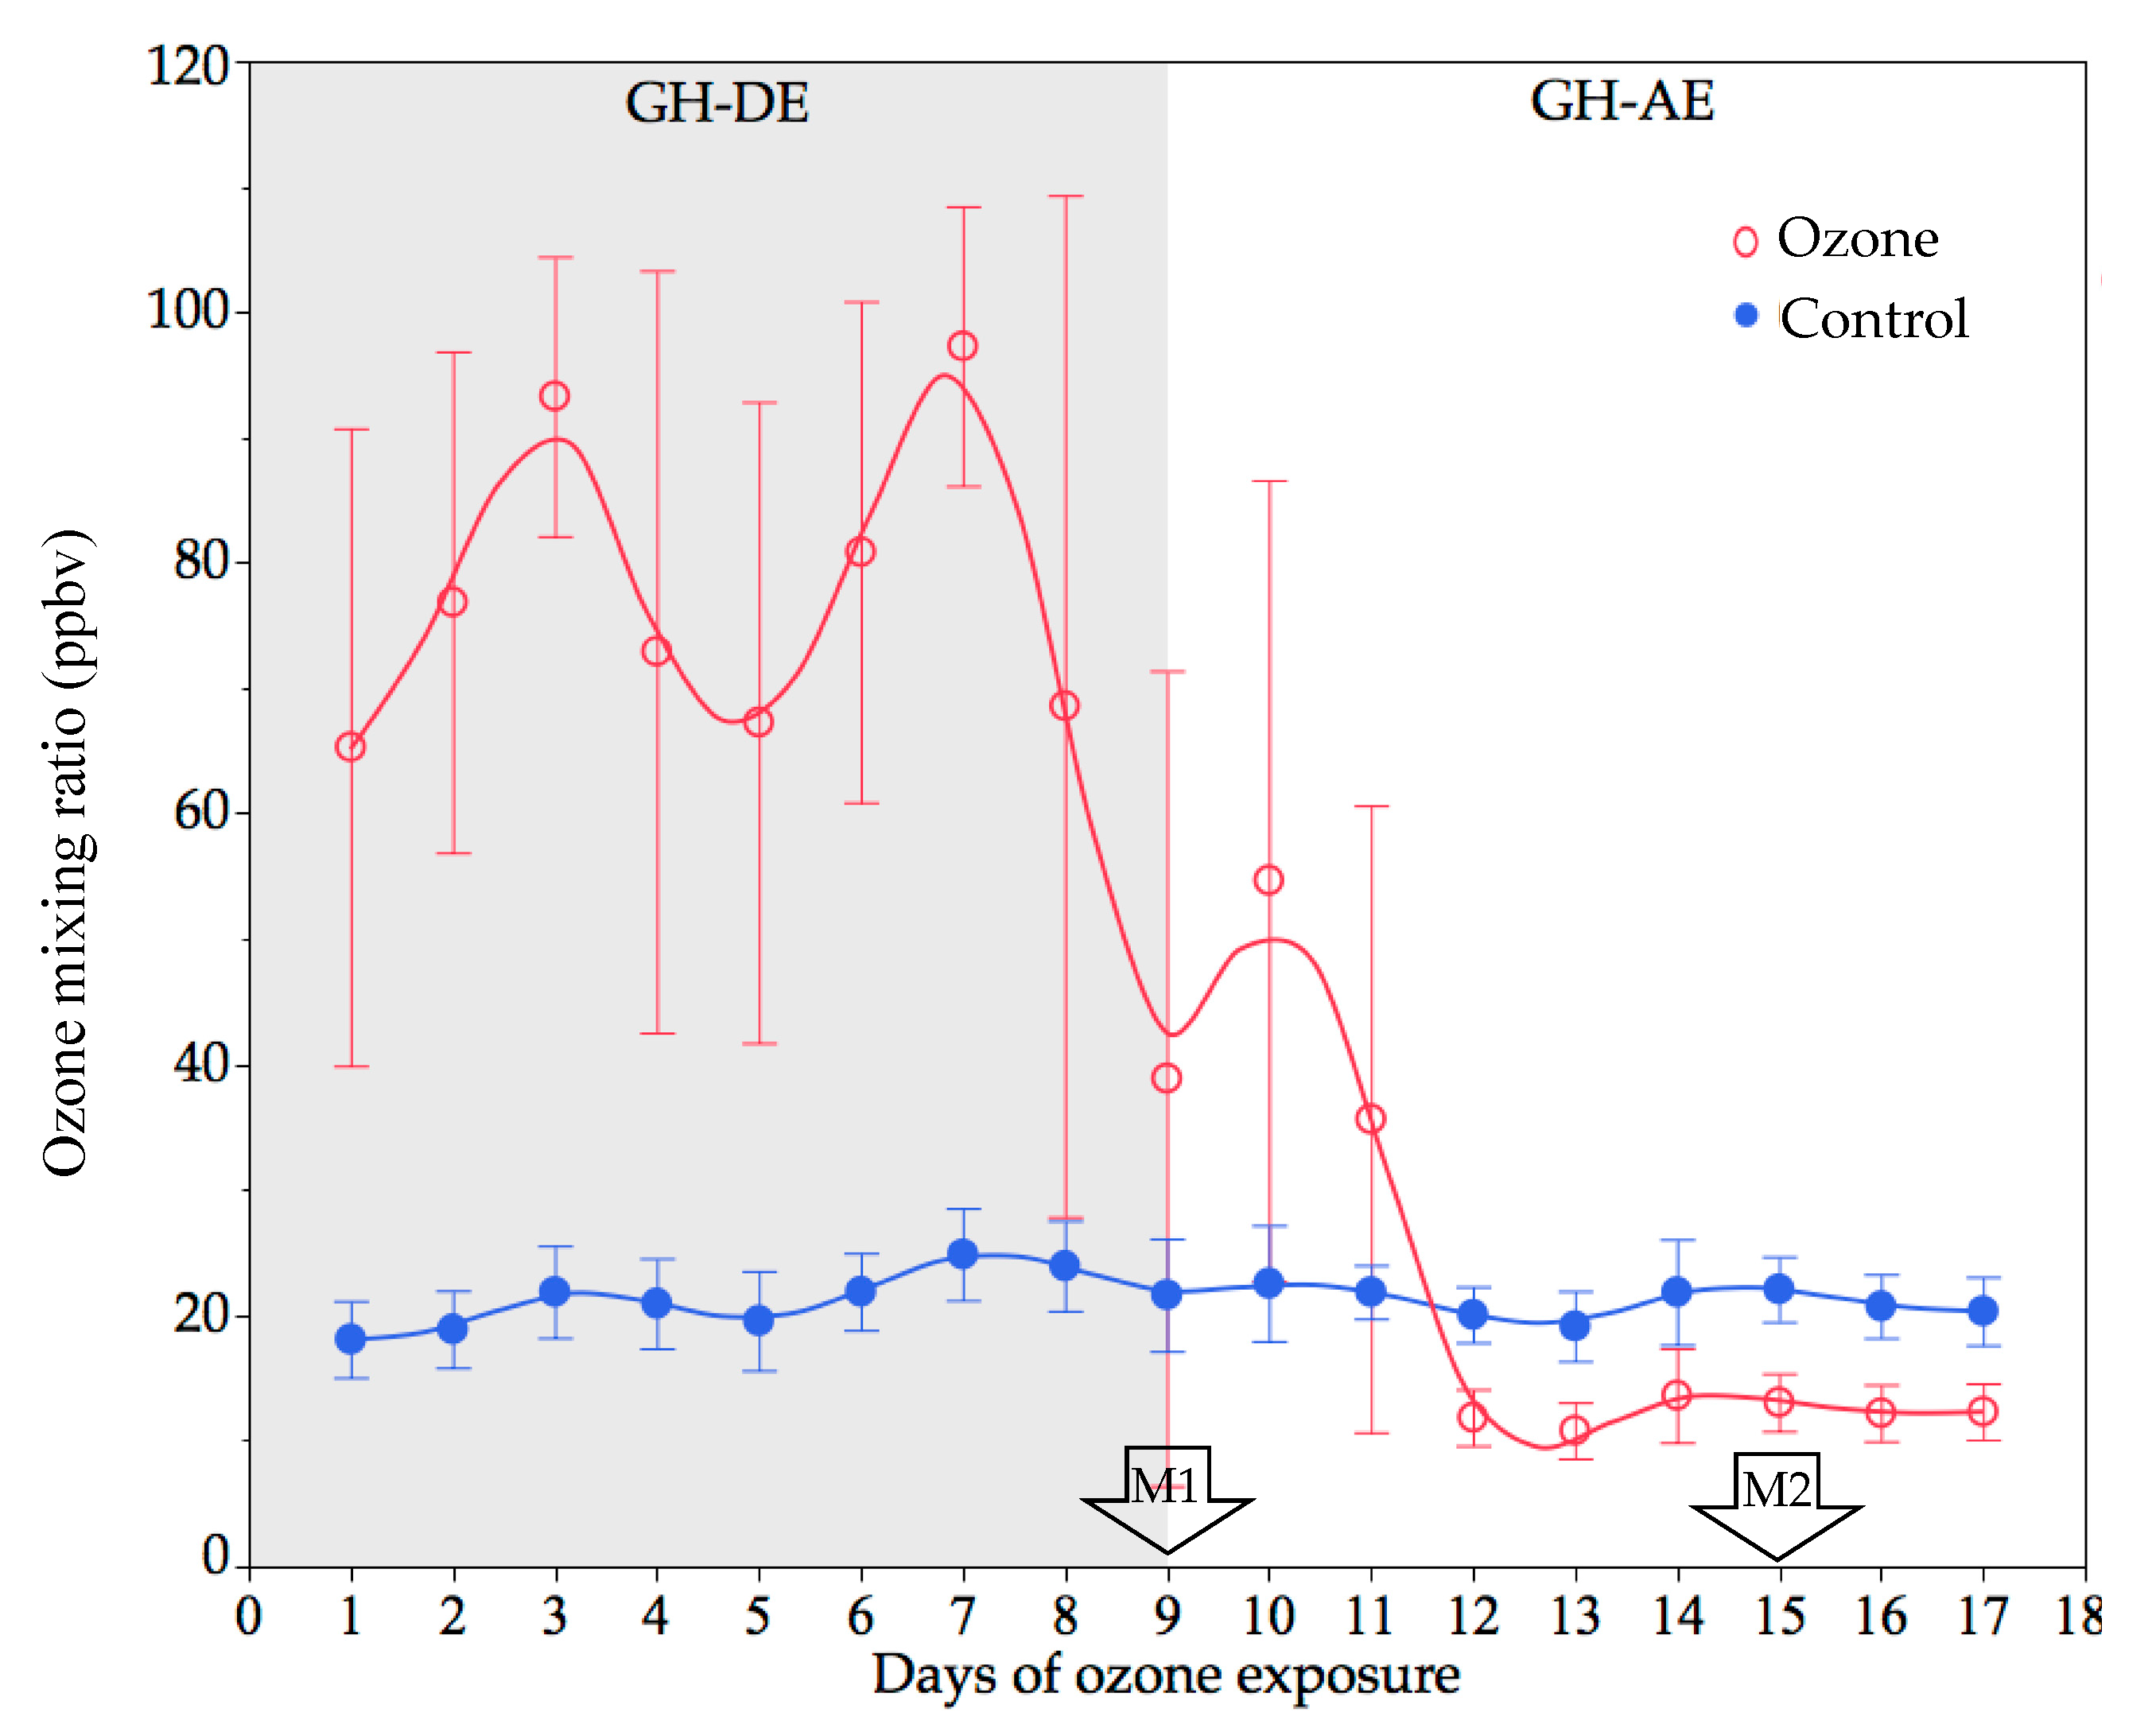
Five replicates per cultivar were exposed to acute doses of O3, 78 ± 27 ppbv 24 h mean during the exposure duration (Section 3.1; GH-DE) in one GH section. The same number of replicates of the three cultivars were placed simultaneously in an adjacent GH section with no O3 enrichment and used as a control (22.1 ± 4 ppbv). Both GH sections were exposed to similar meteorological conditions, which were continuously monitored through the installed sensors (Section 2.3). Wheat seeds were sown in 12 L capacity pots filled with commercially available plant potting mix. Pots were placed under cold and dark conditions until germination and then transferred to the phytotron with 10/16 °C (night/day), 8 h of light. At anthesis, pots were moved from the phytotron to the GH. Plants were irrigated daily using a controlled drip irrigation system and experienced mean T of 20 ± 9.9 °C, relative humidity (RH) 80 ± 12%, and photosynthetically active radiation (PAR) 305 ± 105 μmol m−² s−1. Meteorological conditions were recorded during the entire experimental period. Plants in the enriched O3 section were continuously (24 h) exposed to an acute O3 mean dose of 78 ppbv for 9 days (Figure 1). Physiological measurements were performed during O3 exposure (GH-DE) and repeated 5 days after O3 exposure termination (GH-AE), with plants kept at a low level of O3 recorded as 22 ppbv (Figure 1).
2.4. OTC Experimental Setup
Experiments were conducted in OTCs (control—OTC-CO) and exposed to elevated levels of O3 (OTC-EO). The OTC was constructed from a transparent perspex sheet. The length of the OTC was 3 m, and the height was adjusted to plant growth using panels of different heights. Initial OTC height was 1 m (from seed sowing until the emergence of the flag leaves). It was gradually increased to 1.5 m when the heading stage began and finally raised to 2 m at full emergence of the heads. All wheat cultivars were grown in replicate rows (n = 5) inside the OTCs with a distance of 15 cm between rows, as per standard agricultural practice. Plants were irrigated through the drip irrigation system according to their water requirement. O3 was pumped from the CH-ZTW O3 generator (Guangzhou O3 Electric Appliance Co., Ltd., Guangdong, China) and mixed with air before injection into the OTCs using a teflon pipe with a flow rate of 60 L m−3. The main Teflon pipe 4.5 m with 0.35 cm in diameter was divided into injection pipe outlets over each plant lane to produce uniform O3 distribution inside the chamber. OTCs were fumigated by O3 daily from ‘sunrise’ to ‘sunset’, approximately 07:00–17:00, throughout the experimental period. O3 sensors were placed 10 cm above the plant canopy (Model SM50, Aeroqual Ltd., Auckland, New Zealand) and calibrated weekly using a standard O3 calibrator (Model Thermo Scientific 49 i-PS, O3 calibrator primary standard, Franklin, Massachusetts, USA). During the season I, an average of 27 ppbv O3 (mean 7 h, 09:00–16:00) was recorded in OTC-CO vs. 36 ppbv O3 in OTC-EO from flag leaf emergence until the end of grain filling. During season II, cultivars in the OTC-EO were exposed to an average 71 ppbv O3 (7 h mean) from tillering until maturation, and OTC-CO cultivars were exposed to 31 ppbv O3.
2.5. O3 Fumigation and Monitoring
O3 (7 g h−1) was generated from an O3 generator; pure O2 was supplied from an O2 tank to the O3 generator to achieve the targeted O3 mixing ratios. O3 was fumigated over the plant’s canopy through a teflon pipe system. Five O3 sensors were installed and symmetrically distributed over the plants to record the O3 inside the experimental OTC, and one was installed inside the control OTC. A similar distribution of sensors is mentioned in Section 2.4. The recordings of measured O3 were collected using a data logger (Model CR800, Campbell Scientific, Logan, UT, USA) at 10 min intervals.
Before installation and weekly during the experiment, each O3 sensor was calibrated by an O3 calibrator. T, RH and PAR was measured continuously inside the GH and the OTCs using T and RH sensors (Model 083E-L, Campbell Scientific) and a PAR quantum sensor (Model PQS1, Kipp & Zonen B.V., Delft, The Netherlands), respectively. The data were recorded every 10 min and collected by the logger (Model CR1000, Campbell Scientific). At the OTC experimental setup site, during both seasons I and II, ambient O3 and meteorological data were recorded from the station, i.e., T, RH and PAR using a T and RH sensor (Model HMP155, Vaisala, Helsinki, Finland) and PAR sensor (Model CM11, Kipp & Zonen), located 20 m from the OTC experimental setup.
2.6. O3 Exposure Indices and Meteorological Parameters
Evaluation of the exposure level of the plants to O3 concentration used the following O3 metrics: (i) 12 h daytime (M12; 08:00–19:59) and 7 h daytime (M7; 09:00–15:59); (ii) AOT40 in ppmh, representing the hourly mean O3 mixing ratios accumulated over a threshold O3 concentration of 40 ppbv during the daylight hours of the whole growing season, as given by Fuhrer et al. [26].
The ambient 24 h mean O3 concentrations for the experimental duration were 15 ppbv (season I) and 28 ppbv (season II). Corresponding RHs in seasons I and II were 66 ± 13% and 60 ± 14%, and recorded rainfalls were 299 and 286 mm, respectively.
2.7. Physiological Measurements
Gas-exchange measurements (photosynthetic rate; Ps, stomatal conductance; gs, intercellular CO2) were carried out on a randomly selected fully expanded flag leaf using the portable photosynthesis system (LI-6400 XT) with an attached 6400–40 leaf chamber fluorometer (LICOR, Lincoln, NE, USA). Along with standard photosynthetic gas-exchange parameters, the actual photochemical efficiency of photosystem II in saturated light (Fv′/Fm′) was logged by the portable photosynthesis system. Before each set of measurements, the assimilation chamber conditions were maintained at 60–70% RH, leaf T was set at 20 °C, and CO2 concentration was maintained at 400 ppm in the leaf chamber. The flow rate was set to 300 µmol s−1, and the flag leaf was illuminated with a photosynthetic photon flux density of 1500 µmol m−2 s−1 via LED light source present in the internal light chamber.
For the GH experiments, measurements were performed during and after O3 exposure (GH-DE and GH-AE, respectively) and on the respective controls (Figure 1), with three replications per treatment. In the OTC experiments, measurements were carried out on five replicates of each cultivar from both control and O3-enriched OTCs. Measurements on flag leaves were carried out according to the phenological development of the cultivars, at heading, anthesis, and grain filling stages (Table 2).
The response curves of CO2 assimilation rate (A) to intercellular CO2 (Ci) concentration, namely the A/Ci curves, were recorded for the flag leaves using an automatic A/Ci curve program with a portable gas exchange system. The steady-state rate of net photosynthesis (A) was recorded at 11 concentrations of external CO2: 400, 300, 200, 100, 50, 400, 600, 800, 1000, 1200, and 1400 ppm. There was a minimum 120 s and a maximum 180 s wait time for the instrument to reach the required CO2 concentration under saturating irradiance of 1500 µmol m−2 s−1 at a leaf T of 20 °C and RH of 60–70%. A/Ci response curves data were recorded automatically four times to ensure data stability. The maximum carboxylation rate allowed by Rubisco designated Vcmax and the electron transport rate for RuBP regeneration and designated as J were determined by subjecting A/Ci curve data, which were obtained for each flag leaf using curve fitting according to Sharkey et al. [27]. The program followed the model proposed by Farquhar et al. [28] suggesting an A/Ci response curve of photosynthetic CO2 assimilation versus CO2 inside the leaf based on the notion of a calculated CO2 partial pressure inside a leaf.
2.8. Yield Data Measurement for OTC Experiments
Plants were sampled at maturity from each replicated row (n = 5) of cultivars excluding the plants at the edge of the chamber (0.25 m from each side) for both control and O3-enriched OTCs. Plants were oven-dried at 60 °C up to a constant weight to determine biomass and yield components.
2.9. Statistical Analysis
Both experiments, GH and OTC, were randomly designed as a nested model assigning the main plot to the O3 treatment and the subplot to the cultivar. For each experimental condition (GH and OTC), analysis of variance (ANOVA) for each variable was performed with factors ‘O3’ and ‘cultivar’. O3 and Cv × O3 effects could be potentially confounded due to variations in soil properties across the two chambers, although such variations are not probable considering soil homogeneity in the study area and the short distance between the two OTCs (~1 m).
The study area was selected to ensure homogeneity soil properties and irrigation level across the experiment and the control OTCs, which were distanced 1 m from one another with no mutual shading. No previous ozone exposure experiment was performed in the research area. Therefore, a nested model was selected for statistical analysis showing the effects of O3 and cultivar within O3, Cv(O3). For the OTC experiment, statistical analysis was conducted after binning the physiological data and grouping according to the phenological stage of the cultivar (See Table 2). The Student’s t-test was used to compare each cultivar’s assessed parameters between controls and their respective O3 treatment across phenological stages in OTC and GH experiments. Discriminate analysis and bivariate correlation were performed on the physiological parameters data derived from the percent difference between O3 and control for the joint GH and OTC data set. All data are presented as mean ± standard error of the mean (mean± SE) of cultivar replicates with a significance level set at p ≤ 0.05. Statistical analysis was performed with JMP 13 software (SAS Institute, Cary, NC, USA).
3. Results
3.1. O3 Concentration and Meteorological Parameters
3.1.1. GH Experiment
Average 7 h O3 mixing ratios for the O3-enriched GH during exposure (GH-DE) and after exposure (GH-AE) were 102.8 and 23 ppbv, respectively (Figure 1), while the former was compared to a control of O3 = 22 ppbv. M1 and M2 represent the physiological measurements during O3 exposure and 5 days after the end of the exposure, respectively.
3.1.2. OTC Experiment
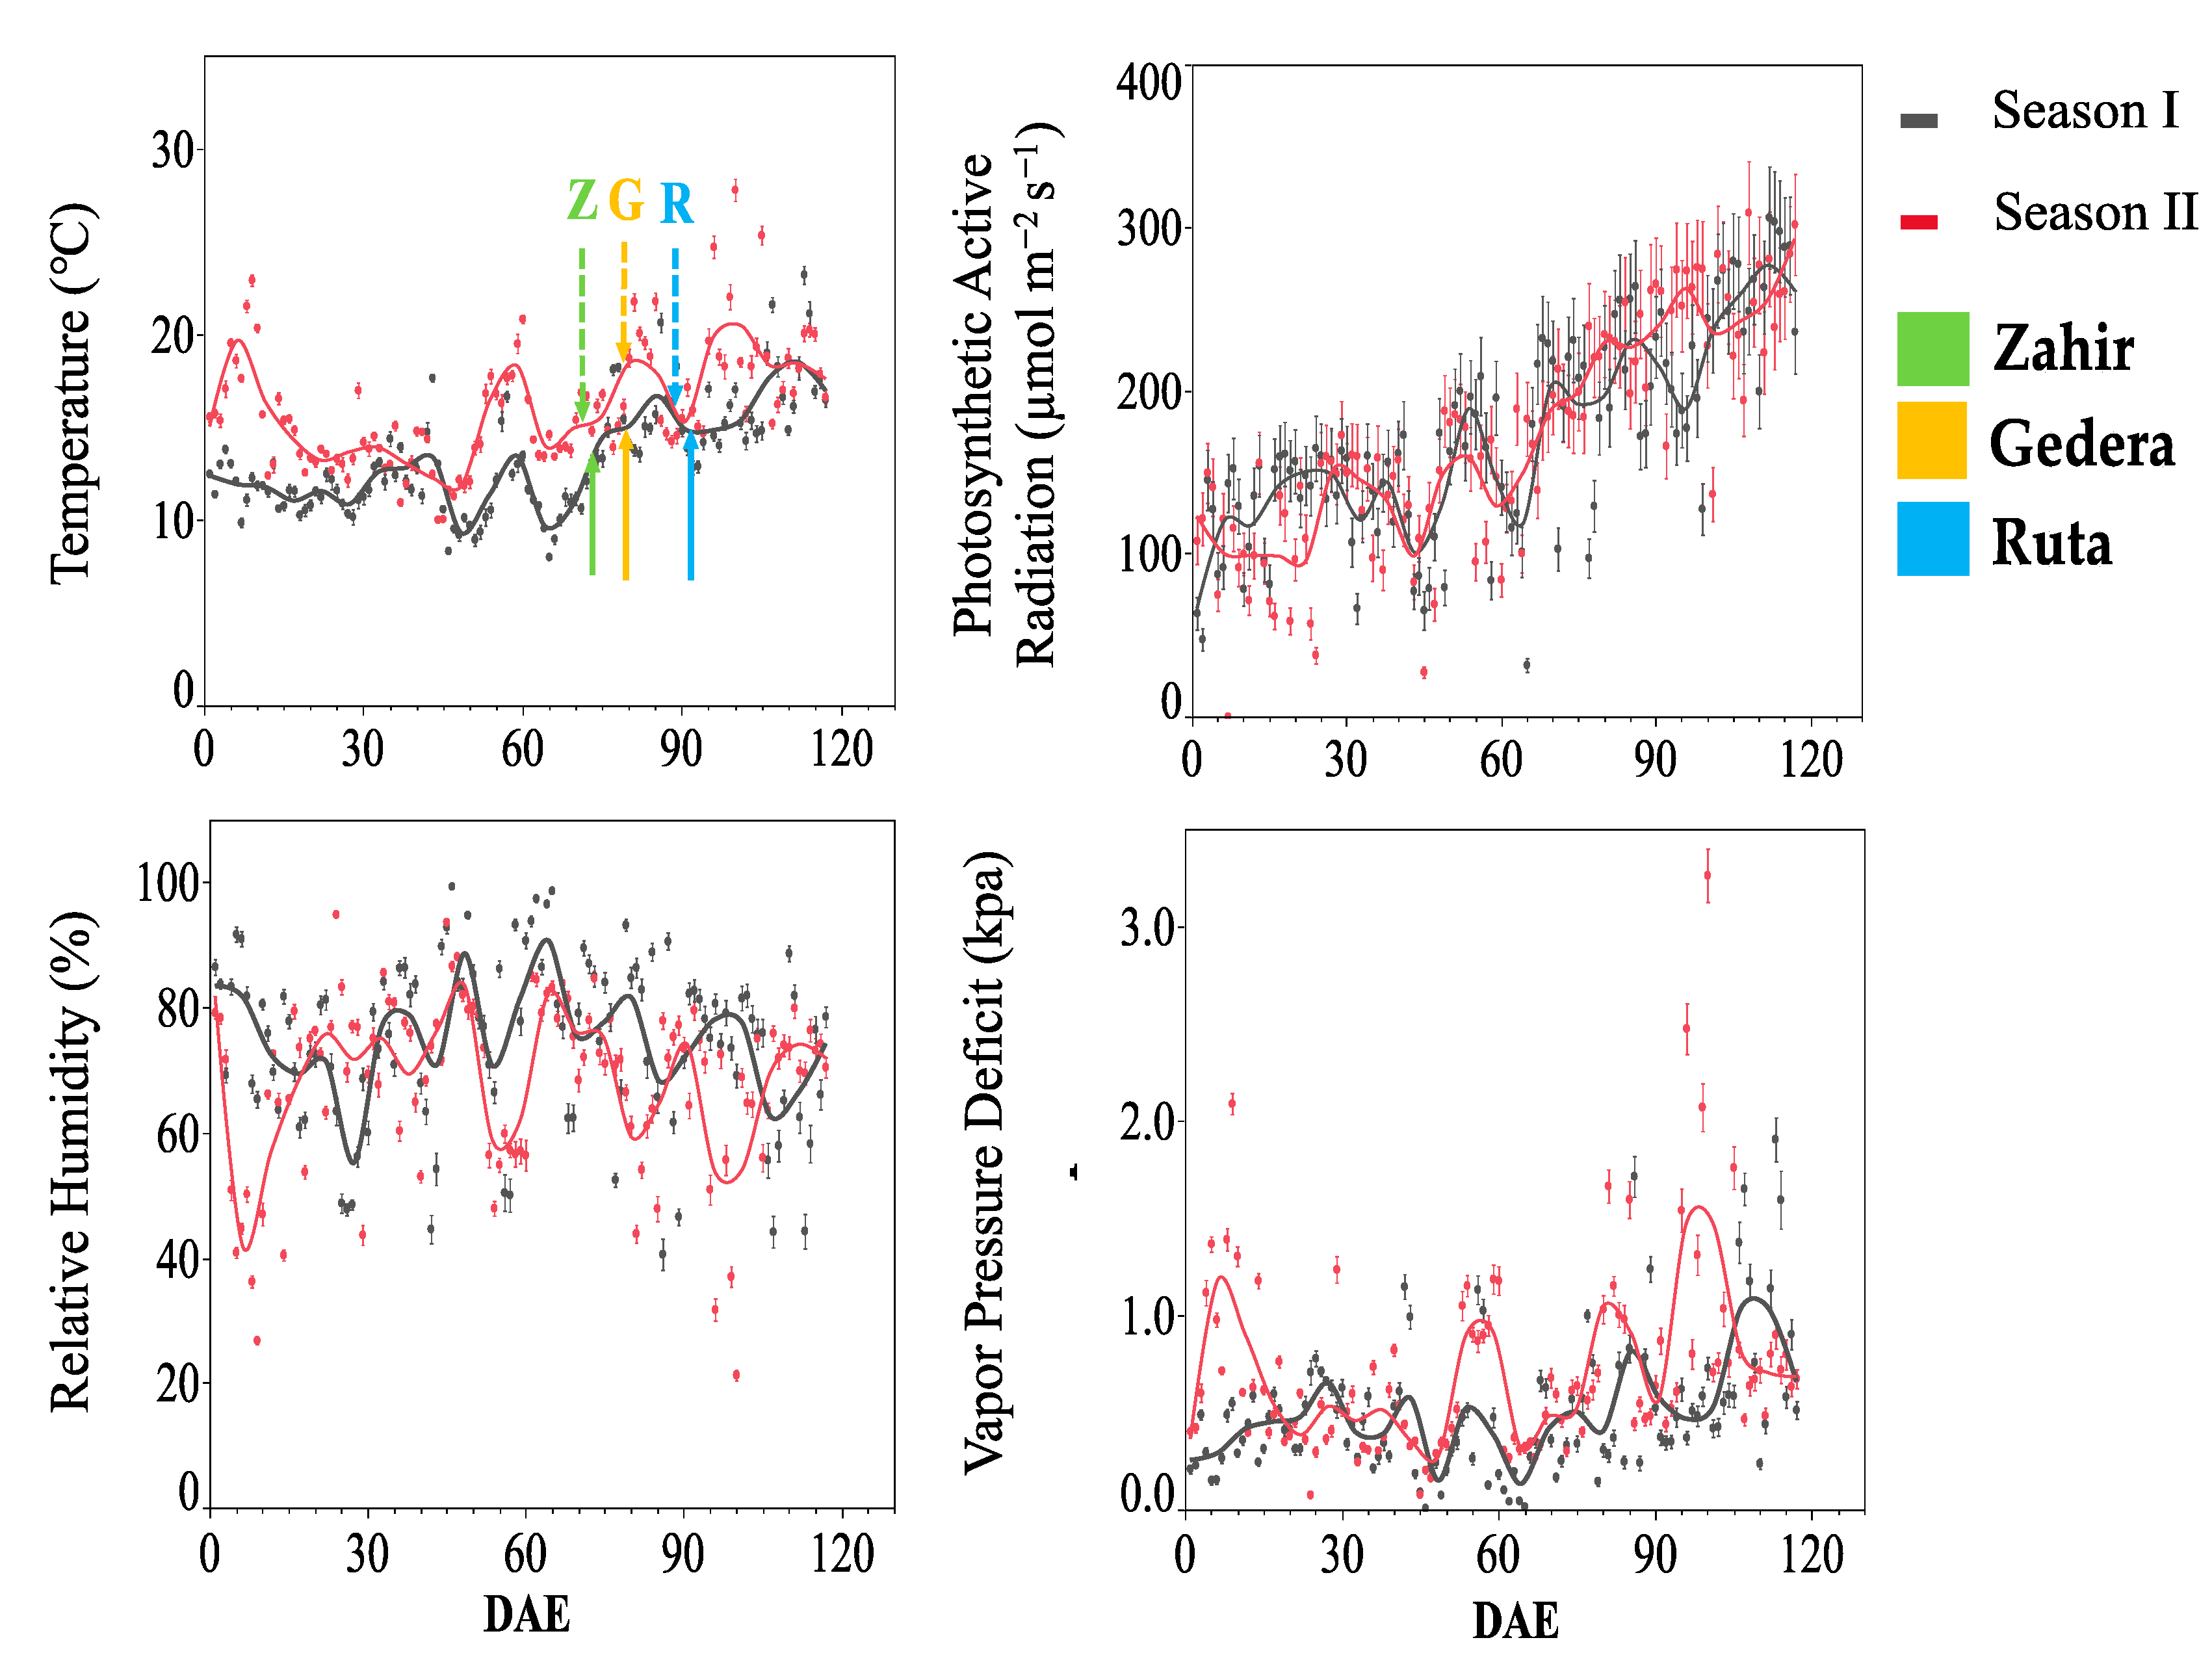
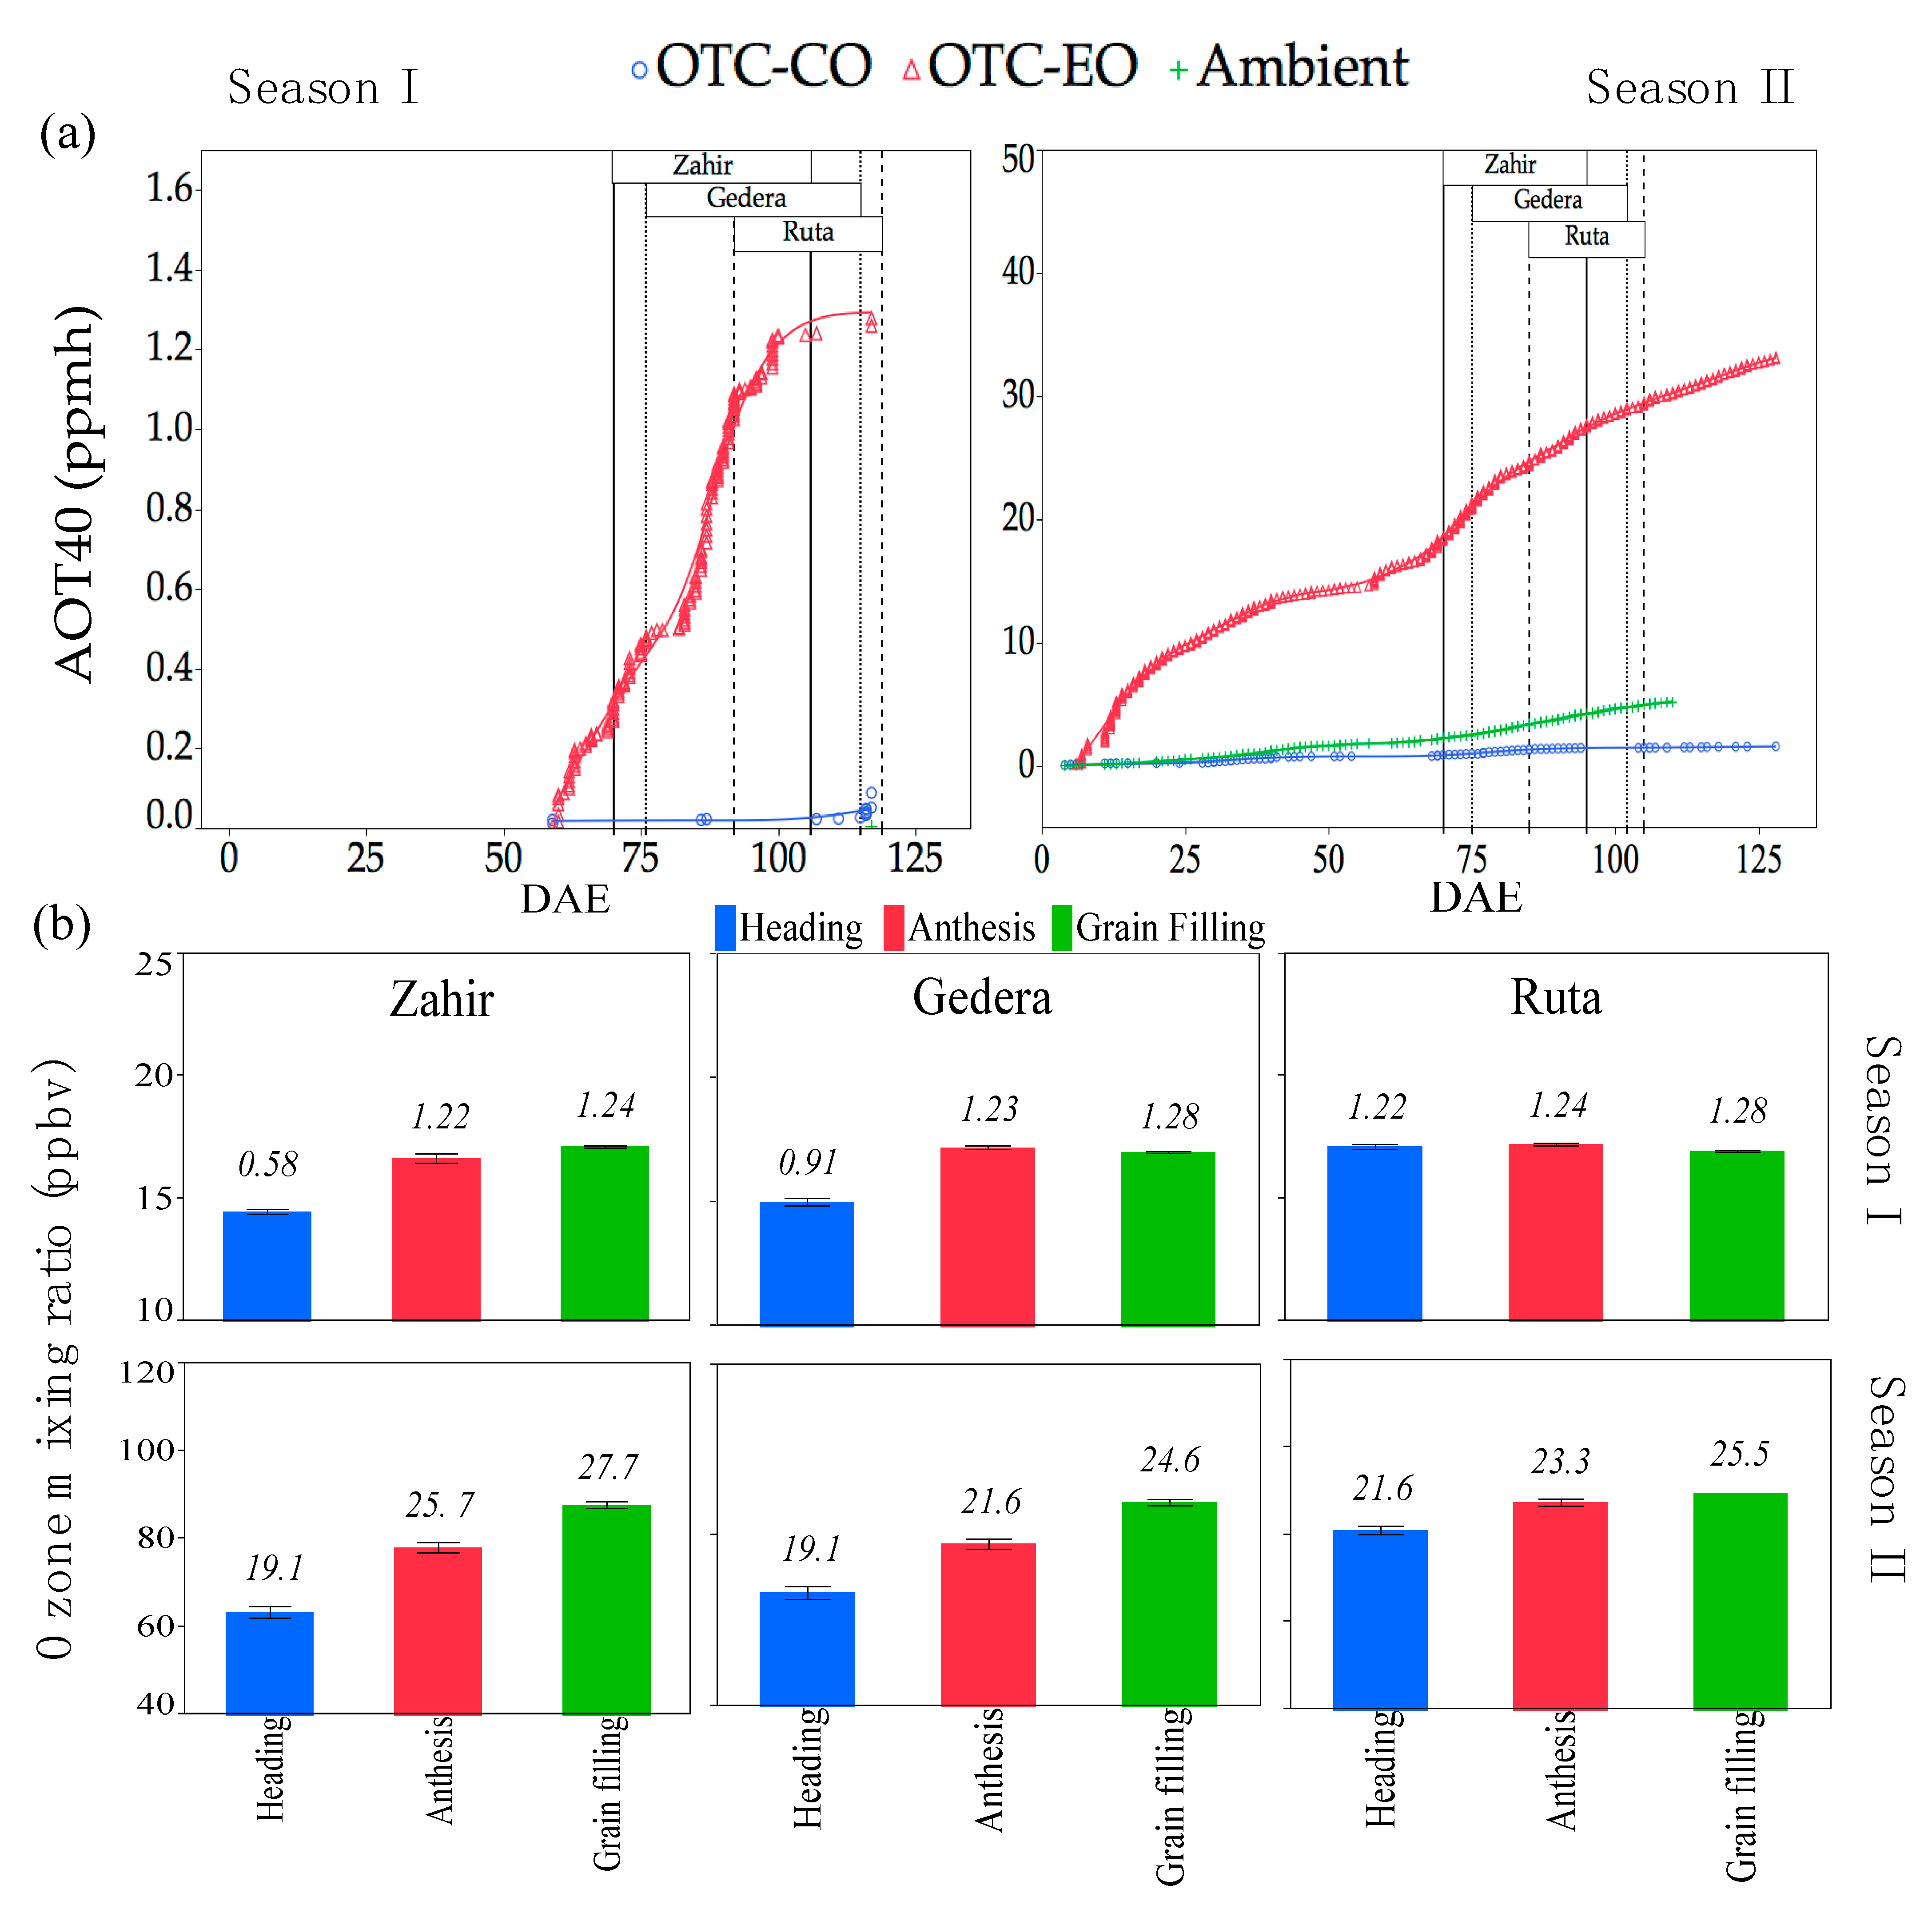
Meteorological data (24 h means) for T, RH, VPD, and global solar radiations are shown in Figure 2. Ambient air showed higher T and VPD for season II than for season I, from emergence until maturity of the cultivars, particularly up to the end of the grain-filling stage. Environmental conditions inside and outside the OTC suggested that plants inside the OTC were experiencing near-natural conditions (see Figure S4). Table 3 presents the data of O3 mixing ratios in the OTCs and ambient air for both seasons. Higher concentrations of O3 were recorded in season II compared to season I, associated with higher AOT40 for the former. Cultivars experienced slightly different O3 exposure according to their phenological development (Figure 3). Data of the physiological measurements were grouped according to the plant phenological stage (Table 2). The running averages of the O3 mixing ratios and AOT40 for each cultivar during heading, anthesis, and grain filling are shown in Figure 3B. Cultivars that had earlier phenological development (and flag leaf sheath opening) experienced lower O3, especially at the heading stage, as seen, for instance, for ‘Zahir’ in Figure 3B. However, note that AOT40 in season II was ~15-fold higher than in season I.
3.2. Foliar Injury
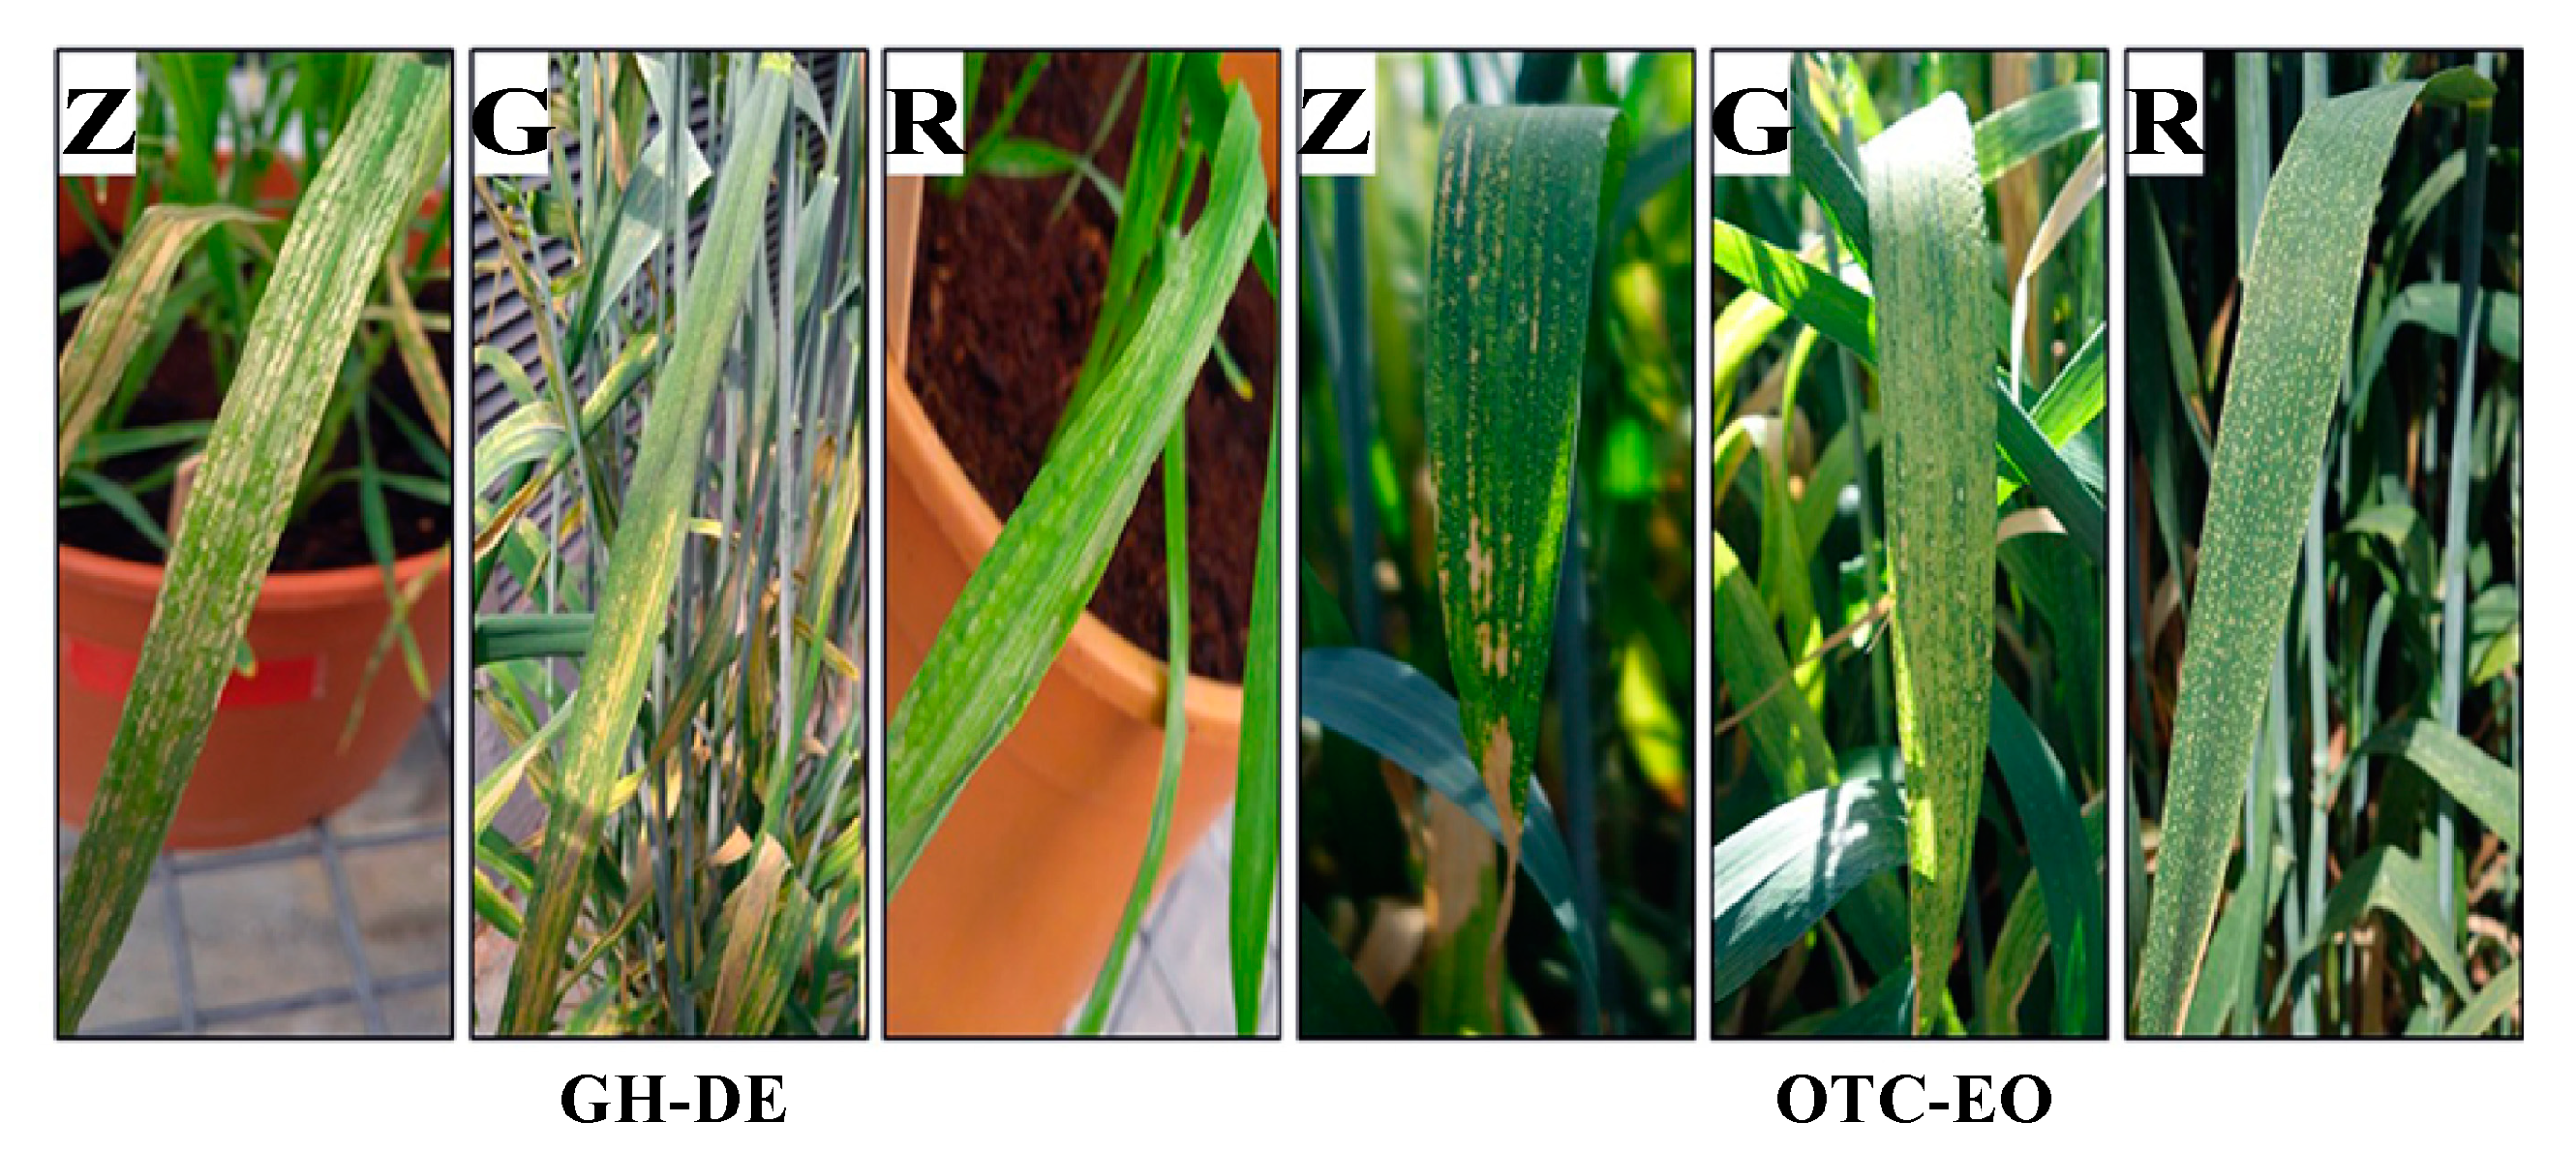
Foliar injury symptoms appeared within 2 days of continuous exposure of plants to high O3 in the GH (GH-DE) (Figure 4). After terminating the O3 exposure (GH-AE), foliar injury symptoms persisted in all cultivars but did not extend to necrosis. Damage appeared on the adaxial surface of the leaves as small pale-yellow blotches between the veins, which is a typical response to exposure to O3 [29]. In season I, plants exposed to slightly higher levels of O3 in the OTC did not exhibit significant visible damage. In season II, plants under moderately high O3 exposure from their initial growth stage in the OTC showed foliar injury symptoms from anthesis in all cultivars (Figure 4).
3.3. Physiological Measurements
3.3.1. GH Experiment
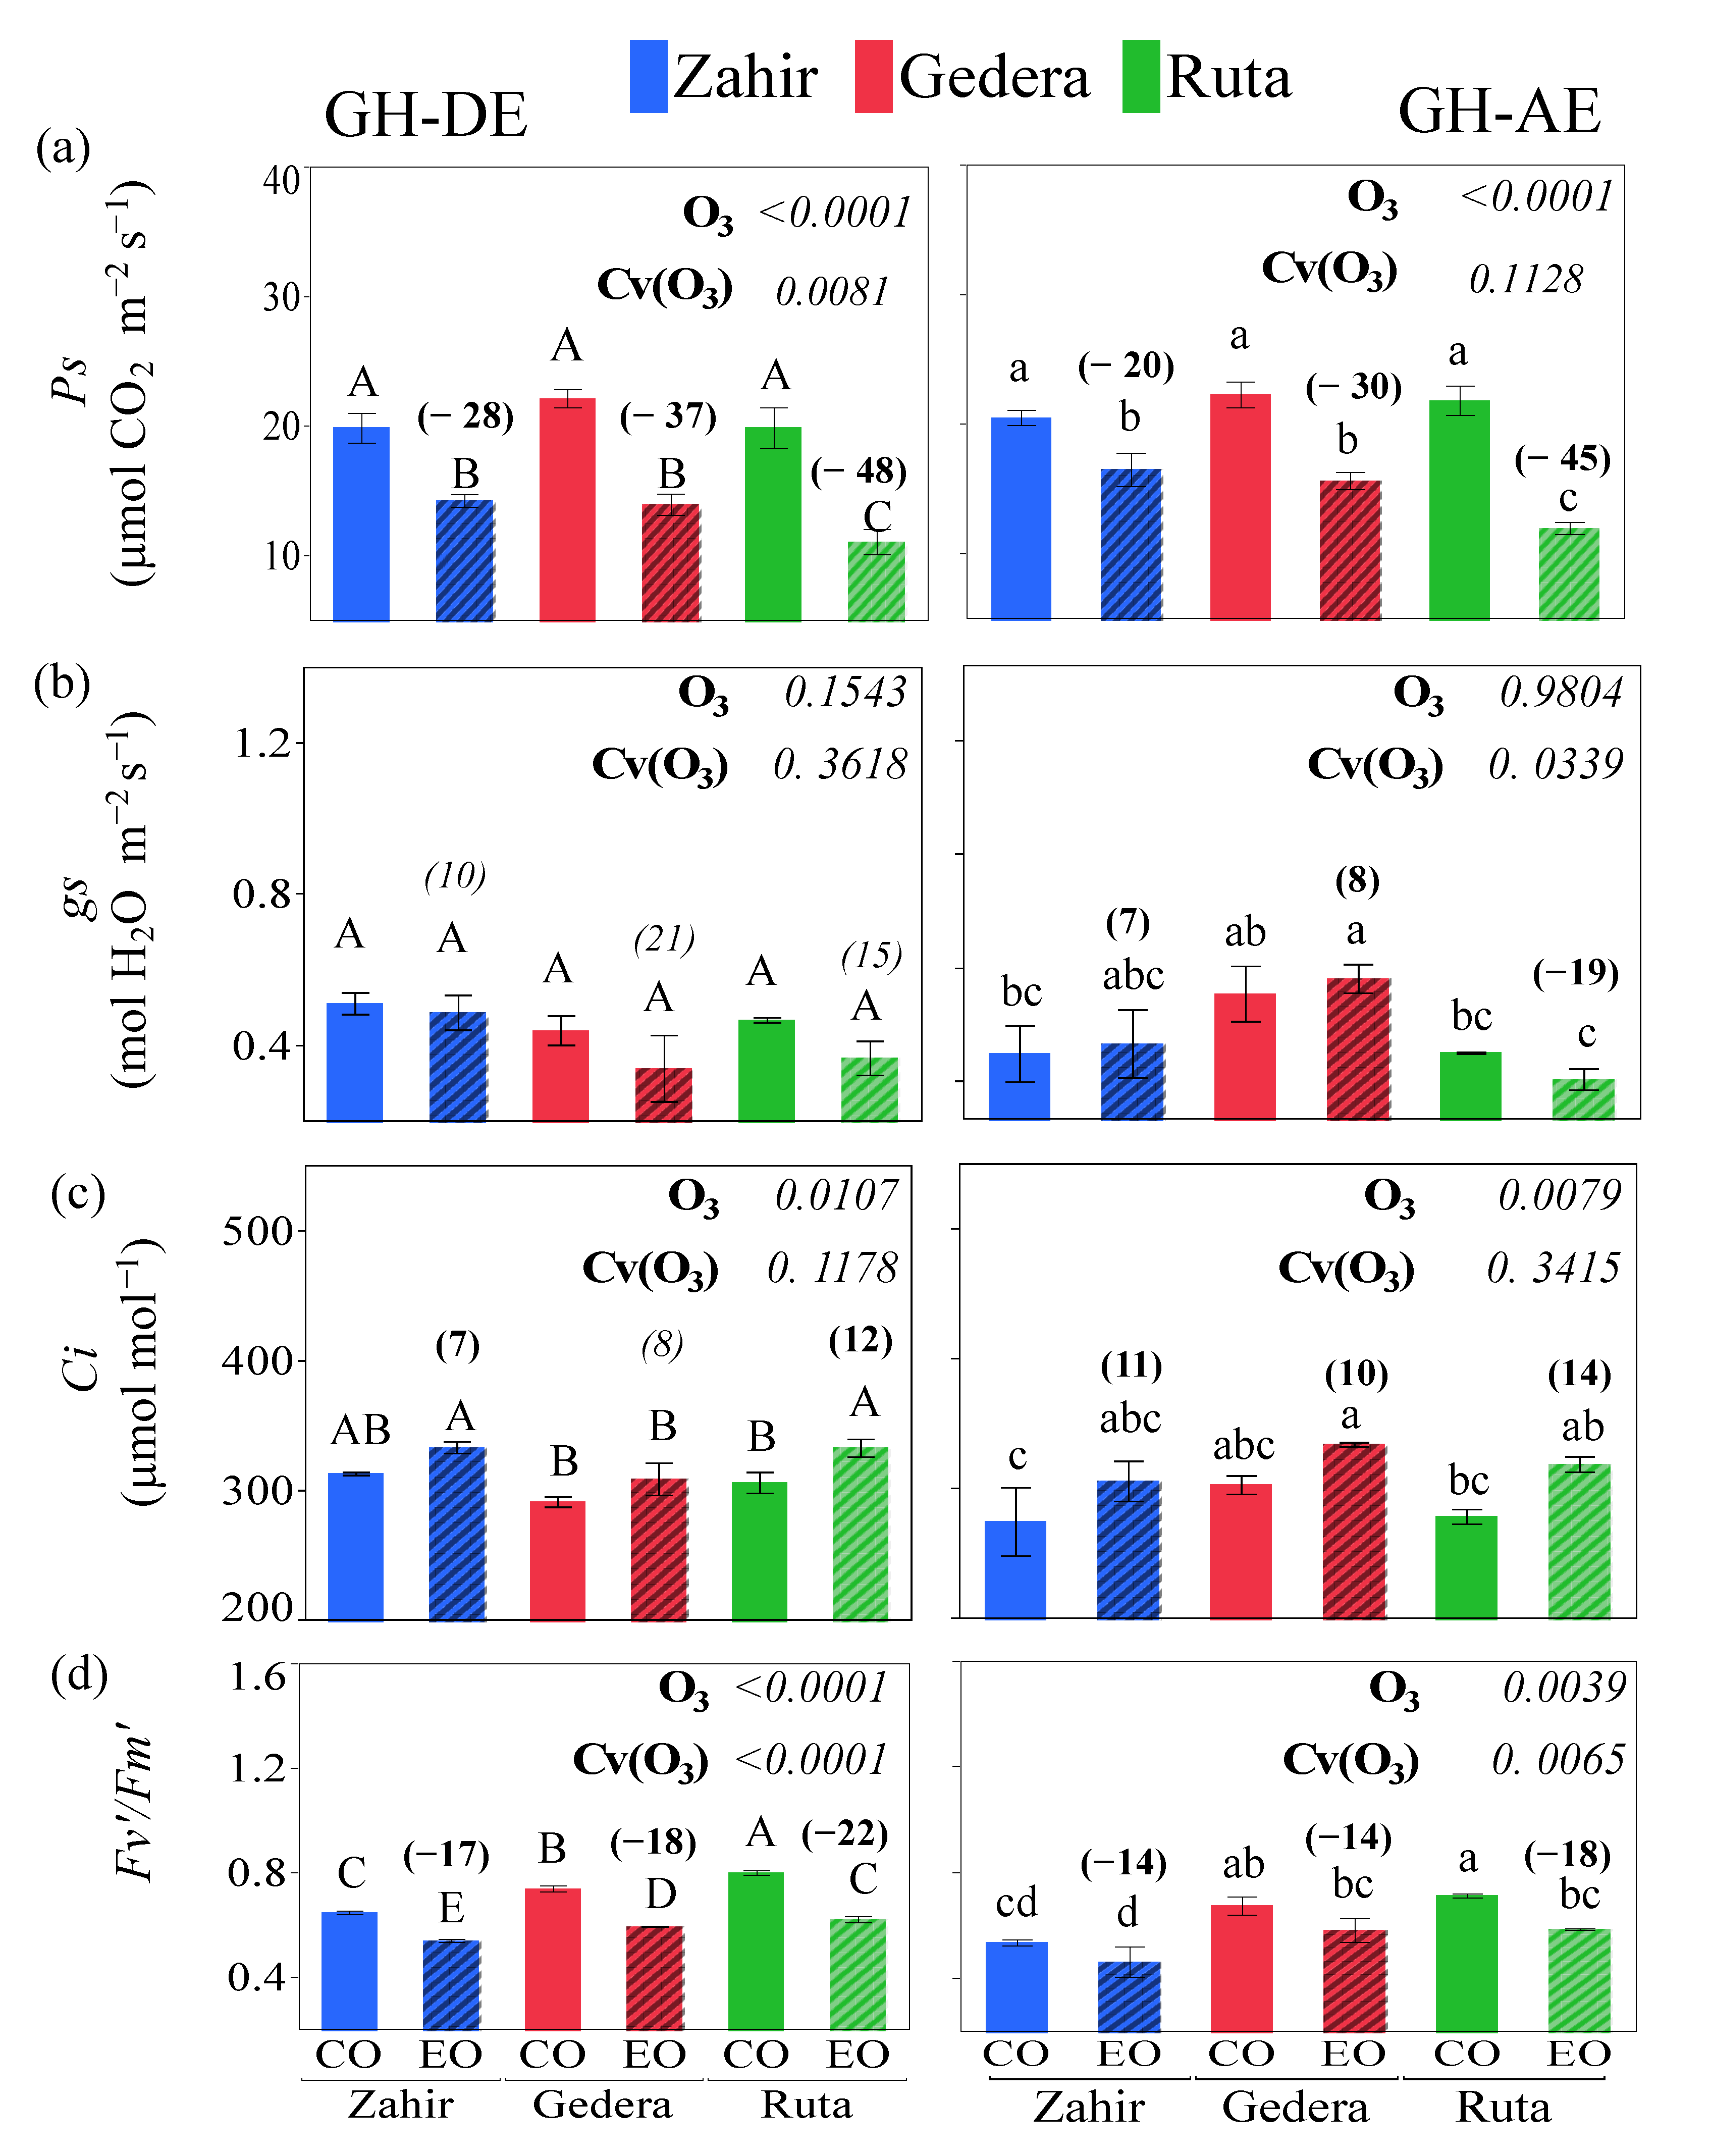
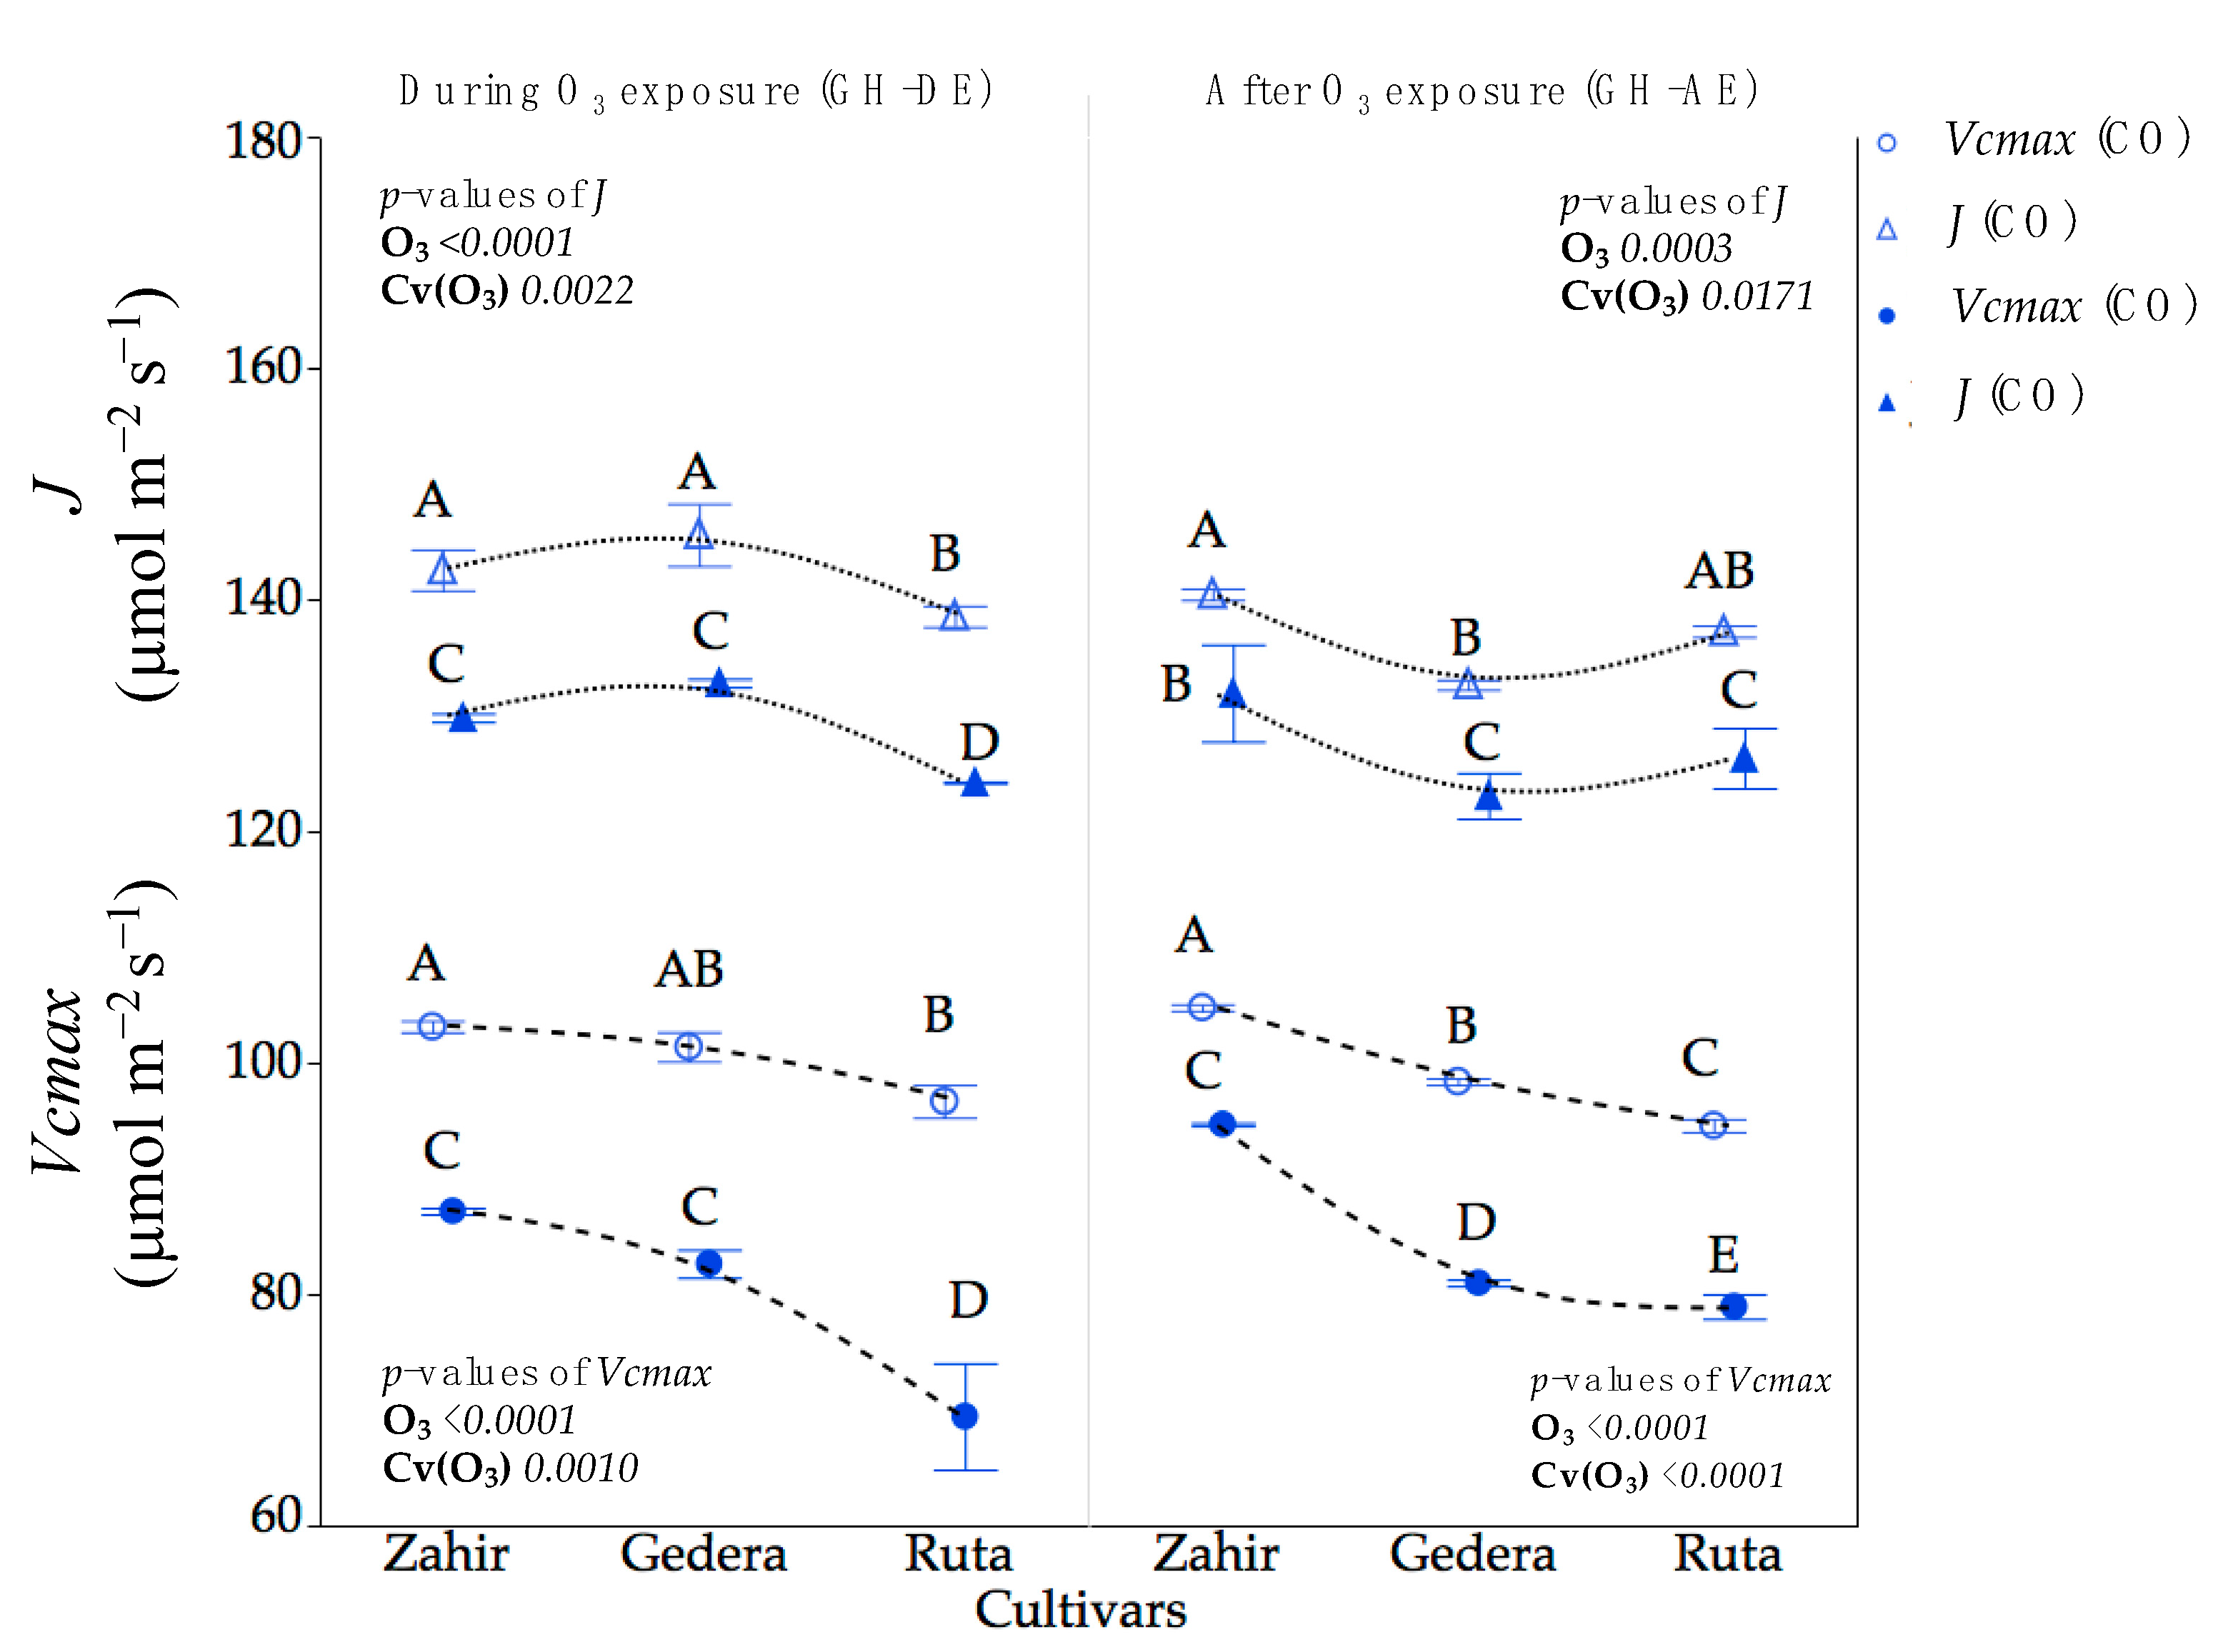
ANOVA showed statistically significant differences in physiological parameters according to O3 exposure and cultivar effects for GH-DE and GH-AE (Figure 5). The physiological measurements are shown individually for each cultivar in Figure 5. Ps and Fv′/Fm′ decreased, whereas Ci increased and gs exhibited varied responses between the O3-enriched GH and the corresponding control for both GH-DE and GH-AE. The least reduction in Ps was observed in ‘Zahir’ consistently for GH-DE and GH-AE, whereas ‘Ruta’ showed the largest reduction under both GH-DE and GH-AE (Figure 5a). A reduction of 15.3% in gs was observed without a cultivar effect for GH-DE. For GH-AE, ‘Gedera’ and ‘Zahir’ showed increases of 7% and 8% in gs, respectively, whereas a reduction of 19% was observed in ‘Ruta’ (Figure 5b). An increment in intercellular CO2 (Ci) was observed in all cultivars under O3 enrichment compared to their controls during O3 exposure (GH-DE) and afterward (GH-AE) (Figure 5c). The actual photochemical efficiency of PSII in saturated light designated Fv′/Fm′ decreased significantly in all cultivars, both during O3 stress and after recovery. Maximum reductions of 22% and 18% were observed in ‘Ruta’ in GH-DE and GH-AE compared to control plants, respectively (Figure 5d). The A/Ci response curves to O3 exposure during GH-DE and GH-AE for the three cultivars are shown in Figure S2. Under both GH-DE and GH-AE, the photosynthetic rate started saturating at 600 µmol mol−1 in all cultivars. Vcmax was reduced during and after the O3 exposure in all cultivars; however, insignificant reductions in J were recorded except Gedera at GH-DE (Figure 6). During exposure (GH-DE), Vcmax of ‘Gedera’, ‘Ruta’, and ‘Zahir’ decreased by 18.5%, 28.2%, and 15.4%, respectively. However, comparatively lower reductions, 17.7%, 16.6%, and 9.7%, were observed after the termination of O3 exposure in ‘Gedera’, ‘Ruta’, and ‘Zahir’, respectively (Figure 6).
3.3.2. Physiological Measurements in OTC Experiments during Seasons I and II
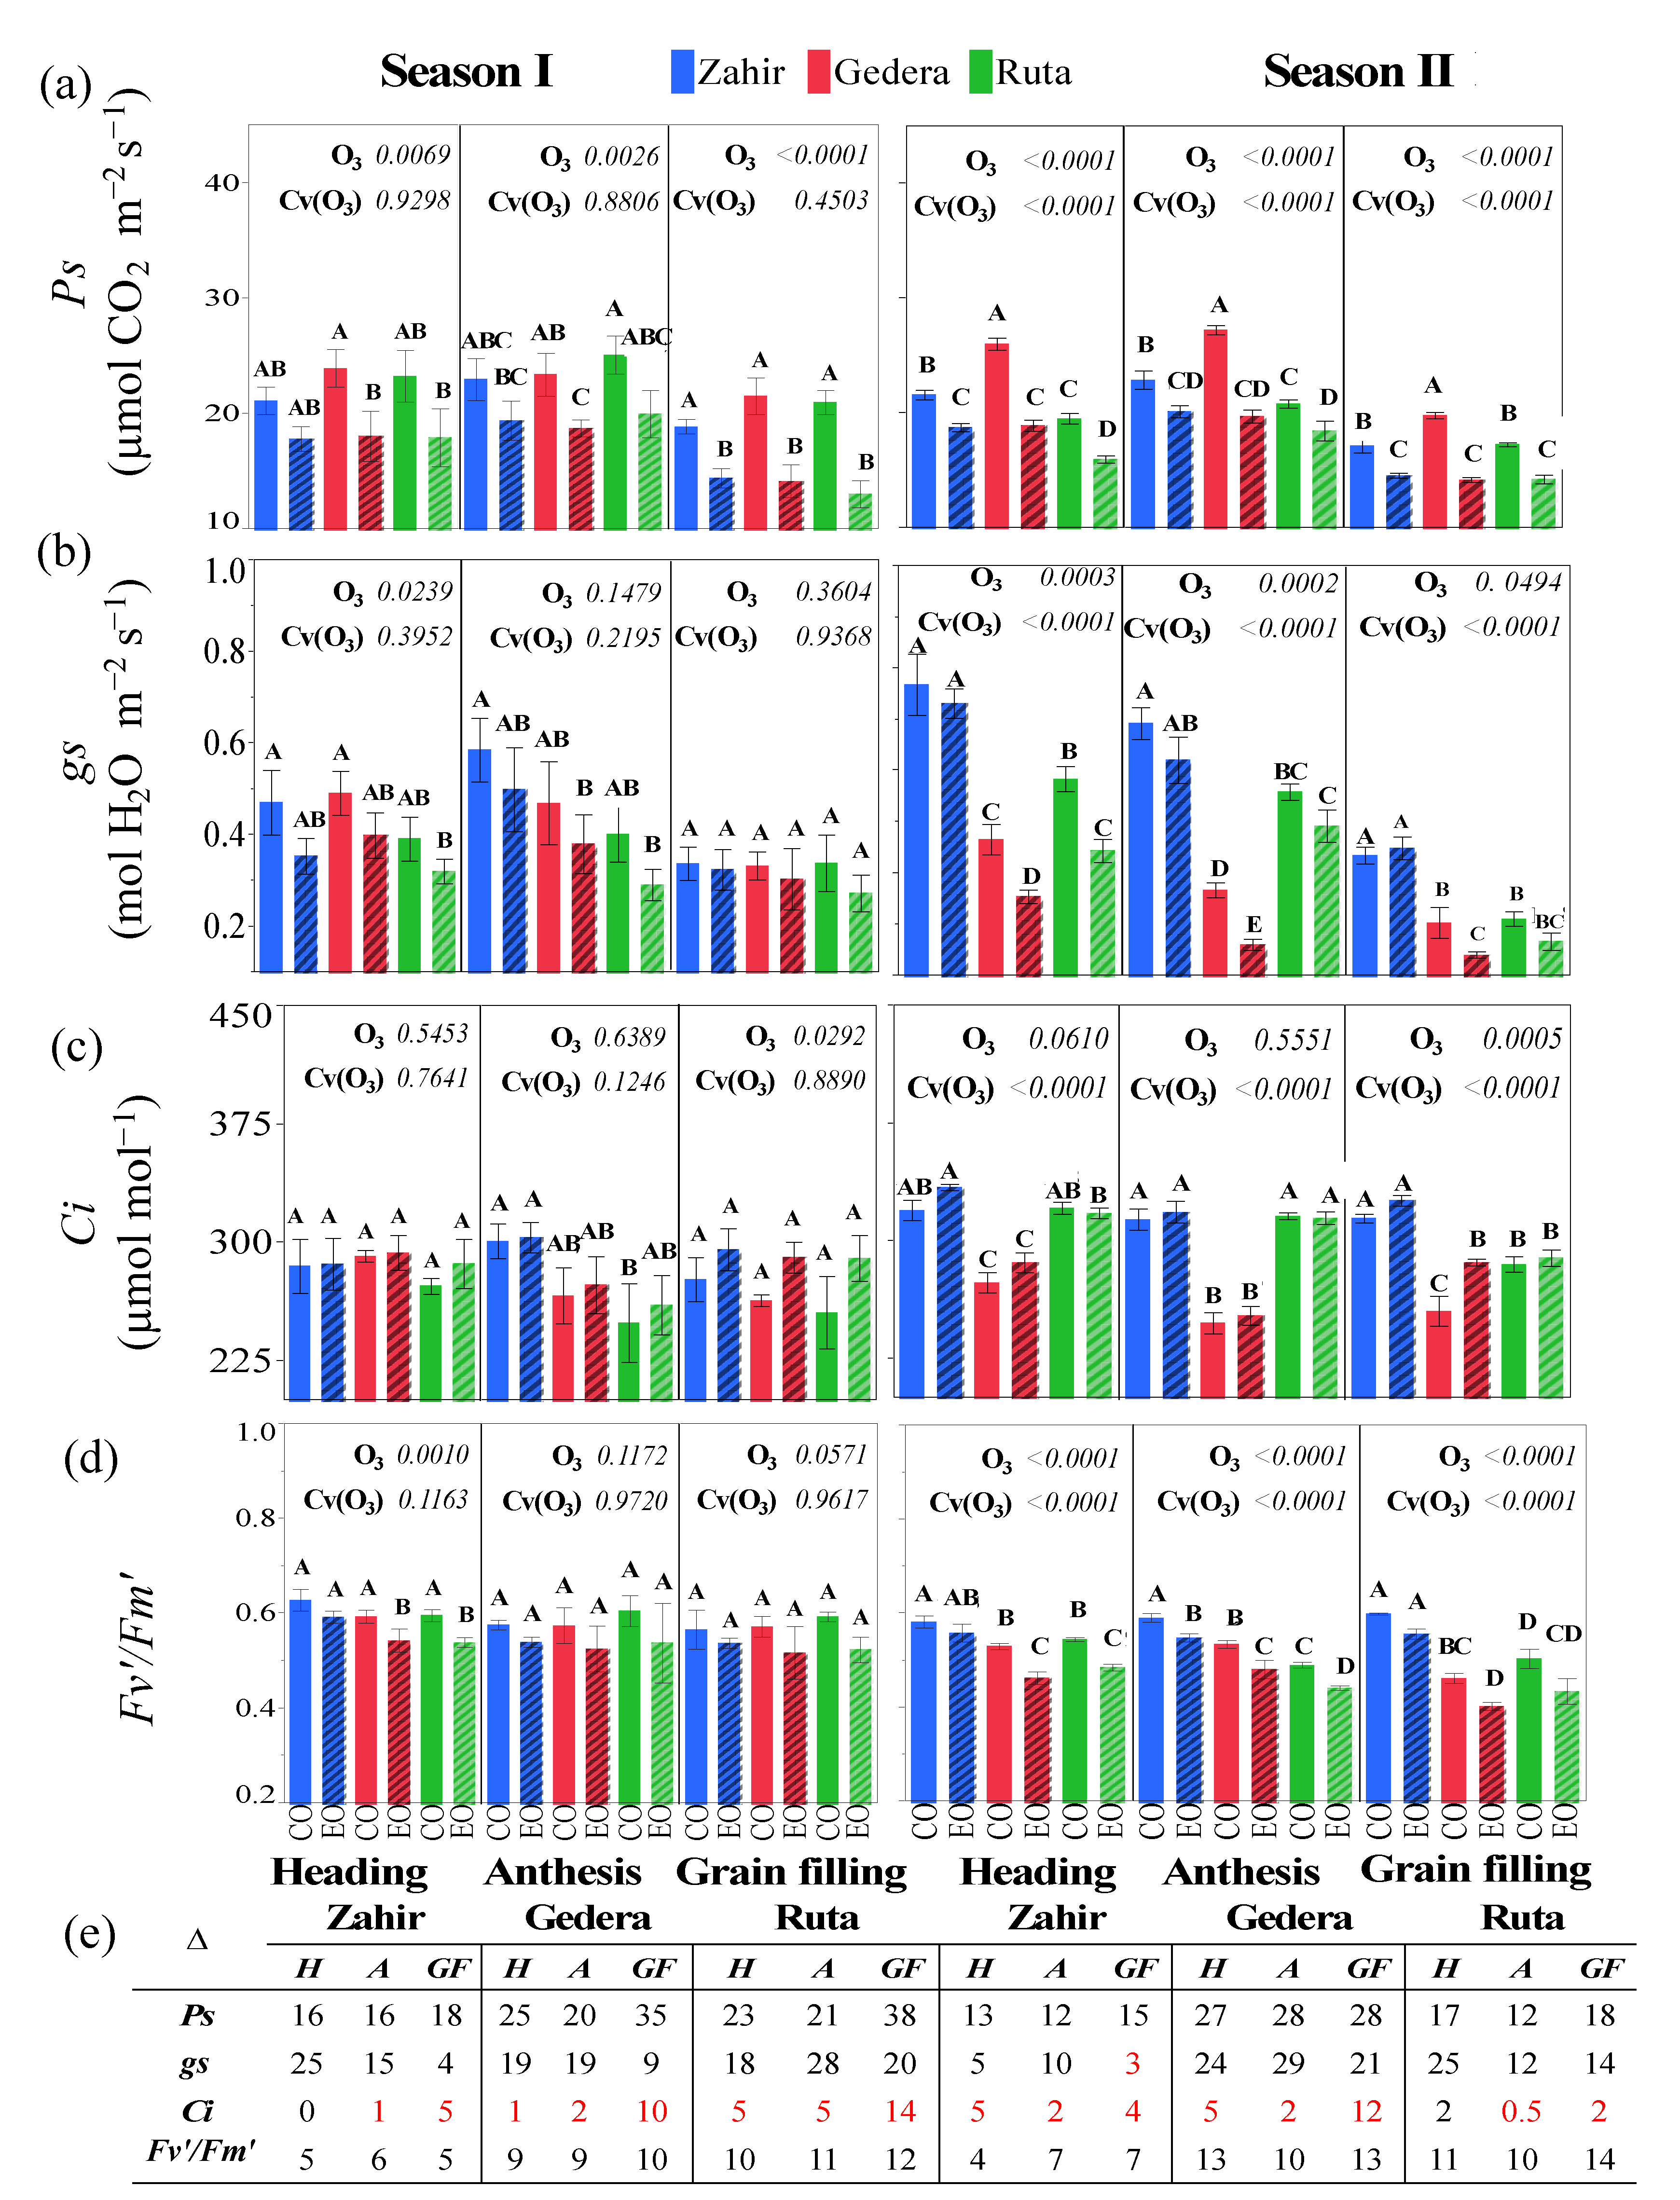
In season I, ANOVA results showed a statistically significant reduction in Ps due to O3 exposure. However, statistically insignificant responses across cultivars at all phenological stages were observed for Cv(O3). Variations in the gas-exchange responses (Ps, gs, Ci, and Fv′/Fm′) of each cultivar exposed to a higher level of O3 in OTC-EO vs. OTC-CO were noted in both seasons I and II (Figure 7a–d). More statistically significant ANOVA results were observed in season II vs. season I (Figure 7). The largest reduction in Ps was observed at the grain-filling stage for both seasons in all cultivars (Figure 7a,e).
A statistically significant reduction in gs was found in all cultivars; during season I, this was limited to the heading stage, and during season II, it occurred at all phenological stages (Figure 7b). Except for the O3 effect at the heading and the anthesis stages, statistically significant variations in Ci across cultivars and O3 were observed at all phenological stages during season II (Figure 7c). Insignificant reductions were observed in the actual photochemical efficiency of PSII in saturated light (Fv′/Fm′) during season I (Figure 7d). In season II, statistically significant reductions in Fv′/Fm′ were observed at all phenological stages following the trend ‘Gedera’ > ‘Ruta’ > ‘Zahir’ (Figure 7d). The variations in A/Ci for each cultivar under OTC-EO and OTC-CO in both seasons are shown in Figure S3a,b.
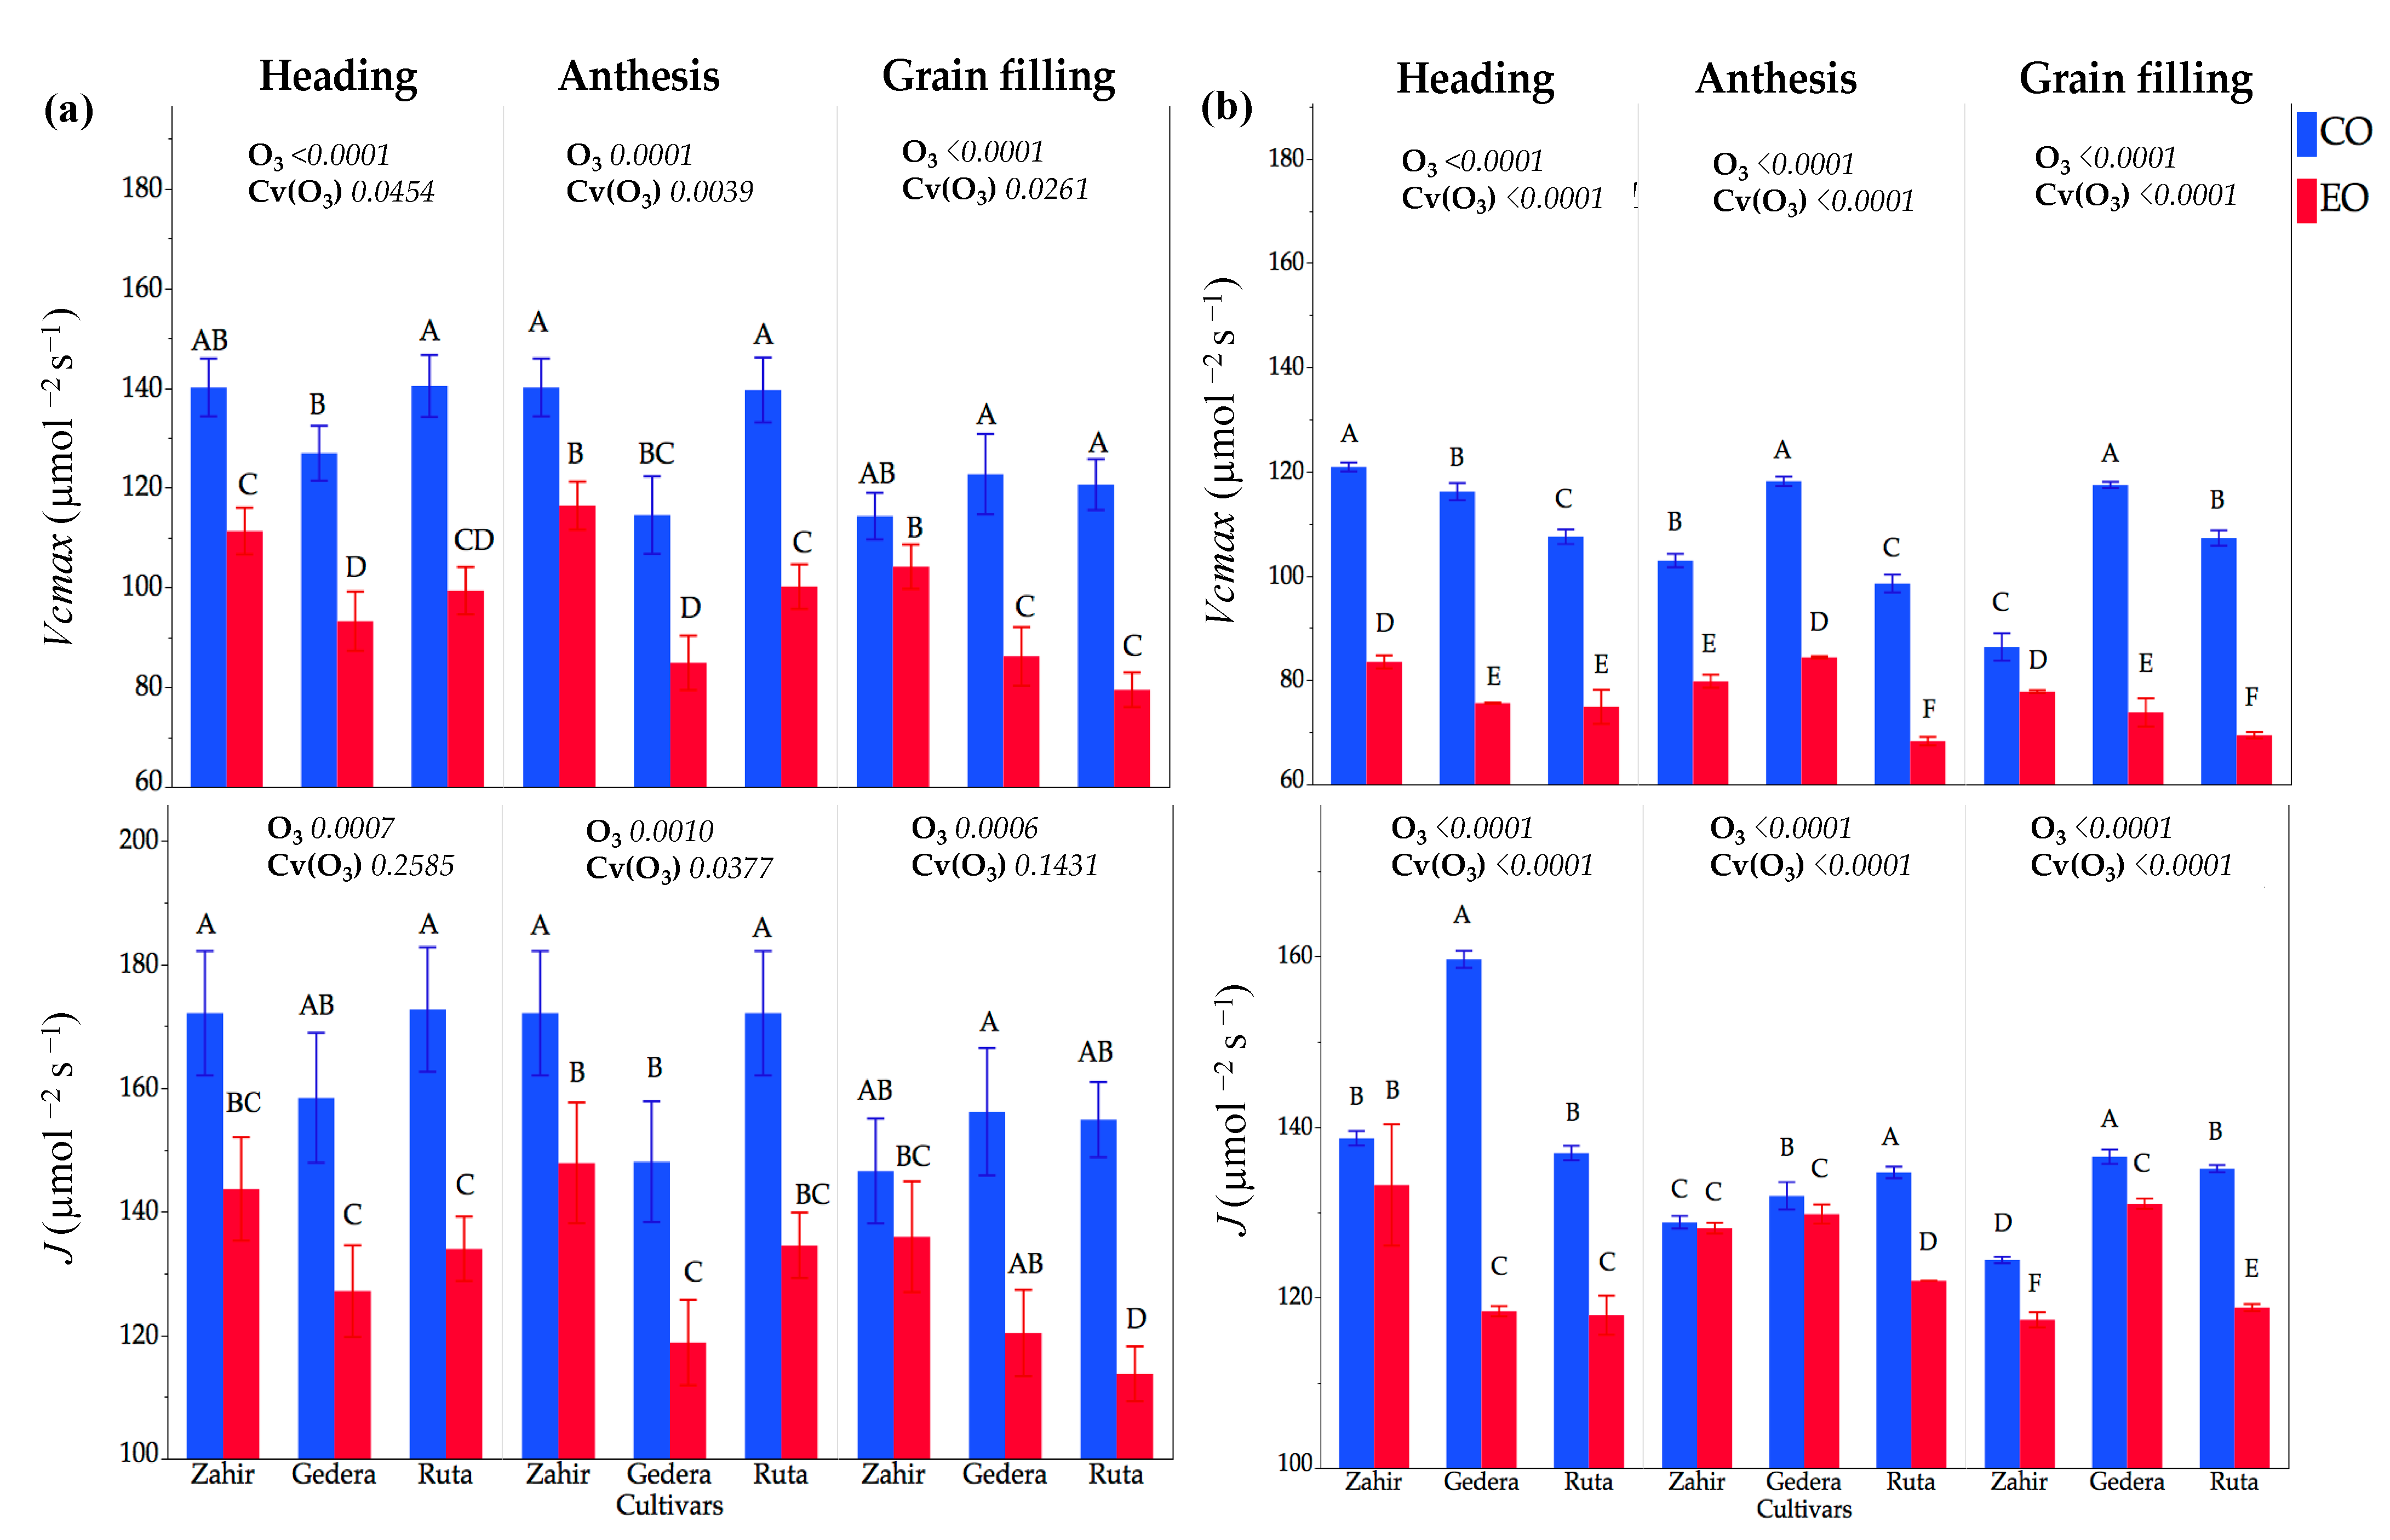
ANOVA results showed significant reductions in Vcmax and J due to O3 at all phenological stages in seasons I and II, except for the cultivar effect at the heading stage (Figure 8). The trends of reduction in Vcmax in response to exposure to O3 in season I was ‘Ruta’ > ‘Gedera’ > ‘Zahir’ and in season II was ‘Gedera’ > ‘Ruta’ > ‘Zahir’. J reduced in all cultivars under O3 stress at all phenological stages during both seasons. ‘Zahir’ consistently showed the least reduction among the cultivars in both seasons, and ‘Gedera’ showed the largest reduction in season II. However, during season I, at all phenological stages, an indefinite trend of reductions was observed in ‘Gedera’ and ‘Ruta’ (Figure 8).
3.4. Yield
In season I, grain, spike, and 1000 kernel weights were significantly reduced by 30%, 9%, and 14%, respectively, in ‘Ruta’, showing the highest reductions among the cultivars (‘Gedera’: 22%, 8%, and 14%, and ‘Zahir’: 16%, 8%, and 7%, respectively). Total biomass and straw biomass were reduced in ‘Zahir’, ‘Gedera’, and ‘Ruta’; however, straw biomass increased in ‘Ruta’ (12%) under OTC-EO compared to OTC-CO. In season II, ‘Gedera’ showed the largest reductions in all yield parameters, followed by ‘Ruta’ and ‘Zahir’ (Table 4). ANOVA results showed significance for both factors (O3 and Cv(O3) in total biomass, spike weight, and 1000 kernel weight during both seasons. Grain weight and straw biomass were only significantly influenced by O3 and across cultivars, respectively, in season I. During season II, significant variations in the response to O3 and across cultivars were observed for all yield parameters (Table 4).
3.5. Overall Cultivar Response to O3 under All Experimental Conditions
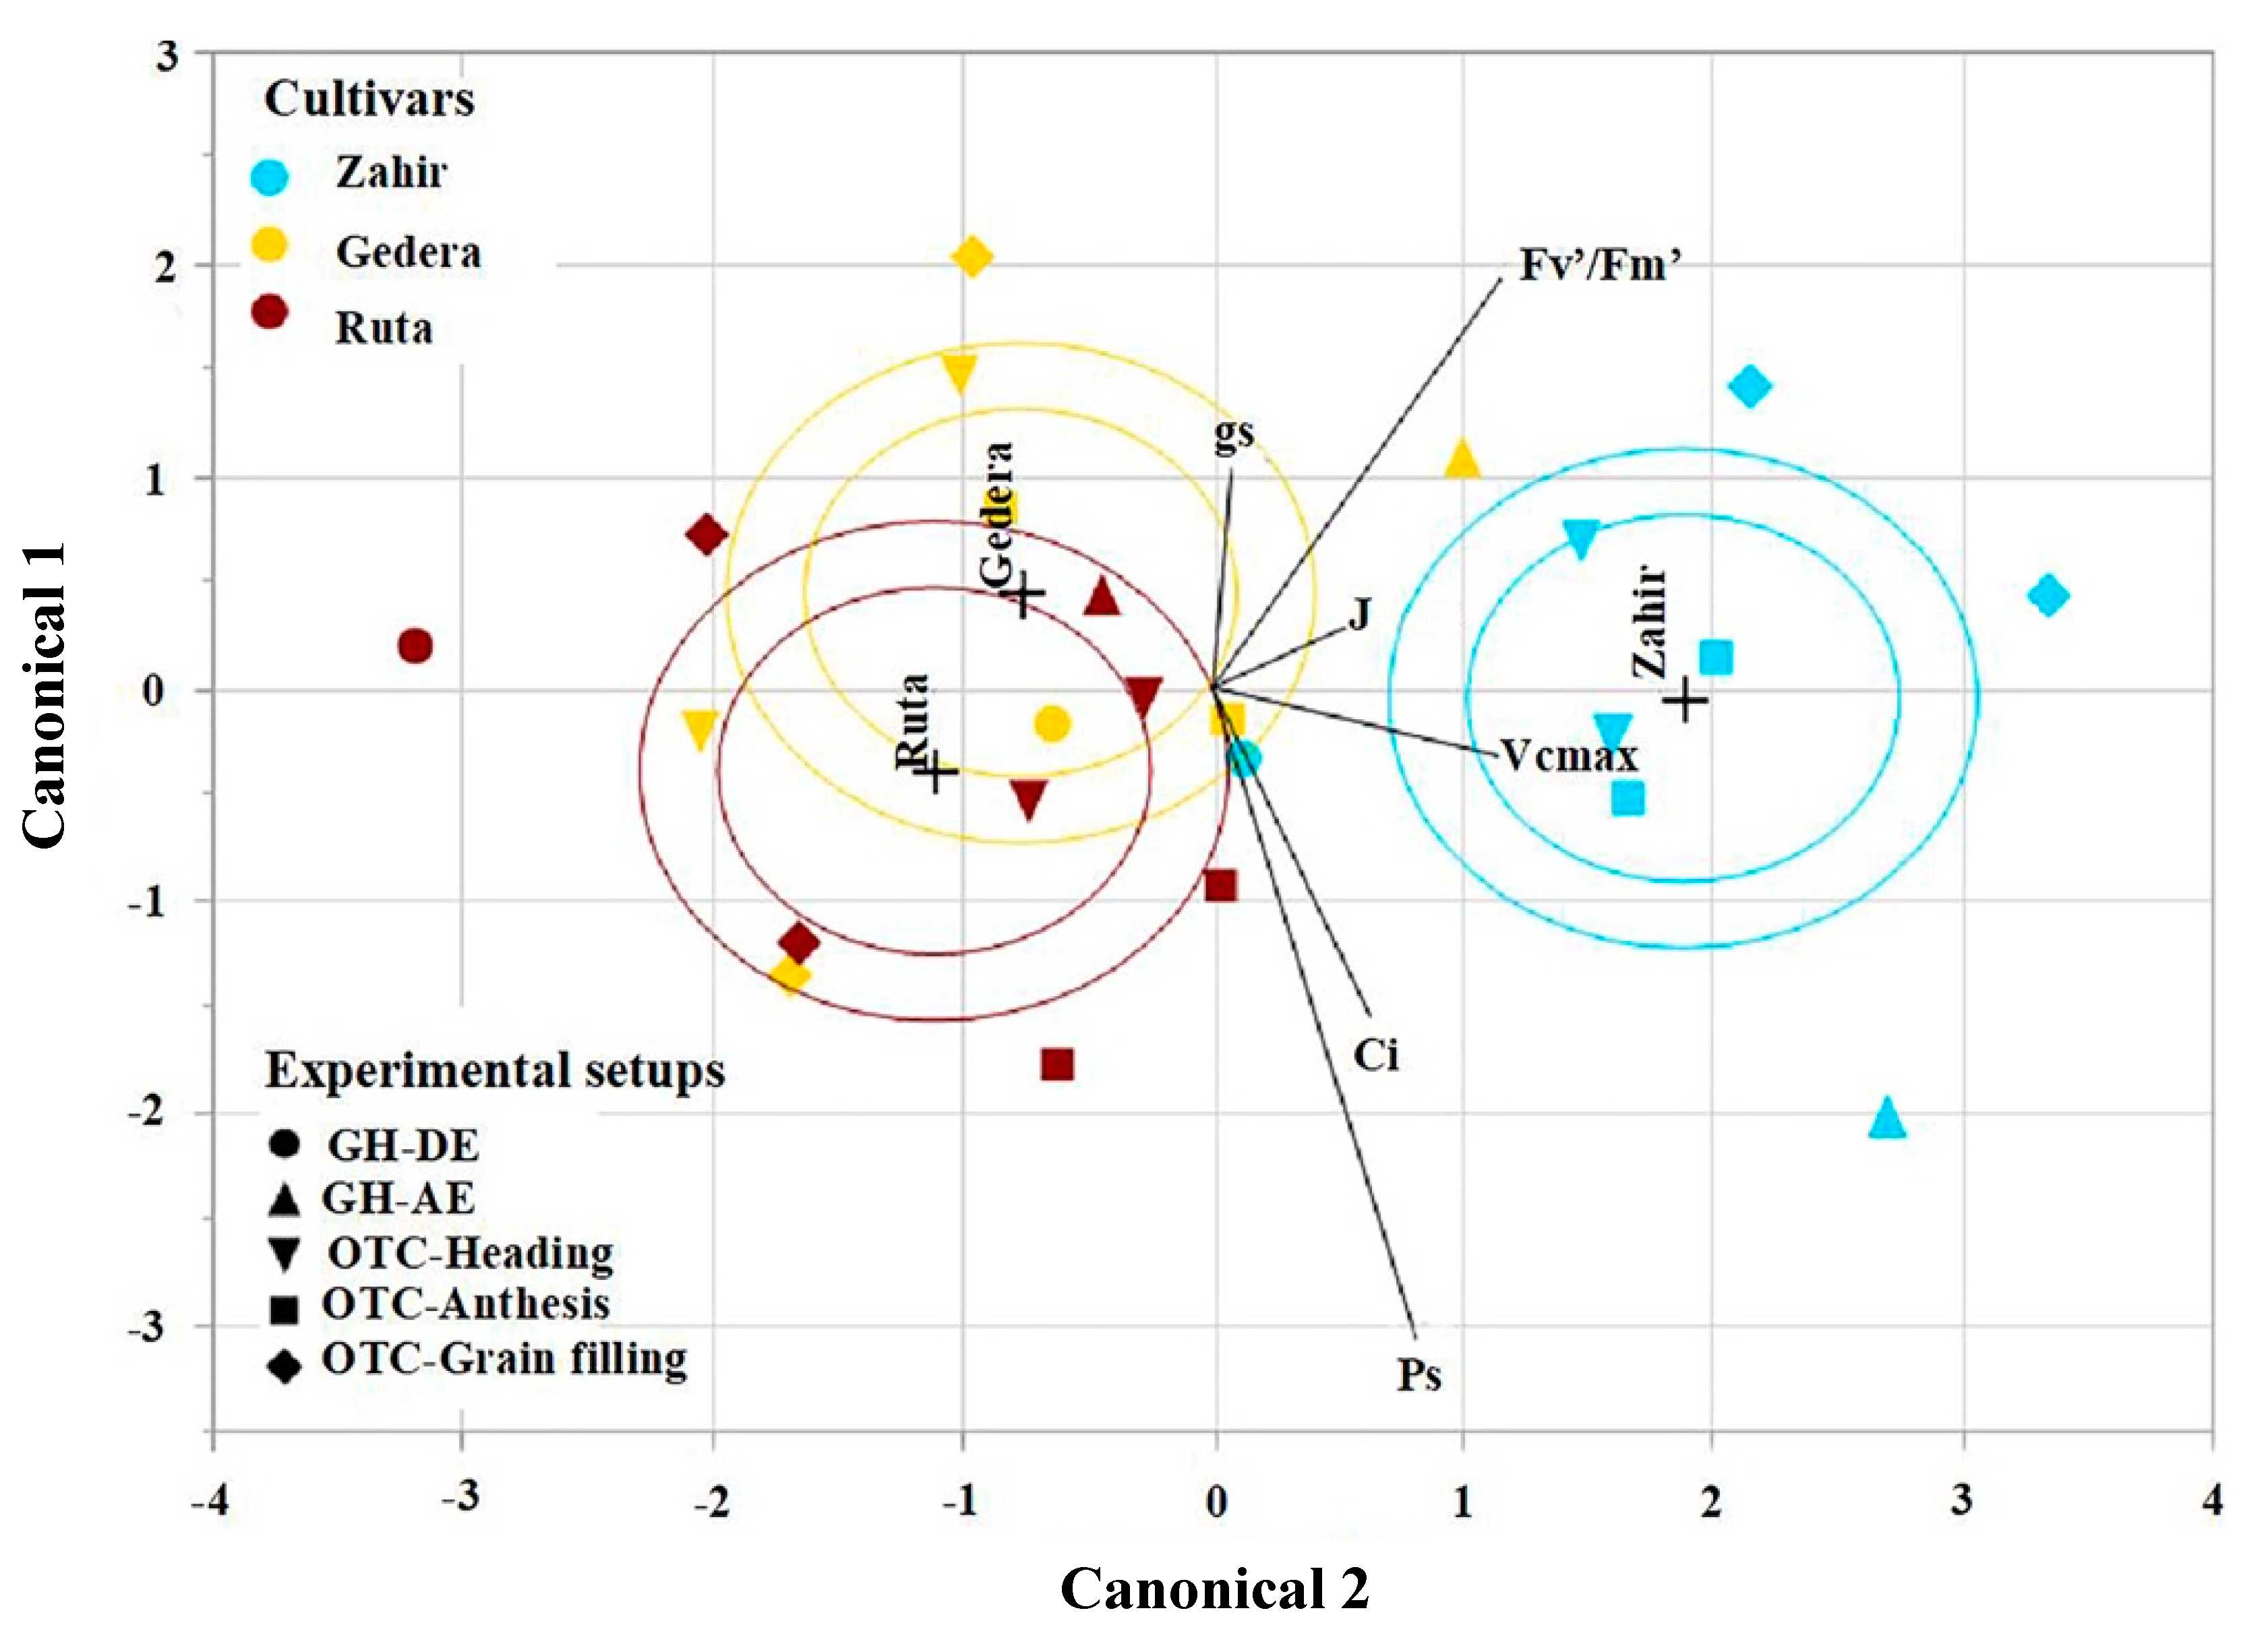
For an overall investigation of cultivar responses to O3 under all experimental setups (OTC and GH), discriminant analyses of physiological trait responses in all the cultivars were performed. Figure 9 represents the discriminant analysis results derived from the reduction (%) in O3-enriched vs. control values for both OTC and GH experiments as a biplot that applies physiological parameter distribution by canonical one and two and the cultivar grouping. Among the physiological parameters, Vcmax, Ps, and Fv′/Fm’ were expressed more in the cultivar-specific responses to O3 stress, while the response to O3 exposure in gs was less consistent across cultivars and phenological stages. The main (first factor) physiological parameter showing the highest response was Vcmax, and the second factor showing a significant effect was Fv′/Fm′. Vcmax and Fv′/Fm′ are non-stomatal factors to which a reduction in Ps under O3 stress can be attributed.
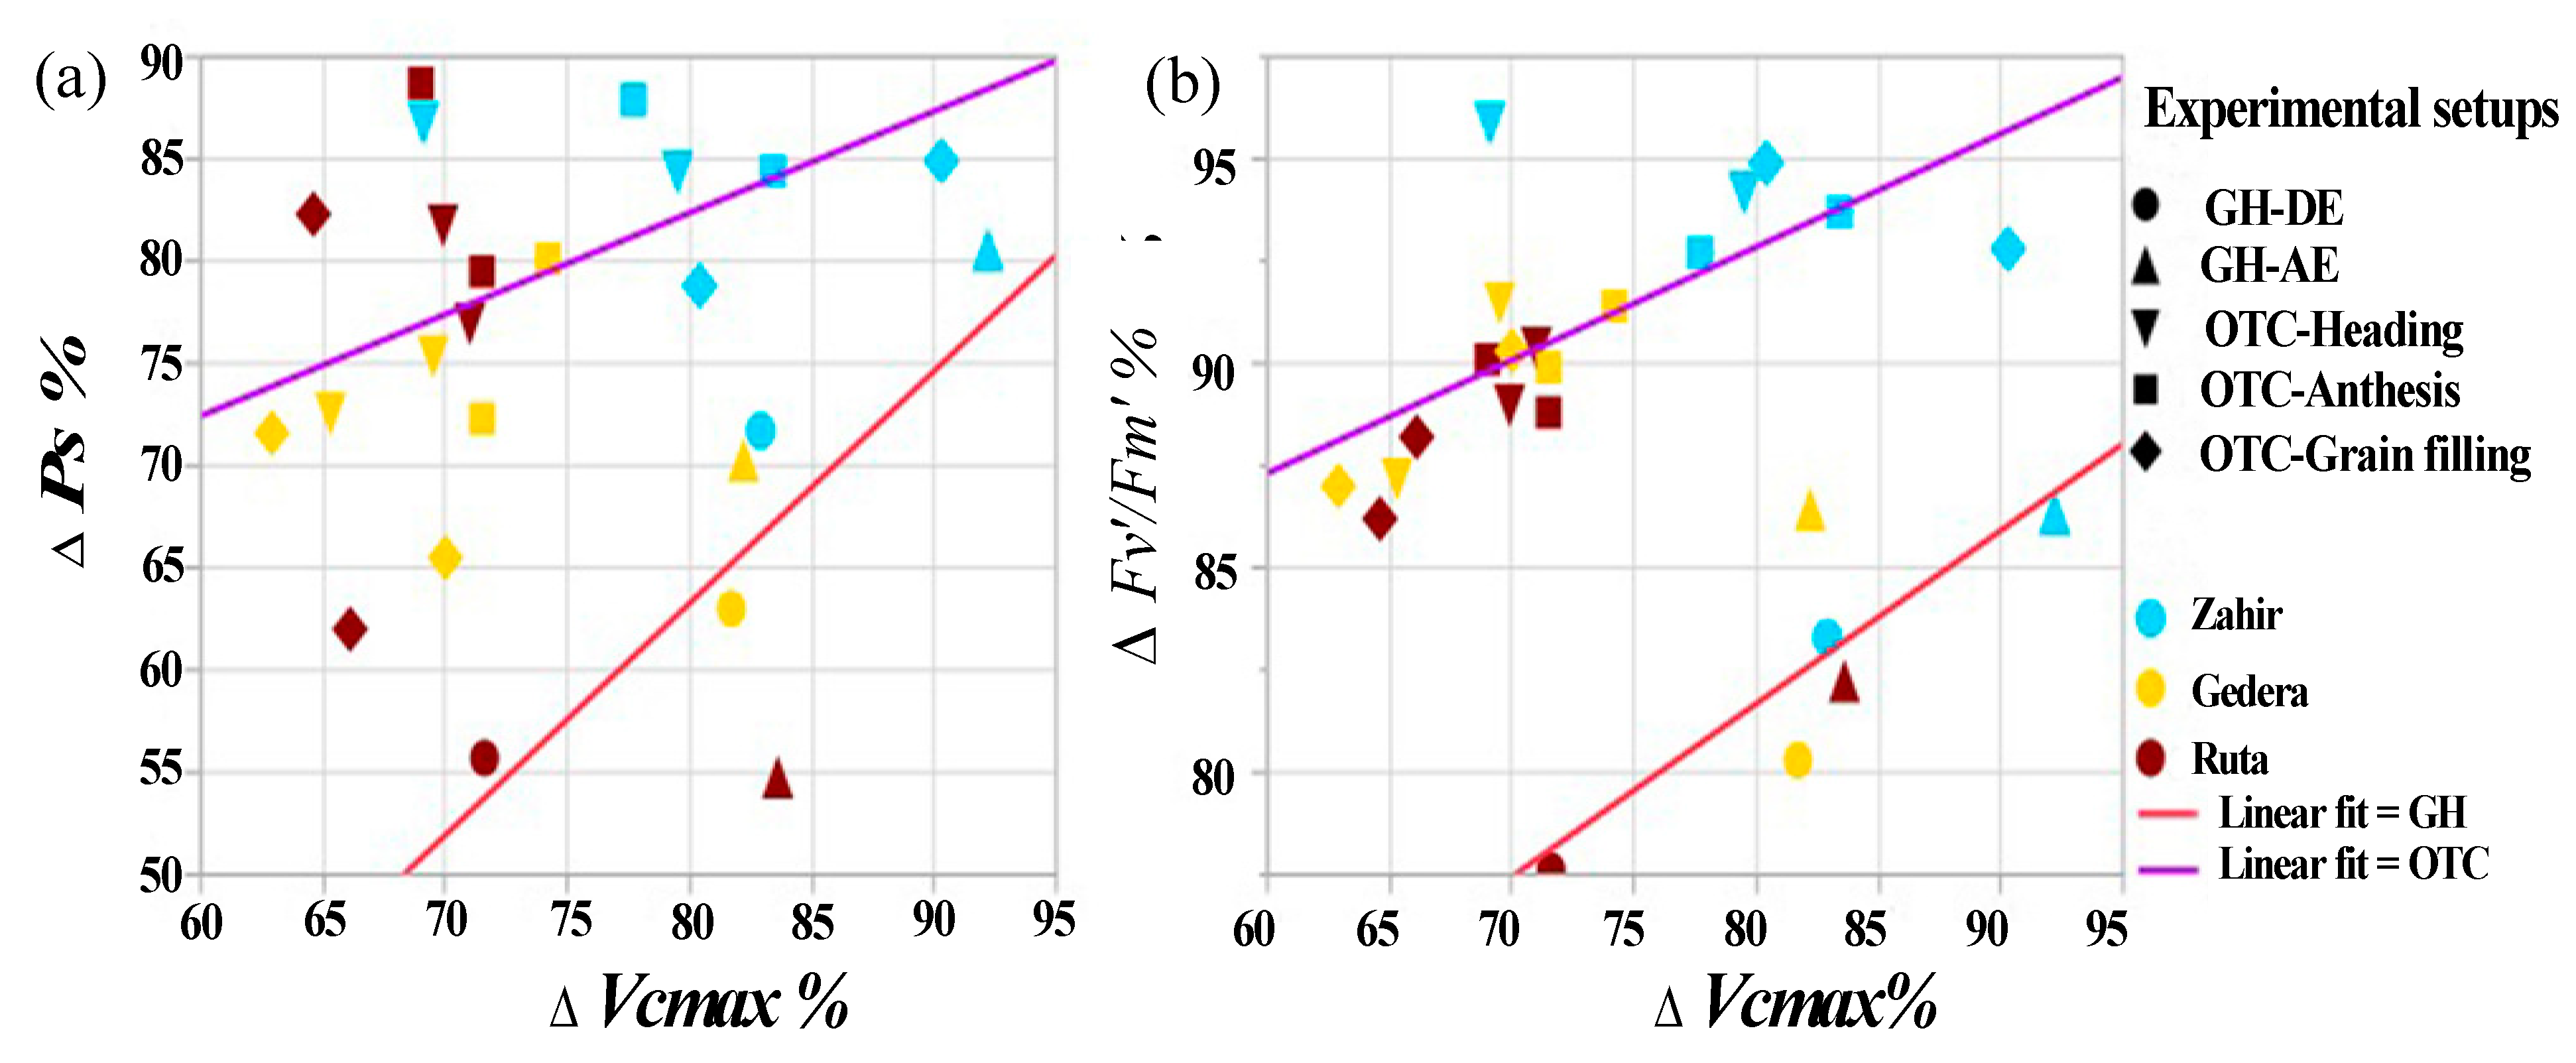
Bivariate analysis was performed to identify the relationship pattern between the physiological parameters that dominate in the cultivar for both experiments (GH and OTC), as presented in Figure 10. Data used for the bivariate analysis were reductions in the experimental vs. control (in percent) Ps, Fv′/Fm′, and Vcmax for all cultivars in GH and OTC experiments. Figure 10 indicates that reductions were more pronounced under high-level O3 exposure (GH-DE) than under slight and moderate O3 exposure in the OTCs. However, regardless of the different conditions applied for each of the three categories—O3 level, AOT40, and phenology stage—‘Zahir’ exhibited the lowest reduction in response to O3 in all three physiological parameters (Fv′/Fm′, Ps, and Vcmax) represented in Figure 10. Therefore, it can be concluded that the better performance of ‘Zahir’ under O3 stress in terms of higher Ps can be attributed to higher Vcmax and Fv′/Fm′ compared to the other two cultivars.
4. Discussion
4.1. Physiological Responses under Different Levels of O3 Conditions
During seasons I and II, plants were exposed to slightly and moderately elevated levels of O3, respectively, in OTCs. O3 had detrimental effects on all cultivars (Figure 7) but with significantly different cultivar responses in season I vs. season II. This was reflected, for instance, in the different cultivar rankings with respect to reduction in Ps across season I (‘Ruta’ > ‘Gedera’ > ‘Zahir’) and season II (‘Gedera’ > ‘Ruta’ > ‘Zahir’).
It should be emphasized that the AOT40 values used in control OTC varied significantly in the two different seasons. Hence, the ratios between AOT40 values for the experimental and control OTCs were similar for the first season (AOT40(ozone)/AOT40(control) = 25.1, based on AOT40 calculated over M7; Table 3) and the second season (AOT40(ozone)/AOT40(control) = 26.5, based on AOT40 calculated over M7; Table 3). Despite the significant difference in AOT40 values between the O3-enriched OTCs in the two seasons, relative yield and reductions in Ps were similar, which might be considered inconsistent. Comparing our results with previous studies, we noticed that, while a linear regression commonly analyzes relative yield vs. AOT40, this regression is frequently highly scattered [7,10,15].
The comparable relative yields and reductions in Ps across the two seasons may have resulted from the higher temperature in season II, which could significantly facilitate better growing conditions than for season I (Figure 2). Moreover, the Tmin in season I was lower than during season II (Figure S5) by 2 °C on average, frequently reaching ~2 °C during the night, which caused cold stress that the plants had to recover from during the day. Alternatively, VPD (vapor pressure deficit) might also play a role in affecting relative yield. Higher VPD in season II compared with the season I may lead to lower stomatal conductance and thereby smaller effect by O3 exposure [5]. Mills et al. [18] estimated that microclimatic conditions such as VPD and temperature significantly affect the wheat yield under long-term chronic O3 exposure, particularly in warm and dry regions where irrigation may increase potential O3 uptake.
Our results further demonstrate that the response to O3 exposure in the different cultivars was initiated at different O3 levels, which dramatically affected relative photosynthetic performance (Figure 7) and yield (Table 4). Cultivar-wise physiological responses to O3 exposure in season II were statistically significant compared to season I (Figure 7). Chronic O3 exposure in OTCs during both season I and season II led to a reduction in yield that was consistent with the physiology of the cultivars, in line with previous studies [9,18].
4.2. Cultivar-Wise Variation and Mechanism of Plant Response to O3
We observed variation in stomatal responses of cultivars under the three O3 levels (Figure 5b and Figure 7b). O3 affects stomatal function by reducing the stomatal conductance rate or by reducing the level of stomatal control [30]. According to Ainsworth et al. [2], long-term chronic O3 exposure at relatively low concentrations tends to result in lower gs and an increase in Ci. Different wheat cultivars showed reduction in gs under elevated O3 exposure [31]. O3 effect on Ps may also reduce the plant’s detoxification activity, leading to increased respiration that demands more C for maintenance and repair [8]. Nevertheless, the increase in gs under low O3 in GH-AE may be due to the repair mechanism induced by antioxidants following the termination of O3 exposure. A similar response showed by Zahir under OTC-EO in season II at the grain-filling stage (Figure 7b) may also be due to the sluggish stomatal response as a result of moderately high O3 exposure, which can lead to slow or less effective stomatal control [30]. Previous studies even indicated failed stomatal closure due to acute O3 exposure [31]. Paoletti and Grulke [30] estimated that O3-induced photosynthetic impairment in plants could be attributed to a decrease in carboxylation and electron transport efficiency and direct/indirect effects on stomata. Zapletal et al. [32] observed in Picea albies L. a reduction in gs with increasing O3 levels, which was attributed to metabolic and cellular responses. Hence, under low and moderate exposure, non-stomatal responses expressed more than stomatal conductance.
4.3. Physiological and Foliar Injury Responses at Different Phenological Stages
Results from both experiments point to the irregular sensitivity ranking of the phenological stages (heading, anthesis, and grain filling) of cultivars in response to enriched O3 in the OTCs. The reduction in Ps at all phenological stages was shown by all cultivars during season I and for ‘Zahir’ and ‘Ruta’ in season II (Figure 7) without significant change in stomatal conductance and/or decrease in carboxylation capacity [33]. During the grain filling, Ps was lower than at the heading-anthesis stage, in agreement with most previous studies that showed a clear gradual and monotonic reduction in Ps from early to mature stages in crop plants [9,31]. The largest decrease in the grain filling stage of Fv′/Fm′ suggests either accumulation of O3 damage or higher sensitivity to O3 during this stage, which may be the cause for the grain yield reduction [9].
No foliar injury symptoms were recorded for any of the cultivars in the season I, even though there were clear reductions in physiological activities and yield with relatively small significant differences compared to season II. Chronic O3 exposure does not constantly stimulate visible injury symptoms but decreases photosynthesis biomass and yield [2]. Even in the absence of visible foliar injury, O3 induced damage to the photosynthetic machinery observed in many physiological studies’ progressive loss of Rubisco activity and reduction in carbon fixation [34]. This difference across the seasons may reinforce the notion that a similar reduction in Ps and yield across season I and season II can also be attributed to better meteorological conditions for growth for the latter, while the fact that foliar injuries appeared only in season II indicates greater O3 damage in that season.
4.4. Overall Cultivar Response to O3 under All Experimental Conditions
The discriminant analysis (Figure 9) showed that ‘Zahir’ is much more tolerant to O3 stress than the other cultivars in all experimental setups. This can be attributed to a smaller reduction in the non-stomatal factors, for instance, Vcmax and Fv′/Fm′. A similar effect of O3 on wheat cultivar variation was observed by Feng et al. [31], who estimated that non-stomatal factors dominate in causing differences in Ps reduction across cultivars. Moreover, during a preliminary study that applied instantaneous exposure of the flag leaf to O3, ‘Zahir’ was also found to have high stomatal conductance, photosynthetic rate, and transpiration rate under O3 stress compared to the other cultivars and was ranked as the most resistant cultivar (Section S1 and Figure S1). Note further that, while ‘Zahir’ is an early-maturing variety, Figure 3 indicates a much higher AOT40 for ‘Zahir’ in season II than for ‘Ruta’ in the season I, whereas, in both seasons, ‘Zahir’ appeared to be much more tolerant than ‘Ruta’ (Figure 7).
This notion is also supported by previous studies on wheat cultivars reporting differential sensitivity to O3 stress majorly attributed to a reduction in Rubisco activity [8,31]. The same trend of cultivar responses to O3 was observed for both GH and OTC (Figure 10), suggesting two different cultivar-screening approaches for breeding. The first is to expose cultivars to a very high O3 level for 2–3 days, then measure Ps and Vcmax. The second would involve lower O3 exposure (realistic levels of O3) applied for a more extended period. The first option should be applied with caution, considering the large reported differences in responses of potted vs. field plants [15] and references therein. The fact that the preliminary experiment (see Section S1 and Figure S1) also pinpointed ‘Zahir’ as the most resistant cultivar suggests an even faster method for cultivar screening.
Further, this method was applied with a relatively moderately elevated O3 mixing ratio (~65 ppbv) and solely the flag leaf exposure. Additional study is required to test the suitability of this methodology for cultivar screening. It should be noted that higher resistance to O3 in ‘Zahir’ compared to the other cultivars also fits with its yield stability under different growth conditions and tolerance to other stress factors, such as drought [35]. This suggests that ‘Zahir’ has acquired fundamental properties protecting it from both drought and O3 stresses.
5. Conclusions
The main objective of this study was to test the level of consistency of physiological response mechanisms to two realistic—slightly and moderately elevated—O3 levels. To the best of our knowledge, this study was the first of its kind in the Eastern Mediterranean region, providing essential data for O3 exposure response in wheat cultivars bred locally. Overall, our study indicates detrimental effects on physiological activities of all cultivars at all O3 enrichment levels, including the slightly elevated O3 exposure in the OTC in season I (AOT40 = 0.902 ppmh; M7 = 36 ppbv), although the cultivar-wise variations for season I were statistically less significant than those for season II. While our results clearly indicate significant differences in the physiological responses and the ranking of the cultivars across the two levels of O3 exposure, surprisingly, both reduction in Ps and yield were similar across the seasons. This highlights the need to study the effect of realistic O3 levels on wheat cultivars but rigorously take into account potential ambient effects, which can significantly affect both yield and physiology, particularly under low O3 exposure.
Responses to O3 at all O3 exposure levels seemed to be related to reductions in non-stomatal factors. ‘Zahir’, which is known for its high tolerance to dry and warm conditions, was found to be the most tolerant cultivar to O3 exposure across all applied experimental conditions, in line with our preliminary study results. This supports a link between cultivar resistance to air dryness or drought and O3. The fact that this is not related to the lower amount of O3 uptake by this cultivar based on AOT40 and gs monitoring indicates efficient cultivar physiological responses and needs a better understanding of the mechanistic linkage between cultivar resistance to drought and O3. Furthermore, a better understanding of the mechanism governing cultivar performance under elevated O3 can provide insight for breeding programs in areas characterized by drought and relatively high levels of O3. The similarity in results across all experiments in terms of the non-stomatal response being the most affected factor and ‘Zahir’ being the most tolerant cultivar indicate that short exposure to O3 may be a useful methodology for cultivar screening. However, such rapid screening should be further tested and compared with more cultivars under chronic exposure in a field study, considering the notable differences in plant responses to O3 exposure under controlled potted conditions vs. natural field conditions.
Supplementary Materials
The following are available online at https://0-www-mdpi-com.brum.beds.ac.uk/article/10.3390/atmos12111392/s1, Figure S1: Differences in stomatal conductance (gs), net assimilation rate (Ps), and transpiration rate (Trans) of four wheat cultivars due to direct exposure of the flag leaf to O3. gs, Ps, Trans were calculated as the difference between their values following an exposure to O3 at 65 ppbv vs. O3 at 30 ppbv (Section S.1.2), Figure S2: Greenhouse (GH) experiment: CO2 response curve, A/Ci, during O3 exposure (GH-DE) and after O3 exposure measurements (GH-AE) of all cultivars during the exposure to O3 (ozone) and corresponding control (control). Values are Mean (n = 3). See more details on the greenhouse experiment in Section 2.7 and Section 3.3.1 in the main text, Figure S3: CO2 response curve during the open top chamber (OTC) experiment: (A) A/Ci curves of all cultivars in OTC enriched by O3 (OTC-EO) and corresponding values under control conditions (OTC-CO) during season-I. (B) A/Ci curves for all the phenological stages during season-II. Values are Mean (n = 4). See more details on the OTC experiment in Section 2.7 and Section 3.3.2 in the main text. Figure S4: Measured meteorological data during the open top chamber (OTC) experiment: Presented are temperature, relative humidity, vapor pressure deficit and photosynthetic active radiation during the season I and II inside the OTCs. Data includes here from all experimental duration (Dec-Apr) for both seasons; In season I, sensors were installed at 31 January 2017 (49 days after emergence (DAE)). For season-II from 11 December 2017 (DAE day 1). Constructed values shows the modified data for season I data from OTC and ambient regression up to the period of sensors without shelter. In season I, PAR sensor was not installed. See more details on the OTC experiment in Section 2.4 and Section 3.1.2 in the main text. Figure S5: Ambient daily average Temperature (Tavg) and daily minimum temperature (Tmin) from emergence to maturity of plant for OTC experiment during season-I (black) and II (red). See more details on OTC experiment in Section 2.4 and Section 4.1 in the main text.
Author Contributions
Conceptualization, E.T. and D.J.B.; methodology, N.C., E.T. and D.J.B.; software, E.T. and D.J.B.; validation, N.C., E.T. and D.J.B.; formal analysis, N.C.; resources, E.T. and D.J.B.; data curation, E.T. and D.J.B.; writing—original draft preparation, N.C., E.T. and D.J.B.; writing—review and editing, N.C., E.T. and D.J.B.; supervision, E.T. and D.J.B.; project administration, E.T. and D.J.B.; funding acquisition, E.T. and D.J.B.; All authors have read and agreed to the published version of the manuscript.
Funding
This research was funded by the Israeli Ministry of Agriculture and Rural Development, Israel (20-10-0066).
Institutional Review Board Statement
Not applicable.
Informed Consent Statement
Not applicable.
Data Availability Statement
The data presented in this study are available on request from the corresponding author. The data are not publicly available to ensure its proper use.
Acknowledgments
We greatly thank Gil Lerner for supporting the measurements. E.T. holds the Joseph H. and Belle R. Braun Senior Lectureship in Agriculture. N.C. is grateful to the Israel–India Postdoctoral Program for providing a research fellowship.
Conflicts of Interest
The authors declare no conflict of interest.
References
- Finlayson-Pitts, B.J.; Pitts, J.N. Chemistry of the Upper and Lower Atmosphere: Theory, Experiments, and Applications; Elsevier: San Diego, CA, USA, 2000; ISBN 9780080529073. [Google Scholar]
- Ainsworth, E.A.; Yendrek, C.R.; Sitch, S.; Collins, W.J.; Emberson, L.D. The effects of tropospheric ozone on net primary productivity and implications for climate change. Annu. Rev. Plant Biol. 2012, 63, 637–661. [Google Scholar] [CrossRef] [Green Version]
- Hong, C.; Mueller, N.; Burney, J.A.; Zhang, Y.; AghaKouchak, A.; Moore, F.C.; Qin, Y.; Tong, D.; Davis, S.J. Impacts of ozone and climate change on California perennial crops. In Proceedings of the AGU Fall Meeting Abstracts, San Francisco, CA, USA, 9–13 December 2019; p. GC43H-1403. [Google Scholar]
- Von Schneidemesser, E.; Driscoll, C.; Rieder, H.E.; Schiferl, L.D. How will air quality effects on human health, crops and ecosystems change in the future? Philos. Trans. R. Soc. 2020, 378, 20190330. [Google Scholar] [CrossRef]
- Fiscus, E.L.; Booker, F.L.; Burkey, K.O. Crop responses to ozone: Uptake, modes of action, carbon assimilation and partitioning. Plant. Cell. Environ. 2005, 28, 997–1011. [Google Scholar] [CrossRef]
- Ainsworth, E.A. Understanding and improving global crop response to ozone pollution. Plant J. 2017, 90, 886–897. [Google Scholar] [CrossRef]
- Mills, G.; Hayes, F.; Simpson, D.; Emberson, L.; Norris, D.; Harmens, H.; Büker, P. Evidence of widespread effects of ozone on crops and (semi-)natural vegetation in Europe (1990–2006) in relation to AOT40-and flux-based risk maps. Glob. Chang. Biol. 2011, 17, 592–613. [Google Scholar] [CrossRef] [Green Version]
- Emberson, L.D.; Pleijel, H.; Ainsworth, E.A.; Van Den Berg, M.; Ren, W.; Osborne, S.; Mills, G.; Pandey, D.; Dentener, F.; Büker, P.; et al. Ozone effects on crops and consideration in crop models. Eur. J. Agron. 2018, 100, 19–34. [Google Scholar] [CrossRef]
- Feng, Z.; Kobayashi, K.; Ainsworth, E.A. Impact of elevated ozone concentration on growth, physiology, and yield of wheat (Triticum aestivum L.): A meta-analysis. Glob. Chang. Biol. 2008, 14, 2696–2708. [Google Scholar] [CrossRef]
- Sarkar, A.; Agrawal, S.B. Elevated ozone and two modern wheat cultivars: An assessment of dose dependent sensitivity with respect to growth, reproductive and yield parameters. Environ. Exp. Bot. 2010, 69, 328–337. [Google Scholar] [CrossRef]
- Mills, G.; Buse, A.; Gimeno, B.; Bermejo, V.; Holland, M.; Emberson, L.; Pleijel, H. A synthesis of AOT40-based response functions and critical levels of ozone for agricultural and horticultural crops. Atmos. Environ. 2007, 41, 2630–2643. [Google Scholar] [CrossRef]
- Chuwah, C.; van Noije, T.; van Vuuren, D.P.; Stehfest, E.; Hazeleger, W. Global impacts of surface ozone changes on crop yields and land use. Atmos. Environ. 2015, 106, 11–23. [Google Scholar] [CrossRef] [Green Version]
- Schauberger, B.; Rolinski, S.; Schaphoff, S.; Müller, C. Global historical soybean and wheat yield loss estimates from ozone pollution considering water and temperature as modifying effects. Agric. For. Meteorol. 2019, 265, 1–15. [Google Scholar] [CrossRef]
- Meyer, U.; Köllner, B.; Willenbrink, J.; Krause, G.H.M. Effects of different ozone exposure regimes on photosynthesis, assimilates and thousand grain weight in spring wheat. Agric. Ecosyst. Environ. 2000, 78, 49–55. [Google Scholar] [CrossRef]
- Pleijel, H.; Broberg, M.C.; Uddling, J.; Mills, G. Current surface ozone concentrations significantly decrease wheat growth, yield and quality. Sci. Total Environ. 2018, 613, 687–692. [Google Scholar] [CrossRef]
- Feng, Z.; Kobayashi, K. Assessing the impacts of current and future concentrations of surface ozone on crop yield with meta-analysis. Atmos. Environ. 2009, 43, 1510–1519. [Google Scholar] [CrossRef]
- Van Dingenen, R.; Dentener, F.J.; Raes, F.; Krol, M.C.; Emberson, L.; Cofala, J. The global impact of ozone on agricultural crop yields under current and future air quality legislation. Atmos. Environ. 2009, 43, 604–618. [Google Scholar] [CrossRef]
- Mills, G.; Sharps, K.; Simpson, D.; Pleijel, H.; Frei, M.; Burkey, K.; Emberson, L.; Uddling, J.; Broberg, M.; Feng, Z.; et al. Closing the global ozone yield gap: Quantification and cobenefits for multistress tolerance. Glob. Chang. Biol. 2018, 24, 4869–4893. [Google Scholar] [CrossRef] [PubMed] [Green Version]
- Osborne, S.; Pandey, D.; Mills, G.; Hayes, F.; Harmens, H.; Gillies, D.; Büker, P.; Emberson, L. New insights into leaf physiological responses to ozone for use in crop modelling. Plants 2019, 8, 84. [Google Scholar] [CrossRef] [Green Version]
- Yadav, D.S.; Agrawal, S.B.; Agrawal, M. Ozone flux-effect relationship for early and late sown Indian wheat cultivars: Growth, biomass, and yield. Field Crops Res. 2021, 263, 108076. [Google Scholar] [CrossRef]
- Tai, A.P.; Sadiq, M.; Pang, J.; Yung, D.H.; Feng, Z. Impacts of Surface Ozone Pollution on Global Crop Yields: Comparing Different Ozone Exposure Metrics and Incorporating Co-effects of CO2. Front. Sustain. Food Syst. 2021, 5, 63. [Google Scholar] [CrossRef]
- Sinha, B.; Singh Sangwan, K.; Maurya, Y.; Kumar, V.; Sarkar, C.; Chandra, B.P.; Sinha, V. Assessment of crop yield losses in Punjab and Haryana using 2 years of continuous in situ ozone measurements. Atmos. Chem. Phys. 2015, 15, 9555–9576. [Google Scholar] [CrossRef] [Green Version]
- Juráň, S.; Grace, J.; Urban, O. Temporal changes in ozone concentrations and their impact on vegetation. Atmosphere 2021, 12, 82. [Google Scholar] [CrossRef]
- Biswas, D.K.; Xu, H.; Li, Y.G.; Sun, J.Z.; Wang, X.Z.; Han, X.G.; Jiang, G.M. Genotypic differences in leaf biochemical, physiological and growth responses to ozone in 20 winter wheat cultivars released over the past 60 years. Glob. Chang. Biol. 2008, 14, 46–59. [Google Scholar] [CrossRef]
- Shiff, S.; Lensky, I.M.; Bonfil, D.J. Using Satellite Data to Optimize Wheat Yield and Quality under Climate Change. Remote Sens. 2021, 13, 2049. [Google Scholar] [CrossRef]
- Fuhrer, J.; Skärby, L.; Ashmore, M.R. Critical levels for ozone effects on vegetation in Europe. Environ. Pollut. 1997, 97, 91–106. [Google Scholar] [CrossRef]
- Sharkey, T.D.; Bernacchi, C.J.; Farquhar, G.D.; Singsaas, E.L. Fitting photosynthetic carbon dioxide response curves for C3 leaves. Plant Cell Environ. 2007, 30, 1035–1040. [Google Scholar] [CrossRef]
- Farquhar, G.D.; von Caemmerer, S.V.; Berry, J.A. A biochemical model of photosynthetic CO2 assimilation in leaves of C3 species. Planta 1980, 149, 78–90. [Google Scholar] [CrossRef] [PubMed] [Green Version]
- Singh, A.A.; Fatima, A.; Mishra, A.K.; Chaudhary, N.; Mukherjee, A.; Agrawal, M.; Agrawal, S.B. Assessment of ozone toxicity among 14 Indian wheat cultivars under field conditions: Growth and productivity. Environ. Monit. Assess. 2018, 190, 190–204. [Google Scholar] [CrossRef] [PubMed]
- Paoletti, E.; Grulke, N.E. Ozone exposure and stomatal sluggishness in different plant physiognomic classes. Environ. Pollut. 2010, 158, 2664–2671. [Google Scholar] [CrossRef]
- Feng, Z.; Wang, L.; Pleijel, H.; Zhu, J.; Kobayashi, K. Differential effects of ozone on photosynthesis of winter wheat among cultivars depend on antioxidative enzymes rather than stomatal conductance. Sci. Total Environ. 2016, 572, 404–411. [Google Scholar] [CrossRef]
- Zapletal, M.; Juran, S.; Krpes, V.; Michna, K.; Cudlin, P.; Edwards, M. Effect of ozone flux on selected structural and antioxidant characteristics of a mountain norway spruce forest. Balt. For. 2018, 24, 261–267. [Google Scholar]
- Farage, P.K.; Long, S.P. The effects of O3 fumigation during leaf development on photosynthesis of wheat and pea: An in vivo analysis. Photosynth. Res. 1999, 59, 1–7. [Google Scholar] [CrossRef]
- Feng, Z.Z.; Pang, J.; Kobayashi, K.; Zhu, J.; Ort, D.R. Differential responses in two varieties of winter wheat to elevated ozone concentration under fully open-air field conditions. Glob. Chang. Biol. 2011, 17, 580–591. [Google Scholar] [CrossRef]
- Aidoo, M.K.; Quansah, L.; Galkin, E.; Batushansky, A.; Wallach, R.; Moshelion, M.; Bonfil, D.J.; Fait, A. A combination of stomata deregulation and a distinctive modulation of amino acid metabolism are associated with enhanced tolerance of wheat varieties to transient drought. Metabolomics 2017, 13, 138. [Google Scholar] [CrossRef]
Figure 1.
GH O3 concentration. O3 mixing ratios in ozone and control GHs during O3 exposure (GH-DE) and after O3 exposure (GH-AE). Values represent averages over all sensors (mean ± SD). Physiological measurements: M1 at GH-DE and M2 at GH-AE.
Figure 1.
GH O3 concentration. O3 mixing ratios in ozone and control GHs during O3 exposure (GH-DE) and after O3 exposure (GH-AE). Values represent averages over all sensors (mean ± SD). Physiological measurements: M1 at GH-DE and M2 at GH-AE.

Figure 2.
OTC experiment meteorological parameters. Ambient meteorological data from plant emergence to maturity. Presented are 24 h mean temperature, solar global radiation, relative humidity, and vapor pressure deficit vs. days after emergence (DAE). Solid and dotted arrows in the temperature panel indicate the heading of cultivars in season I and season II, respectively.

Figure 3.
O3 levels. (a) AOT40 (ppmh) of all cultivars (separated by vertical lines displaying exposure duration) from days after emergence (DAE) in O3-enriched OTC (OTC-EO), control OTC (OTC-CO), and ambient air during season I and season II. (b) O3 mixing ratios at phenological stages of each cultivar. Values above bars are AOT40 (ppmh) from emergence until the end of each phenological stage (heading, anthesis, and grain filling), individually for season I and season II.

Figure 4.
Foliar injury. Symptoms of O3-induced foliar injury on the flag leaves of ‘Zahir’ (Z), ‘Gedera’ (G), and ‘Ruta’ (R) in the GH (GH-DE) and the field (OTC-EO) at elevated O3 exposure.
Figure 4.
Foliar injury. Symptoms of O3-induced foliar injury on the flag leaves of ‘Zahir’ (Z), ‘Gedera’ (G), and ‘Ruta’ (R) in the GH (GH-DE) and the field (OTC-EO) at elevated O3 exposure.

Figure 5.
GH experiment. Results (mean ± SE, n = 5) for (a) photosynthetic rate; Ps (µmol CO2 m−2 s−1), (b) stomatal conductance; gs (mol H2O m−2 s−1), (c) intercellular CO2; Ci (µmol mol−1), and (d) photochemical efficiency (Fv′/Fm′), individually during O3 exposure (GH-DE) and after O3 exposure (GH-AE) for GHs enriched with O3 (EO) and their corresponding control (CO). Different letters above the bars indicate significant differences (p < 0.05) according to Student’s t-test. Italicized numbers in parentheses above the bars represent insignificant percentage change, and non-italicized numbers in parentheses indicate significant percentage change for all parameters between control and O3-exposed GHs during exposure (GH-DE) and afterward (GH-AE). p-values of factors O3 exposure (O3) and cultivar within O3 effect Cv(O3) by ANOVA are also shown.

Figure 6.
GH experiment—maximum carboxylation rate (Vcmax) and electron transport rate (J). Symbols (mean ± SE, n = 5) represents Vcmax and J of cultivars during exposure to O3 (GH-DE) and afterward (GH-AE), for GH enriched with O3 (EO) and the corresponding control (CO). Different letters over symbols indicate significant differences (p < 0.05) according to Student’s t-test. p-Values of factors O3 exposure (O3) and cultivar within O3 effect Cv(O3) for parameters Vcmax and J by ANOVA are also shown.

Figure 7.
OTC experiment. (a–d) Physiological parameters of cultivars at heading (H), anthesis (A), and grain filling (GF) phenological stages in OTC enriched with O3 (EO) and the corresponding control (CO) (mean ± SE, n = 5). Different letters above the bars indicate significant differences (p < 0.05) according to Student’s t-test. (e) Table showing percentage change (reduced values are in black and increased values are in red) in the physiological parameters between CO and EO during season I and season II. p-values of factors O3 exposure (O3) and cultivar within O3 effect Cv(O3) for physiological parameters by ANOVA are also shown.

Figure 8.
OTC experiment. (a) season I and (b) season II represents maximum carboxylation rate (Vcmax) and electron transport rate (J) under O3 enriched OTC (EO) and corresponding controls (CO) during season I and season II (mean ± SE, n = 3). Different letters above the bars indicate a significant difference (p < 0.05) by Student’s t-test. p-values of factors O3 exposure (O3) and cultivar within O3 effect Cv(O3) for parameters Vcmax and J by ANOVA are also shown.

Figure 9.
Discriminant analysis between the cultivars under O3 stress. The biplot indicates the directions of the parameters (maximum carboxylation rate, Vcmax; rate of electron transport, J; photosynthetic rate, Ps; stomatal conductance, gs; intercellular CO2, Ci, and photochemical efficiency, Fv′/Fm′) in the canonical space from both OTCs (seasons I and II), including all phenological stages: heading (OTC-Heading), anthesis (OTC-Anthesis), and grain filling (OTC-Grain filling) and the GH experiment measurements taken during O3 exposure (GH-DE) and after O3 exposure (GH-AE).

Figure 10.
Relationship between physiological parameters across all experiment durations and cultivars. Presented are scatter plots for the differences (in percentages) in physiological parameters between enriched O3 and controls for Ps (ΔPs), Vcmax (ΔVcmax) and Fv′/Fm′ (ΔFv′/Fm′). (a) ΔPs vs. ΔVcmax, and (b) ΔFv′/Fm′ vs. ΔVcmax. Presented data are for all cultivars under O3 stress in both OTCs (seasons I and II, including all phenological stages; heading, anthesis, and grain filling) and the GH experiment, with measurements taken during O3 exposure (GH-DE) and afterward (GH-AE).


Table 1.
Experimental setup scheme for OTC and GH experiments.
| Experimental Setup | Phenological Stages | Season I (December 2016–April 2017) | Season II (December 2017–April 2018) | ||
|---|---|---|---|---|---|
| OTC | Heading | Control O3 (OTC-CO) | Elevated O3 (OTC-EO) | Control O3 (OTC-CO) | Elevated O3 (OTC-EO) |
| Anthesis | |||||
| Grain filling | |||||
| GH | Anthesis (August 2017) | During O3 exposure duration (GH-DE) | After O3 exposure duration (GH-AE) | ||
| Control O3 (CO) | Elevated O3 (EO) | ||||
Table 2.
OTC experimental setup. Crop phenology, initiation of O3 exposure, and harvesting.
| Seasons | Cultivars | Sowing Date | Emergence Date | Ozone Fumigation | Phenological Stage | Binning (DAE) | Heading (DAE) | Anthesis (DAE) | Grain Filling (DAE) | Harvesting Date |
|---|---|---|---|---|---|---|---|---|---|---|
| I (2016–2017) | Zahir | 1 December 2016 | 11 December 2016 | 5 February 2017 | Heading | 70–85 | 70 | 10 May 2017 | ||
| Anthesis | 85–100 | 95 | ||||||||
| Grain filling | 100–115 | 106 | ||||||||
| Gedera | 1 December 2016 | 11 December 2016 | 5 February 2017 | Heading | 75–90 | 78 | 10 May 2017 | |||
| Anthesis | 90–105 | 100 | ||||||||
| Grain filling | 105–115 | 115 | ||||||||
| Ruta | 1 December 2016 | 11 December 2016 | 5 February 2017 | Heading | 90–100 | 89 | 10 May 2017 | |||
| Anthesis | 100–110 | 102 | ||||||||
| Grain filling | 110–120 | 119 | ||||||||
| II (2017–2018) | Zahir | 5 December 2017 | 11 December 2017 | 23 December 2017 | Heading | 70–85 | 71 | 22 April 2018 | ||
| Anthesis | 80–90 | 84 | ||||||||
| Grain filling | 85–95 | 93 | ||||||||
| Gedera | 5 December 2017 | 11 December 2017 | 23 December 2017 | Heading | 75–90 | 79 | 22 April 2018 | |||
| Anthesis | 80–90 | 86 | ||||||||
| Grain filling | 90–100 | 93 | ||||||||
| Ruta | 5 December 2017 | 11 December 2017 | 23 December 2017 | Heading | 80–90 | 86 | 22 April 2018 | |||
| Anthesis | 85–95 | 90 | ||||||||
| Grain filling | 90–105 | 98 |
DAE, days after emergence.
Table 3.
O3 concentrations and AOT40. Daytime 12 h and 7 h O3 (ppbv) mean (M12, M7), maximum and minimum, and AOT40 (ppmh) from flag leaf emergence to plant maturity in control OTC (OTC-CO), O3-enriched OTC (OTC-EO), and ambient air, individually for season I and season II.
Table 3.
O3 concentrations and AOT40. Daytime 12 h and 7 h O3 (ppbv) mean (M12, M7), maximum and minimum, and AOT40 (ppmh) from flag leaf emergence to plant maturity in control OTC (OTC-CO), O3-enriched OTC (OTC-EO), and ambient air, individually for season I and season II.
| Season | 12 h | 7 h | |||||
|---|---|---|---|---|---|---|---|
| OTC-CO | OTC-EO | Ambient | OTC-CO | OTC-EO | Ambient | ||
| I | Mean | 25 ± 7 | 32 ± 8 | 20 ± 4 | 27 ± 8 | 36 ± 9 | 22 ± 4 |
| Maximum | 52 | 65 | 42 | 49 | 59 | 33 | |
| Minimum | 2 | 2 | 3 | 2 | 4 | 4 | |
| AOT40 | 0.076 | 1.273 | 0.004 | 0.036 | 0.902 | 0 | |
| II | Mean | 29 ± 6 | 58 ± 12 | 37 ± 14 | 31 ± 7 | 71 ± 16 | 42 ± 14 |
| Maximum | 73 | 222 | 66 | 73 | 173 | 66 | |
| Minimum | 2 | 5 | 3 | 5 | 14 | 0 | |
| AOT40 | 0.76 | 17.43 | 3.21 | 0.54 | 14.3 | 2.59 | |
Table 4.
Yield parameters of all cultivars in the OTC enriched with O3 (OTC-EO) and corresponding controls (OTC-CO) during season I and season II. Values are presented as means of plants sampled at maturity from each replicate row (n = 5) of each cultivar—(see Section 2.8). p-Values of factors O3 exposure (O3) and cultivar within O3 effect Cv(O3) for yield parameters by ANOVA are also shown. Different superscript letters indicate significant differences (p < 0.05) according to Student’s t-test.
| Season | Cultivar | Treatment | Total Biomass (g m− 2) | Weight of Grains (g m−2) | Straw Biomass (g m−2) | Weight of Spikes (g m−2) | Weight of 1000 Kernels (g) |
|---|---|---|---|---|---|---|---|
| I | Zahir | OTC-CO | 1422 D | 563 AB | 696 C | 726 B | 42 A |
| OTC-EO | 1331 E | 471 BC | 690 C | 641 B | 39 AB | ||
| Gedera | OTC-CO | 1862 A | 686 A | 913 ABC | 949 A | 37 B | |
| OTC-EO | 1658 B | 532 AB | 787 BC | 871 A | 32 C | ||
| Ruta | OTC-CO | 1531 C | 433 BC | 953 AB | 578 C | 28 D | |
| OTC-EO | 1457 D | 303 C | 1067 A | 390 C | 24 D | ||
| ANOVA | Factors | O3 | <0.0001 | 0.039 | 0.919 | 0.047 | 0.003 |
| Cv(O3) | <0.0001 | 0.052 | 0.027 | 0.0001 | <0.0001 | ||
| II | Zahir | OTC-CO | 1102 D | 483 C | 460 D | 645 D | 44 B |
| OTC-EO | 886 E | 449 C | 391 E | 496 E | 41 C | ||
| Gedera | OTC-CO | 1348 C | 493 C | 544 C | 805 C | 48 A | |
| OTC-EO | 1056 D | 344 D | 448 D | 607 D | 43 BC | ||
| Ruta | OTC-CO | 2024 A | 737 A | 769 A | 1254 A | 42 C | |
| OTC-EO | 1625 B | 597 B | 642 B | 984 B | 40 D | ||
| ANOVA | Factors | O3 | <0.0001 | <0.0001 | <0.0001 | <0.0001 | <0.0001 |
| Cv(O3) | <0.0001 | <0.0001 | <0.0001 | <0.0001 | <0.0001 |
Publisher’s Note: MDPI stays neutral with regard to jurisdictional claims in published maps and institutional affiliations. |
© 2021 by the authors. Licensee MDPI, Basel, Switzerland. This article is an open access article distributed under the terms and conditions of the Creative Commons Attribution (CC BY) license (https://creativecommons.org/licenses/by/4.0/).
Share and Cite
MDPI and ACS Style
Chaudhary, N.; Bonfil, D.J.; Tas, E. Physiological and Yield Responses of Spring Wheat Cultivars under Realistic and Acute Levels of Ozone. Atmosphere 2021, 12, 1392. https://0-doi-org.brum.beds.ac.uk/10.3390/atmos12111392
AMA Style
Chaudhary N, Bonfil DJ, Tas E. Physiological and Yield Responses of Spring Wheat Cultivars under Realistic and Acute Levels of Ozone. Atmosphere. 2021; 12(11):1392. https://0-doi-org.brum.beds.ac.uk/10.3390/atmos12111392
Chicago/Turabian StyleChaudhary, Nivedita, David J. Bonfil, and Eran Tas. 2021. "Physiological and Yield Responses of Spring Wheat Cultivars under Realistic and Acute Levels of Ozone" Atmosphere 12, no. 11: 1392. https://0-doi-org.brum.beds.ac.uk/10.3390/atmos12111392
Note that from the first issue of 2016, this journal uses article numbers instead of page numbers. See further details here.