Article

Effect of Humidity on the Reactive Uptake of Ammonia and Dimethylamine by Nitrogen-Containing Secondary Organic Aerosol

by
Natalie R. Smith
1,
Julia Montoya-Aguilera
1,
Donald Dabdub
2 and
Sergey A. Nizkorodov
1,*
1
Department of Chemistry, University of California, Irvine, CA 92697, USA
2
Department of Mechanical and Aerospace Engineering, University of California, Irvine, CA 92697, USA
*
Author to whom correspondence should be addressed.
Submission received: 9 October 2021 / Revised: 12 November 2021 / Accepted: 12 November 2021 / Published: 15 November 2021
(This article belongs to the Special Issue Ammonia in a Changing Atmosphere)

Abstract

:
This study investigated the uptake of ammonia (NH3) by secondary organic aerosol (SOA) particles generated via limonene photooxidation or ozonolysis as well as the uptake of dimethylamine (DMA) by limonene ozonolysis, α-cedrene photooxidation, or toluene photooxidation SOA in an environmental chamber between 0–50% relative humidity. In addition to the acid-base equilibrium uptake, NH3 and DMA can react with SOA carbonyl compounds converting them into nitrogen-containing organic compounds (NOCs). The effective reactive uptake coefficients for the formation of NOCs from ammonia were measured on the order of 10−5. The observed DMA reactive uptake coefficients ranged from 10−5 to 10−4. Typically, the reactive uptake coefficient decreased with increasing relative humidity. This is consistent with NOC formation by a condensation reaction between NH3 or DMA with SOA, which produces water as a product. Ammonia is more abundant in the atmosphere than amines. However, the larger observed reactive uptake coefficient suggests that amine uptake may also be a potential source of organic nitrogen in particulate matter.

1. Introduction

Ammonia (NH3) is the most abundant basic gas in the atmosphere and constitutes the majority of total reactive nitrogen [1]. In addition, NH3 plays a major role in the nitrogen cycle and controls the eutrophication or acidification of ecosystems. Therefore, its concentration in various environmental compartments is particularly noteworthy [2,3]. In the U.S. and worldwide, the largest sources of NH3 emissions are agricultural and farming practices (~85% of total US NH3 emissions, 80–90% of global anthropogenic NH3 emissions) such as commercial fertilizer application and animal waste [4,5,6,7]. Over the past two decades, atmospheric NH3 has increased and is expected to continue to increase as a result of rising global temperature, increasing agricultural activity, and intensifying fertilizer use due to a growing human population [8,9,10].
Due to the significant impact NH3 has on the environment, there have been several studies investigating how it influences the formation and aging of atmospheric fine particulate matter (PM2.5) [11,12,13]. Through reactions with acidic species, NH3 is converted into ammonium salts, such as ammonium nitrate and ammonium sulfate, which make up a large fraction of the total PM2.5 mass in the atmosphere [14]. Fine particulate matter consists of approximately 25–50% inorganic compounds and 40–65% organic compounds by mass [15,16]. Gaseous NH3 is a precursor to inorganic aerosols and is generally the limiting reactant in their formation [12,17]. Inorganic aerosols have been proven to adversely impact human health [17,18], decrease visibility [19], and affect the atmospheric radiative balance [20,21].
Amines are relatively less abundant than NH3 in the atmosphere [22,23,24]. Nevertheless, amines may provide a source of atmospheric reactive nitrogen and their impact on atmospheric aerosol dynamics should be investigated. The most abundant amines contain one to six carbon atoms, including methylamine, dimethylamine, trimethylamine, ethylamine, diethylamine, triethylamine, 1-propanamine, 1-butanamine, and larger amines [23]. Anthropogenic sources of amines include animal husbandry, industrial operations, automobiles, cooking, composting, and sewage [23]. Examples of natural sources of amines include emissions from biological marine processes, vegetation, biomass burning, and geologic sources, such as volcanic eruptions [23]. When emissions of NH3 and amines are measured in tandem, emissions of individual amines are typically two to three orders of magnitude smaller than those of NH3 [22,25,26,27,28]. For example, Schade and Crutzen (1995) relied on animal husbandry emissions to estimate that the combined annual global emissions of methylamines were approximately two orders of magnitude smaller than NH3 emissions (145 Gg N yr−1 from amines versus 23.3 Tg N yr−1 from NH3) [26]. When emissions from marine and biomass were also considered, the estimated global NH3 emissions remained about two orders of magnitude larger than those from methylamines [23,29]. Although concentrations of gaseous amines are expected to be two to three orders of magnitude smaller than NH3 in the gas phase, their particulate concentrations are similar in magnitude [30,31].
Both NH3 and amines contribute to PM mass through the formation of low volatility salts, and through new particle formations using acid-base equilibria [32,33].
NR3 (g) + HNO3 (g) ⇄ HNR3NO3 (s)                  Rxn 1
NR3 (g) + H2SO4 (g) ⇄ HNR3HSO4 (s)                Rxn 2
NR3 (g) + HNR3HSO4 (s) ⇄ (HNR3)2SO4 (s)      Rxn 3
Theoretical studies indicate that amines are more effective than NH3 at stabilizing sulfuric acid—amine clusters that lead to new particle formation [34,35,36]. A theoretical study comparing the relative efficiencies of methylamines to stabilize sulfuric acid showed that the stabilizing strength of NH3 and amines increases in the following way: NH3 < monomethylamine < trimethylamine dimethylamine [37]. Evidence for particle formation from DMA–H2SO4–H2O clusters were observed in the megacity of Shanghai, China [38].
Other pathways explored in laboratory experiments by which amines may contribute to aerosol mass include the gas-phase oxidation of amines by O3, OH, and NO3 [32,39], gas-phase oxidation of a known SOA precursor in the presence of dimethylamine [40], and reactions between amines and carbonyl species in the gas and bulk phase [41,42,43,44,45,46]. Previous studies investigating the browning of SOA after NH3 exposure have proposed reaction pathways for browning in which carbonyl groups in the SOA react with NH3 and produce water as a byproduct [47,48,49,50].
NH3 (g) + R1R2C=O (l) ⇄ R1R2C(OH)NH2 (l) ⇄ R1R2C=NH (l) + H2O (g) Rxn 4
The resulting imines are not stable and equilibrium (Rxn 4) is normally shifted to the left, however, certain imines can further react to produce more stable compounds with nitrogen-containing aromatic rings. Such compounds tend to absorb visible and near-UV radiation making them appear brown, and the change in the optical properties of organic aerosols after exposure to NH3 or amines is one indication that reactions occur between species in the aerosol and NH3 or amines. Liu et al. (2018) investigated the reactive uptake of NH3 by toluene SOA and found that when the relative humidity (RH) was increased from 20–60%, the uptake of NH3 also increased [51]. The proposed explanation for this trend was that due to the high viscosity of toluene SOA, the reactive uptake and diffusivity of NH3 is kinetically inhibited at RH < 20% because toluene SOA can be classified as a glassy material under dry conditions. The transition from diffusion-limited to saturated uptake occurred between 20–60% RH, which suggested that toluene secondary organic material (SOM) is semi-solid within this RH range. Above 60% RH, the reactive uptake of NH3 no longer increased with RH. This was attributed to the toluene SOM behaving as a viscous liquid in this RH range [52,53]. Conversely, for less viscous SOA such as limonene SOA [54], increasing the RH may, in theory, suppress the reactive uptake of NH3 since Rxn 4 follows a condensation mechanism that is accompanied by a loss of water. Therefore, increasing RH can favor the reverse reaction and suppress NH3 uptake by SOA. Analogous studies exploring the effect of RH on amine uptake by SOA are lacking. It is therefore important to study different types of SOA to determine how the effect of viscosity (suppressing the reaction under dry conditions) competes with the condensation-driven reaction mechanism (promoting the reaction under dry conditions).
The goal of this work is to investigate the reactive uptake of NH3 and dimethylamine (abbreviated as DMA from here on, one of the most common amines in the atmosphere) into SOA formed from both biogenic and anthropogenic VOCs. In this study, we focused on the incorporation of organic N into aerosol particles for evidence of NH3 and DMA reactions with SOA and considered the effects of RH on this process. We find that increasing RH led to increased reactive uptake for highly viscous SOA, but for less viscous SOA, increasing RH instead suppressed amine uptake.

2. Materials and Methods

The reactive uptake of NH3 and DMA by SOA particles was investigated using a 5 m3 Teflon environmental chamber. The RH in the chamber ranged from <2% (dry air) to 50% RH for different experimental trials to examine its effects on NH3/DMA uptake by SOA. The desired RH was achieved by filling the chamber with purged air (filtered and scrubbed of VOCs, CO2, and water vapor) through a multi-channel Nafion humidifier. The relative humidity (±2% RH) and temperature (±1 °C) were monitored with a Vaisala HMT330 probe throughout the experiment.
The chamber was operated in a batch mode at room temperature (23–24 °C) in the following order. A seed solution of nicotinic acid (C6H5NO2, 99.5%, Sigma Aldrich, St. Louis, MO, USA) in deionized water (1 g L−1) was atomized into the chamber prior to the injection of the selected VOC (50 ppb of d-limonene or α-cedrene or 1000 ppb for toluene). The nitrogen-containing seeds served as an internal standard for nitrogen in the particles when analyzing particle composition data. The seed particles were not neutralized prior to injection into the chamber. A biogenic or anthropogenic VOC, specifically d-limonene (97%, Sigma-Aldrich, St. Louis, MO, USA), α-cedrene (98%, Sigma-Aldrich, St. Louis, MO, USA), or toluene (99.8%, Fisher Scientific, Hampton, NH, USA), was evaporated into the chamber through a heated inlet. In all experiments, prior to oxidation, gases in the chamber were mixed with a fan for 10 min and a Proton-Transfer-Reaction Time-of-Flight mass spectrometer (PTR-ToF-MS; Ionicon model 8000, Innsbruck, Austria) with H3O+ as the reagent ion was used to confirm that the VOC was well mixed (signal was stable) before initiating oxidation. Mass calibration for the PTR-ToF-MS was performed using three ions commonly observed in room air: m/z 21.0226 (H318O+), 29.9980 (NO+), and 59.0497 (C3H6O+). The drift tube operated at 60.0 °C (Tdrift), 2.30 mbar (Pdrift), and 600 V (Udrift).
Depending on the oxidation pathway desired, either aqueous H2O2 (30 wt.%, Fisher Scientific, Hampton, NH, USA) or ozone (O3) generated from an O3 generator (OZ2SS-SS, OzoneTech, Hägersten, Sweden) was injected into the chamber for photooxidation or ozonolysis experiments, respectively. After injection of H2O2, the UV-B lights were turned on to initiate photooxidation and generate SOA. The ozonolysis experiments were performed in the dark and ozone concentrations were monitored using an O3 analyzer (Model 49i, ThermoScientific, Waltham, MA, USA). All experiments were performed under low-NOx conditions because under high NOx conditions it would be hard to distinguish the reactive uptake of NH3/amines from the uptake of NOx by the SOA since the NH3 monitor used for our calculations is sensitive to NOx concentrations (discussed below). A summary of the experimental trials is provided in Table 1 and a flowchart of SOA systems investigated is shown in Figure S1.
The mixing ratio used for toluene was higher than that of the biogenic VOCs to adjust for the slower oxidation rate of toluene compared to limonene and α-cedrene, as well as the apparent suppression of the SOA mass yield for toluene SOA at higher relative humidity under low-NOx conditions [55]. After oxidant injection, the fan in the chamber was turned off to slow down wall loss. Particle mass concentration was allowed to reach a peak value as measured by a scanning mobility particle sizer (SMPS; TSI 3080, Shoreview, MN, USA) equipped with a condensation particle counter (CPC; TSI 3775, Shoreview, MN, USA).
In some experiments, a gas mixture containing NH3 (1000 ppm NH3 in N2, Airgas, Santa Ana, CA, USA) was introduced into the chamber. In the remaining experiments, aqueous NH4OH (28 wt.%, Fisher Scientific, Hampton, NH, USA) or aqueous DMA (40 wt.%, Sigma-Aldrich, St. Louis, MO, USA) solution was evaporated into the chamber with an airflow. The target mixing ratio of NH3 or DMA in the chamber was 500 ppb. However, due to losses in the inlet lines and chamber walls the actual mixing ratio was approximately 200 ppb as verified with a calibrated NH3/NOx analyzer (Ecotech 9842, Warren, RI, USA). The monitor detects NH3, small amines, and other simple nitrogen-containing organic compounds (NOCs) by converting them to NO on a Pt-based catalyst and then detecting NO via chemiluminescence. The analyzer’s response to DMA was tested by adding multiple injections of DMA into the chamber, and the analyzer’s response increased at concurrent times with the injections, verifying that it does respond to changes in DMA concentrations (Figure S2). The NH3 monitor was not responsive to anything else added into the chamber (i.e., H2O2 and VOCs). Particle volume and number concentration were also monitored using the SMPS. The chemical composition of SOA particles was monitored using an online High-Resolution Time-of-Flight Aerosol Mass Spectrometer (HR-ToF-AMS or AMS; Aerodyne, Billerica, MA, USA) operated in V and W-mode. Particles were vaporized at 600 °C and ionized using EI (70 eV). The AMS data were analyzed using Igor Pro v. 6.37 (Wavemetrics, Inc., Portland, OR, USA) with SQUIRREL (v. 1.62A) and PIKA (v. 1.22A) software. The “improved-ambient” method mentioned in Canagaratna et al. (2015) was used to generate elemental ratios for the experimental data [56].

3. Results and Discussion

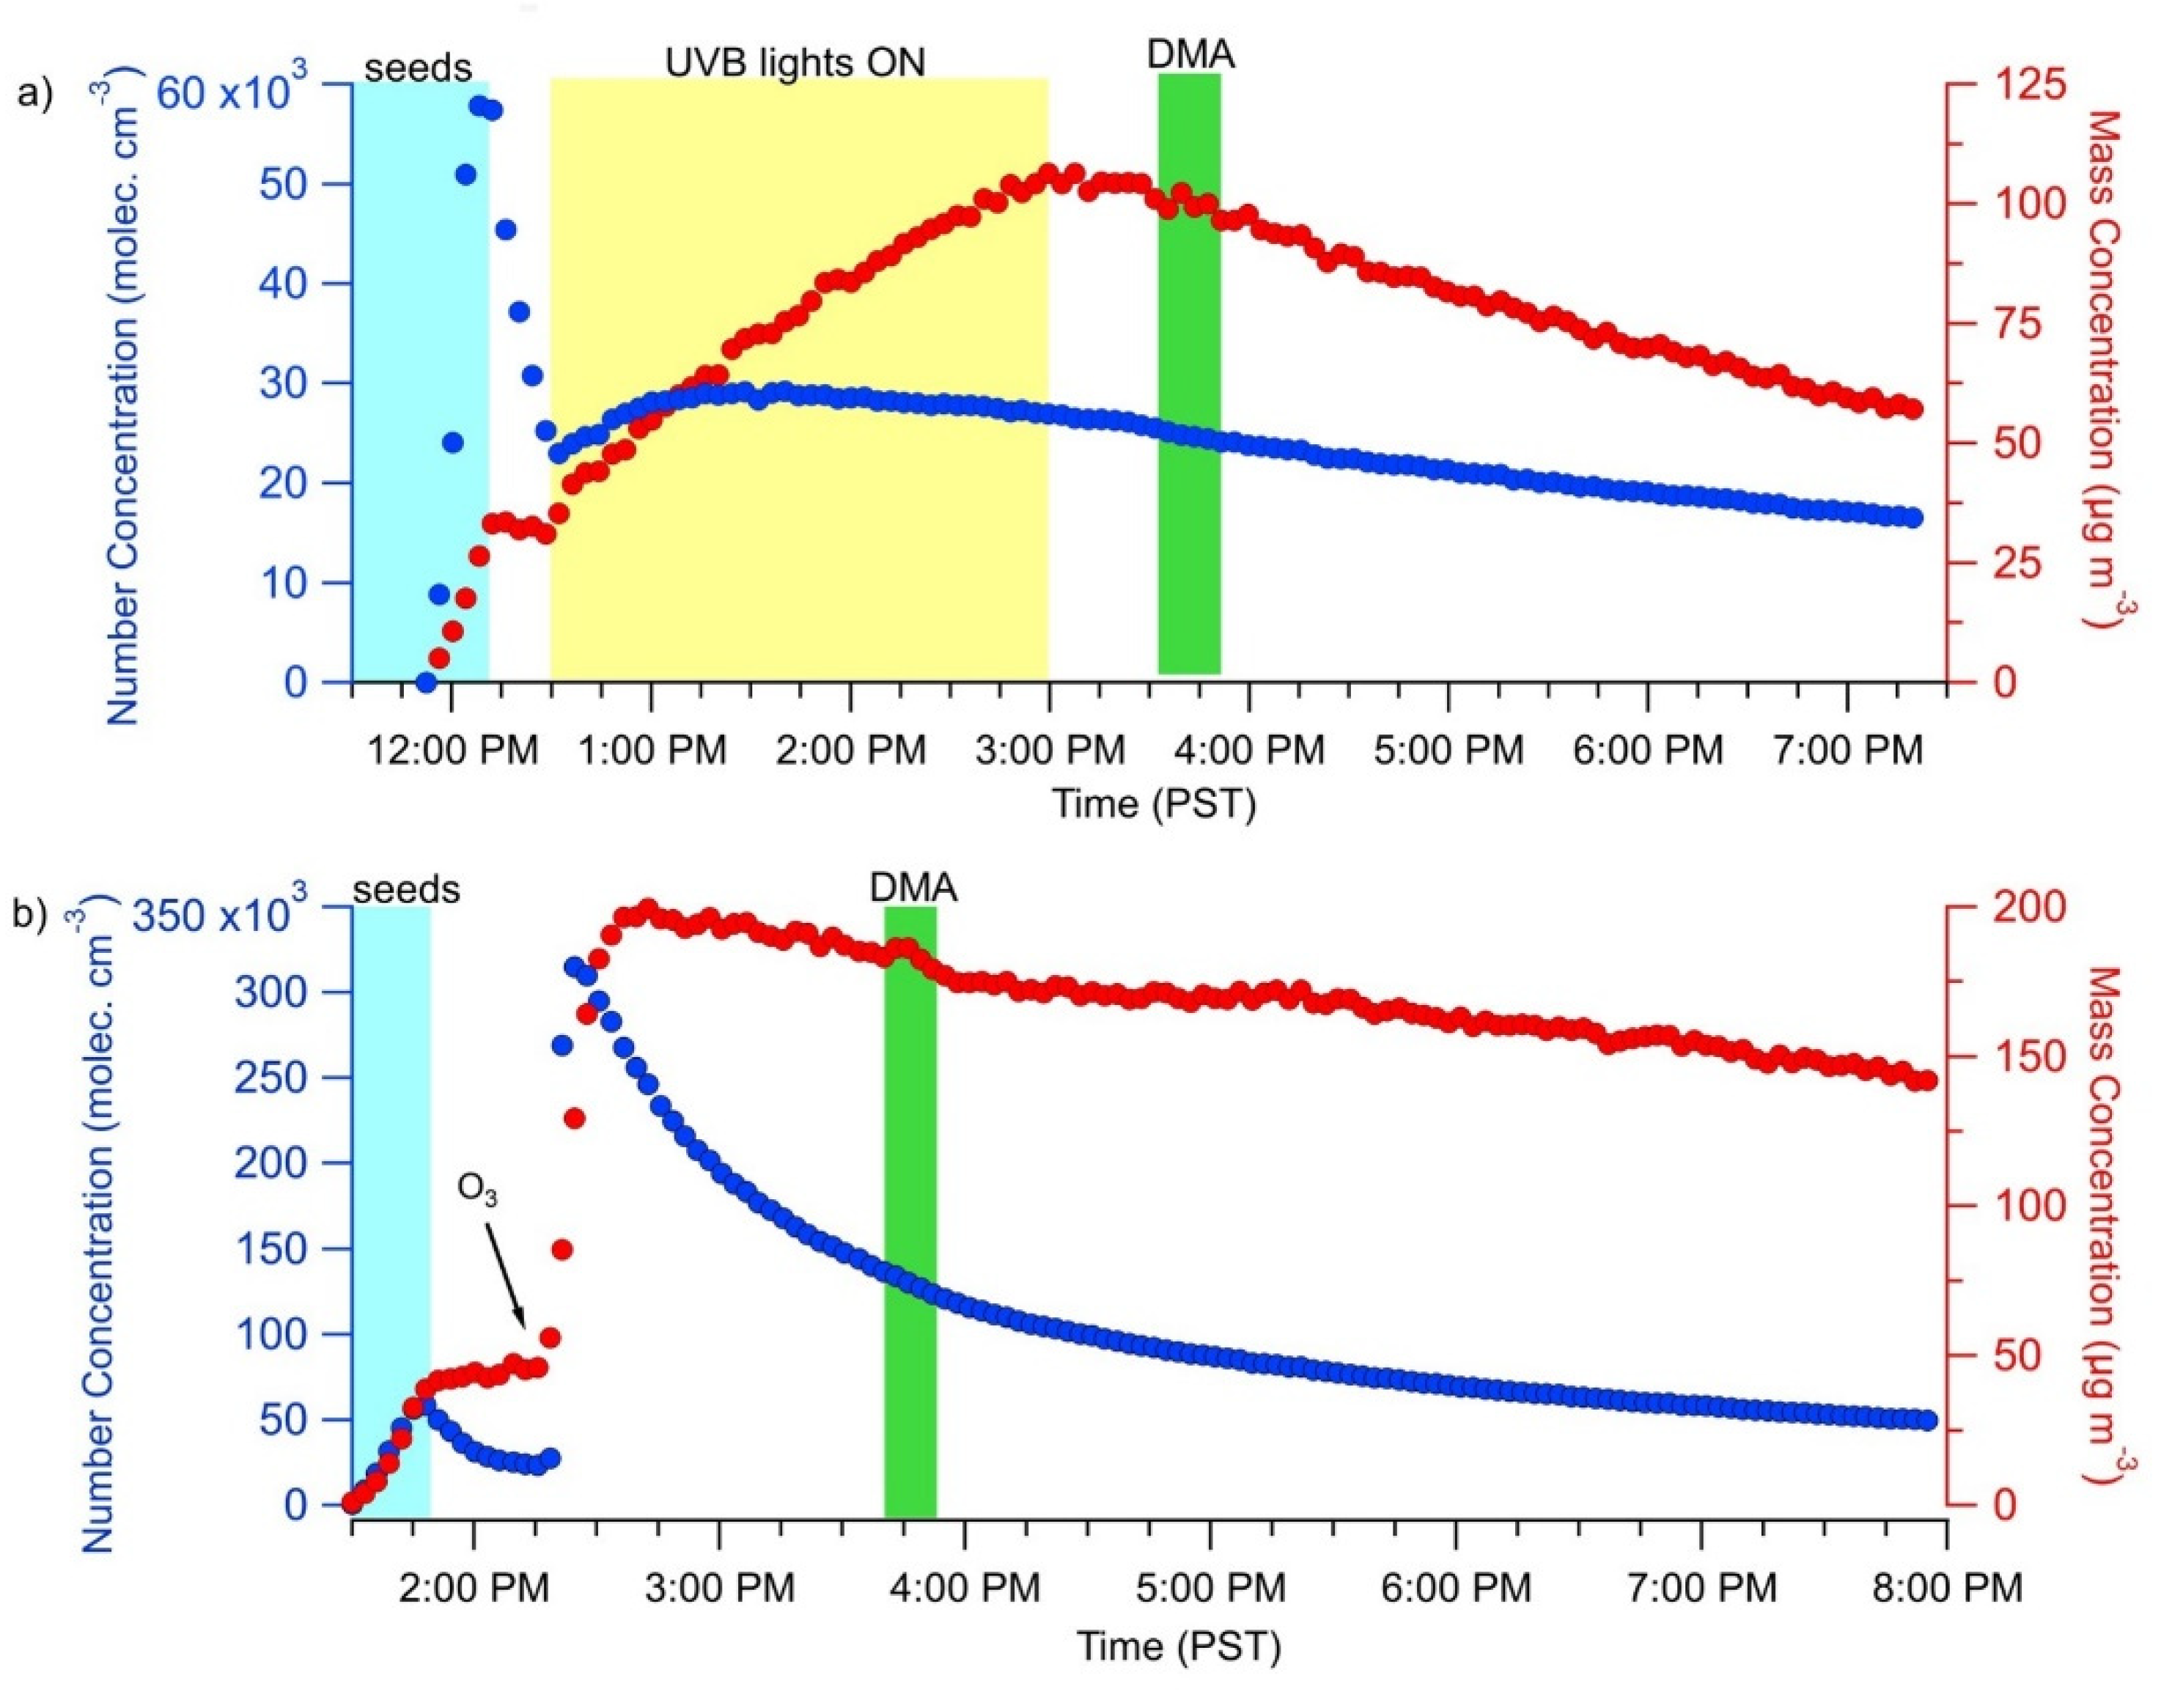
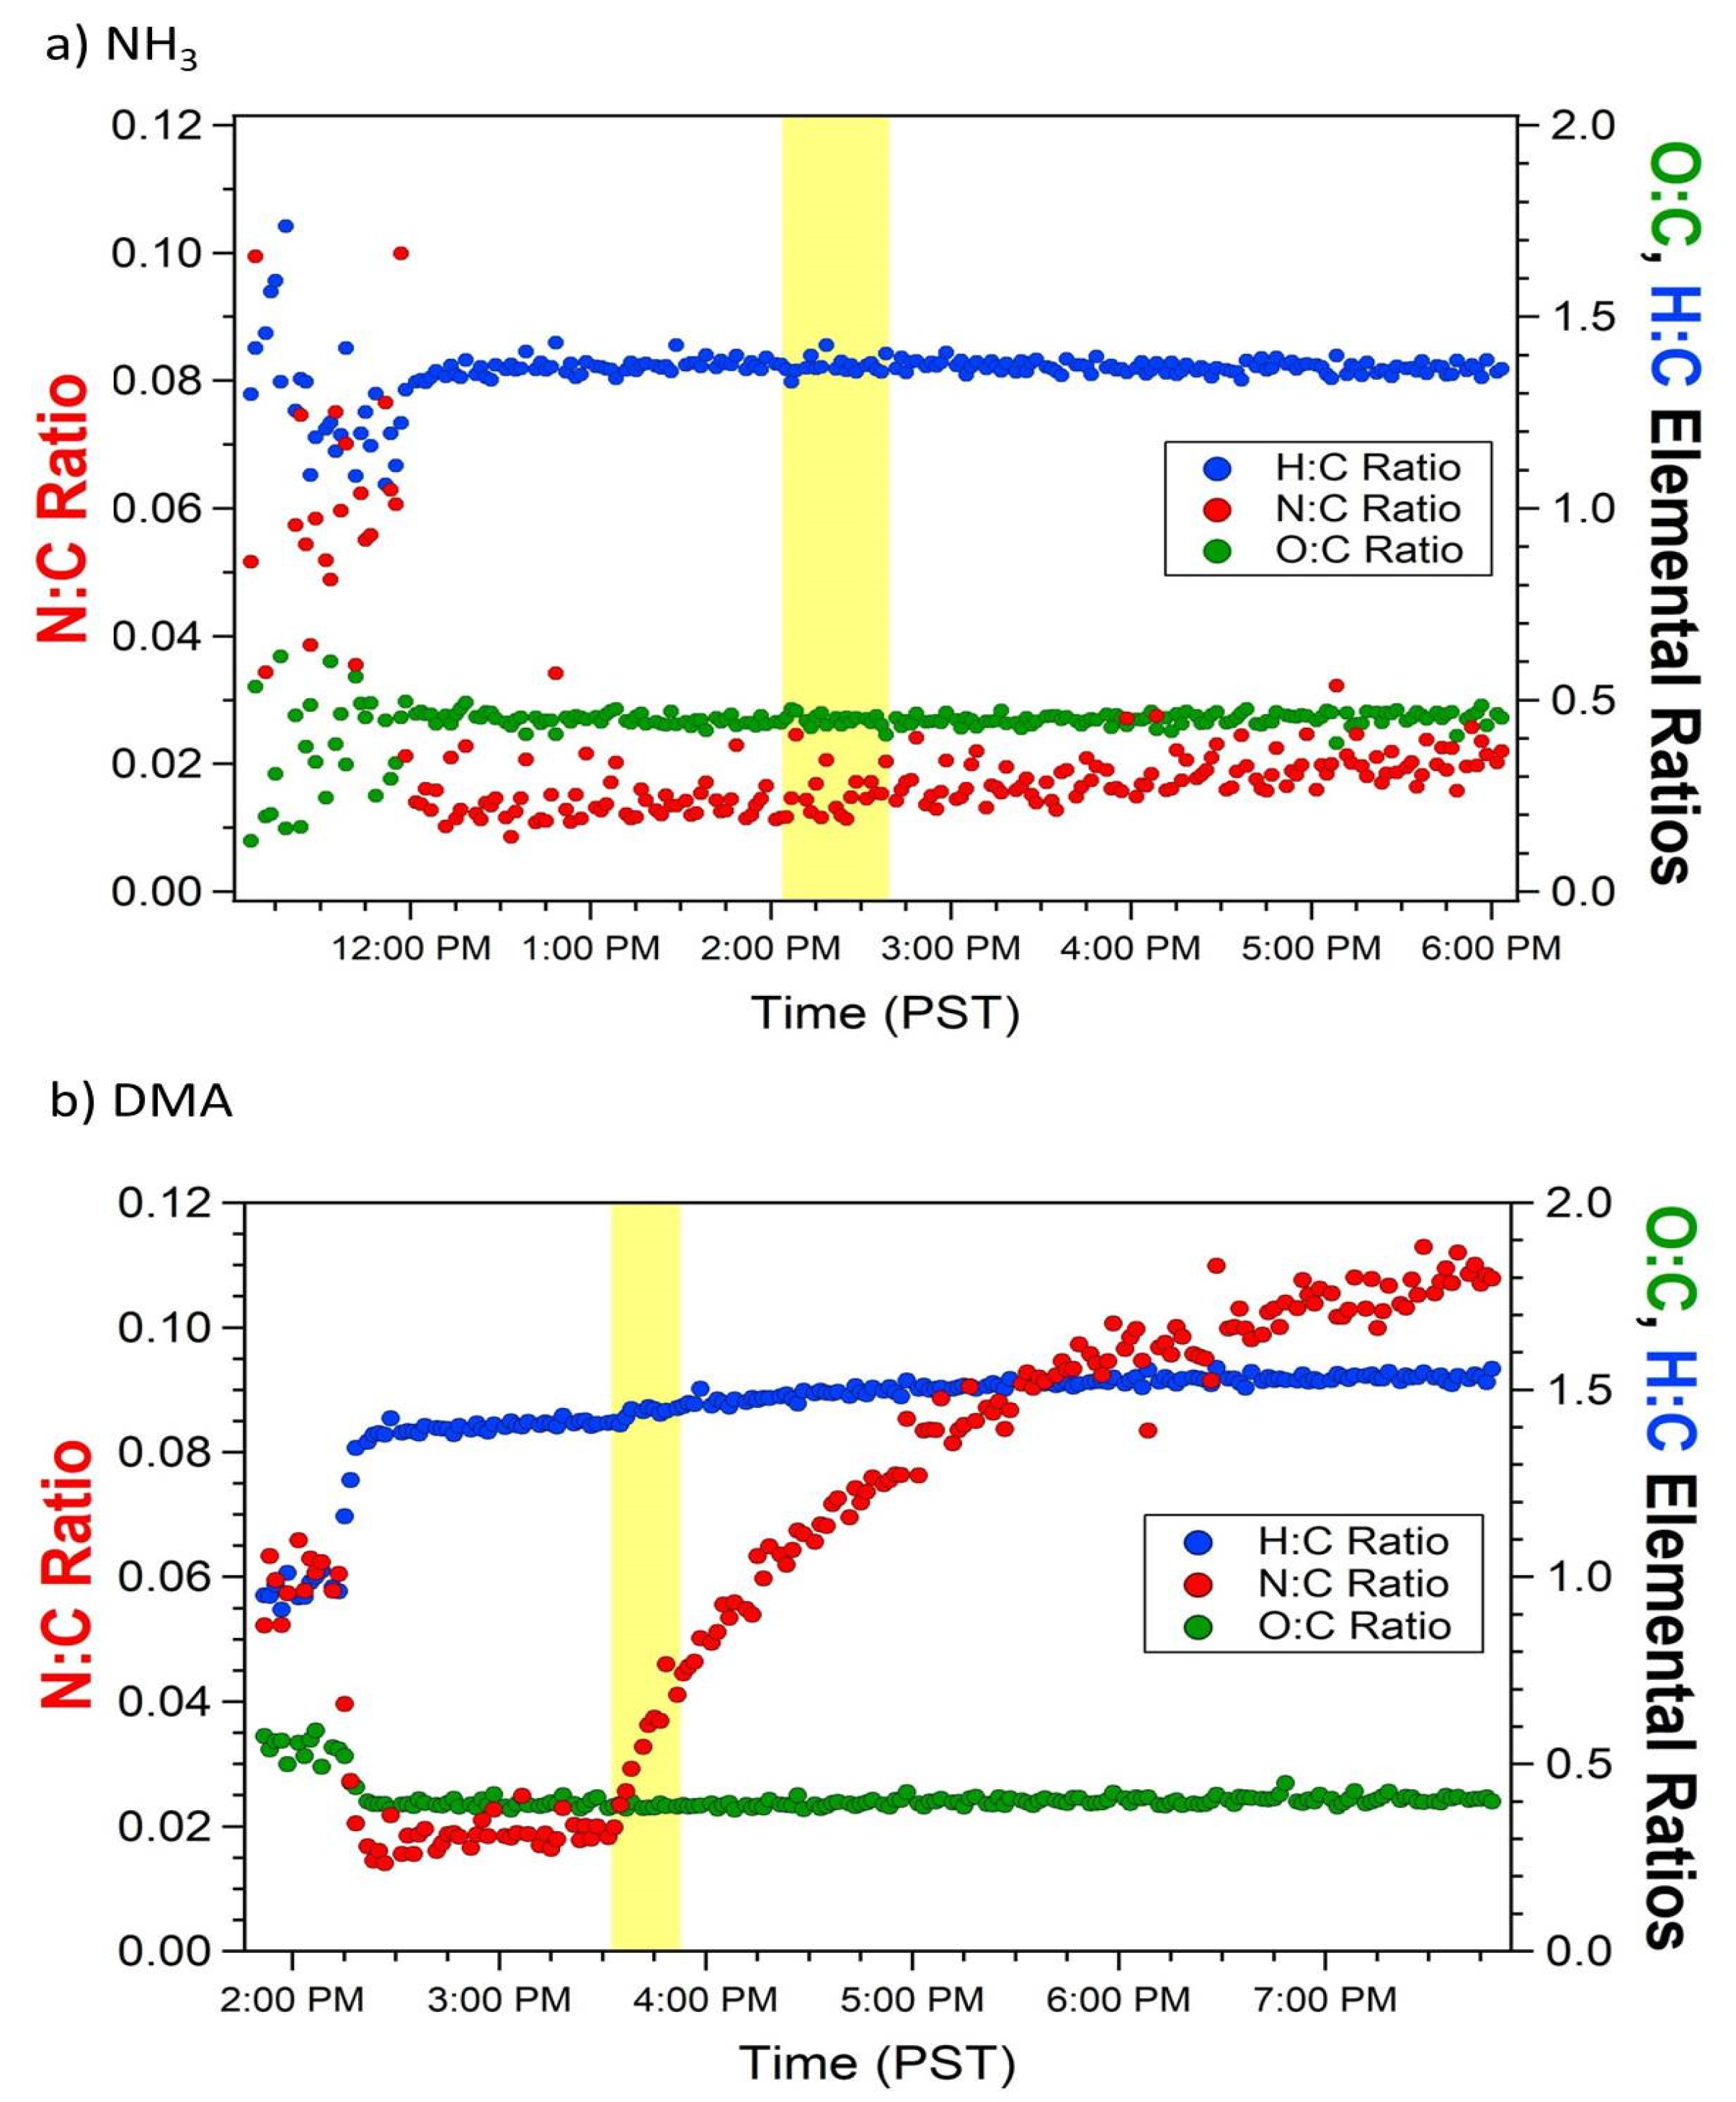
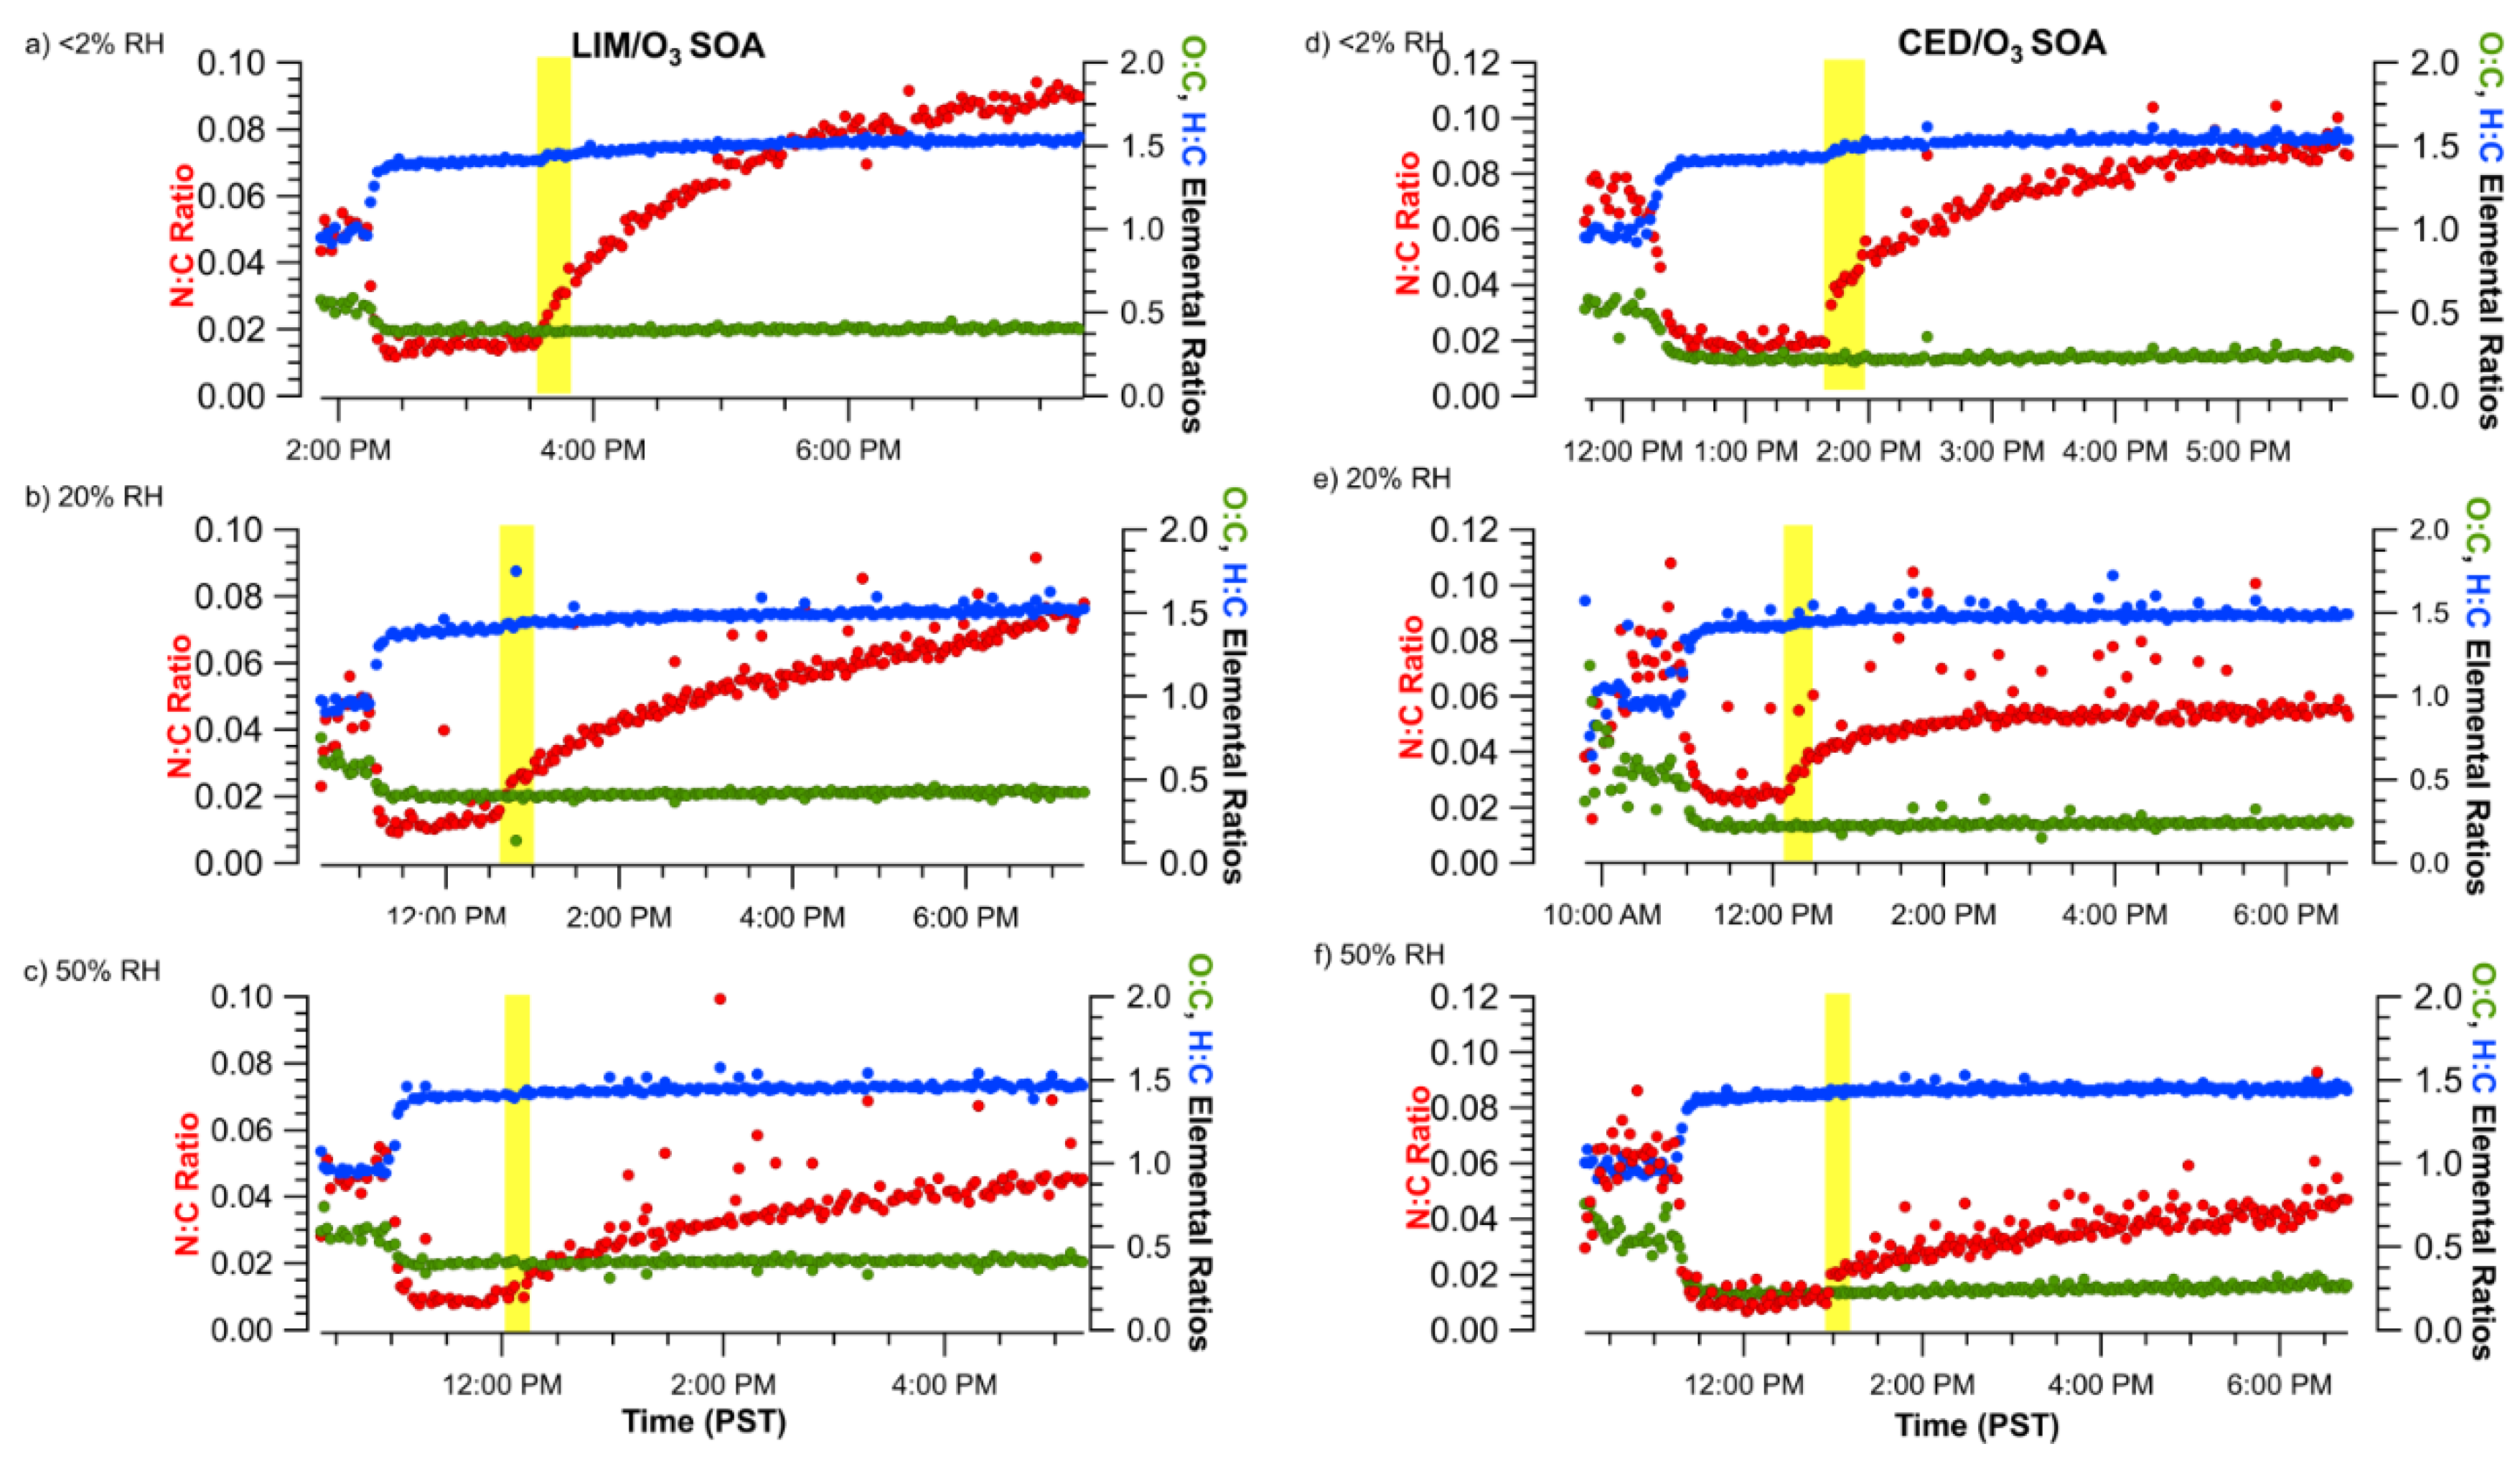
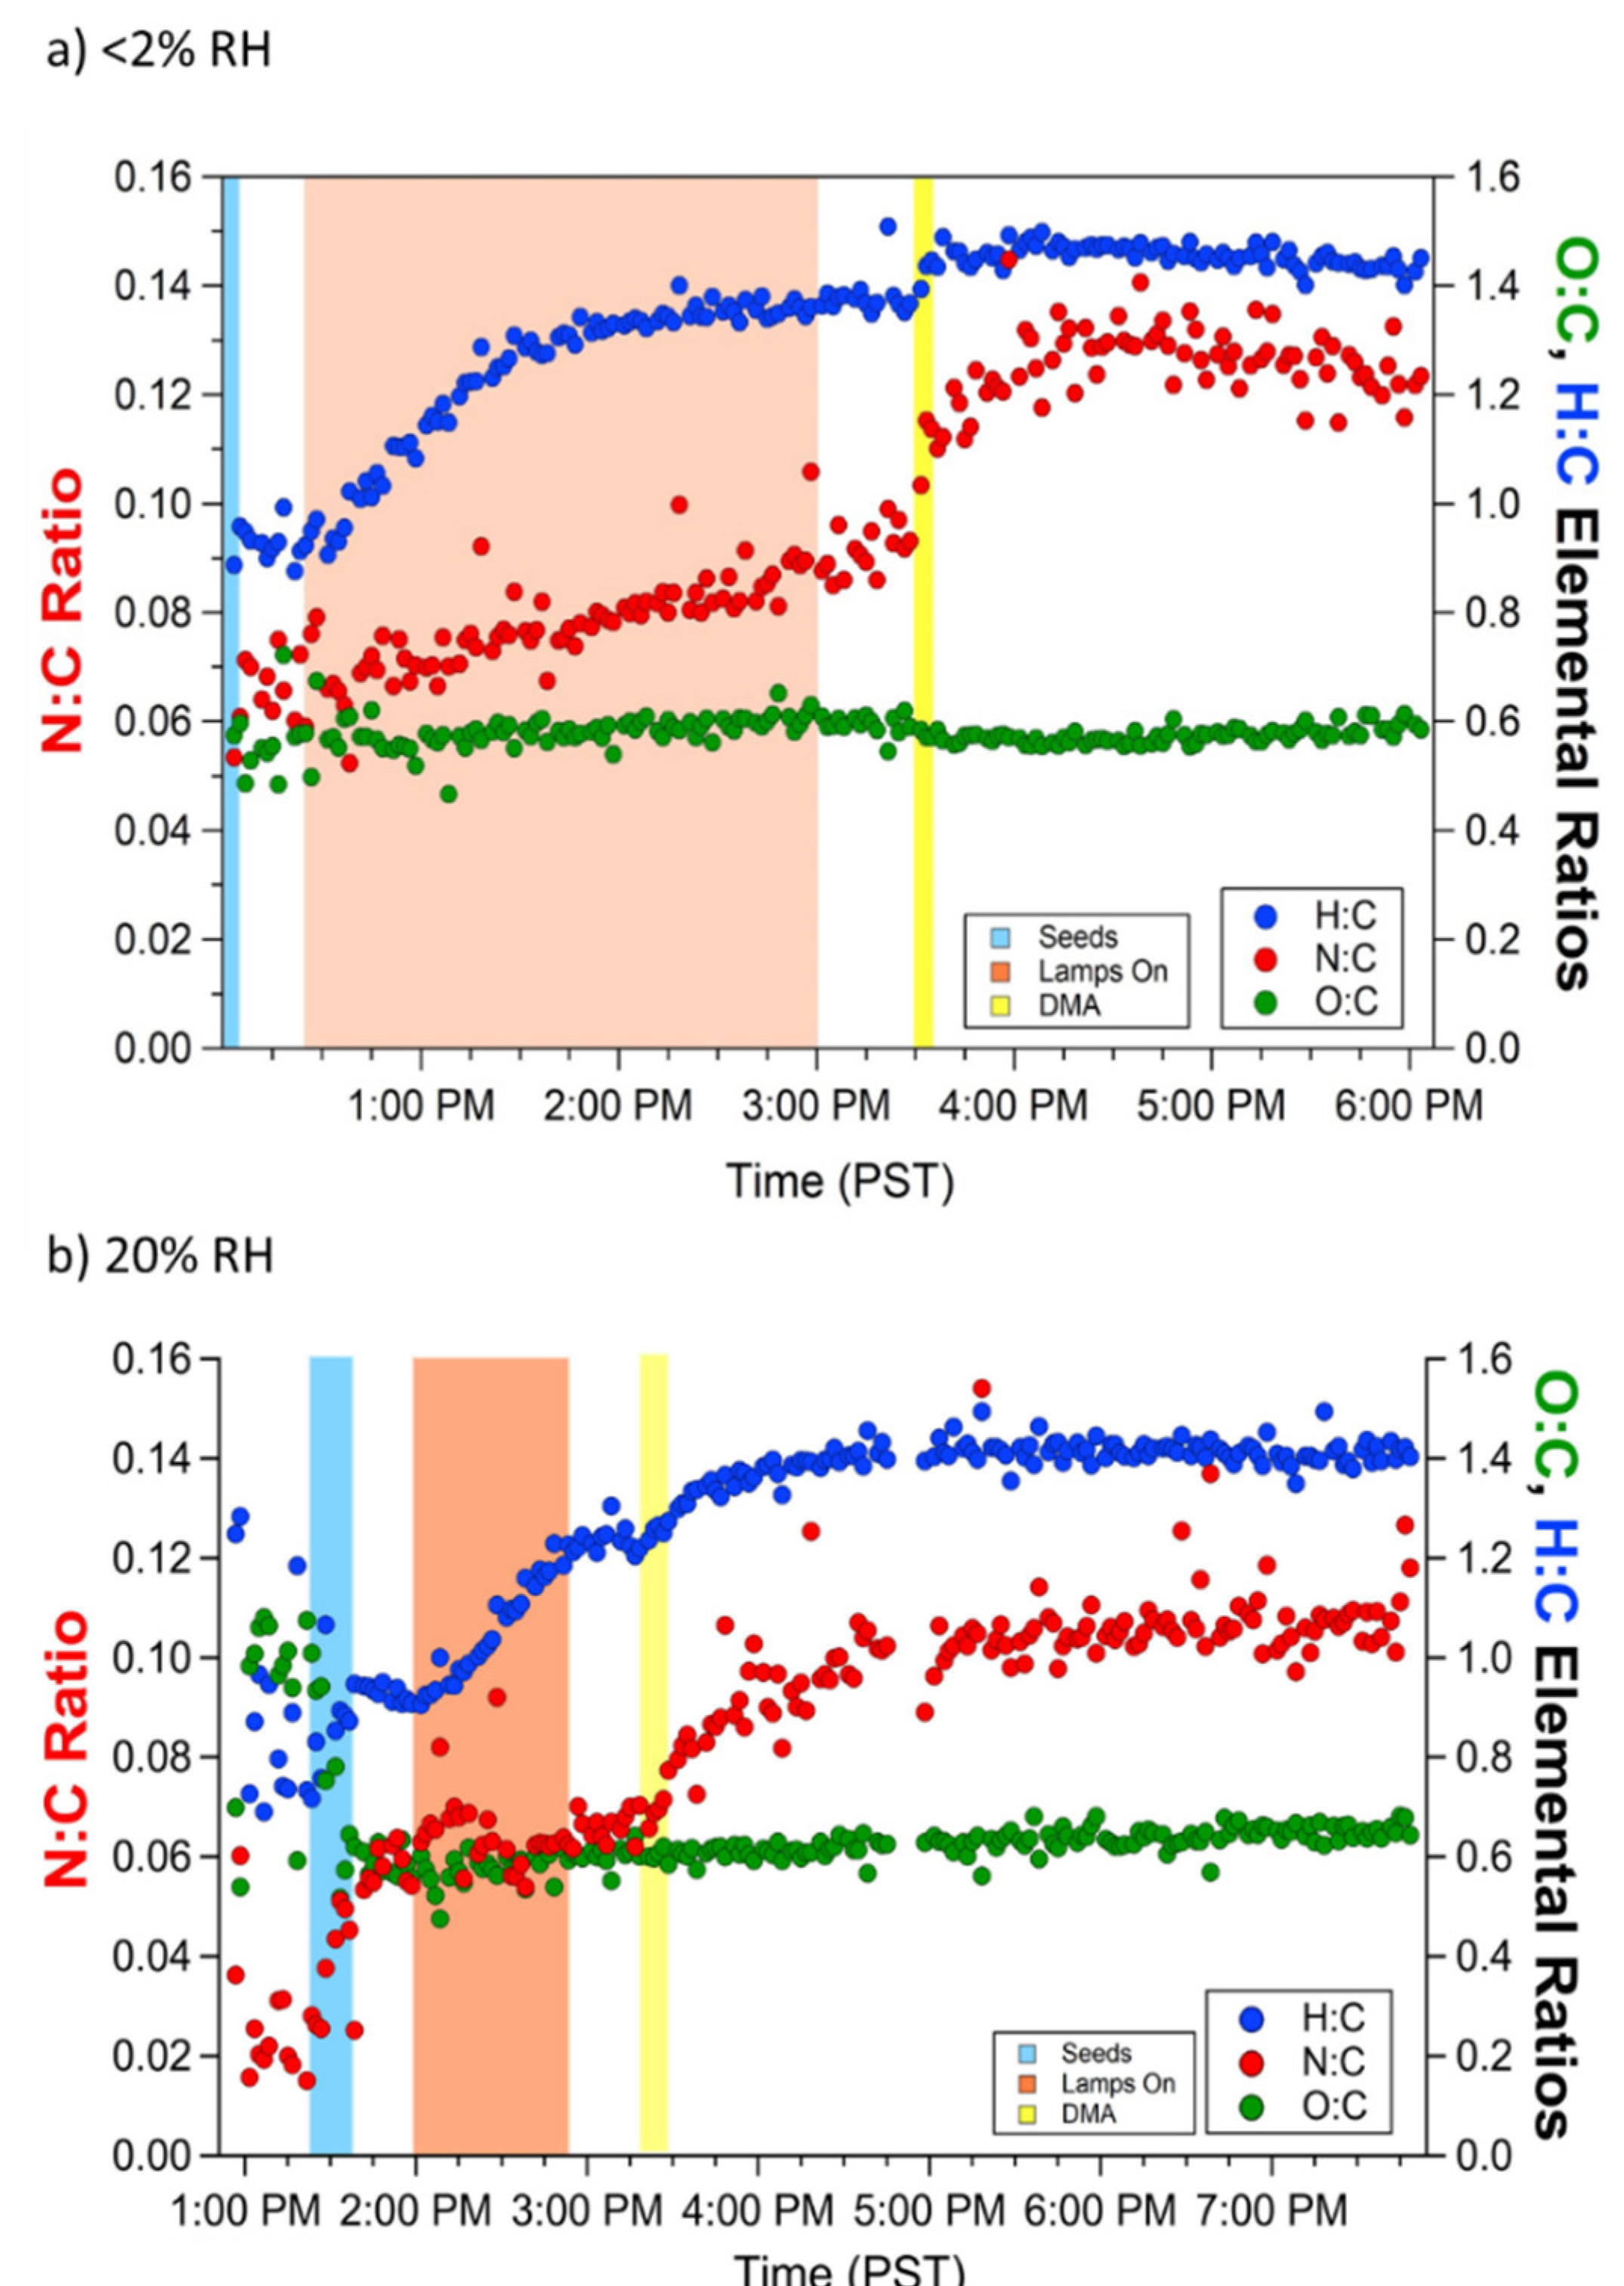
3.1. Effect of NH3 and DMA on SOA Concentration and Composition

Figure 1 is an example of SMPS-recorded data for typical DMA uptake by TOL/OH and LIM/O3 SOA at low relative humidity (<2% RH). The experiment began with the injection of nicotinic acid seeds (light blue region), which led to an initial rapid increase in particle number concentration (blue trace); subsequently, the number concentration decreased as seed particles coalesced and some were deposited onto the walls. As the SOA was generated through photooxidation (yellow region), the particle number concentration (blue trace) exhibited small changes while the particle mass concentration (red trace) rose significantly suggesting that most of the new SOA particles formed on the pre-existing seeds (Figure 1a). After photooxidation was stopped, the SOA was exposed to dimethylamine (green region) and the particle number and mass concentrations remained unaffected. This is consistent with our expectation that the chemical uptake of NH3/amine should not significantly change the mass of the reacting SOA because it is expected that the original SOA carbonyls and the NOCs they convert into will have a similar molecular weight due to loss of water molecules during the production of these NOCs.
SMPS data for d-limonene or α-cedrene SOA exposed to NH3 or DMA in the chamber were similar to that from toluene SOA. Again, as shown in Figure 1, there was no significant change in particle number and mass concentrations after exposure of the SOA to DMA. One distinction between the SOA made from the biogenic VOCs (d-limonene, α-cedrene) versus toluene was that the d-limonene and α-cedrene oxidation formed particles significantly faster. The dynamics of the system is seen in Figure 1b, whereupon the addition of O3 in the chamber, there is a rapid increase in the particle number concentration (blue trace), suggesting that upon oxidation new particles formed in addition to growing onto the pre-existing seed particles (this does not change the results of the AMS analysis described below because nicotinic acid was still present in some of the particles, and AMS spectra were averaged over many sampled particles).
Figure 2 compares the reactive uptake of NH3 to that of DMA by LIM/O3 SOA particles under low RH. For this comparison, d-limonene SOA was used because it exhibited a more efficient reaction with NH3 in comparison to toluene SOA [48]. When exposed to the same mixing ratios of NH3 and DMA (200 ppb), d-limonene SOA had a higher reactivity with DMA as shown by the faster and larger increase in the N:C ratio in the particles. More specifically, when exposed to NH3, the N:C ratios of the d-limonene SOA particles increased by 0.004 after nearly 2 h (Figure 2a); while the increase in the N:C ratios was an order of magnitude greater (ΔN:C = 0.073) 2 h after DMA exposure (Figure 2b). This finding is novel and suggests that DMA uptake will result in a larger organic nitrogen fraction in the condensed phase compared to NH3 uptake by SOA. Therefore, the amount of organic nitrogen in the particulate matter could be underestimated based on atmospheric models that currently neglect this formation pathway.
Figure 3 shows LIM/O3 SOA and CED/O3 exposed to DMA at varying levels of RH. The exposure of LIM/O3 SOA to DMA (yellow region) under low RH (Figure 3a) led to an increase in the N:C ratio of 0.073. As the RH increased to 20% (Figure 3b, ∆N:C = 0.039) and then to 50% (Figure 3c, ∆N:C = 0.026), the change in the N:C ratios for the particles after DMA exposure was not as large. A similar trend was observed for CED/O3 exposed to SOA at varying RH, where the largest change in N:C ratio after DMA uptake was observed at low RH (Figure 3d, ∆N:C = 0.048) whereas the increase in the N:C ratios was suppressed at elevated RH as shown in Figure 3e for 20% (∆N:C = 0.021) and Figure 3f for 50% RH (∆N:C = 0.017). These observations are consistent with the proposed mechanism outlined in Rxn 4 where the uptake of amines leads to condensation reactions where one or more water molecules are produced, therefore as RH increases and the reverse reaction is favored, the uptake of DMA is suppressed. The competing effect of slowing the reaction by more viscous particles at lower RH is not as important. The increase in the N:C ratio, due to DMA uptake, also appears to be precursor dependent.
Figure 4 shows toluene photooxidation SOA exposed to DMA at low and 20% RH. The exposure of toluene SOA to DMA (yellow region) increased the N:C ratio of approximately 0.040 at both low (Figure 4a) and 20% RH (Figure 4b) after 2 h. In addition, there was an increase in the H:C ratio of 0.012, which is consistent with the replacement of C=O with C=NH, indicating that DMA uptake led to the formation of NOCs within the aerosol. Figure 4a shows an initial increase in the N:C ratio during the lamps on a period (red region) which was attributed to nicotinic acid seed particles coalescing with other particles during SOA formation, as seen in the number concentration data in Figure 1a. This effect was less pronounced at 20% RH because the particle yield was lower and therefore the coagulation with other particles was as not as prominent. As the N:C ratios were not corrected for particle coagulation, the increased error is expected for the N:C and DMA uptake coefficients reported for the toluene dataset. Within this range of RH (0–20%), Liu et al. (2018) reported no significant change in NH3 uptake by toluene SOA [51]. In that same publication, they reported an increase in NH3 uptake by toluene SOA with an increase in RH when the RH was between 20% and 60%, explaining that the limitations in mass transfer rate for uptake due to the high viscosity of toluene SOA at low RH disappear at RH > 20% [51]. Unfortunately, our toluene SOA measurements at 50% RH were not reliable due to the strong suppression of SOA yield at elevated RH, and therefore the conclusions made by Liu et al. (2018) could not be verified in this work. Additional experiments using a higher particle concentration for increased humidity are needed to identify the impact RH has on DMA uptake by toluene SOA.
When looking at the N-containing families, the largest increase after DMA exposure was in the CHN family for all three SOA systems investigated (shown in Figure 5), indicating that DMA uptake led to an increase in organic nitrogen within the particles. The 15 most prominent N-containing fragments observed using the AMS after DMA exposure to LIM/O3 SOA, CED/O3 SOA, and TOL/OH SOA are reported in Table S1. These fragments were taken from mass spectra averaged over the time DMA was injected until the end of the experiment. The fragmentation pattern for nicotinic acid seed aerosol is shown in Figure S3a (average mass spectrum extracted from when only seed was present in the chamber prior to generation of LIM/O3 SOA at <2% RH) and the top 6 N-containing fragments from this mass spectrum are listed in Table S2. The average mass spectrum for LIM/O3 SOA after exposure to DMA is shown in Figure S3b. Nicotinic acid does fragment into some higher carbon atoms fragments (Table S2), but only contributes to a minor portion of the overall signal after exposure of the particle to DMA.
The dominant fragment ion of aliphatic amines in electron impact ionization is formed through alpha-cleavage [57]. This has been observed in the AMS with secondary and tertiary amine salts [58]. In the case of DMA, the alpha-cleavage fragmentation would form m/z 44.050, which corresponds to the dominant N-containing peak (C2H6N+) in the CED/O3 and TOL/OH experiments, and the fourth largest in the LIM/O3 experiment at low RH. In addition, the presence of m/z 45.058 within the SOA (Table S1), which has the same mass as DMA+ (C2H7N+), could indicate that a portion of DMA uptake may lead to non-reactive uptake within the time of the experiment. However, distinguishing salts of DMA from NOCs (which could produce a similar m/z) formed during reactive uptake is difficult based on AMS data alone. Therefore, the extent to which non-reactive uptake of DMA occurred in the SOA systems investigated is not clear.

3.2. Uptake Coefficients from NH3 Monitor Data

When SOA in the chamber was exposed to a pulse of NH3 or DMA, the measured concentration of NH3 and DMA decayed (Figure S4) and NOC fragments started to appear in the AMS spectra. The uptake coefficients for NH3 and DMA were independently calculated in two ways: from observing the decay of these compounds measured with the NH3 monitor and from the build-up of NOC measured by AMS. A first-order exponential decay fit was applied to the decay curve of NH3 or DMA mixing ratios plotted over time between peak NH3 or DMA concentration until the end of the chamber run (an example is shown in Figure S4). The rate of loss of NH3 or DMA in presence of SOA was an order of magnitude larger than in an empty chamber (Figure S5), and no correction for the wall loss was applied. The first-order loss rate coefficient, k (s−1) extracted from the decay fit equation, was used in Equation (1) to determine the effective reactive uptake coefficient ( γ ) for NH3 or DMA by the SOA particles.
γ = 4 × k v N H 3 × c a r e a
At room temperature, the average speeds of NH3 molecules (νNH3) and DMA molecules (νDMA) are 6.1 × 10² m s−1 and 3.7 × 10² m s−1, respectively. The particle surface area concentrations, c a r e a (m2 m−3), were calculated by averaging the total surface area of the particles (obtained from the SMPS) from the point of NH3 or DMA peak concentration through the end of the experiment. This time segment matched the period for which the first-order loss rate coefficient was calculated. Note, that this method cannot distinguish uptake due to the formation of organic nitrogen compounds in particles, and the neutralization of acids. Therefore, it measures the total uptake coefficient. This method also cannot distinguish a decrease in signal due to gas-phase wall loss.
In this approach, the number of moles of nitrogen added to the particles, n N a d d e d (mol), can be predicted from the loss in the concentration of NH3 or DMA after injection, neglecting gas-phase wall loss. For simplicity, NH3 is used in the following equations, but similar equations can be used in the same manner for DMA.
n N a d d e d = ( [ NH 3 ] 0 [ NH 3 ] t ) × V c h a m b e r
The starting concentration of NH3, [NH3]0, depends on the known amount we inject, and the concentration of NH3 at some later time t, [NH3]t, can be obtained from the first-order decay fit of the NH3 loss. The volume of the chamber (Vchamber) was 5 m3. Therefore Equation (2) above can be expressed as:
n N a d d e d = [ NH 3 ] 0 × ( 1 e k × t ) × V c h a m b e r
The first-order loss rate coefficient, k , is the same one used in the uptake coefficient calculations in Equation (1) above.

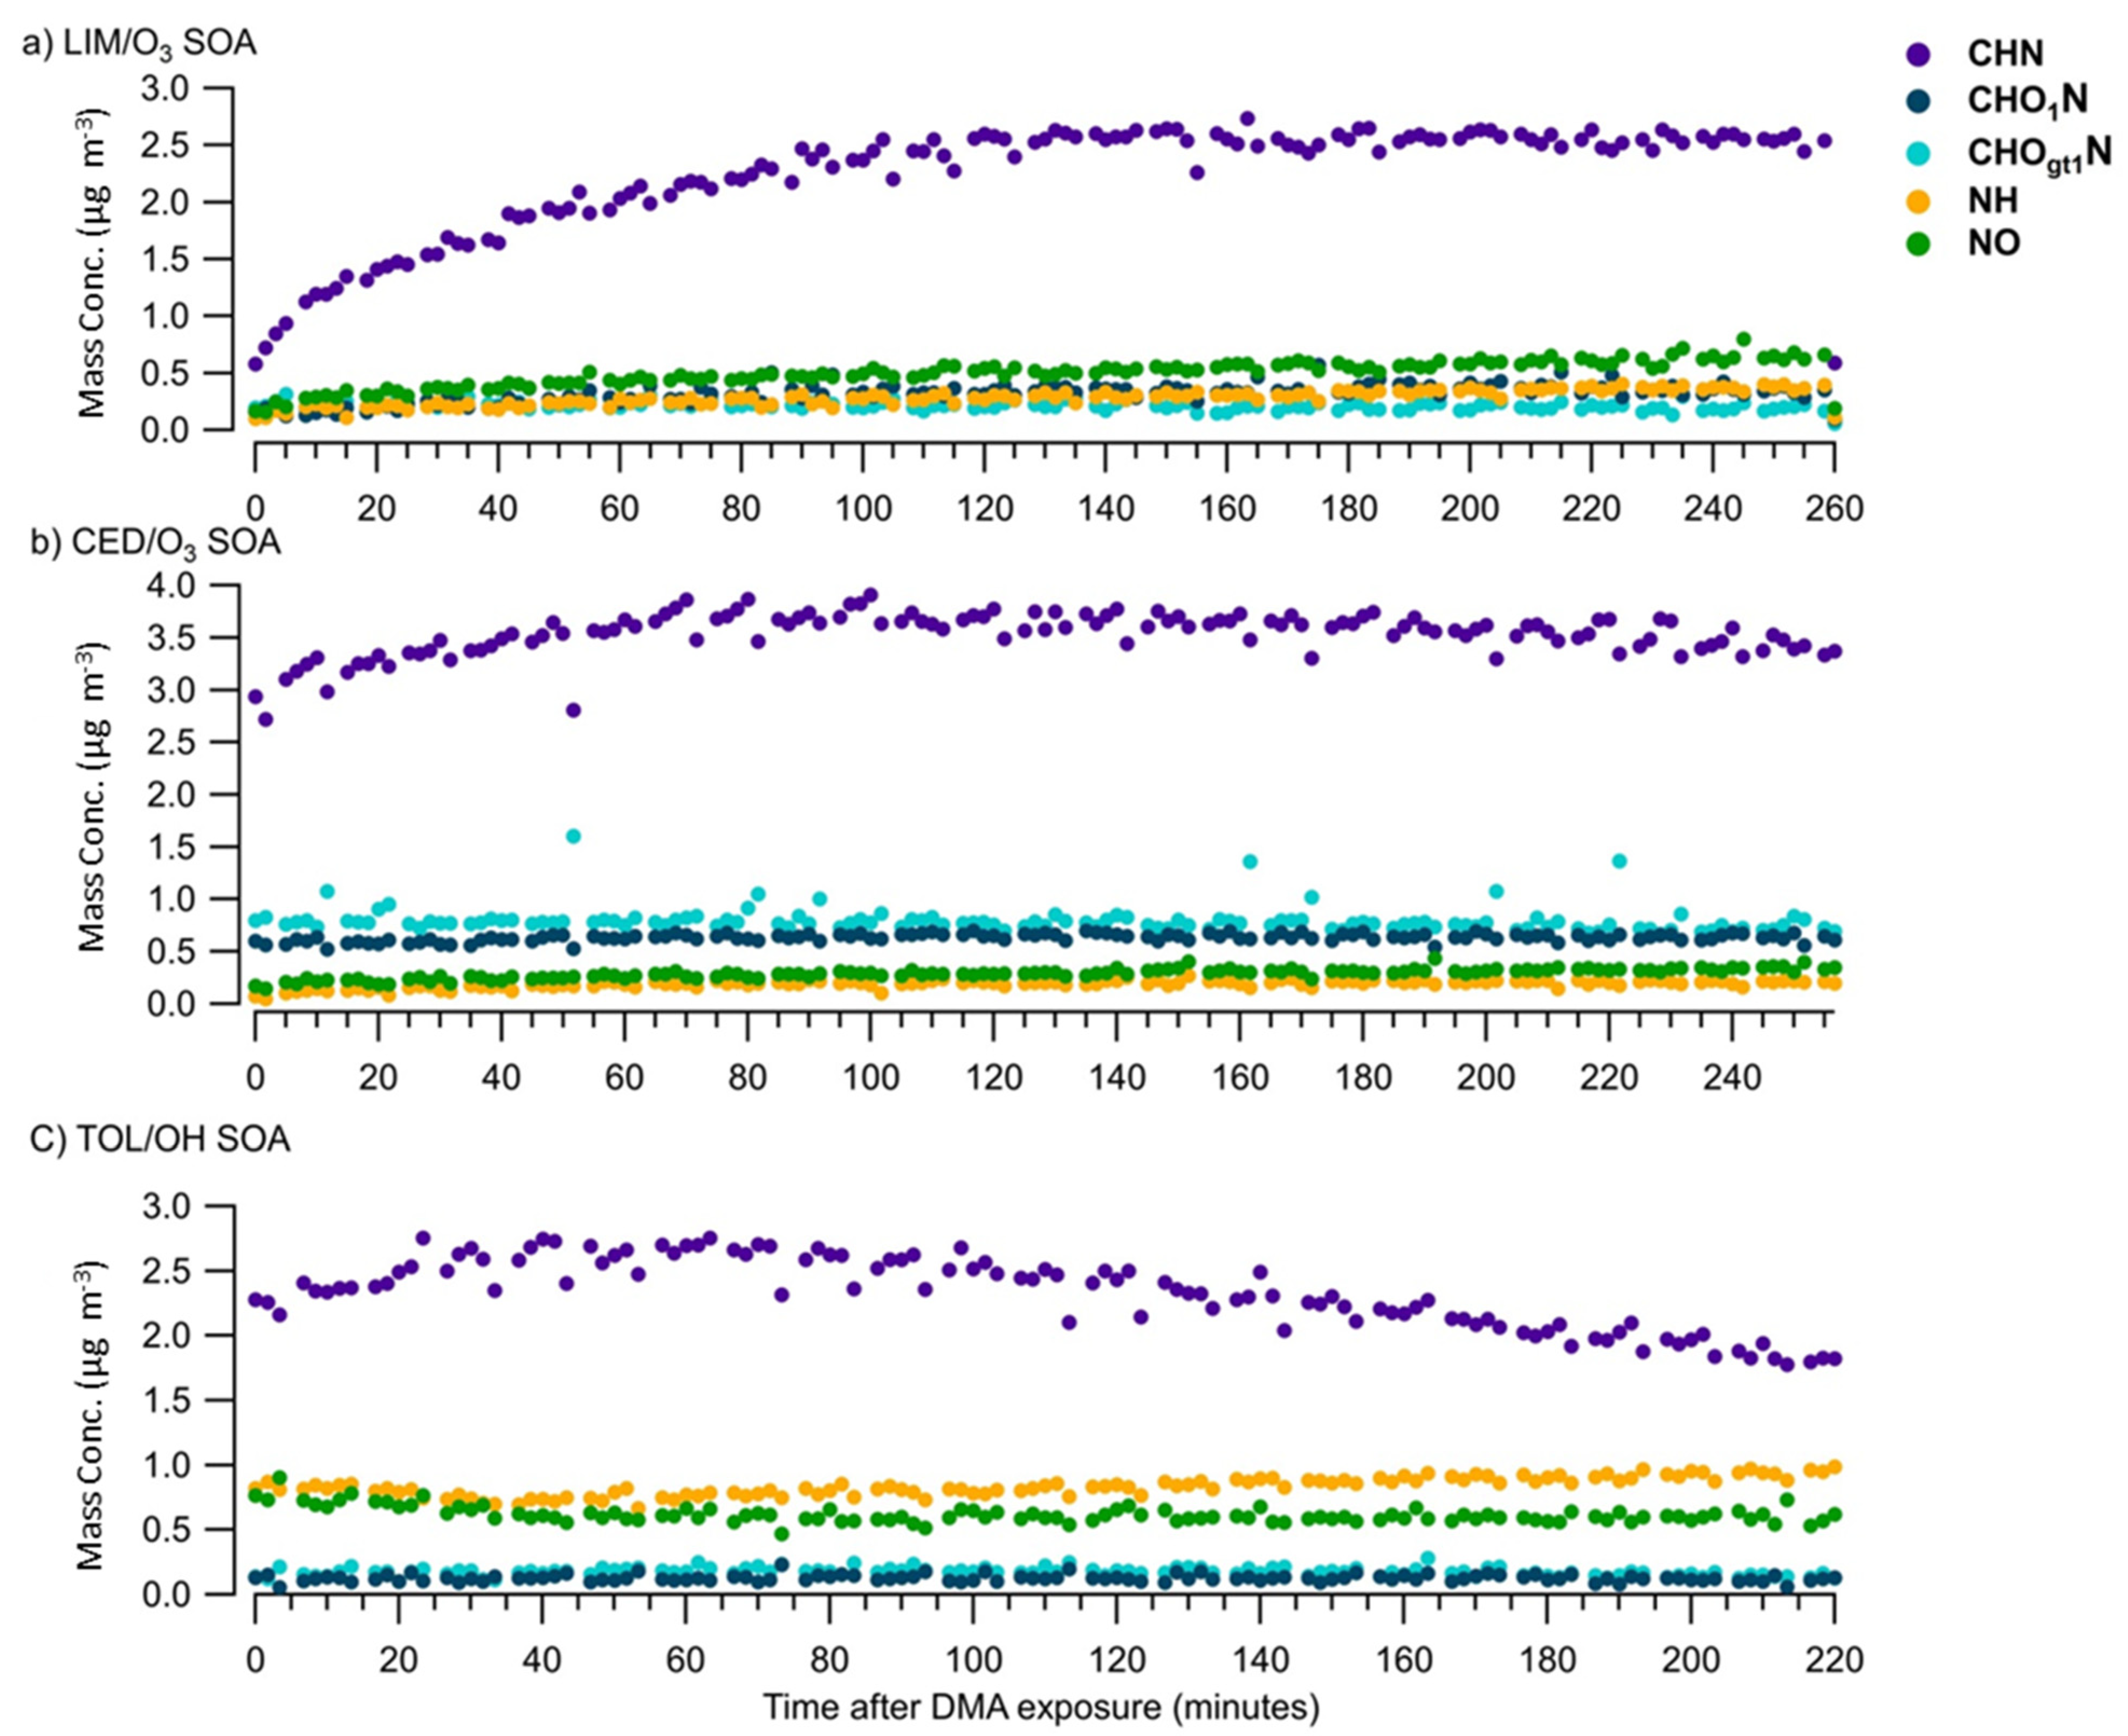
3.3. Uptake Coefficients from AMS Data

Elemental composition from the AMS data was used for direct measurement of the amount of N added to the particles. AMS can sensitively detect the presence of nitrogen in particles, and furthermore, it can measure separately organic and inorganic nitrogen. Prior to NH3 or DMA injection, nicotinic acid was the only source of N in the particles and was responsible for the initial average total N:C ratio of the particles. After the injection of NH3 or DMA, the increase in the N:C ratio of the particles was used to calculate the moles of organic N added due to the reactive uptake of NH3 or DMA by the SOA particles, using the following equation:
n N a d d e d = n N 0 × ( N : C   after   NH 3   injection N : C   before   NH 3   injection 1 )
The initial moles of nitrogen in the particles ( n N 0   were calculated from the concentration of nicotinic acid seed aerosols present in the chamber before organic aerosol formation and before NH3 or DMA injection. Equation (4) assumes that the amount of organic carbon in particles is not strongly affected by the reaction of SOA with NH3 or amine (this assumption is confirmed by explicit measurements as discussed below). It also assumes that AMS is equally sensitive to the nicotinic acid and to the organic nitrogen compounds formed in the reaction. This assumption is hard to test, but it is reasonable, given that light-absorbing NOC are believed to be N-containing heteroaromatic compounds [59].
The NH3 monitor method cannot distinguish uptake due to wall loss or the formation of organic nitrogen compounds in particles due to neutralization of acids and physical dissolution of NH3 or amine in the particle material. Therefore, it measures the total uptake coefficient. Given that the elemental ratios in the particles as determined with the AMS should be less sensitive to wall loss effects, AMS data were used to obtain a normalized uptake coefficient, using the following equation:
normalized   γ N H 3 = γ N H 3 × n N a d d e d   ( AMS ) n N a d d e d   ( NH 3   monitor )
The calculated uptake coefficients, normalized uptake coefficients, and moles of added nitrogen calculated using both the NH3 monitor and AMS are reported in Table 1. In addition, the difference in N:C ratios before and 2 h following NH3/DMA injection are reported in Table 1, based on AMS data. The normalized NH3/DMA uptake coefficients were an order of magnitude lower (10−4 to 10−5 for most trials). As mentioned previously, LIM/O3 SOA uptake was more efficient when exposed to DMA compared to NH3; for example, at <2% RH DMA uptake after normalization was 8.0 × 10⁻⁵ compared to 1.2 × 10⁻⁵ for NH3. Although NH3 uptake was less than DMA for the SOA systems studied here, there was a trend with greater NH3 uptake typically occurring at lower humidity as seen with LIM/OH and LIM/O3 SOA. There are some discrepancies between the uptake coefficients calculated for replicates, such as those for LIM/O3 SOA exposed to NH3 at 50% RH (2.0 × 10⁻⁴–6.4 × 10⁻⁴), which is attributed to scattering within our measurements. In addition, there are similar uptake coefficients between LIM/O3 and LIM/OH at 20% RH and <2% and up to 4.5 times difference at 50% RH. This was attributed to a larger increase in the N:C ratio at lower RH from increased SOA yield, whereas at higher RH the SOA yield was suppressed leading to more scatter in the data points and increased error in determining elemental ratio changes.
LIM/O3 SOA exhibited higher DMA uptake coefficients at low RH compared to CED/O3 SOA and TOL/OH SOA, indicating that uptake is precursor dependent. More measurements are needed to confirm the DMA uptake coefficient trend with TOL/OH SOA at varying RH. However, from the two RHs investigated, the normalized uptake coefficients for DMA were slightly higher at 20% RH (7.6 × 10⁻⁵ and 1.0 × 10⁻⁴) compared to <2 %RH (3.4 × 10⁻⁵) although the calculated change in N:C ratio 2 h after the DMA injection was similar amongst the three trials (∆N:C= 0.04). These findings could suggest that highly viscous SOA, such as TOL/OH SOA is more sensitive to diffusion limitations rather than RH suppression of NOC formation. Therefore, it is recommended that more SOA systems be investigated to help elucidate the effect of particle viscosity on NH3 and amine-reactive uptake by SOA. In addition, experiments using the same SOA system over a variety of temperatures, crossing the glass transition temperature, are recommended to observe the effects of particle viscosity on NH3 or amine uptake by SOA.

4. Atmospheric Implications

In a recent study by Zhu et al. 2018, the mass of SOA in the atmosphere over the contiguous U.S. was simulated using a modified chemical transport model (WRF-CMAQ) that incorporated a first-order loss rate for NH3 onto SOA for winter and summer of 2011 using a range of NH3 uptake coefficients (10−5–10−3) [60]. Zhu et al. found the NH3 uptake coefficient of 10−5 did not impact the total SOA mass yield significantly, whereas at 10−3 there was a strong effect [60]. In this study, the uptake coefficients for NH3 were on the order of 10−4, which falls within the range of previously reported NH3 uptake coefficients for α-pinene ozonolysis SOA and m-xylene SOA [61]. DMA uptake coefficients determined in this study ranged from 10−4–10−3, with higher uptake coefficients observed for TOL/OH SOA than in the LIM/O3 or CED/O3 SOA at high RH. Overall, most NH3/amine uptake coefficients were found to be on the order of 10−4, which is in the middle of the range found in Zhu et al. 2018. However, after normalizing the uptake coefficients (to account for possible gas-phase wall loss in the chamber) they are closer to the lower end of the range (10−5) simulated by Zhu et al. 2018, meaning the effect is not likely to be strong for SOA mass (0.9% increase in biogenic SOA mass in the summer compared to the base case of no uptake). Although the effect on SOA mass is not predicted to be large, the indirect impact that NH3/amine uptake by SOA would have on increased aerosol aqueous-phase acidity (through a reduction in NH4+ originally formed from NH3 that is instead being converted into NOCs), is still large. Zhu et al. 2018 reported an interesting effect that even at a low uptake coefficient of 10−5 there was an increase in the AISO3 (isoprene epoxydiols derived from acid-catalyzed ring-opening reactions) mass concentration by 16.2% during the summer compared to the base case of no NH3 uptake [61]. This pathway demonstrates the significant effect that NH3/amine uptake has on atmospheric chemistry even at considerably low uptake coefficients and the need for including such a parameter into air-quality models for more representative simulation results.
This study illustrates that DMA uptake to secondary organic aerosol is more efficient than that of NH3 by secondary organic aerosol. Thus, while NH3 is more abundant in the atmosphere, amine uptake may still be a potential source of organic nitrogen in particulate matter. This idea is indirectly supported by field studies in which amine concentrations are more similar to NH3 concentrations in the particulate phase than in the gas phase [30,31]. Emission inventories for amines are not as robust as for NH3, making air quality simulations (as described earlier for NH3 uptake) difficult. However, the experiments suggest that the uptake of amines may be an important source of organic N in particulate matter. Here, the focus was on DMA, a C2 amine, but other common atmospheric C1–C6 amines remain to be explored and those with even lower volatilities than DMA may lead to more efficient uptake by SOA.
The observations reported are consistent with previous studies suggesting that the reaction of NH3 with carbonyls in the SOA resulting in the loss of water is an important pathway in the uptake of NH3 by SOA. Amine reactions may undergo similar dehydration reactions and therefore as relative humidity increased, the reverse reaction was favored resulting in the observed suppression of amine uptake by LIM/O3 and CED/O3 SOA.

Supplementary Materials

The following are available online at https://0-www-mdpi-com.brum.beds.ac.uk/article/10.3390/atmos12111502/s1, Figure S1: Flowchart of SOA systems investigated, Figure S2: NH3 monitor response to DMA injections, Table S1: Prominent N-containing fragments after DMA exposure, Figure S3: Average mass spectrum for nicotinic acid and LIM/O3 SOA after DMA exposure, Table S2: Prominent N-containing fragments from nicotinic acid, Figure S4: Uptake of DMA onto LIM/O3 SOA, Figure S5: Wall loss of ammonia vs. uptake by SOA.

Author Contributions

Conceptualization, methodology, funding acquisition, writing—review & editing, D.D. and S.A.N. Investigation, formal analysis, writing—original draft preparation, N.R.S. and J.M.-A. All authors have equally contributed to reviewing and editing the manuscript. All authors have read and agreed to the published version of the manuscript.

Funding

The ammonia and amine reactivity portion of this work was supported by a grant from the U.S. Environmental Protection Agency under Assistance Agreement No. EPA 83588101. The effect of viscosity on uptake was investigated as part of grant DE-SC0018349 from the Office of Biological & Environmental Research (BER), Atmospheric Science Program (ASR), Department of Energy (DOE). It has not been formally reviewed by EPA or DOE. The views expressed in this document are solely those of the authors and do not necessarily reflect those of the Agency. EPA and DOE do not endorse any products or commercial services mentioned in this publication.

Data Availability Statement

The data for this publication can be obtained by contacting the corresponding author. A subset of the data related to the generation of SOA will be uploaded to the ICARUS (The Index of Chamber Atmospheric Research in the United States) database at https://icarus.ucdavis.edu/, (accessed on 13 November 2021) after the publication.

Conflicts of Interest

The authors declare no conflict of interest. The funders had no role in the design of the study; in the collection, analyses, or interpretation of data; in the writing of the manuscript, or in the decision to publish the results.

References

  1. Behera, S.N.; Sharma, M.; Aneja, V.P.; Balasubramanian, R. Ammonia in the atmosphere: A review on emission sources, atmospheric chemistry and deposition on terrestrial bodies. Environ. Sci. Pollut. Res. 2013, 20, 8092–8131. [Google Scholar] [CrossRef]
  2. Sheppard, L.J.; Leith, I.D.; Mizunuma, T.; Neil Cape, J.; Crossley, A.; Leeson, S.; Sutton, M.A.; Dijk, N.; Fowler, D. Dry deposition of ammonia gas drives species change faster than wet deposition of ammonium ions: Evidence from a long-term field manipulation. Glob. Chang. Biol. 2011, 17, 3589–3607. [Google Scholar] [CrossRef]
  3. Erisman, J.W.; Sutton, M.A.; Galloway, J.; Klimont, Z.; Winiwarter, W. How a century of ammonia synthesis changed the world. Nat. Geosci. 2008, 1, 636–639. [Google Scholar] [CrossRef]
  4. Pinder, R.W.; Strader, R.; Davidson, C.I.; Adams, P.J. A temporally and spatially resolved ammonia emission inventory for dairy cows in the United States. Atmos. Environ. 2004, 38, 3747–3756. [Google Scholar] [CrossRef]
  5. Pinder, R.W.; Adams, P.J.; Pandis, S.N.; Gilliland, A.B. Temporally resolved ammonia emission inventories: Current estimates, evaluation tools, and measurement needs. J. Geophys. Res. 2006, 111, D16310. [Google Scholar] [CrossRef] [Green Version]
  6. Xu, R.; Tian, H.; Pan, S.; Prior, S.A.; Feng, Y.; Batchelor, W.D.; Chen, J.; Yang, J. Global ammonia emissions from synthetic nitrogen fertilizer applications in agricultural systems: Empirical and process-based estimates and uncertainty. Glob. Chang. Biol. 2019, 25, 314–326. [Google Scholar] [CrossRef] [Green Version]
  7. Crippa, M.; Guizzardi, D.; Muntean, M.; Schaaf, E.; Oreggioni, G. EDGAR v5.0 Global Air Pollutant Emissions. Eur. Comm. Jt. Res. Cent. 2019. Available online: http//data.europa.eu/89h/377801af-b094-4943-8fdc-f79a7c0c2d19 (accessed on 8 November 2021).
  8. Amann, M.; Klimont, Z.; Wagner, F. Regional and Global Emissions of Air Pollutants: Recent Trends and Future Scenarios. Annu. Rev. Environ. Resour. 2013, 38, 31–35. [Google Scholar] [CrossRef]
  9. Galloway, J.N.; Townsend, A.R.; Erisman, J.W.; Bekunda, M.; Cai, Z.; Freney, J.R.; Martinelli, L.A.; Seitzinger, S.P.; Sutton, M.A. Transformation of the nitrogen cycle: Recent trends, questions, and potential solutions. Science 2008, 320, 889–892. [Google Scholar] [CrossRef] [PubMed] [Green Version]
  10. Warner, J.X.; Dickerson, R.R.; Wei, Z.; Strow, L.L.; Wang, Y.; Liang, Q. Increased atmospheric ammonia over the world’s major agricultural areas detected from space. Geophys. Res. Lett. 2017, 44, 2875–2884. [Google Scholar] [CrossRef]
  11. Vayenas, D.V. Simulation of the thermodynamics and removal processes in the sulfate-ammonia-nitric acid system during winter: Implications for PM 2.5 control strategies. J. Geophys. Res. 2005, 110, D07S14. [Google Scholar] [CrossRef]
  12. Wang, Y.; Zhang, Q.Q.; He, K.; Zhang, Q.; Chai, L. Sulfate-nitrate-ammonium aerosols over China: Response to 2000–2015 emission changes of sulfur dioxide, nitrogen oxides, and ammonia. Atmos. Chem. Phys. 2013, 13, 2635–2652. [Google Scholar] [CrossRef] [Green Version]
  13. West, J.J.; Ansari, A.S.; Pandis, S.N. Marginal pm25:nonlinear aerosol mass response to sulfate reductions in the eastern united states. J. Air Waste Manag. Assoc. 1999, 49, 1415–1424. [Google Scholar] [CrossRef] [PubMed] [Green Version]
  14. Behera, S.N.; Sharma, M. Investigating the potential role of ammonia in ion chemistry of fine particulate matter formation for an urban environment. Sci. Total Environ. 2010, 408, 3569–3575. [Google Scholar] [CrossRef]
  15. Gray, H.A.; Cass, G.R.; Huntzicker, J.J.; Heyerdahl, E.K.; Rau, J.A. Characteristics of Atmospheric Organic and Elemental Carbon Particle Concentrations in Los Angeles. Environ. Sci. Technol. 1986, 20, 580–589. [Google Scholar] [CrossRef] [Green Version]
  16. Zhang, Y.; Seigneur, C.; Seinfeld, J.H.; Jacobson, M.; Clegg, S.L.; Binkowski, F.S. A comparative review of inorganic aerosol thermodynamic equilibrium modules: Similarities, differences, and their likely causes. Atmos. Environ. 2000, 34, 117–137. [Google Scholar] [CrossRef]
  17. Lelieveld, J.; Evans, J.S.; Fnais, M.; Giannadaki, D.; Pozzer, A. The contribution of outdoor air pollution sources to premature mortality on a global scale. Nature 2015, 525, 367–371. [Google Scholar] [CrossRef]
  18. Pope III, C.A.; Dockery, D.W. Health Effects of Fine Particulate Air Pollution: Lines that Connect. J. Air Waste Manag. 2006, 56, 709–742. [Google Scholar] [CrossRef] [PubMed]
  19. Ye, X.; Ma, Z.; Jiachen, Z.; Huanhuan, D.; Jianmin, C.; Hui, C.; Xin, Y.; Wei, G.; Fuhai, G. Important role of ammonia on haze formation in Shanghai. Environ. Res. Lett. 2011, 6, 1–5. [Google Scholar] [CrossRef] [Green Version]
  20. Park, R.S.; Lee, S.; Shin, S.-K.; Song, C.H. Contribution of ammonium nitrate to aerosol optical depth and direct radiative forcing by aerosols over East Asia. Atmos. Chem. Phys. 2014, 14, 2185–2201. [Google Scholar] [CrossRef] [Green Version]
  21. Xu, L.; Penner, J.E. Global simulations of nitrate and ammonium aerosols and their radiative effects. Atmos. Chem. Phys. 2012, 12, 9479–9504. [Google Scholar] [CrossRef] [Green Version]
  22. Zheng, J.; Ma, Y.; Chen, M.; Zhang, Q.; Wang, L.; Khalizov, A.F.; Yao, L.; Wang, Z.; Wang, X.; Chen, L. Measurement of atmospheric amines and ammonia using the high resolution time-of-flight chemical ionization mass spectrometry. Atmos. Environ. 2015, 102, 249–259. [Google Scholar] [CrossRef]
  23. Ge, X.; Wexler, A.S.; Clegg, S.L. Atmospheric amines—Part I. A review. Atmos. Environ. 2011, 45, 524–546. [Google Scholar] [CrossRef]
  24. Hanson, D.R.; McMurry, P.H.; Jiang, J.; Tanner, D.; Huey, L.G. Ambient Pressure Proton Transfer Mass Spectrometry: Detection of Amines and Ammonia. Environ. Sci. Technol. 2011, 45, 8881–8888. [Google Scholar] [CrossRef]
  25. Hutchinson, G.L.; Mosier, A.R.; Andre, C.E. Ammonia and Amine Emissions from a Large Cattle Feedlot. J. Environ. Qual. 1982, 11, 288–293. [Google Scholar] [CrossRef]
  26. Schade, G.W.; Crutzen, P.J. Emission of aliphatic amines from animal husbandry and their reactions: Potential source of N2O and HCN. J. Atmos. Chem. 1995, 22, 319–346. [Google Scholar] [CrossRef]
  27. Chang, I.H.; Lee, C.G.; Lee, D.S. Development of an Automated Method for Simultaneous Determination of Low Molecular Weight Aliphatic Amines and Ammonia in Ambient Air by Diffusion Scrubber Coupled to Ion Chromatography. Anal. Chem. 2003, 75, 6141–6146. [Google Scholar] [CrossRef] [PubMed]
  28. Tsai, C.J.; Chen, M.L.; Di Ye, A.; Chou, M.S.; Shen, S.H.; Mao, I.F. The relationship of odor concentration and the critical components emitted from food waste composting plants. Atmos. Environ. 2008, 42, 8246–8251. [Google Scholar] [CrossRef]
  29. Yu, F.; Luo, G. Modeling of gaseous methylamines in the global atmosphere: Impacts of oxidation and aerosol uptake. Atmos. Chem. Phys. 2014, 14, 12455–12464. [Google Scholar] [CrossRef] [Green Version]
  30. Mäkelä, J.M.; Ylikoivisto, S.; Hiltunen, V.; Seidl, W.; Swietlicki, E.; Teinilä, K.; Sillanpää, M.; Koponen, I.K.; Paatero, J.; Rosman, K.; et al. Chemical composition of aerosol during particle formation events in boreal forest. Tellus Ser. B Chem. Phys. Meteorol. 2001, 53, 380–393. [Google Scholar] [CrossRef]
  31. Sorooshian, A.; Murphy, S.M.; Hersey, S.; Gates, H.; Padro, L.T.; Nenes, A.; Brechtel, F.J.; Jonsson, H.; Flagan, R.C.; Seinfeld, J.H. Comprehensive airborne characterization of aerosol from a major bovine source. Atmos. Chem. Phys. 2008, 8, 5489–5520. [Google Scholar] [CrossRef] [Green Version]
  32. Murphy, S.M.; Sorooshian, A.; Kroll, J.H.; Ng, N.L.; Chhabra, P.; Tong, C.; Surratt, J.D.; Knipping, E.; Flagan, R.C.; Seinfeld, J.H. Secondary aerosol formation from atmospheric reactions of aliphatic amines. Atmos. Chem. Phys. 2007, 7, 2313–2337. [Google Scholar] [CrossRef] [Green Version]
  33. Kumar, M.; Li, H.; Zhang, X.; Zeng, X.C.; Francisco, J.S. Nitric Acid-Amine Chemistry in the Gas Phase and at the Air-Water Interface. J. Am. Chem. Soc. 2018, 140, 6456–6466. [Google Scholar] [CrossRef] [PubMed]
  34. Kurtén, T.; Loukonen, V.; Vehkamäki, H.; Kulmala, M. Amines are likely to enhance neutral and ion-induced sulfuric acid-water nucleation in the atmosphere more effectively than ammonia. Atmos. Chem. Phys. 2008, 8, 4095–4103. [Google Scholar] [CrossRef] [Green Version]
  35. Kupiainen, O.; Ortega, I.K.; Kurtén, T.; Vehkamäki, H. Amine substitution into sulfuric acid-ammonia clusters. Atmos. Chem. Phys. 2012, 12, 3591–3599. [Google Scholar] [CrossRef] [Green Version]
  36. Paasonen, P.; Olenius, T.; Kupiainen, O.; Kurtén, T.; Petäjä, T.; Birmili, W.; Hamed, A.; Hu, M.; Huey, L.G.; Plass-Duelmer, C.; et al. On the formation of sulphuric acid-amine clusters in varying atmospheric conditions and its influence on atmospheric new particle formation. Atmos. Chem. Phys. 2012, 12, 9113–9133. [Google Scholar] [CrossRef] [Green Version]
  37. Olenius, T.; Halonen, R.; Kurtén, T.; Henschel, H.; Kupiainen-Määttä, O.; Ortega, I.K.; Jen, C.N.; Vehkamäki, H.; Riipinen, I. New particle formation from sulfuric acid and amines: Comparison of monomethylamine, dimethylamine, and trimethylamine. J. Geophys. Res. Atmos. 2017, 122, 7103–7118. [Google Scholar] [CrossRef]
  38. Yao, L.; Garmash, O.; Bianchi, F.; Zheng, J.; Yan, C.; Kontkanen, J.; Junninen, H.; Mazon, S.B.; Ehn, M.; Paasonen, P.; et al. Atmospheric new particle formation from sulfuric acid and amines in a Chinese megacity. Science 2018, 361, 278–281. [Google Scholar] [CrossRef] [PubMed] [Green Version]
  39. Tang, X.; Price, D.; Praske, E.; Lee, S.A.; Shattuck, M.A.; Purvis-Roberts, K.; Silva, P.J.; Asa-Awuku, A.; Cocker, D.R. NO3 radical, OH radical and O3−initiated secondary aerosol formation from aliphatic amines. Atmos. Environ. 2013, 72, 105–112. [Google Scholar] [CrossRef]
  40. Duporté, G.; Riva, M.; Parshintsev, J.; Heikkinen, E.; Barreira, L.M.F.; Myllys, N.; Heikkinen, L.; Hartonen, K.; Kulmala, M.; Ehn, M.; et al. Chemical Characterization of Gas- and Particle-Phase Products from the Ozonolysis of α-Pinene in the Presence of Dimethylamine. Environ. Sci. Technol. 2017, 51, 5602–5610. [Google Scholar] [CrossRef]
  41. De Haan, D.O.; Hawkins, L.N.; Kononenko, J.A.; Turley, J.J.; Corrigan, A.L.; Tolbert, M.A.; Jimenez, J.L. Formation of nitrogen-containing oligomers by methylglyoxal and amines in simulated evaporating cloud droplets. Environ. Sci. Technol. 2011, 45, 984–991. [Google Scholar] [CrossRef] [PubMed]
  42. Galloway, M.M.; Powelson, M.H.; Sedehi, N.; Wood, S.E.; Millage, K.D.; Kononenko, J.A.; Rynaski, A.D.; De Haan, D.O. Secondary organic aerosol formation during evaporation of droplets containing atmospheric aldehydes, amines, and ammonium sulfate. Environ. Sci. Technol. 2014, 48, 14417–14425. [Google Scholar] [CrossRef] [Green Version]
  43. Duporté, G.; Parshintsev, J.; Barreira, L.M.F.; Hartonen, K.; Kulmala, M.; Riekkola, M.L. Nitrogen-Containing Low Volatile Compounds from Pinonaldehyde-Dimethylamine Reaction in the Atmosphere: A Laboratory and Field Study. Environ. Sci. Technol. 2016, 50, 4693–4700. [Google Scholar] [CrossRef]
  44. Kampf, C.J.; Filippi, A.; Zuth, C.; Hoffmann, T.; Opatz, T. Secondary brown carbon formation: Via the dicarbonyl imine pathway: Nitrogen heterocycle formation and synergistic effects. Phys. Chem. Chem. Phys. 2016, 18, 18353–18364. [Google Scholar] [CrossRef] [Green Version]
  45. De Haan, D.O.; Hawkins, L.N.; Welsh, H.G.; Pednekar, R.; Casar, J.R.; Pennington, E.A.; De Loera, A.; Jimenez, N.G.; Symons, M.A.; Zauscher, M.; et al. Brown Carbon Production in Ammonium- or Amine-Containing Aerosol Particles by Reactive Uptake of Methylglyoxal and Photolytic Cloud Cycling. Environ. Sci. Technol. 2017, 51, 7458–7466. [Google Scholar] [CrossRef]
  46. De Haan, D.O.; Pajunoja, A.; Hawkins, L.N.; Welsh, H.G.; Jimenez, N.G.; De Loera, A.; Zauscher, M.; Andretta, A.D.; Joyce, B.W.; De Haan, A.C.; et al. Methylamine’s Effects on Methylglyoxal-Containing Aerosol: Chemical, Physical, and Optical Changes. ACS Earth Space Chem. 2019, 3, 1706–1716. [Google Scholar] [CrossRef]
  47. Bones, D.L.; Henricksen, D.K.; Mang, S.A.; Gonsior, M.; Bateman, A.P.; Nguyen, T.B.; Cooper, W.J.; Nizkorodov, S.A. Appearance of strong absorbers and fluorophores in limonene-O 3 secondary organic aerosol due to NH 4 + -mediated chemical aging over long time scales. J. Geophys. Res. 2010, 115, D05203. [Google Scholar] [CrossRef] [Green Version]
  48. Updyke, K.M.; Nguyen, T.B.; Nizkorodov, S.A. Formation of brown carbon via reactions of ammonia with secondary organic aerosols from biogenic and anthropogenic precursors. Atmos. Environ. 2012, 63, 22–31. [Google Scholar] [CrossRef]
  49. Lin, P.; Laskin, J.; Nizkorodov, S.A.; Laskin, A. Revealing Brown Carbon Chromophores Produced in Reactions of Methylglyoxal with Ammonium Sulfate. Environ. Sci. Technol. 2015, 49, 14257–14266. [Google Scholar] [CrossRef] [PubMed]
  50. Laskin, A.; Laskin, J.; Nizkorodov, S.A. Chemistry of Atmospheric Brown Carbon. Chem. Rev. 2015, 115, 4335–4382. [Google Scholar] [CrossRef] [PubMed] [Green Version]
  51. Liu, P.; Li, Y.J.; Wang, Y.; Bateman, A.P.; Zhang, Y.; Gong, Z.; Bertram, A.K.; Martin, S.T.; Paulson, J.A.; Chan, T.H. Highly Viscous States Affect the Browning of Atmospheric Organic Particulate Matter. ACS Cent. Sci. 2018, 4, 207–215. [Google Scholar] [CrossRef] [PubMed] [Green Version]
  52. Li, Y.J.; Liu, P.; Gong, Z.; Wang, Y.; Bateman, A.P.; Bergoend, C.; Bertram, A.K.; Martin, S.T. Chemical Reactivity and Liquid/Nonliquid States of Secondary Organic Material. Environ. Sci. Technol. 2015, 49, 13264–13274. [Google Scholar] [CrossRef] [PubMed]
  53. Song, M.; Liu, P.F.; Hanna, S.J.; Zaveri, R.A.; Potter, K.; You, Y.; Martin, S.T.; Bertram, A.K. Relative humidity-dependent viscosity of secondary organic material from toluene photo-oxidation and possible implications for organic particulate matter over megacities. Atmos. Chem. Phys. 2016, 16, 8817–8830. [Google Scholar] [CrossRef] [Green Version]
  54. Hinks, M.L.; Brady, M.V.; Lignell, H.; Song, M.; Grayson, J.W.; Bertram, A.K.; Lin, P.; Laskin, A.; Laskin, J.; Nizkorodov, S.A. Effect of viscosity on photodegradation rates in complex secondary organic aerosol materials. Phys. Chem. Chem. Phys. 2016, 18, 8785–8793. [Google Scholar] [CrossRef] [PubMed]
  55. Hinks, M.L.; Montoya-Aguilera, J.; Ellison, L.; Lin, P.; Laskin, A.; Laskin, J.; Shiraiwa, M.; Dabdub, D.; Nizkorodov, S.A. Effect of relative humidity on the composition of secondary organic aerosol from the oxidation of toluene. Atmos. Chem. Phys. 2018, 18, 1643–1652. [Google Scholar] [CrossRef] [Green Version]
  56. Canagaratna, M.R.; Jimenez, J.L.; Kroll, J.H.; Chen, Q.; Kessler, S.H.; Massoli, P.; Hildebrandt Ruiz, L.; Fortner, E.; Williams, L.R.; Wilson, K.R.; et al. Elemental ratio measurements of organic compounds using aerosol mass spectrometry: Characterization, improved calibration, and implications. Atmos. Chem. Phys. 2015, 15, 253–272. [Google Scholar] [CrossRef] [Green Version]
  57. McLafferty, F.W.; Turecek, F. Interpretation of Mass Spectra, 4th ed.; University Science Books: Sausalito, CA, USA, 1993. [Google Scholar]
  58. Price, D.J.; Clark, C.H.; Tang, X.; Cocker, D.R.; Purvis-Roberts, K.L.; Silva, P.J. Proposed chemical mechanisms leading to secondary organic aerosol in the reactions of aliphatic amines with hydroxyl and nitrate radicals. Atmos. Environ. 2014, 96, 135–144. [Google Scholar] [CrossRef]
  59. Moise, T.; Flores, J.M.; Rudich, Y. Optical Properties of Secondary Organic Aerosols and Their Changes by Chemical Processes. Chem. Rev. 2015, 115, 4400–4439. [Google Scholar] [CrossRef]
  60. Zhu, S.; Horne, J.R.; Montoya-Aguilera, J.; Hinks, M.L.; Nizkorodov, S.A.; Dabdub, D. Modeling reactive ammonia uptake by secondary organic aerosol in CMAQ: Application to the continental US. Atmos. Chem. Phys. 2018, 18, 3641–3657. [Google Scholar] [CrossRef] [Green Version]
  61. Liu, Y.; Liggio, J.; Staebler, R.; Li, S.-M. Reactive uptake of ammonia to secondary organic aerosols: Kinetics of organonitrogen formation. Atmos. Chem. Phys. 2015, 15, 13569–13584. [Google Scholar] [CrossRef] [Green Version]
Figure 1. Summary Particle number concentration (blue trace, left Y-axis) and particle mass concentration (red trace, right Y-axis) for (a) TOL/OH SOA at low relative humidity and (b) LIM/O3 SOA at low relative humidity. The blue shaded area corresponds to the addition of nicotinic seed particles, the yellow shaded area corresponds to photooxidation, and the green shaded area corresponds to the injection of DMA.
Atmosphere 12 01502 g001
Figure 2. Elemental ratios of LIM/O3 SOA particles when exposed to (a) NH3 and (b) DMA at low relative humidity (yellow shaded area).
Atmosphere 12 01502 g002
Figure 3. Elemental ratios of H:C (blue trace), O:C (green trace), and N:C (red trace) as a function of time for LIM/O3 SOA at (a) <2%, (b) 20%, and (c) 50% RH and CED/O3 SOA at (d) <2% to (e) 20% to (f) 50% RH. DMA exposure is highlighted by the yellow region.
Atmosphere 12 01502 g003
Figure 4. TOL/OH SOA exposed to DMA (yellow region) at (a) <2% and (b) 20% RH.
Atmosphere 12 01502 g004
Figure 5. Mass concentration of nitrogen-containing families extracted from AMS data plotted versus time after DMA exposure for (a) LIM/O3 SOA, (b) CED/O3 SOA, (c) TOL/OH SOA under low RH.
Atmosphere 12 01502 g005
Table 1. Summary of chamber conditions for experimental trials performed. LIM = d-limonene, CED = α-cedrene; TOL = toluene. The column with γ values lists total uptake coefficients determined from Equation (1). The nN columns list the calculated increase in moles of N in the particles after exposure to NH3 or DMA calculated from the monitor data (Equation (3)) and AMS data (Equation (4)). The increase in N:C ratio 2 h after the injection of NH3 or DMA is reported as ∆N:C. Adding 2 ppm of H2O2 resulted in an [OH] of ~1.4 × 10⁶ molec.cm−3.
Nitrogen SourceVOC/Oxidant[VOC] (ppb)[H2O2] (ppm)[O3] (ppb)RH (%)ϒNH3 or DMANormalized
ϒNH3 or DMA
NH3 MonitorAMS∆N:C
nN Added (mol)nN Added (mol)
NH3LIM/OH501-503.9 × 10−49.7 × 10−61.7 × 10−54.2 × 10−70.005
LIM/OH501-504.9 × 10−41.5 × 10−51.9 × 10−56.0 × 10−70.004
LIM/OH501-502.9 × 10−44.7 × 10−61.3 × 10−52.1 × 10−70.005
LIM/OH501-209.0 × 10−41.5 × 10−53.2 × 10−55.5 × 10−70.002
LIM/OH501-<28.3 × 10−42.7 × 10−54.0 × 10−51.3 × 10−60.003
LIM/OH501-<28.2 × 10−43.3 × 10−59.0 × 10−63.6 × 10−70.003
LIM/O350-500502.0 × 10−42.5 × 10−62.6 × 10−53.3 × 10−70.008
LIM/O350-500506.4 × 10−42.5 × 10−52.5 × 10−59.8 × 10−70.007
LIM/O350-500505.0 × 10−43.2 × 10−51.7 × 10−51.1 × 10−60.011
LIM/O350-500202.1 × 10−41.7 × 10−52.0 × 10−51.6 × 10−60.007
LIM/O350-500<22.0 × 10−41.2 × 10−51.3 × 10−58.0 × 10−70.004
DMALIM/O350-500502.2 × 10−42.8 × 10−53.2 × 10−54.1 × 10−60.026
LIM/O350-500201.8 × 10−43.0 × 10−52.9 × 10−54.8 × 10−60.039
LIM/O350-500<23.4 × 10−48.0 × 10−53.6 × 10−58.5 × 10−60.073
CED/O350-500503.3 × 10−41.5 × 10−53.1 × 10−51.4 × 10−60.017
CED/O350-500202.0 × 10−41.2 × 10−53.6 × 10−52.1 × 10−60.021
CED/O350-500<22.1 × 10−43.2 × 10−53.2 × 10−54.8 × 10−60.048
TOL/OH10002-203.5 × 10−31.0 × 10−44.0 × 10−51.2 × 10−60.036
TOL/OH10002-202.5 × 10−37.6 × 10−53.6 × 10−51.1 × 10−60.040
TOL/OH10002-<22.2 × 10−33.4 × 10−53.9 × 10−56.0 × 10−70.037
Publisher’s Note: MDPI stays neutral with regard to jurisdictional claims in published maps and institutional affiliations.

