
Passive versus Active Transport of Saharan Dust Aerosols by African Easterly Waves

1
Atmospheric Sciences Research Center, University at Albany, State University of New York, Albany, NY 12222, USA
2
Atmospheric Science Program, Department of Land, Air and Water Resources, University of California Davis, Davis, CA 95616, USA
*
Author to whom correspondence should be addressed.
Atmosphere 2021, 12(11), 1509; https://0-doi-org.brum.beds.ac.uk/10.3390/atmos12111509
Submission received: 22 September 2021
/
Revised: 9 November 2021
/
Accepted: 10 November 2021
/
Published: 16 November 2021
(This article belongs to the Special Issue Dust Detection and Long-Term Transport in High Spatiotemporal Resolution)
Abstract
:Theory and modeling are combined to reveal the physical and dynamical processes that control Saharan dust transport by amplifying African easterly waves (AEWs). Two cases are examined: active transport, in which the dust is radiatively coupled to the circulation; passive transport, in which the dust is radiatively decoupled from the circulation. The theory is built around a dust conservation equation for dust-coupled AEWs in zonal-mean African easterly jets. The theory predicts that, for both the passive and active cases, the dust transports will be largest where the zonal-mean dust gradients are maximized on an AEW critical surface. Whether the dust transports are largest for the radiatively passive or radiatively active case depends on the growth rate of the AEWs, which is modulated by the dust heating. The theoretical predictions are confirmed via experiments carried out with the Weather Research and Forecasting model, which is coupled to a dust conservation equation. The experiments show that the meridional dust transports dominate in the passive case, while the vertical dust transports dominate in the active case.
1. Introduction
The importance of Saharan dust transport to the Earth system has propelled research that spans nearly a half century [1]. During that time, much progress has been gained in understanding the processes that control dust transport and its effect on weather and climate [2,3,4]. That understanding is largely a consequence of advances made with numerical models, which can broadly be divided into two categories: offline (passive) transport models, in which the dust is radiatively decoupled from the circulation, and online (active) transport models, in which the dust and circulation are radiatively coupled [5]. In the passive models, the dust emission and transport are driven by reanalysis or model-generated fields that are updated at specified time intervals. The advantage of the passive models is that the relatively short computational times permit the execution of many simulations at relatively low computational costs [6].
In the active models, however, the computational demands are much higher and the physical–dynamical interactions are more complex [7]. These complications are due to the radiative coupling of the dust to the circulation. The coupling occurs via the diabatic heating, a function of the dust optical properties, which depend on the composition and size of the dust particles [8,9]. Together, the dust optical properties characterize the absorption, reflection, and scattering of radiation. These properties are embodied in the dust heating, which affects the thermal structure of the atmosphere. The dust-modified thermal structure, in turn, modifies the circulation and the transport of dust [10]. The coupling between the circulation and the dust forms an intricate feedback loop that is continuously modulated by dust sources and sinks [11,12]. The complexity of the active models also tends to obscure the dust–dynamics relationships that control the transport.
This study examines the transport of Saharan dust aerosols for the passive and active transport cases. Rather than examine the transport in all of its complexity, which would require, for example, accounting for the multiple-scale wind systems that operate over North Africa, such as turbulent diffusion, cold near-surface outflows from deep convection, and low-level nocturnal jets [3,13], we instead focus on the dust transport associated with African easterly waves (AEWs), a prominent feature of the synoptic-scale circulation over North Africa [14,15,16].
African easterly waves develop intermittently throughout boreal summer. Their development depends largely on the energy exchanged with the African easterly jet (AEJ), a mid-tropospheric zonal current that is aligned along ~15° N [17,18,19,20]. The AEWs propagate along two tracks that lie astride the AEJ [21,22]. The circulations of the north track AEWs extend into the Sahara Desert where they contribute to the episodic emission and mixing of dust, which can coalesce into synoptic-scale plumes that are transported to regions far from their North African origin [11,23,24]. Indeed, vestiges of the plumes have been observed in Europe, the tropical Atlantic, and the Americas, where they have been shown to affect both terrestrial and marine ecosystems [25,26,27].
The transport of dust by AEWs is a manifestation of the coupling between dust and waves. The coupling has been demonstrated in both observational and modeling studies [23,25,28,29,30,31]. Carlson and Prospero [25], for example, analyzed dust and wind data acquired during the 1969 Barbados Oceanographic and Meteorological Experiment and made comparisons between the positions and movement of Saharan dust pulses and easterly wave activity over the tropical Atlantic. They showed that the dust pulses and easterly waves, which appeared to be phase locked, shared the same frequency, zonal spatial scale, and westward speed. Jones et al. [28] used reanalysis data to identify AEWs and to obtain the wind fields that were used drive an offline dust transport model. They showed that ~10–20% of the seasonal variability in and transport of Saharan dust across the North Atlantic is associated with AEWs. Grogan and Thorncroft [30] showed that, in the Sahel (10–20° N), the dust anomalies reside within the northerlies west of the AEW trough, whereas, in the Sahara (20–27° N), the dust anomalies reside in the southerlies east of the trough. Moreover, they showed that the locations of the dust anomalies remain anchored to the AEWs as they propagate across North Africa.
The above studies have added to an ever-growing body of evidence showing the importance of AEWs to the transport of Saharan dust. These studies, however, did not address the factors that control where the transports are maximized. This has been addressed, in part, by Nathan et al. [31], who developed a theory that exposes the physical–dynamical interactions that control the zonal-mean transport of Saharan mineral dust by linearly unstable AEWs. The theory, which was developed from a conservation equation for dust, predicts that the AEW transports of dust will be largest where the maximum in the background dust gradients coincide with a critical surface. A critical surface occurs where the Doppler-shifted frequency, , vanishes; is the zonal-mean current, k is the zonal wavenumber, and is the intrinsic frequency. Nathan et al. [31] also conducted numerical experiments with an idealized version of the Weather Research and Forecasting (WRF) model, which was coupled to the online dust model, termed the WRF-dust model [10,32]. The WRF-dust model experiments showed that the dust transports are largest at ~18° N, which confirmed the theoretical prediction.
The potentially important role that dust-induced diabatic heating plays in the transport of dust by AEWs has yet to be fully addressed. That such heating should be important is evidenced by several studies that have shown that dust-induced diabatic heating can significantly affect the growth, propagation, and structure of AEWs [22,29,30,33,34,35,36,37,38]. Ma et al. [34], for example, employed the WRF model to study the radiative forcing of mineral dust aerosols in the development of AEWs during August and September for the years 2003–2007, a period that comprised 60 AEW cases. Based on a prescribed dust layer, Ma et al. [34] showed that the dust radiative forcing enhanced the convective instability in the model, which caused 57 of the 60 AEW cases to increase in intensity.
Grogan et al. [35] also showed that dust-induced diabatic heating intensifies the development of AEWs. Their analysis combined both theory and modeling. The theory was based on an analytical expression for the generation of eddy available potential energy (APE) by the dust field, which was derived by combining a dust conservation equation with the thermodynamic energy equation. The expression exposed two key diagnostics that can be used to predict how and to what extent the dust amplifies AEWs. The diagnostics are the background gradients of the zonal-mean dust field and the location of critical surfaces relative to the gradients. Guided by the dust-modified APE, and using a realistic zonal-mean AEJ, Grogan et al. [35] then employed an idealized version of the WRF-dust model to examine the effects of dust on the growth, propagation, and structure of AEWs. They showed that the dust caused the fastest growing AEW to increase its linear growth rate from 13% to 90% for aerosol optical depths (AODs) ranging from 1.0 to 2.5. They also showed that the energy generation was largest where the meridional dust gradient was maximized near a critical surface. This result is in accordance with the prediction obtained from the analytical expression for the generation of dust-modified APE.
Further confirmation of the theoretical and modeling results shown in Grogan et al. [35] was provided by Grogan and Thorncroft [30], who examined the three-dimensional structure of dust-coupled AEWs using the Modern-Era Retrospective analysis for Research and Applications, Version 2 (MERRA-2). Based on 37 summers of reanalysis, they showed that the correlation between the heating rates and the dust anomalies was consistent with the dust-induced generation of APE at mid-levels north of the AEJ axis, consistent with Grogan et al. [35].
This study is framed around two questions that were not addressed in previous studies: first, to what extent do the passive and active dust transports by AEWs differ in amount and location and, second, what are the physical and dynamical interactions that control the differences. To answer these questions, we combine theory and modeling, as described in the following sections.
2. Theory
The development of the theoretical framework for dust-coupled AEWs parallels that of Nathan et al. [31] but is extended here in order to highlight the processes that distinguish the differences between the passive and active dust transport cases. The framework serves three purposes. First, it will expose the physical–dynamical relationships that control the dust diabatic heating rate, which, for the active scenario, couples the dust field to the dynamical circulation. Second, the framework will expose the physical–dynamical relationships that control the zonal-mean transports of dust by linearly unstable AEWs. Third, the analytical framework will aid in the interpretation of the modeling results, which are presented in Section 4.
2.1. Governing Equations
The theoretical development begins with the zonal-mean dust flux (transport) vector:
where and are the perturbation meridional and vertical wind speeds, respectively, and is the perturbation dust mass mixing ratio. We supplement Equation (1) with a conservation equation for dust mass mixing ratio, which in log-pressure coordinates can, as in Nathan et al. [36], be written as:
where the zonal, meridional, and vertical wind fields , and dust mass mixing ratio (), have been linearized about a steady, zonally-averaged background. The overbar denotes background quantities and the prime denotes a perturbation, which here represents the AEW field.
In the dust conservation Equation (2), is the dust depletion rate, which includes such processes as dry and wet deposition. For the analytical analysis presented in this section, we model only the dry deposition and choose the simple form , where is constant. The remaining symbols in Equation (2) and those that appear later are defined in Table 1.
2.2. Dust Heating Rate
To aid in understanding the physics that account for the differences in dust transports between radiatively passive and radiatively active dust fields, we begin with an analysis of the dust heating rate, which is due to a combination of absorption, scattering, and emission. All three processes must be accounted for to accurately produce quantitative values of the dust heating rate. For the following analytical analysis, however, our interest is in the qualitative aspects of the physics. Therefore, we only account for absorption, which Grogan et al. [35] and Nathan et al. [36] have shown is the dominate radiative process for Saharan dust. As shown by Nathan et al. [36], the dust heating rate can be written as:
where
is proportional to the zonal-mean transmissivity, . In Equation (4), S0 is the solar constant, is the specific absorption coefficient, and is the zonal-mean AOD, given by
where is the cosine of the solar zenith angle.
To obtain an expression for the dust heating rate, the perturbation fields are chosen in the form:
where the asterisk represents the complex conjugate of the preceding term, which ensures that the solutions are real. The complex amplitudes are and the complex frequency is , which is related to the complex phase speed by where k is the zonal wavenumber, is the phase speed, and is the growth rate. It is important to note that the complex amplitudes (eigenfunctions) depend implicitly on the complex frequency (eigenvalue), a fact that will bear on the interpretation of both the dust heating rate and the dust transports.
Insertion of Equation (6) into Equation (2) and using Equation (3) yields:
This equation explicitly shows how the coupling between the direct radiative effects of dust and the dynamical circulation combine to affect the dust heating rate. For example, for a fixed depletion rate, , Equation (7) states that the dust heating rate depends on the product between three quantities: (i) , which, recall from Equation (4), depends, in part, on the AOD of the mean dust distribution; (ii) a modulator, which depends on the Doppler shifted frequency, , and the wave growth rate, , both of which depend implicitly on the background wind and dust distributions; (iii) a source, which is due to the advection, in the latitude-height plane, of the background dust by the perturbation wind, which itself depends on both and . Consequently, the modulator and source of perturbation heating are interdependent, therefore the amount of dust heating or cooling will depend nonlinearly on the background dust field.
For fixed , the modulator is largest when and are both small, i.e., for slowly growing waves near a critical surface. If then Equation (7) becomes singular when and . Thus, prevents the singularity, as would additional physics such as nonlinearity or other diabatic processes, which are not considered here. Nevertheless, even with or additional physics, the limiting case would still produce a large heating rate response locally. Such limits, of course, will also affect the source, since the perturbation winds, and , each depend on and . In addition, the source depends on the signs of the wind and background dust gradients, such that the northward and upward advections of zonal-mean dust by the perturbation may augment or oppose each other.
2.3. Dust Transports
To obtain expressions for the meridional (vertical) dust transports, first divide Equation (3) by , then multiply Equation (3) by (), rearrange terms, and then obtain the zonal average; the result is:
The dust transports, similarly to the dust heating rate, are controlled by a modulator and source. The transport modulator is the same as the heating rate modulator, whereas the sources of the transports, which consists of two terms, are due to the Reynolds stresses acting on the zonal-mean dust gradients. Equations (8) and (9) reveal that the meridional and vertical dust transports depend on the zonal-mean dust gradients in both directions.
Consider, for example, the meridional dust transport Equation (8). Whether the first source term produces northward or southward transport is determined solely by the mean meridional dust gradient; the transport is southward (northward) where the background dust gradient is positive (negative). The second source term, however, depends on both the Reynolds stress and the mean dust gradient. The second term will produce southward (northward) dust transport where there is a vertical flux of southerly (northerly) momentum in a region where the mean dust gradient is positive (negative). Similar reasoning holds for the vertical dust transport Equation (9).
For fixed background wind and dust distributions, the dust transports depend on a modulator, which is a function of the Doppler shifted frequency and the wave growth rate, and a source, which is a function of the wave structure. These wave properties are all affected by the dust heating rate, which is what couples the dust to the circulation. Whether the various dust-modified wave properties augment or oppose each other will determine to what extent the passive versus active dust transports differ in their magnitude and spatial distribution. Although numerical calculations are required to assess the detailed differences between the passive and active cases, there is a generalization that can be gleaned from Equations (8) and (9): the transports for both the passive and active cases will be locally maximized near a critical surface, i.e., where . This generalization follows from the fact that even if there are significant differences in the intrinsic frequency, , between the passive and active cases, there will always be a region where and it is in that region where the dust transports are maximized, which we confirm with the numerical calculations shown in Section 4.
3. Model and Background Fields
In this section, we describe the Weather Research and Forecasting (WRF)-dust model, the numerical experiments, and the background distributions for the zonal-mean background wind, temperature, and dust fields.
3.1. WRF-Dust Model
The WRF-dust model consists of the Advanced Research WRF (ARW) dynamical core (v3.7) and a 12 bin dust model (radii range from 0.15–5.0 µm) developed by Chen et al. [12,32]. In this study, an idealized version of the WRF-dust model, which is described in detail in Grogan et al. [35] and Nathan et al. [36], is used to conduct the numerical experiments. The model has three idealizations. First, the dust model simulates three-dimensional advection and dry sedimentation; other transport mechanisms (such as convective mixing and sub-grid mixing) and sources/sinks (such as emission and wet deposition) are excluded. Second, the sole physics operating on the dynamical core is the NASA/Goddard Space Flight Center radiative transfer scheme [39,40]; all other physics parameterizations, such as boundary layer physics, convection, and cloud processes, are deactivated. In the radiative transfer scheme, the dust bins are radiatively coupled; dust heating rates are computed using the dust optical properties―extinction coefficient, single scattering albedo, and asymmetry parameters―which are from the Optical Properties of Aerosols and Clouds (OPAC) software package [41]. Third, the WRF-dust model is run until the most linearly unstable AEW (3300 km) emerges. The method for conducting the linear stability calculations is described in previous papers [35,36]. Briefly, the method involves (i) imposing a small amplitude (~10−4 m s−1) perturbation of fixed wavelength; (ii) integrating the model forward in time until the domain-averaged total wave energy converges to exponential growth (accuracy of 10−3 for at least 12 h), which takes ~20 days; (iii) extracting the three-dimensional eddy wind, temperature, and dust fields using a Fast-Fourier transform algorithm once exponential growth is achieved.
The model domain is a global channel on an equidistant cylindrical grid that extends from 40° N to 10° S; the horizontal resolution is 0.5° latitude by 0.5° longitude. The horizontal boundary conditions are periodic in the zonal direction and symmetric at the north and south channel sidewalls. In the vertical, there are 50 levels that extend from the surface up to 100 hPa; no-slip conditions are imposed at the top and bottom. To reduce noise and boundary reflections, a 30-min hyper diffusion is imposed on the horizontal wind fields everywhere in the domain, while a Rayleigh damping is imposed on the wind and temperature at upper levels (300–100 hPa).
3.2. Background Fields
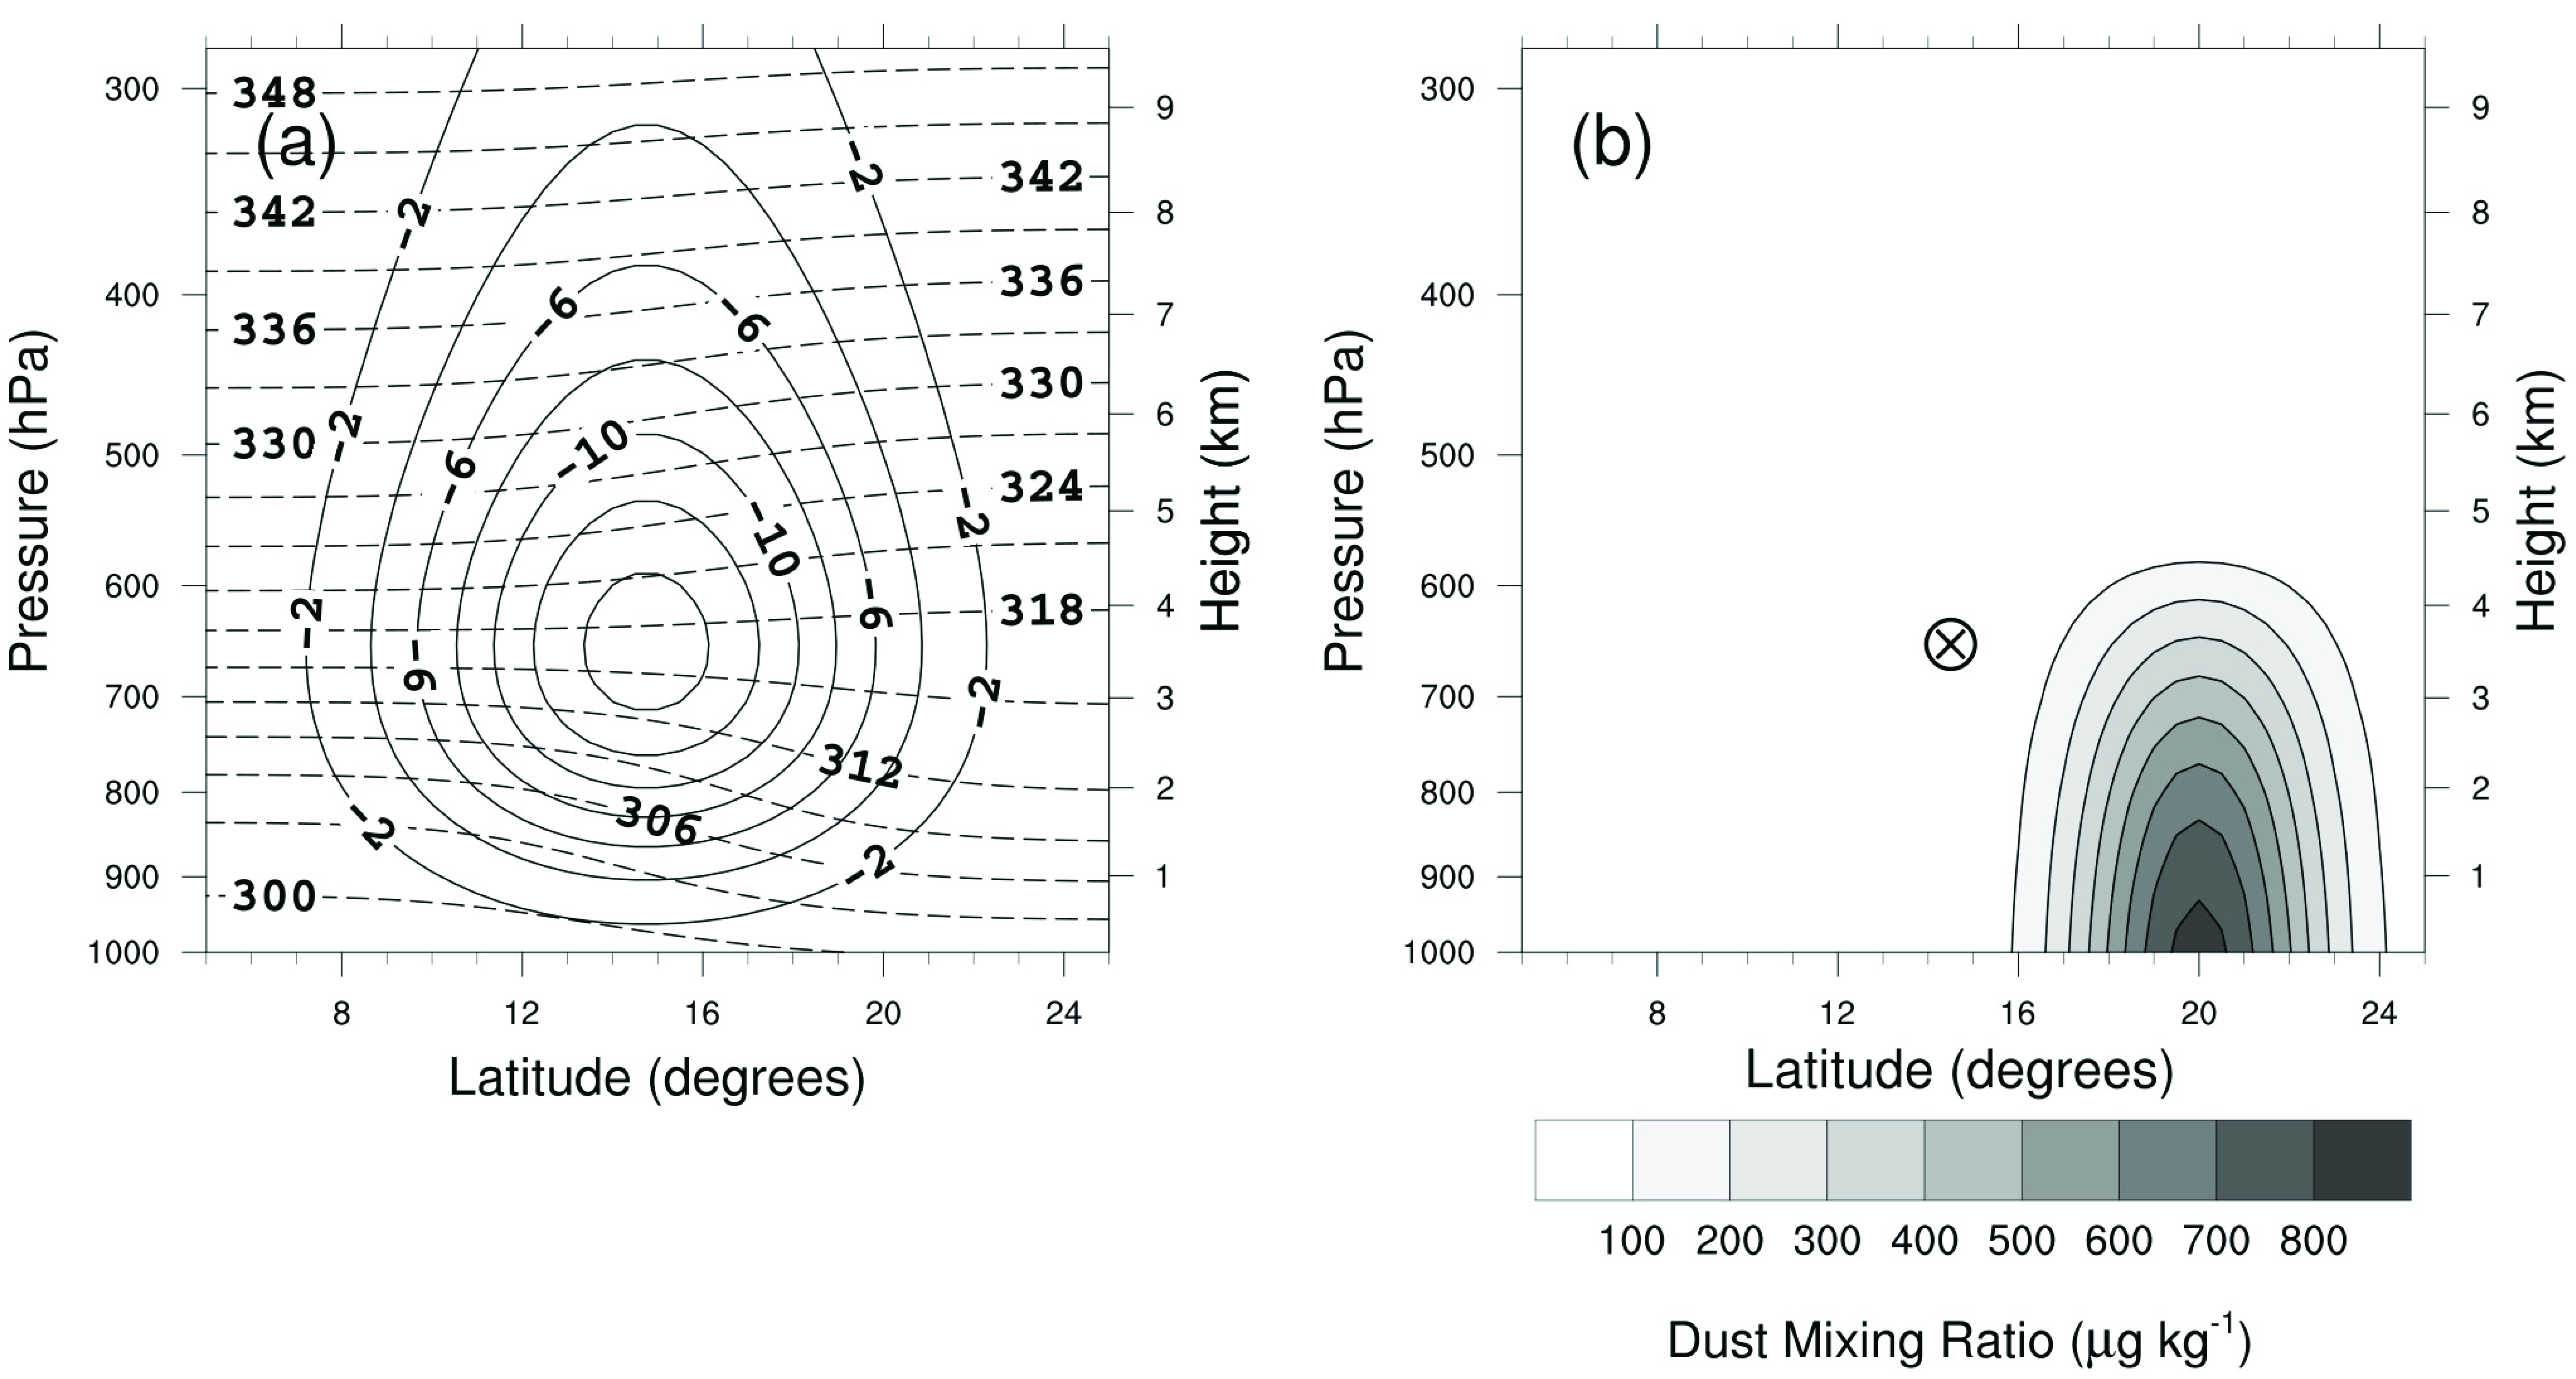
Figure 1 shows the background distributions used in the numerical experiments. Figure 1a shows the zonal-mean, zonal wind, and potential temperature fields, which are in thermal wind balance. These background fields are identical to that used in Grogan et al. [35]. The zonal-mean wind, which is consistent with the observed AEJ, is centered at 15° N and ~650 hPa, is symmetric in latitude and asymmetric in height, and has a peak easterly wind of 15 m s−1.
Figure 1b shows the distribution of the zonal-mean dust mixing ratio, which is identical to Nathan et al. [36]. The dust field consists of the same spatial distribution for each of the 12 dust particle bins; the particle bin size distributions are scaled according to Kok [42]. The field is centered at 20° N, is symmetric in latitude, and decreases with height. The positioning of the dust distribution is close to the strongest source regions that are scattered across North Africa [43]. The vertical dust distribution is guided by measurements from the Cloud-Aerosol Lidar and Infrared Pathfinder Satellite Observation (CALIPSO), which are taken during summer over North Africa [44]. For an observationally consistent plume, concentrations of each dust bin are scaled to produce a maximum AOD of ~1.0. Given our choice of dust particle bins and size distribution, this yields a dust mixing ratio of ~800 µg kg−1 near the surface at 20° N.
4. Results
The numerical results were obtained following the procedure described in Section 3. That procedure yields, for the most unstable k = 12 wave, the following frequency and growth rate: = 8.34 m s−1 and = 0.35 days−1 for the passive case; = 8.40 m s−1 and = 0.42 days−1 for the active case. The difference in the frequency between the passive and active cases is less than 1%; however, the growth rate for the active case is 20% larger. This information will be used to connect the theory with the numerical results.
Figure 2 shows the dust diabatic heating rate, , at 18° N for the active case; the passive case is not shown since it is decoupled from the circulation and thus is not physically relevant to the dust transports. We have chosen 18° N since, as shown by Nathan et al. [31], it is the approximate latitude along which dust transports are largest, which also coincides with the critical surface at ~800 hPa. The maximum seen in Figure 2 occurs near −40° and 750 hPa. Below ~750 hPa, tilts westward, whereas, above this level, it tilts slightly eastward. Because is coupled to the circulation, its structure is reflected in the structures for the wind and dust fields, as shown in Figure 3 and Figure 4, respectively.
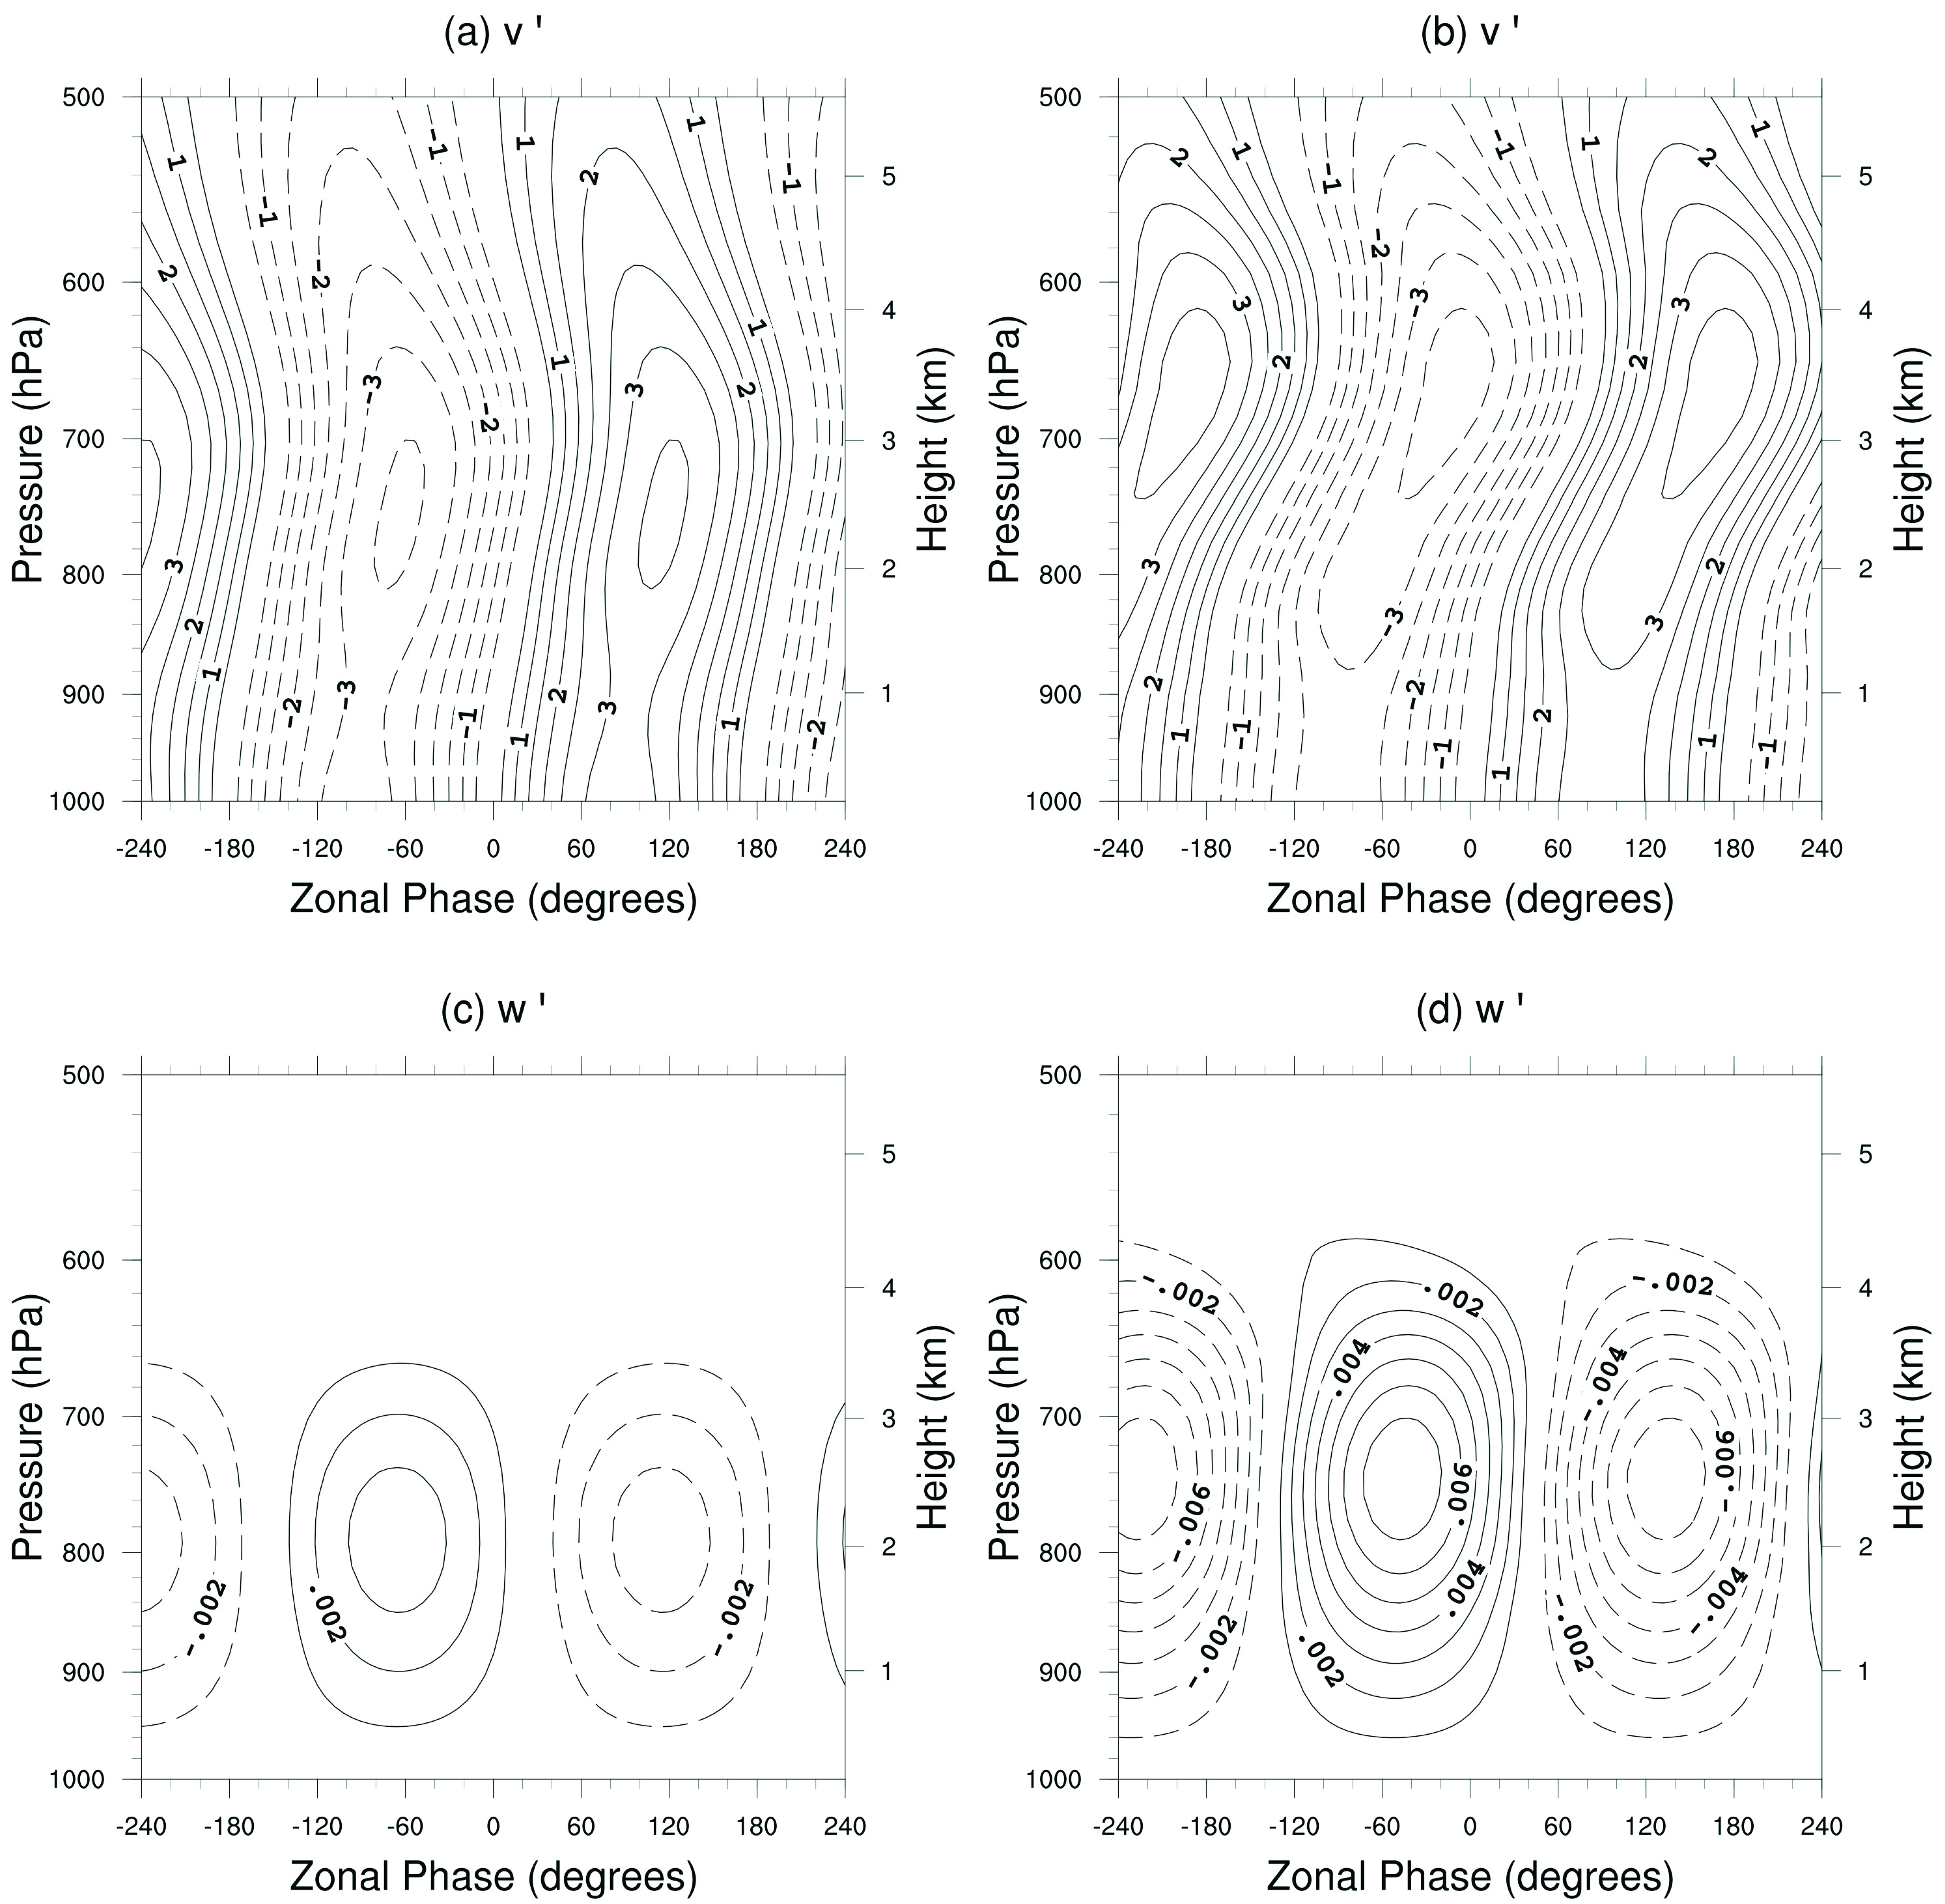
Figure 3 shows the vertical structures of (top row) and (bottom row) for the passive case (left column) and active case (right column) at 18° N. For both the passive and active cases, and tilt eastward with height from the surface to ~650–700 hPa. There is ascent () ahead (west) of the trough at mid-levels (−20° to −100°, 700–900 hPa). These vertical structures correspond to baroclinic energy transfer from the AEJ to the AEWs [30]. There are, however, structural differences between the passive and active cases. For example, in the active case at 700–800 hPa, the vertical tilt of is larger, while the maximum of more than doubles and shifts vertically by ~50 hPa. These structural enhancements, which coincide with the region of peak dust heating shown in Figure 2, augment the existing baroclinic wave structure.
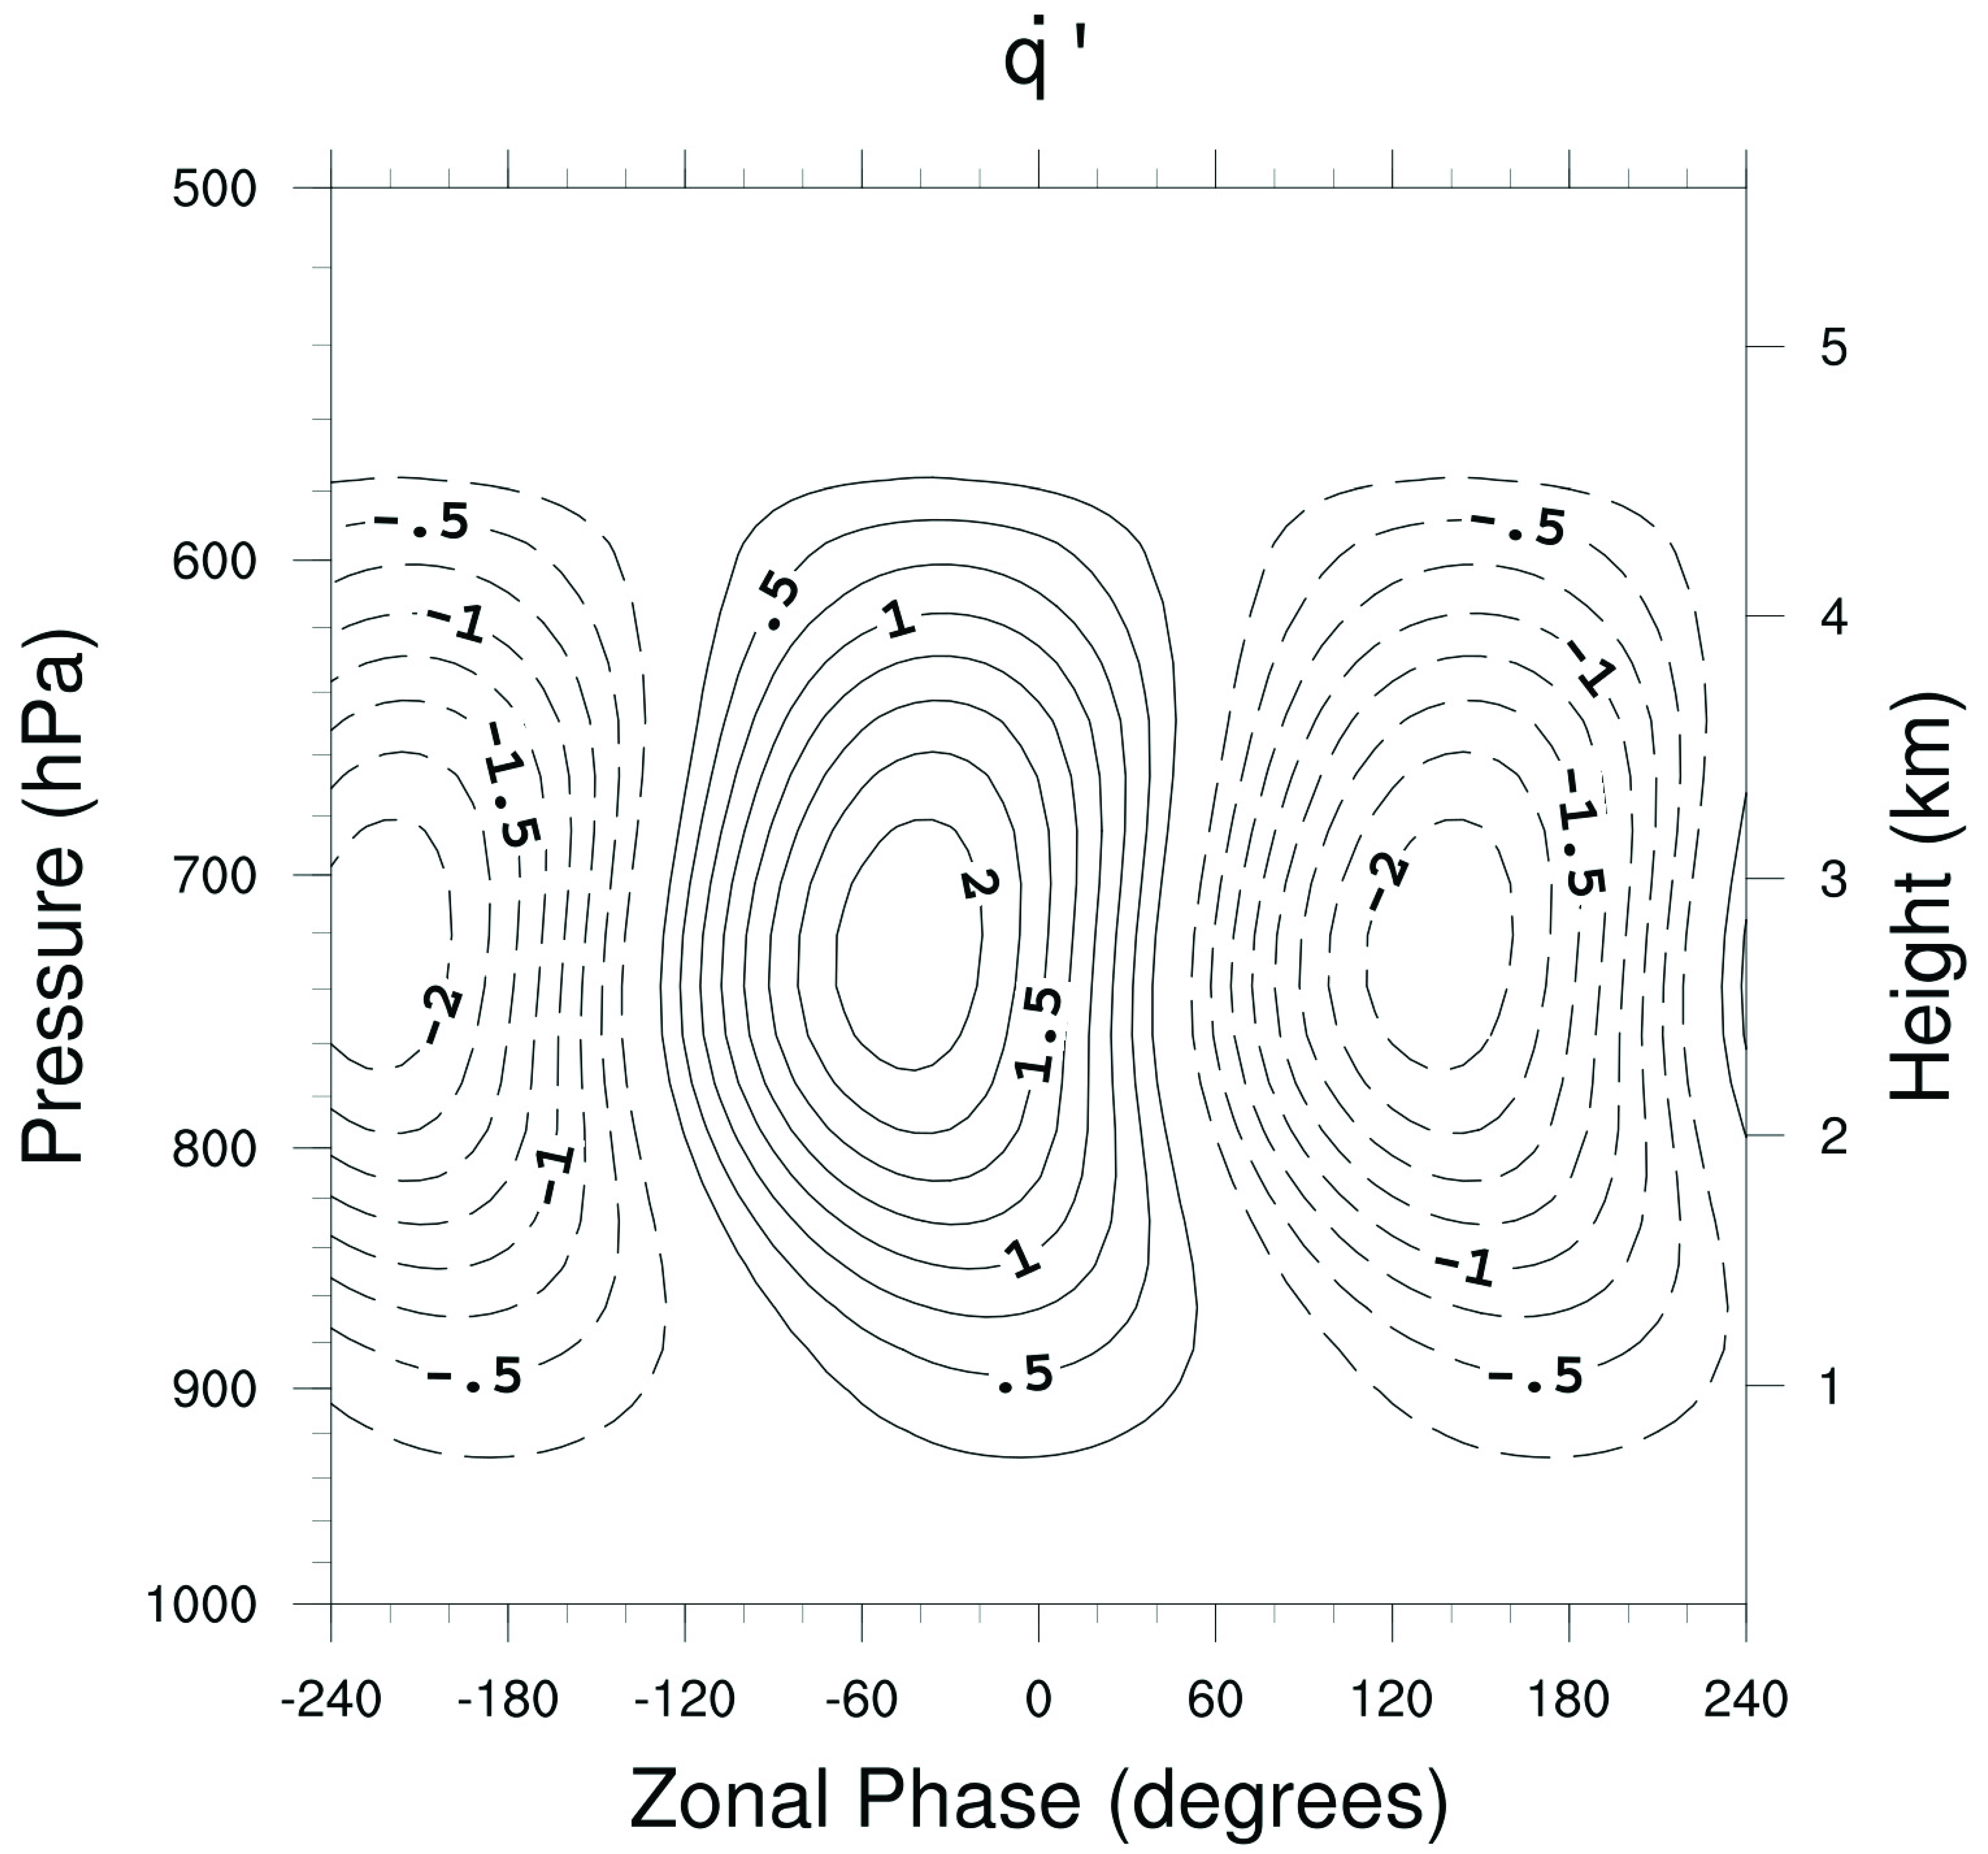
Figure 4 shows the vertical structure of for the passive case (left) and active case (right) at 18° N. As expected from Equation (3), the structure for in the active case (Figure 4b) closely resembles (Figure 2); the slight difference in the peak altitude between the two is due to the transmissivity. Comparison of Figure 3 and Figure 4 shows that, for both cases, and are approximately in phase with each other, but are 90° out of phase with . These phase relationships agree with the theoretical analysis presented in Nathan et al. [31]. Both cases also show that tilts westward with height from the surface to ~800 hPa. At this pressure level attains its peak amplitude, which is ~10% larger in the passive case.
That is larger in the passive case can be explained by the theoretical analysis in Section 2. To do so, divide Equation (7) by , take the limit , which, as stated above, is valid near the critical surface at 800 hPa, 18° N. We can also note that
which means that the meridional advection of the mean dust by the wave field dominates over the vertical advection. This condition, which is consistent with the figures and confirmed with the numerical experiments, allows Equation (7) to be approximated by
At −40° and 800 hPa, the point in the zonal-pressure plane where is maximized, (see Figure 3a,b) and (see Figure 1b at 18° N). In addition, shows little change between the passive and active cases (cf. Figure 3a,b), so that is controlled primarily by the growth rate, , which is ~20% larger in the active case. Consequently, is larger in the passive case, in agreement with the numerical results (cf. Figure 4a,b).
The difference in between the passive and active cases is most evident in the phase tilts. In the passive case, tilts westward with height, whereas for the active case it tilts slightly eastward with height above 800 hPa. The eastward tilt is due to the dust-induced vertical shift in heating and thus strengthening of , which maintains its in-phase relationship with . Between 650–850 hPa, the stronger field also is associated with larger concentrations. At 700 hPa, for example, is about 20% larger in the active case.
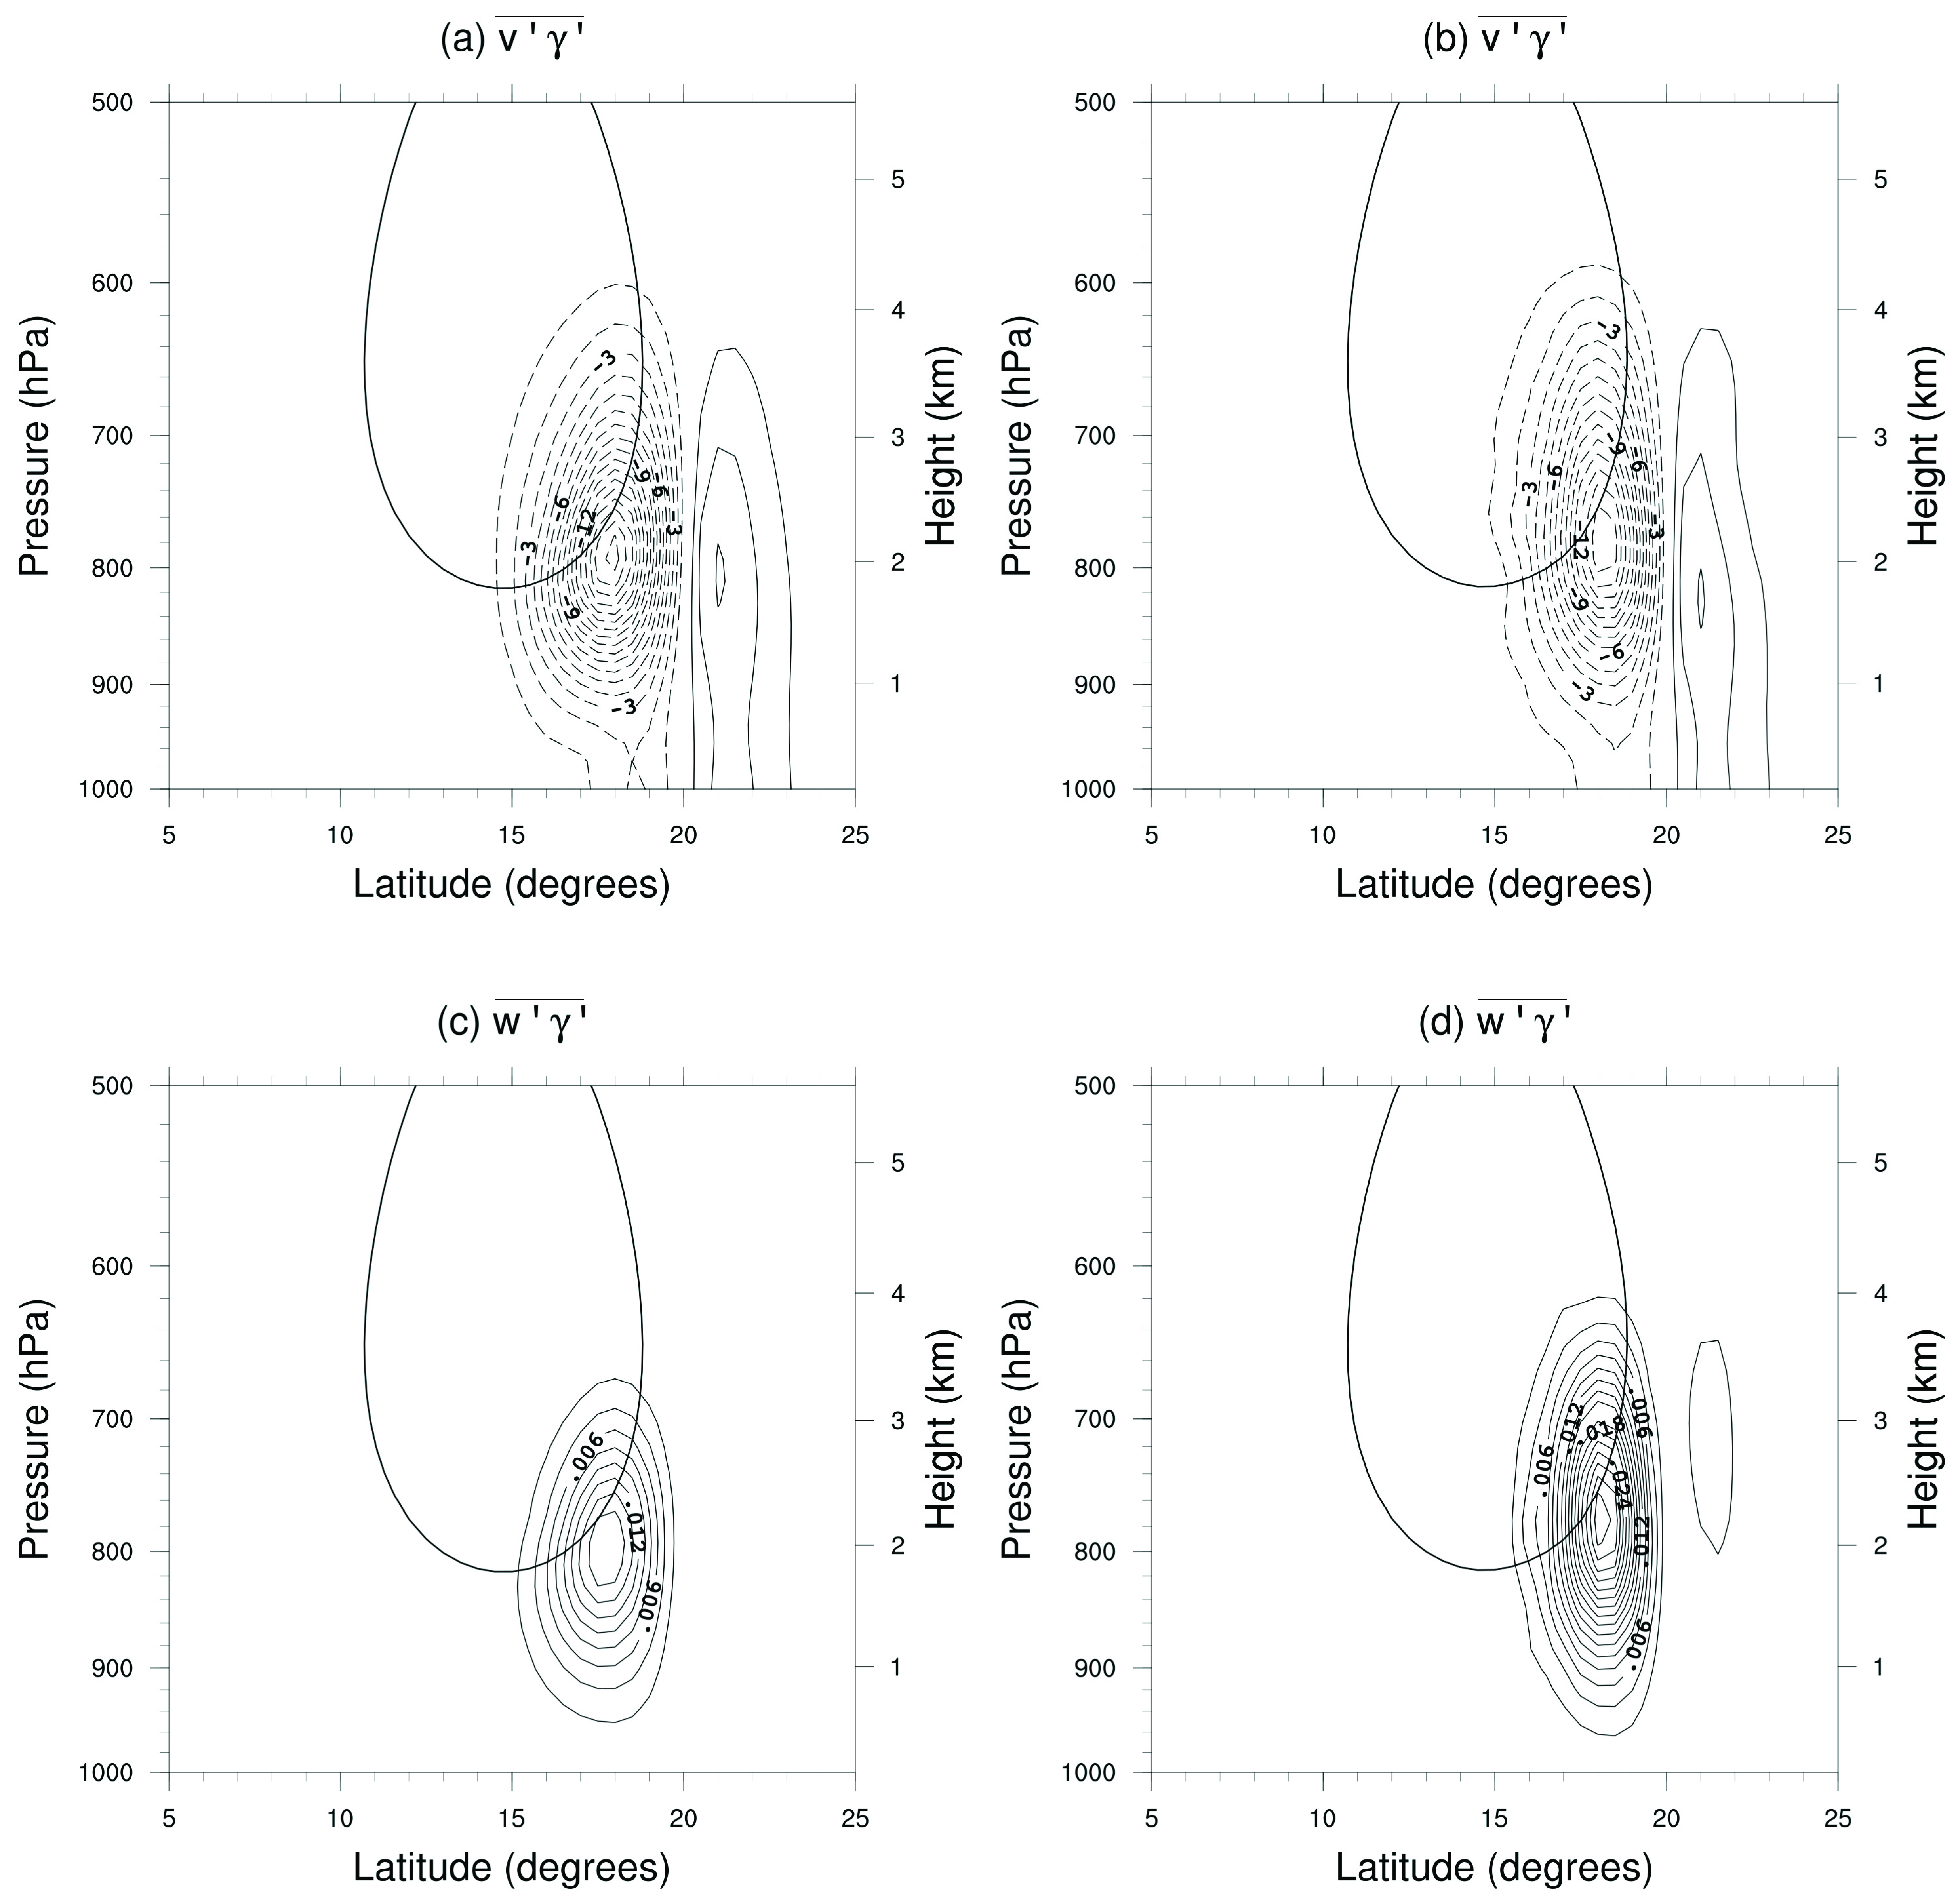
Figure 5 shows the dust transports in the meridional direction and the vertical direction for the passive case and for the active case. To ease comparison with the theory presented in Section 2, the critical surface is also shown. It is important to note that the critical surface, defined by , is essentially the same for both the passive and active cases. This is not surprising since the intrinsic frequency changes by less than 1% between the two cases.
The comparison of passive and active transports shown in Figure 5 reveals some similarities. For example, for both the passive and active cases, the meridional transports, , are characterized by two signals, one south of the mean dust maximum, which is located at 20° N (Figure 1b), and the other to its north (Figure 5a,b). The transports are directed equatorward between 15–20° N, i.e., in the region where . The transports are directed poleward between 20–25° N, where . Thus, the equatorward and poleward transports are directed down the background dust gradient. The equatorward transports, which are more than a factor of three times larger than the poleward transports, are maximized at ~18° N, ~800 hPa. This point, as noted earlier, coincides with the critical surface, which agrees with the theoretical prediction in Section 2 and the reanalysis results of Grogan and Thorncroft [30]. The vertical dust transports are upward both north and south of the dust maximum, and, like the meridional transports, are down the background dust gradient and are largest at ~18° N, ~800 hPa (Figure 5c,d). As predicted from the theoretical framework, for both cases, the dust transports diminish with distance from the critical surface.
The most striking difference between the passive and active transports shown in Figure 5 is in their magnitudes. In the active case, the maximum vertical (upward) transports are ~50% larger than in the passive case, whereas the maximum meridional (southward) transports are ~10% smaller. This means that, in models where the dust is radiatively decoupled from the circulation, the dust residence times in the atmosphere will be underestimated, while the dust concentrations that extend south of the Sahel will be overestimated.
To explain the differences in the transports between the two cases, we refer to the analytical transport Equations (8) and (9). If we again focus on the region near the critical surface (18° N, 800 hPa), such that and Equation (10) holds, we obtain the following approximate forms for the transports:
Near the critical surface both transports are proportional to the mean meridional dust gradient, which is positive. Thus, according to Equations (12) and (13) and consistent with Figure. 5, the transports are maximized in regions where the critical surface is coincident with the maximum in the mean meridional dust gradient. Moreover, the transports are distinguished by the Reynolds stresses: the meridional transports depend on the northward flux of northerly momentum, whereas the vertical transports depend on the northward flux of vertical momentum. As discussed earlier, for both the passive and active cases, the meridional velocity amplitudes are about the same (cf. Figure 3a,b), whereas for the active case the growth rate is ~20% larger and is ~100% larger. This means that changes in between the two cases is controlled by and is thus smaller for the active case. However is mostly controlled by and is thus larger in the active case.
5. Conclusions
Major advances in understanding how Saharan dust affects weather and climate have largely been acquired from numerical models. These models can be divided into two categories: offline (passive) transport models, in which the dust is radiatively decoupled from the circulation, and online (active) models, in which the dust and circulation are radiatively coupled [5].
In this study, we have examined the differences between the passive and active transports of Saharan mineral dust aerosols by exponentially amplifying AEWs. These waves, which are a signature feature of the synoptic-scale circulation over North Africa, are among the multiple-scale wind systems that contribute to the emission and transport of Saharan dust [23,28,30,31]. Our analysis was framed around two questions: first, what are the physical and dynamical interactions that control the differences between the passive and active modeling approaches; second, to what extent do the passive and active dust transports differ in amount and location. To answer these questions, we combined theory and modeling.
The theory, which is valid for any wave, irrespective of scale, is based on a linear conservation equation for the dust field. Here, we focused the theory on dust-coupled AEWs in zonal-mean African easterly jets. The theory shows:
- For both the passive and active cases, the meridional and vertical dust transports each depend on the Reynolds stresses operating on the mean dust gradients in both the meridional and vertical directions;
- The dust transports are largest where the zonal-mean dust gradients are maximized along an AEW critical surface, irrespective of whether the dust fields are radiatively passive or active;
- Whether the dust transports are largest for the radiatively passive or radiatively active case depends on the dust-modified AEW growth rate and on the dust-modified Reynolds stresses acting on the mean dust gradients.
The theoretical predictions were confirmed with numerical experiments executed with the Weather Research and Forecasting-dust (WRF-dust) model. The (linear) experiments were carried out based on a zonal-mean background state that is consistent with the observed African easterly jet (AEJ) and the zonal-mean dust distribution over North Africa. The numerical experiments show, in agreement with the theory, that, for both the passive and active cases, dust transports are largest where the critical surface coincides with the maximum in the mean meridional dust gradient.
There are, however, several differences between the passive and active transports. For example, for the active case, the maximum meridional transport is ~10% smaller, while the maximum vertical transport is ~50% larger. Guided by the theory, these percentages were explained in terms of the differences between the growth rate and the Reynolds stresses acting on the mean dust gradients.
The theoretical and numerical results presented in this study have several implications regarding the transport of Saharan mineral dust during the initial growth phase of African easterly waves. For example, the fact that, for the active case, the meridional dust transports are smaller and the vertical transports significantly larger means that passive models will overestimate Saharan dust concentrations in the Sahel and underestimate the concentrations aloft. The additional dust in the Sahel may result in enhanced concentrations downstream as they are carried offshore by the African easterly jet. Meanwhile, the underestimation of dust aloft will shorten its residence time, on average, which in turn could reduce downstream transport. The extent to which these meridional and vertical transport effects might be offset downstream is unclear. This requires further study in a framework in which zonal variations in both the background AEJ and transports are accounted for.
The close agreement between the theory and modeling of the zonal-mean dust transports by AEWs for both passive and active scenarios presented here lends confidence to the results. Nevertheless, there are several extensions of this study that should be considered, particularly relating to the quantitative values for the transports. For example, it is unclear to what extent the passive and active transports are sensitive to the structure, strength, and location of the AEJ, and to the structure and concentration of the background dust field. In addition, because the eddy dust heating rate depends on the spatial distribution, size distribution, and optical properties of the dust, a sensitivity analysis of how these dust properties affect AEWs of various scales in passive and active scenarios should also be carried out. Finally, we note that our study focused on the transports associated with linearly unstable AEWs. It would be interesting to compare the passive and active dust transports during the life cycles of AEWs, which Grogan et al. [29] have shown are characterized by distinct stages with distinct growth and structural characteristics.
Although further work is needed regarding the modeling of Saharan dust transport by AEWs, the combination of theory and modeling presented in this study will aid in the interpretation of results obtained from high resolution dust transport models and in the predictability of where the transports should be largest.
Author Contributions
Conceptualization, D.F.P.G. and T.R.N.; methodology, D.F.P.G. and T.R.N.; validation, D.F.P.G. and T.R.N.; formal analysis, D.F.P.G. and T.R.N.; investigation, D.F.P.G. and T.R.N.; writing—original draft preparation, T.R.N.; writing—review and editing, D.F.P.G. and T.R.N.; visualization, D.F.P.G. All authors have read and agreed to the published version of the manuscript.
Funding
This research was funded by NSF Grant 1624414-0 (TRN) and NSF Grant 2108233 (DFPG).
Institutional Review Board Statement
Not applicable.
Informed Consent Statement
Not applicable.
Data Availability Statement
Not applicable.
Acknowledgments
We acknowledge the high-performance computing support from Cheyenne (doi:10.5065/D6RX99HX) provided by NCAR’s Computational and Information Systems Laboratory.
Conflicts of Interest
The authors declare no conflict of interest.
References
- Prospero, J.M.; Delany, A.C.; Delany, A.C.; Carlson, T.N. The Discovery of African Dust Transport to the Western Hemisphere and the Saharan Air Layer: A History. Bull. Am. Meteorol. Soc. 2021, 102, E1239–E1260. [Google Scholar] [CrossRef]
- Tegen, I.; Fung, I. Modeling of mineral dust in the atmosphere: Sources, transport, and optical thickness. J. Geophys. Res. Atmos. 1994, 99, 22897–22914. [Google Scholar] [CrossRef]
- Knippertz, P.; Todd, M.C. Mineral dust aerosols over the Sahara: Meteorological controls on emission and transport and implications for modeling. Rev. Geophys. 2012, 50, 1007. [Google Scholar] [CrossRef]
- Schepanski, K. Transport of Mineral Dust and Its Impact on Climate. Geosciences 2018, 8, 151. [Google Scholar] [CrossRef] [Green Version]
- Baklanov, A.; Schlünzen, K.; Suppan, P.; Baldasano, J.; Brunner, D.; Aksoyoglu, S.; Carmichael, G.; Douros, J.; Flemming, J.; Forkel, R.; et al. Online coupled regional meteorology chemistry models in Europe: Current status and prospects. Atmos. Chem. Phys. 2014, 14, 317–398. [Google Scholar] [CrossRef] [Green Version]
- Kukkonen, J.; Olsson, T.; Schultz, D.M.; Baklanov, A.; Klein, T.; Miranda, A.I.; Monteiro, A.; Hirtl, M.; Tarvainen, V.; Boy, M.; et al. A review of operational, regional-scale, chemical weather forecasting models in Europe. Atmos. Chem. Phys. 2012, 12, 1–87. [Google Scholar] [CrossRef] [Green Version]
- Colarco, P.; Da Silva, A.; Chin, M.; Diehl, T. Online simulations of global aerosol distributions in the NASA GEOS-4 model and comparisons to satellite and ground-based aerosol optical depth. J. Geophys. Res. Atmos. 2010, 115, 288. [Google Scholar] [CrossRef] [Green Version]
- Carlson, T.N.; Benjamin, S. Radiative Heating Rates for Saharan Dust. J. Atmos. Sci. 1980, 37, 193–213. [Google Scholar] [CrossRef] [Green Version]
- Zhu, A.; Ramanathan, V.; Li, F.; Kim, D. Dust plumes over the Pacific, Indian, and Atlantic oceans: Climatology and radiative impact. J. Geophys. Res. Atmos. 2007, 112, 132. [Google Scholar] [CrossRef]
- Chen, S.-H.; Wang, S.-H.; Waylonis, M. Modification of Saharan air layer and environmental shear over the eastern Atlantic Ocean by dust-radiation effects. J. Geophys. Res. Atmos. 2010, 115, 45. [Google Scholar] [CrossRef]
- Knippertz, P.; Todd, M.C. The central west Saharan dust hot spot and its relation to African easterly waves and extratropical disturbances. J. Geophys. Res. Atmos. 2010, 115, 79. [Google Scholar] [CrossRef] [Green Version]
- Chen, S.; Huang, C.; Kuo, Y.; Tseng, Y.; Gu, Y.; Earl, K.; Chen, C.; Choi, Y.; Liou, K. Impacts of Saharan Mineral Dust on Air-Sea Interaction over North Atlantic Ocean Using a Fully Coupled Regional Model. J. Geophys. Res. Atmos. 2021, 126. [Google Scholar] [CrossRef]
- Fiedler, S.; Schepanski, K.; Heinold, B.; Knippertz, P.; Tegen, I. Climatology of nocturnal low-level jets over North Africa and implications for modeling mineral dust emission. J. Geophys. Res. Atmos. 2013, 118, 6100–6121. [Google Scholar] [CrossRef] [Green Version]
- Burpee, R.W. The Origin and Structure of Easterly Waves in the Lower Troposphere of North Africa. J. Atmos. Sci. 1972, 29, 77–90. [Google Scholar] [CrossRef] [Green Version]
- Reed, R.J.; Norquist, D.C.; Recker, E.E. The Structure and Properties of African Wave Disturbances as Observed During Phase III of GATE. Mon. Weather. Rev. 1977, 105, 317–333. [Google Scholar] [CrossRef] [Green Version]
- Kiladis, G.N.; Thorncroft, C.D.; Hall, N.M.J. Three-Dimensional Structure and Dynamics of African Easterly Waves. Part I: Observations. J. Atmos. Sci. 2006, 63, 2212–2230. [Google Scholar] [CrossRef]
- Thorncroft, C.D.; Hoskins, B.J. An idealized study of African easterly waves. I: A linear view. Q. J. R. Meteorol. Soc. 1994, 120, 953–982. [Google Scholar] [CrossRef]
- Thorncroft, C.D.; Hoskins, B.J. An idealized study of African easterly waves. II: A nonlinear view. Q. J. R. Meteorol. Soc. 1994, 120, 983–1015. [Google Scholar] [CrossRef]
- Paradis, D.; Lafore, J.-P.; Redelsperger, J.-L.; Balaji, V. African Easterly Waves and Convection. Part I: Linear Simulations. J. Atmos. Sci. 1995, 52, 1657–1679. [Google Scholar] [CrossRef] [Green Version]
- Pytharoulis, I.; Thorncroft, C. The Low-Level Structure of African Easterly Waves in 1995. Mon. Weather Rev. 1999, 127, 2266–2280. [Google Scholar] [CrossRef] [Green Version]
- Carlson, T.N. Some Remarks on African Disturbances and Their Progress over the Tropical Atlantic. Mon. Weather Rev. 1969, 97, 716–726. [Google Scholar] [CrossRef]
- Bercos-Hickey, E.; Nathan, T.R.; Chen, S. Saharan dust and the African easterly jet–African easterly wave system: Structure, location and energetics. Q. J. R. Meteorol. Soc. 2017, 143, 2797–2808. [Google Scholar] [CrossRef] [Green Version]
- Karyampudi, V.M.; Carlson, T.N. Analysis and Numerical Simulations of the Saharan Air Layer and Its Effect on Easterly Wave Disturbances. J. Atmos. Sci. 1988, 45, 3102–3136. [Google Scholar] [CrossRef] [Green Version]
- Fiedler, S.; Schepanski, K.; Knippertz, P.; Heinold, B.; Tegen, I. How important are atmospheric depressions and mobile cyclones for emitting mineral dust aerosol in North Africa? Atmos. Chem. Phys. 2014, 14, 8983–9000. [Google Scholar] [CrossRef] [Green Version]
- Carlson, T.N.; Prospero, J.M. The large-scale movement of Saharan air outbreaks over the northern equatorial Atlantic. J. Appl. Meteor. 1972, 11, 283–297. [Google Scholar] [CrossRef]
- Prospero, J.M. Long-range transport of mineral dust in the global atmosphere: Impact of African dust on the environment of the southeastern United States. Proc. Natl. Acad. Sci. USA 1999, 96, 3396–3403. [Google Scholar] [CrossRef] [PubMed] [Green Version]
- Vizy, E.K.; Cook, K.H. A mechanism for African monsoon breaks: Mediterranean cold air surges. J. Geophys. Res. Atmos. 2009, 114, D01104. [Google Scholar] [CrossRef] [Green Version]
- Jones, C.; Mahowald, N.; Luo, C. The Role of Easterly Waves on African Desert Dust Transport. J. Clim. 2003, 16, 3617–3628. [Google Scholar] [CrossRef] [Green Version]
- Grogan, D.F.P.; Nathan, T.R.; Chen, S.-H. Saharan Dust and the Nonlinear Evolution of the African Easterly Jet–African Easterly Wave System. J. Atmos. Sci. 2016, 74, 27–47. [Google Scholar] [CrossRef]
- Grogan, D.F.; Thorncroft, C.D. The characteristics of African easterly waves coupled to Saharan mineral dust aerosols. Q. J. R. Meteorol. Soc. 2019, 145, 1130–1146. [Google Scholar] [CrossRef]
- Nathan, T.R.; Grogan, D.F.P.; Chen, S.-H. Saharan Dust Transport during the Incipient Growth Phase of African Easterly Waves. Geosciences 2019, 9, 388. [Google Scholar] [CrossRef] [Green Version]
- Chen, S.-H.; Liu, Y.-C.; Nathan, T.R.; Davis, C.; Torn, R.; Sowa, N.; Cheng, C.-T.; Chen, J.-P. Modeling the effects of dust-radiative forcing on the movement of Hurricane Helene (2006). Q. J. R. Meteorol. Soc. 2015, 141, 2563–2570. [Google Scholar] [CrossRef]
- Jones, C.; Mahowald, N.; Luo, C. Observational evidence of African desert dust intensification of easterly waves. Geophys. Res. Lett. 2004, 31, 45. [Google Scholar] [CrossRef] [Green Version]
- Ma, P.-L.; Zhang, K.; Shi, J.J.; Matsui, T.; Arking, A. Direct Radiative Effect of Mineral Dust on the Development of African Easterly Waves in Late Summer, 2003–2007. J. Appl. Meteorol. Clim. 2012, 51, 2090–2104. [Google Scholar] [CrossRef]
- Grogan, D.F.P.; Nathan, T.R.; Chen, S.-H. Effects of Saharan Dust on the Linear Dynamics of African Easterly Waves. J. Atmos. Sci. 2016, 73, 891–911. [Google Scholar] [CrossRef]
- Nathan, T.R.; Grogan, D.F.P.; Chen, S.-H. Subcritical Destabilization of African Easterly Waves by Saharan Mineral Dust. J. Atmos. Sci. 2017, 74, 1039–1055. [Google Scholar] [CrossRef]
- Grogan, D.F.P.; Nathan, T.R.; Chen, S.-H. Structural Changes in the African Easterly Jet and Its Role in Mediating the Effects of Saharan Dust on the Linear Dynamics of African Easterly Waves. J. Atmos. Sci. 2019, 76, 3351–3365. [Google Scholar] [CrossRef]
- Bercos-Hickey, E.; Nathan, T.R.; Chen, S.-H. On the Relationship between the African Easterly Jet, Saharan Mineral Dust Aerosols, and West African Precipitation. J. Clim. 2020, 33, 3533–3546. [Google Scholar] [CrossRef]
- Chou, M.D.; Suarez, M.J. A solar radiation parameterization for atmospheric studies. NASA Tech. Memo. 1999, 15, 104606. Available online: https://gmao.gsfc.nasa.gov/pubs/docs/Chou136.pdf (accessed on 27 September 2021).
- Chou, M.D.; Suarez, M.J.; Liang, X.Z.; Yan, M.M.H. A thermal infrared radiation parameterization for Atmospheric Studies. NASA Tech. Memo. 2001, 19, 104606. Available online: https://ntrs.nasa.gov/api/citations/20010072848/downloads/20010072848.pdf (accessed on 27 September 2021).
- Hess, M.; Koepke, P.; Schult, I. Optical Properties of Aerosols and Clouds: The Software Package OPAC. Bull. Am. Meteorol. Soc. 1998, 79, 831–844. [Google Scholar] [CrossRef]
- Kok, J.F. A scaling theory for the size distribution of emitted dust aerosols suggests climate models underestimate the size of the global dust cycle. Proc. Natl. Acad. Sci. USA 2011, 108, 1016–1021. [Google Scholar] [CrossRef] [PubMed] [Green Version]
- Engelstaedter, S.; Washington, R. Atmospheric controls on the annual cycle of North African dust. J. Geophys. Res. Atmos. 2007, 112, D03103. [Google Scholar] [CrossRef]
- Yu, H.; Chin, M.; Winker, D.M.; Omar, A.H.; Liu, Z.; Kittaka, C.; Diehl, T. Global view of aerosol vertical distributions from CALIPSO lidar measurements and GOCART simulations: Regional and seasonal variations. J. Geophys. Res. Atmos. 2010, 115, D00H30. [Google Scholar] [CrossRef] [Green Version]
Figure 1.
(a) Background AEJ (solid) and potential temperature (dashed). Contour intervals: 2 m s−1 and 3 K, respectively. (b) Background dust field. Contour interval: 100 μg kg−1; ‘X’ denotes the location of the AEJ core, which is at 15° N, 650 hPa.
Figure 1.
(a) Background AEJ (solid) and potential temperature (dashed). Contour intervals: 2 m s−1 and 3 K, respectively. (b) Background dust field. Contour interval: 100 μg kg−1; ‘X’ denotes the location of the AEJ core, which is at 15° N, 650 hPa.

Figure 2.
The dust diabatic heating rate, , at 18° N for the active case. Solid (dashed) contours correspond to positive (negative) values. The zonal phase angle is relative to the AEW; 360° of zonal phase is one AEW wavelength (3300 km), 12° of zonal phase is 1° of longitude. Contour intervals are 0.25 K day−1.

Figure 3.
(a,b) The meridional velocity, , and (c,d) vertical velocity, , fields at 18° N for the passive (left column) and active (right column) experiments. Solid (dashed) contours correspond to positive (negative) values. Contour intervals are 0.5 m s−1 for and 0.001 m s−1 for .
Figure 3.
(a,b) The meridional velocity, , and (c,d) vertical velocity, , fields at 18° N for the passive (left column) and active (right column) experiments. Solid (dashed) contours correspond to positive (negative) values. Contour intervals are 0.5 m s−1 for and 0.001 m s−1 for .

Figure 4.
Vertical structures of the perturbation dust field, , at 18° N for the (a) passive and (b) active experiments. Contour intervals are 10 μg kg−1.
Figure 4.
Vertical structures of the perturbation dust field, , at 18° N for the (a) passive and (b) active experiments. Contour intervals are 10 μg kg−1.

Figure 5.
Latitude–height cross sections of the (a,b) meridional dust transports and (c,d) vertical dust transports for the passive case (left column) and active case (right column). Solid/dashed contours indicate northward/southward transport (top) and upward/downward transport (bottom). Overlaying each plot is the critical surface (bold). Contour intervals: (top) 2.0 × 10⁻⁷ m s−1 and (bottom) 0.002 × 10⁻⁷ m s−1.


Table 1.
List of symbols.
| Symbol | Definition |
|---|---|
| time; eastward, northward, and vertical directions | |
| scale height, sea level reference pressure and reference density | |
| background reference density | |
| background zonal-mean wind and dust mass mixing ratio | |
| perturbation dust mass mixing ratio | |
| perturbation zonal wind speed | |
| perturbation meridional wind speed | |
| perturbation vertical wind speed | |
| dust diabatic heating rate per unit mass, dust depletion rate | |
| dust heating rate coefficient, dust depletion rate coefficient | |
| mean aerosol optical depth, mean transmissivity | |
| solar constant, cosine of the solar zenith angle, specific absorption coefficient |
Publisher’s Note: MDPI stays neutral with regard to jurisdictional claims in published maps and institutional affiliations. |
© 2021 by the authors. Licensee MDPI, Basel, Switzerland. This article is an open access article distributed under the terms and conditions of the Creative Commons Attribution (CC BY) license (https://creativecommons.org/licenses/by/4.0/).
Share and Cite
MDPI and ACS Style
Grogan, D.F.P.; Nathan, T.R. Passive versus Active Transport of Saharan Dust Aerosols by African Easterly Waves. Atmosphere 2021, 12, 1509. https://0-doi-org.brum.beds.ac.uk/10.3390/atmos12111509
AMA Style
Grogan DFP, Nathan TR. Passive versus Active Transport of Saharan Dust Aerosols by African Easterly Waves. Atmosphere. 2021; 12(11):1509. https://0-doi-org.brum.beds.ac.uk/10.3390/atmos12111509
Chicago/Turabian StyleGrogan, Dustin F. P., and Terrence R. Nathan. 2021. "Passive versus Active Transport of Saharan Dust Aerosols by African Easterly Waves" Atmosphere 12, no. 11: 1509. https://0-doi-org.brum.beds.ac.uk/10.3390/atmos12111509
Note that from the first issue of 2016, this journal uses article numbers instead of page numbers. See further details here.