
Dominant Contributions of Secondary Aerosols and Vehicle Emissions to Water-Soluble Inorganic Ions of PM2.5 in an Urban Site in the Metropolitan Hangzhou, China

 ,
,
Abstract
:1. Introduction
2. Experiment
2.1. Instruments
2.2. Site
2.3. Methods
2.3.1. Back Trajectory and Clusters Analysis
2.3.2. Principal Component Analysis
2.4. Quality Assurance/Quality Control
3. Results and Discussions
3.1. SO2, NO2 and PM2.5 Levels
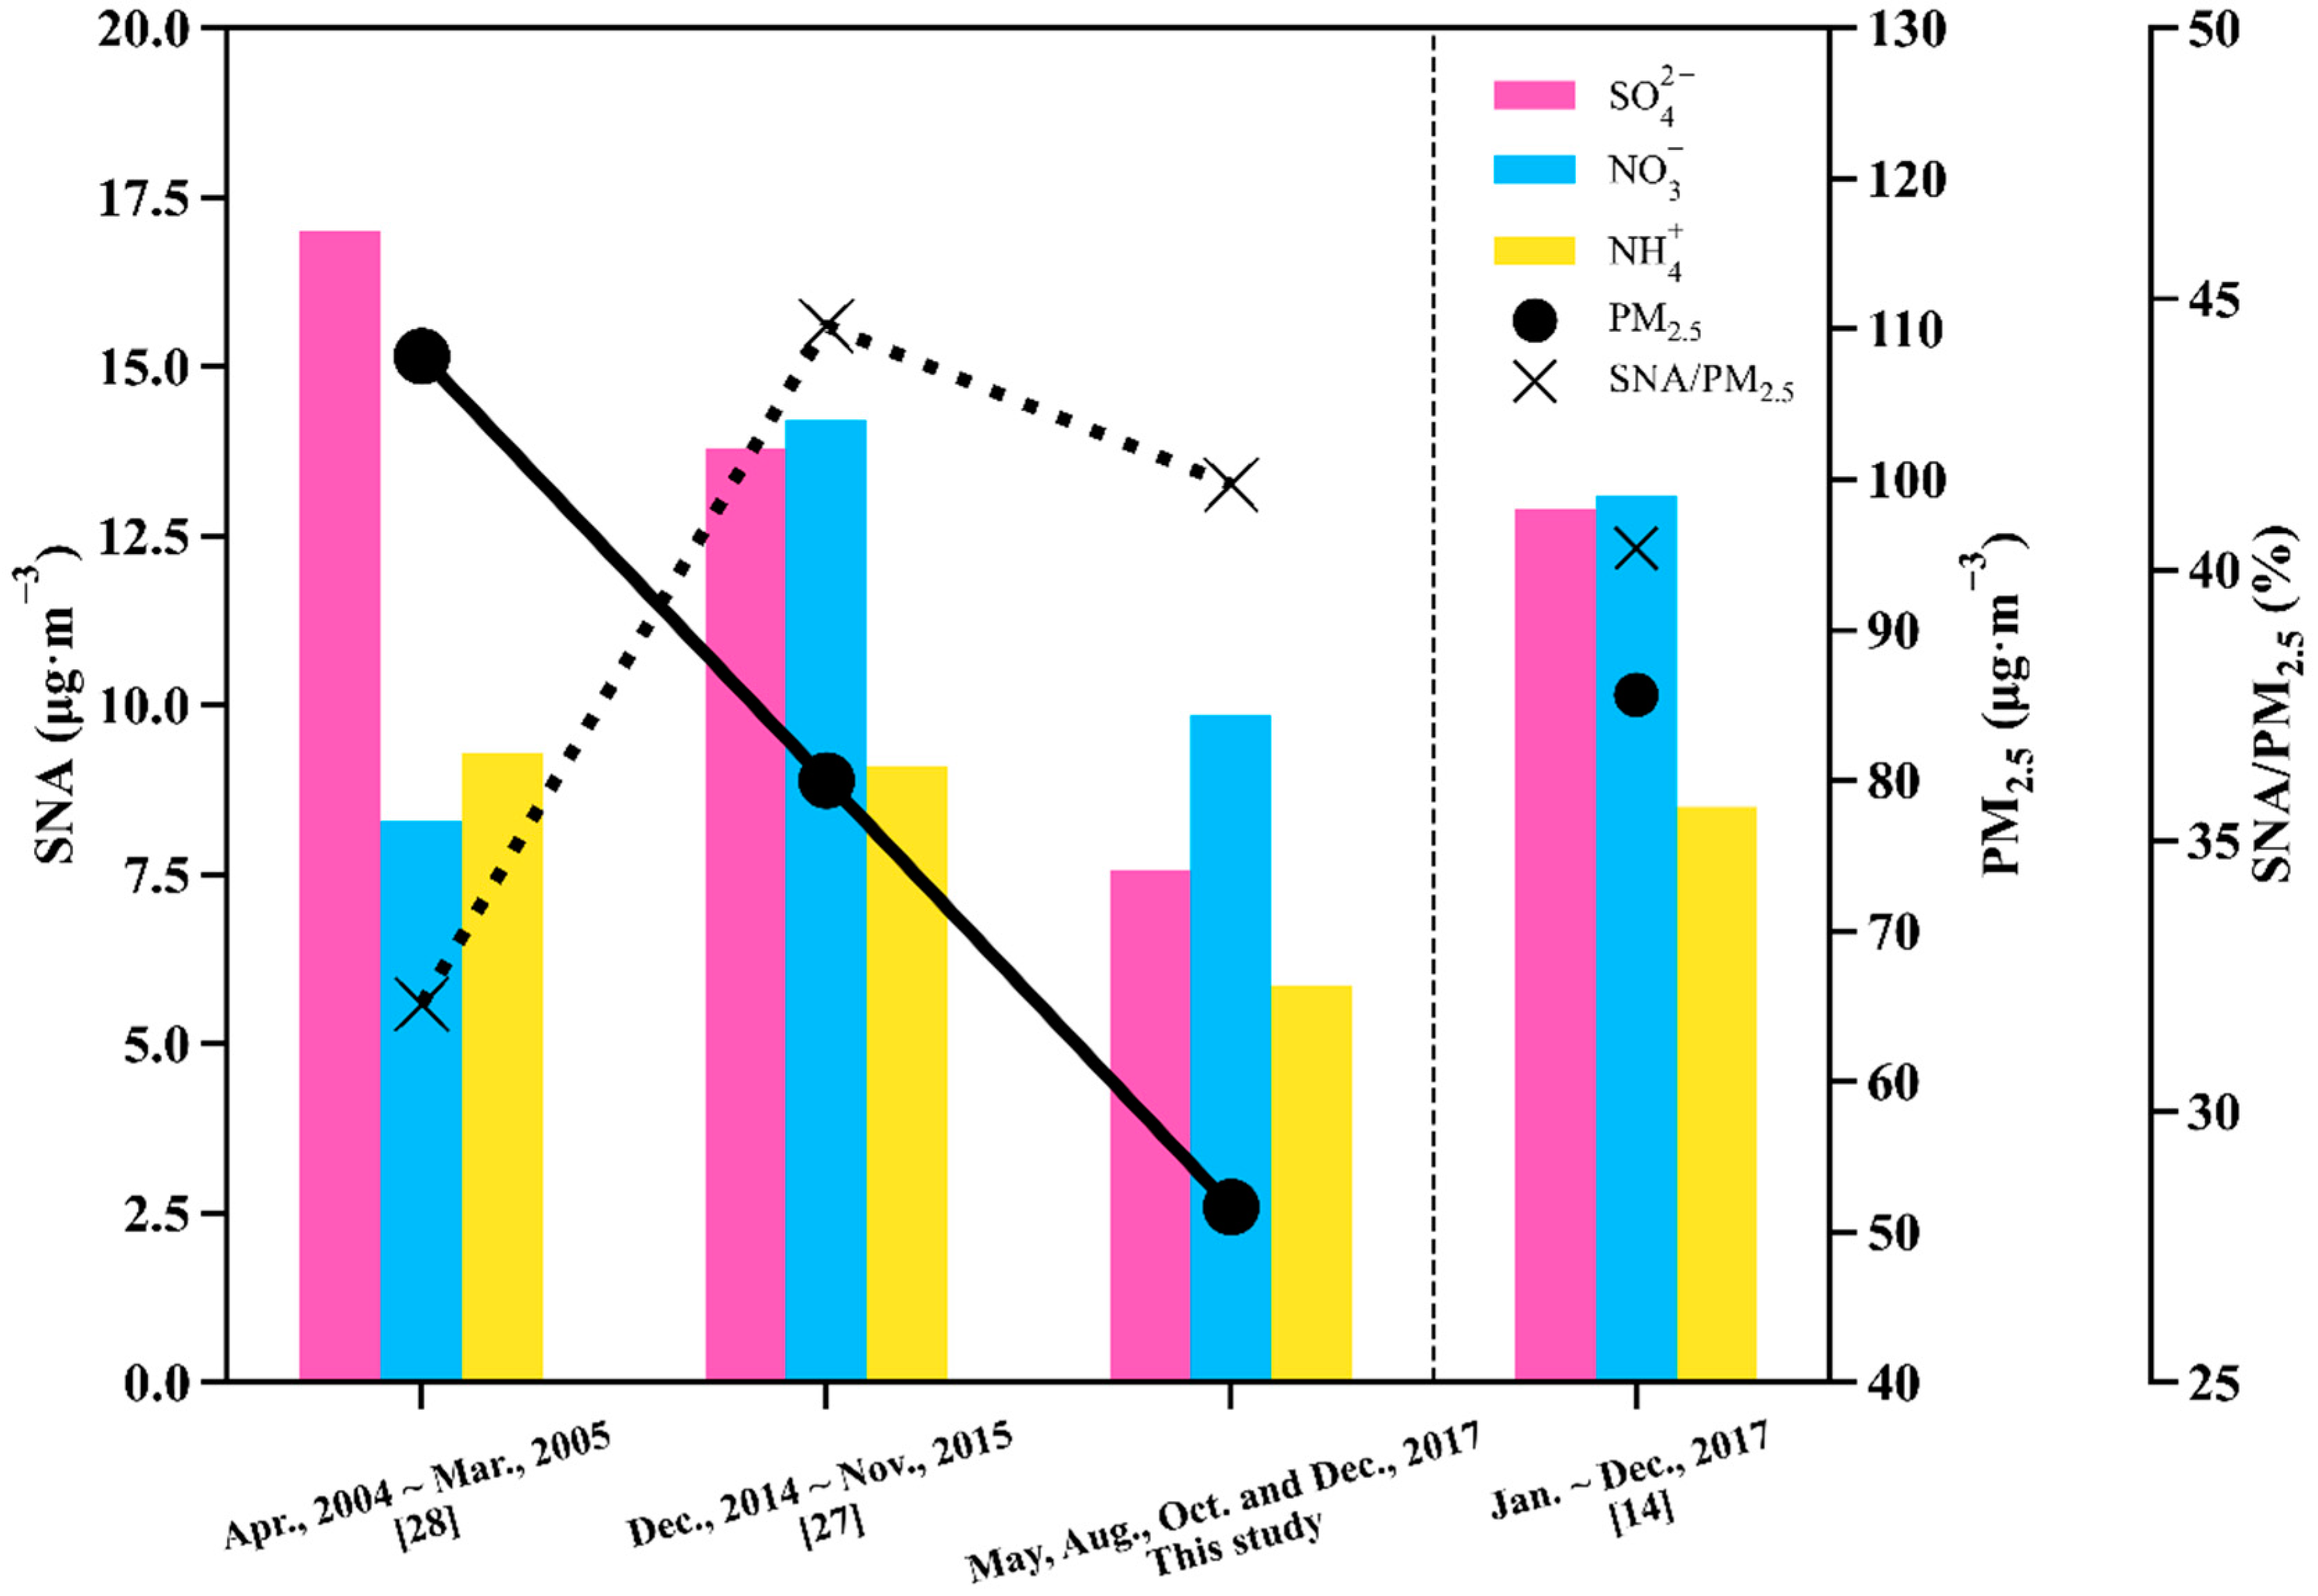
3.2. WSIIs in PM2.5
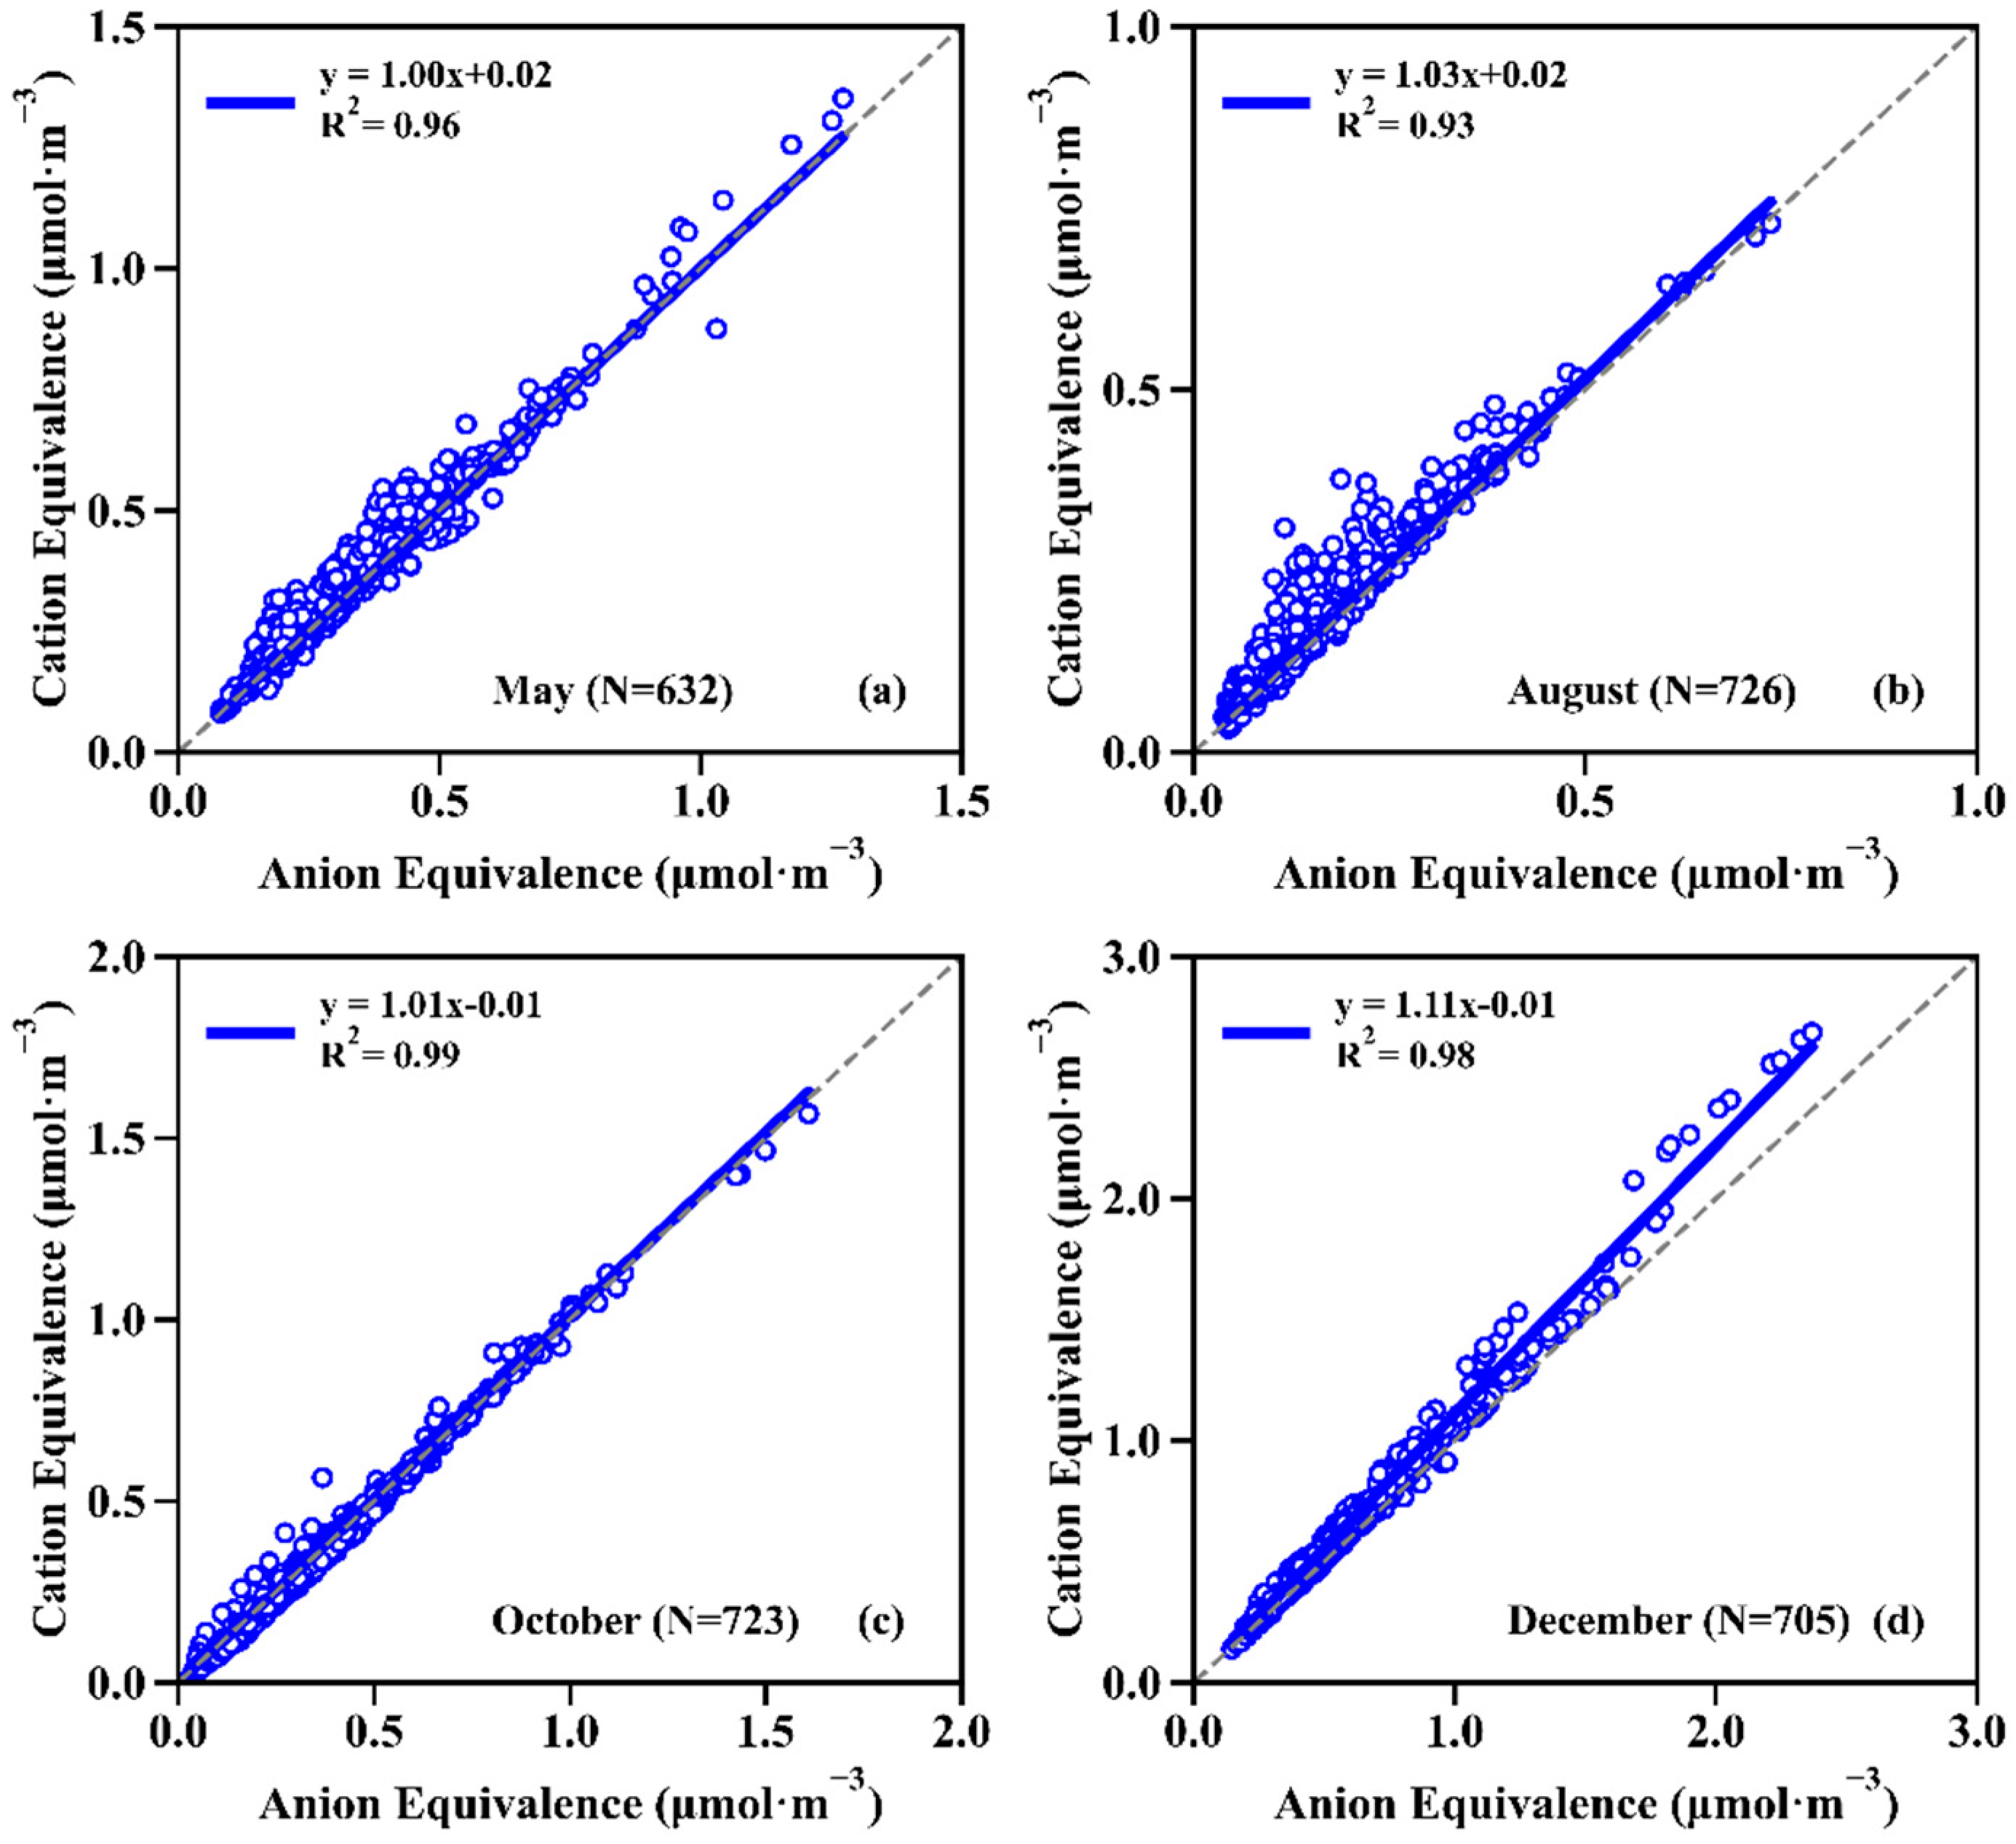
3.3. Acidity
- (1)
- Cation Equivalence (CE) =
- (2)
- Anion Equivalence (AE) = where the concentrations of WSIIs (μg·m−3) were converted into micro-equivalents (μmol·m−3) in the above two equations.
3.4. Formations of Secondary Aerosols
- (1)
- (2)
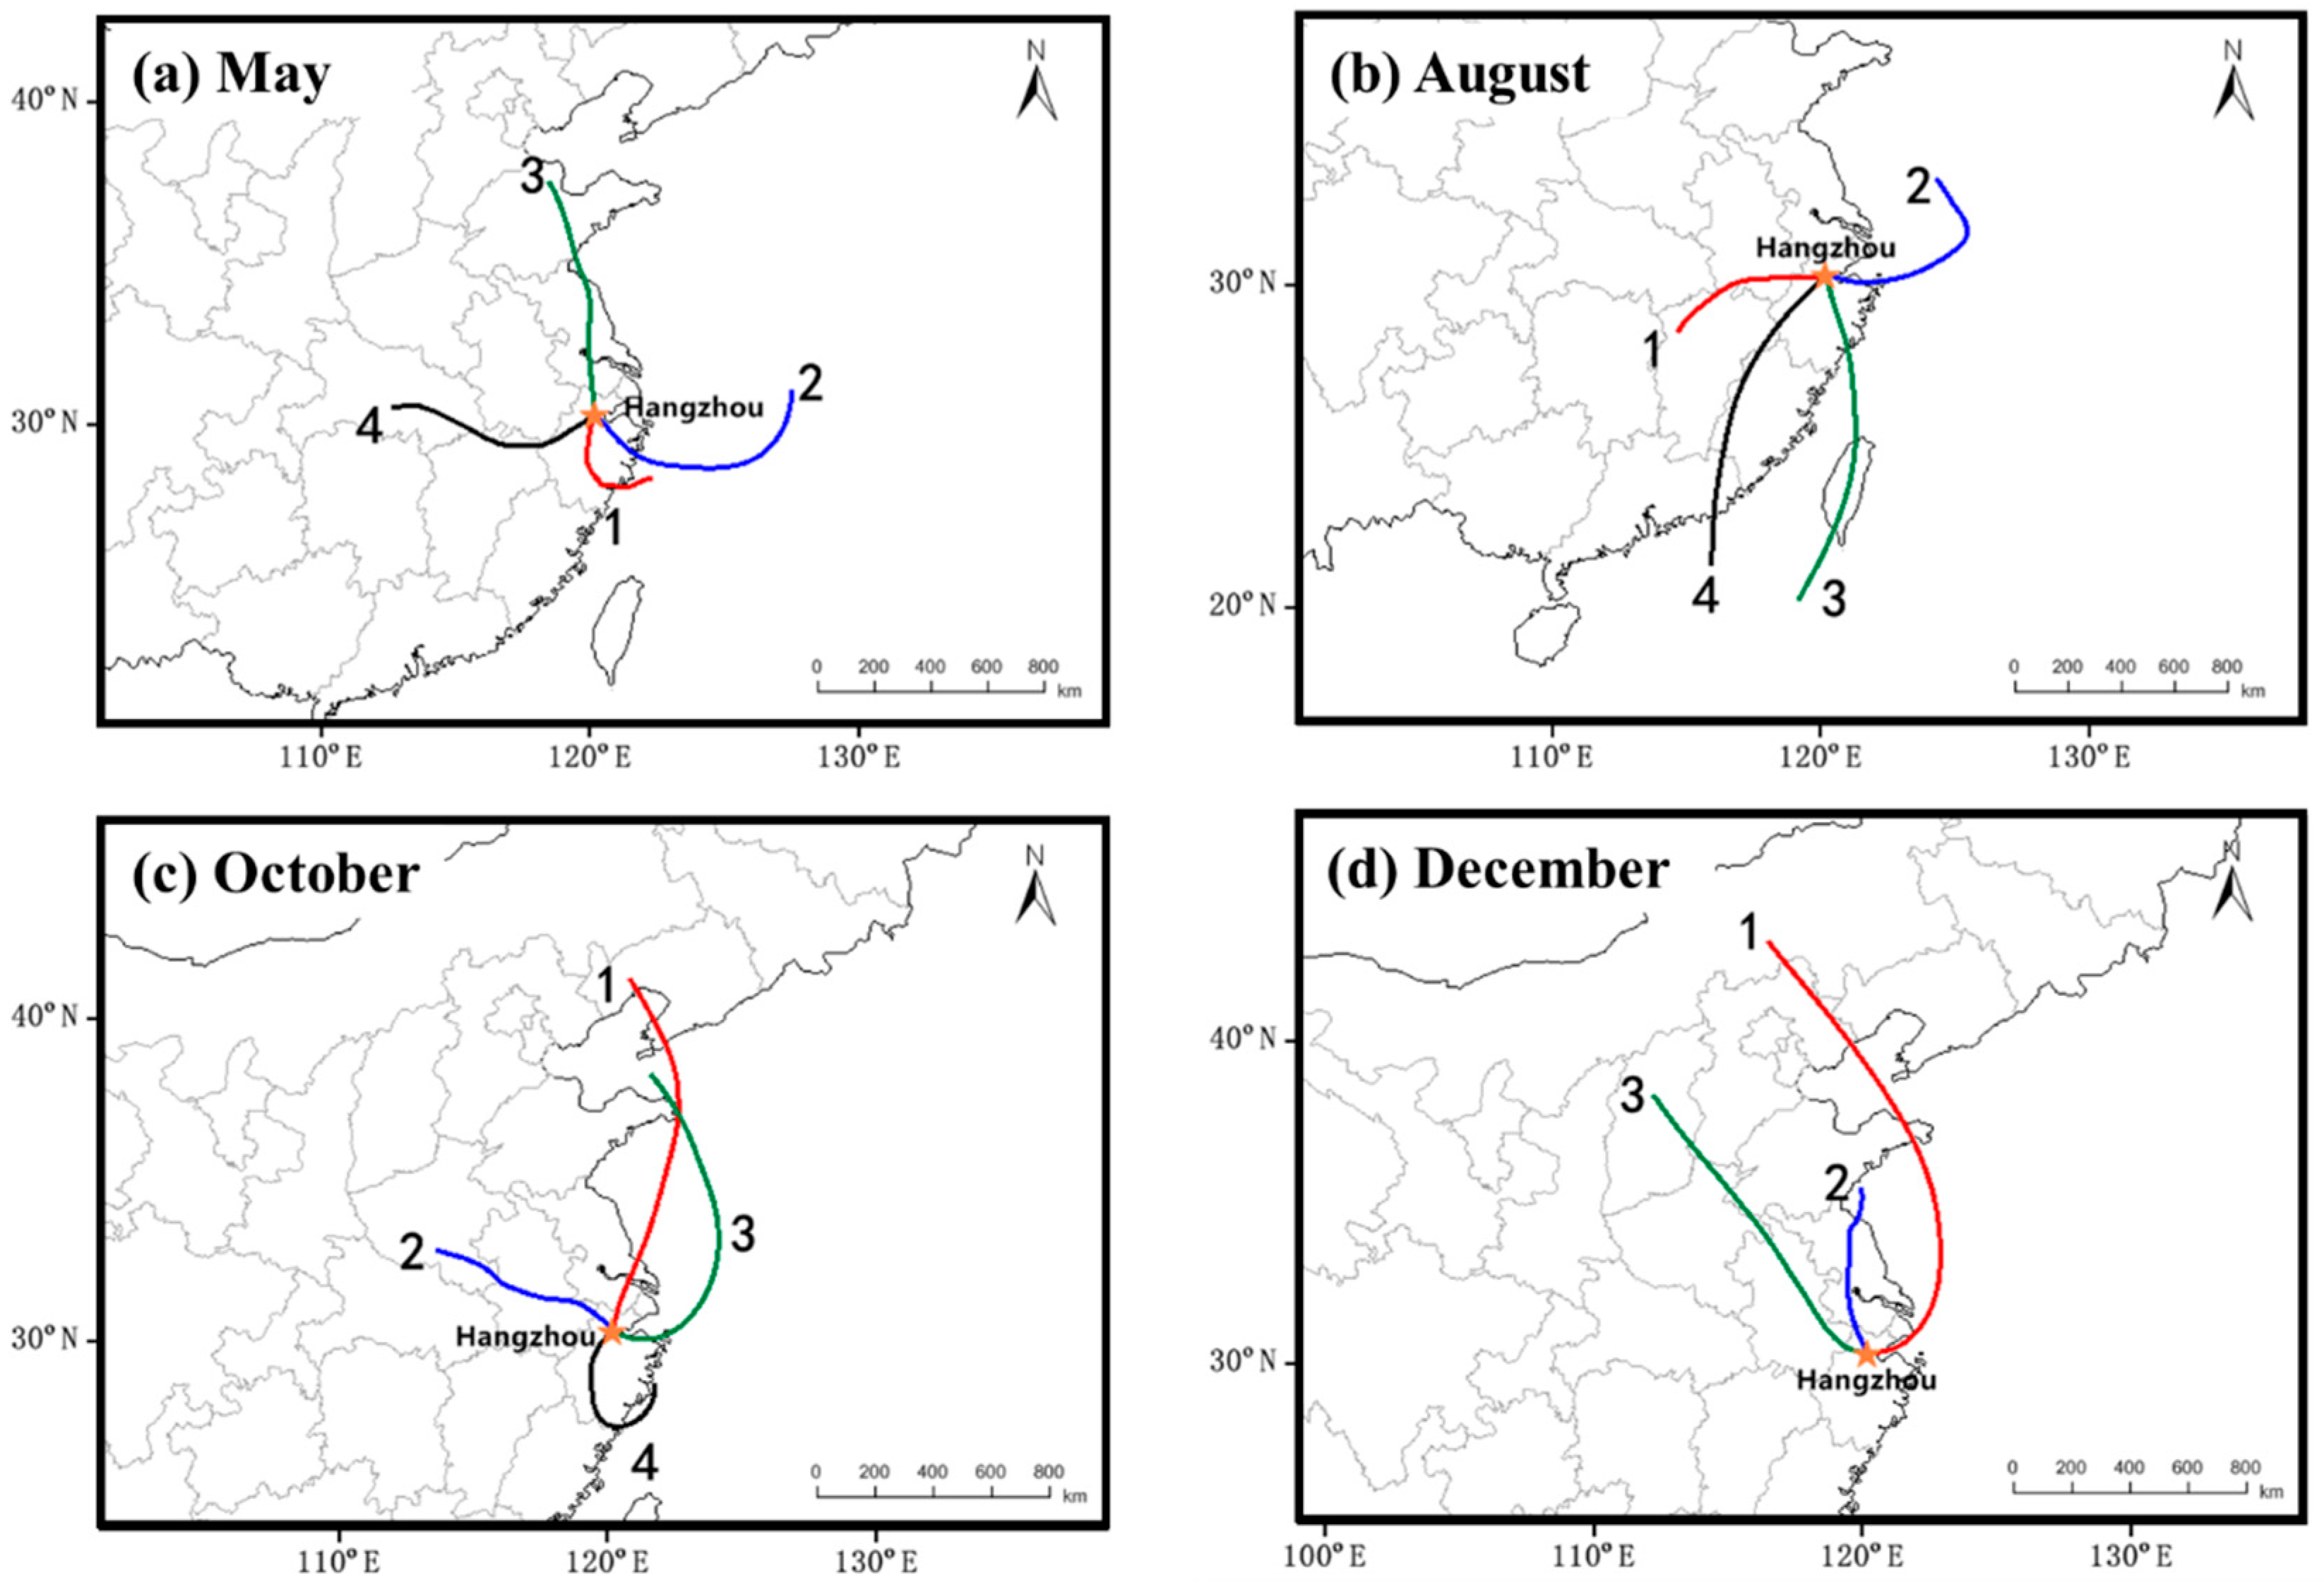
3.5. Back Trajectory and Clusters Analysis
3.6. PCA Analysis
4. Conclusions
Author Contributions
Funding
Institutional Review Board Statement
Informed Consent Statement
Data Availability Statement
Conflicts of Interest
References
- Li, G.; Fang, C.; Wang, S.; Sun, S. The Effect of Economic Growth, Urbanization, and Industrialization on Fine Particulate Matter (PM2.5 Concentrations in China. Environ. Sci. Technol. 2016, 50, 11452–11459. [Google Scholar] [CrossRef]
- Zhao, H.; Guo, S.; Zhao, H. Characterizing the influences of economic development, energy consumption, urbanization, industrialization, and vehicles amount on PM2.5 concentrations of China. Sustainability 2018, 10, 2574. [Google Scholar] [CrossRef]
- Wang, X.; Tian, G.; Yang, D.; Zhang, W.; Lu, D.; Liu, Z. Responses of PM2.5 pollution to urbanization in China. Energy Policy 2018, 123, 602–610. [Google Scholar] [CrossRef]
- Yang, D.; Chen, Y.; Miao, C.; Liu, D. Spatiotemporal variation of PM2.5 concentrations and its relationship to urbanization in the Yangtze river delta region, China. Atmos. Pollut. Res. 2020, 11, 491–498. [Google Scholar] [CrossRef]
- Lu, X.; Lin, C.; Li, W.; Chen, Y.; Huang, Y.; Fung, J.C.H.; Lau, A.K.H. Analysis of the adverse health effects of PM2.5 from 2001 to 2017 in China and the role of urbanization in aggravating the health burden. Sci. Total Environ. 2019, 652, 683–695. [Google Scholar] [CrossRef] [PubMed]
- Feng, S.; Gao, D.; Liao, F.; Zhou, F.; Wang, X. The health effects of ambient PM2.5 and potential mechanisms. Ecotoxicol. Environ. Saf. 2016, 128, 67–74. [Google Scholar] [CrossRef] [PubMed]
- Pui, D.Y.H.; Chen, S.C.; Zuo, Z. PM2.5 in China: Measurements, sources, visibility and health effects, and mitigation. Particuology 2014, 13, 1–26. [Google Scholar] [CrossRef]
- Han, L.; Zhou, W.; Li, W.; Li, L. Impact of urbanization level on urban air quality: A case of fine particles (PM2.5 in Chinese cities. Environ. Pollut. 2014, 194, 163–170. [Google Scholar] [CrossRef] [PubMed]
- Xu, X.; Zhang, T. Spatial-temporal variability of PM2.5 air quality in Beijing, China during 2013–2018. J. Environ. Manag. 2020, 262, 110263. [Google Scholar] [CrossRef] [PubMed]
- Tagaris, E.; Liao, K.J.; Delucia, A.J.; Deck, L.; Amar, P.; Russell, A.G. Potential impact of climate change on air pollution-related human health effects. Environ. Sci. Technol. 2009, 43, 4979–4988. [Google Scholar] [CrossRef]
- Tai, A.P.K.; Mickley, L.J.; Jacob, D.J. Correlations between fine particulate matter (PM2.5 and meteorological variables in the United States: Implications for the sensitivity of PM2.5 to climate change. Atmos. Environ. 2010, 44, 3976–3984. [Google Scholar] [CrossRef]
- Wang, Y.; Gao, W.; Wang, S.; Song, T.; Gong, Z.; Ji, D.; Wang, L.; Liu, Z.; Tang, G.; Huo, Y.; et al. Contrasting trends of PM2.5 and surface-ozone concentrations in China from 2013 to 2017. Natl. Sci. Rev. 2020, 7, 1331–1339. [Google Scholar] [CrossRef] [PubMed] [Green Version]
- Xue, W.; Zhang, J.; Zhong, C.; Ji, D.; Huang, W. Satellite-derived spatiotemporal PM2.5 concentrations and variations from 2006 to 2017 in China. Sci. Total Environ. 2020, 712, 134577. [Google Scholar] [CrossRef]
- Zhao, L.; Wang, L.; Tan, J.; Duan, J.; Ma, X.; Zhang, C.; Ji, S.; Qi, M.; Lu, X.; Wang, Y.; et al. Changes of chemical composition and source apportionment of PM2.5 during 2013–2017 in urban Handan, China. Atmos. Environ. 2019, 206, 119–131. [Google Scholar] [CrossRef]
- Zhao, C.; Niu, M.; Song, S.; Li, J.; Su, Z.; Wang, Y.; Gao, Q.; Wang, H. Serum metabolomics analysis of mice that received repeated airway exposure to a water-soluble PM2.5 extract. Ecotoxicol. Environ. Saf. 2019, 168, 102–109. [Google Scholar] [CrossRef]
- Liu, H.; Tian, H.; Zhang, K.; Liu, S.; Cheng, K.; Yin, S.; Liu, Y.; Liu, X.; Wu, Y.; Liu, W.; et al. Seasonal variation, formation mechanisms and potential sources of PM2.5 in two typical cities in the Central Plains Urban Agglomeration, China. Sci. Total Environ. 2019, 657, 657–670. [Google Scholar] [CrossRef]
- Wang, J.; Li, X.; Zhang, W.; Jiang, N.; Zhang, R.; Tang, X. Secondary PM2.5 in Zhengzhou, China: Chemical Species Based on Three Years of Observations. Aerosol Air Qual. Res. 2017, 16, 91–104. [Google Scholar] [CrossRef] [Green Version]
- Jiang, N.; Guo, Y.; Wang, Q.; Kang, P.; Zhang, R.; Tang, X. Chemical Composition Characteristics of PM2.5 in Three Cities in Henan, Central China. Aerosol Air Qual. Res. 2017, 17, 2367–2380. [Google Scholar] [CrossRef] [Green Version]
- Huang, X.; Liu, Z.; Zhang, J.; Wen, T.; Ji, D.; Wang, Y. Seasonal variation and secondary formation of size-segregated aerosol water-soluble inorganic ions during pollution episodes in Beijing. Atmos. Res. 2016, 168, 70–79. [Google Scholar] [CrossRef]
- Zhang, F.; Wang, Z.W.; Cheng, H.R.; Lv, X.P.; Gong, W.; Wang, X.M.; Zhang, G. Seasonal variations and chemical characteristics of PM2.5 in Wuhan, central China. Sci. Total Environ. 2015, 518–519, 97–105. [Google Scholar] [CrossRef]
- Shen, Z.; Cao, J.; Arimoto, R.; Han, Z.; Zhang, R.; Han, Y.; Liu, S.; Okuda, T.; Nakao, S.; Tanaka, S. Ionic composition of TSP and PM2.5 during dust storms and air pollution episodes at Xi’an, China. Atmos. Environ. 2009, 43, 2911–2918. [Google Scholar] [CrossRef]
- Yu, S.; Zhang, Q.; Yan, R.; Wang, S.; Li, P.; Chen, B.; Liu, W.; Zhang, X. Origin of air pollution during a weekly heavy haze episode in Hangzhou, China. Environ. Chem. Lett. 2014, 12, 543–550. [Google Scholar] [CrossRef]
- Zhou, M.; Zhang, Y.; Han, Y.; Wu, J.; Du, X.; Xu, H.; Feng, Y.; Han, S. Spatial and temporal characteristics of PM2.5 acidity during autumn in marine and coastal area of Bohai Sea, China, based on two-site contrast. Atmos. Res. 2018, 202, 196–204. [Google Scholar] [CrossRef]
- Xue, J.; Lau, A.K.H.; Yu, J.Z. A study of acidity on PM2.5 in Hong Kong using online ionic chemical composition measurements. Atmos. Environ. 2011, 45, 7081–7088. [Google Scholar] [CrossRef]
- Zhang, G.; Xu, H.; Qi, B.; Du, R.; Gui, K.; Wang, H.; Jiang, W.; Liang, L.; Xu, W. Characterization of atmospheric trace gases and particulate matter in Hangzhou, China. Atmos. Chem. Phys. 2018, 18, 1705–1728. [Google Scholar] [CrossRef] [Green Version]
- Hangzhou Municipal People’s Government Home Page. Available online: http://www.hangzhou.gov.cn/ (accessed on 29 July 2021).
- Xu, J.S.; He, J.; Behera, S.N.; Xu, H.H.; Ji, D.S.; Wang, C.J.; Yu, H.; Xiao, H.; Jiang, Y.J.; Qi, B.; et al. Temporal and spatial variation in major ion chemistry and source identification of secondary inorganic aerosols in Northern Zhejiang Province, China. Chemosphere 2017, 179, 316–330. [Google Scholar] [CrossRef]
- Liu, G.; Li, J.; Wu, D.; Xu, H. Chemical composition and source apportionment of the ambient PM2.5 in Hangzhou, China. Particuology 2015, 18, 135–143. [Google Scholar] [CrossRef]
- Wu, J.; Xu, C.; Wang, Q.; Cheng, W. Potential sources and formations of the PM2.5 pollution in urban Hangzhou. Atmosphere 2016, 7, 100. [Google Scholar] [CrossRef] [Green Version]
- Chen, K.; Metcalfe, S.E.; Yu, H.; Xu, J.; Xu, H.; Ji, D.; Wang, C.; Xiao, H.; He, J. Characteristics and source attribution of PM2.5 during 2016 G20 Summit in Hangzhou: Efficacy of radical measures to reduce source emissions. J. Environ. Sci. 2021, 106, 47–65. [Google Scholar] [CrossRef]
- Hua, Y.; Cheng, Z.; Wang, S.; Jiang, J.; Chen, D.; Cai, S.; Fu, X.; Fu, Q.; Chen, C.; Xu, B.; et al. Characteristics and source apportionment of PM2.5 during a fall heavy haze episode in the Yangtze River Delta of China. Atmos. Environ. 2015, 123, 380–391. [Google Scholar] [CrossRef]
- Jansen, R.C.; Shi, Y.; Chen, J.; Hu, Y.J.; Xu, C.; Hong, S.; Li, J.; Zhang, M. Using hourly measurements to explore the role of secondary inorganic aerosol in PM2.5 during haze and fog in Hangzhou, China. Adv. Atmos. Sci. 2014, 31, 1427–1434. [Google Scholar] [CrossRef]
- Cheng, M.C.; You, C.F.; Cao, J.; Jin, Z. Spatial and seasonal variability of water-soluble ions in PM2.5 aerosols in 14 major cities in China. Atmos. Environ. 2012, 60, 182–192. [Google Scholar] [CrossRef]
- Chang, M.; Sioutas, C.; Cassee, F.; Fokkens, P.H. Field evaluation of a mobile high-capacity particle size classifier (HCPSC) for separate collection of coarse, fine and ultrafine particles. J. Aerosol Sci. 2001, 32, 139–156. [Google Scholar] [CrossRef]
- Khezri, B.; Mo, H.; Yan, Z.; Chong, S.-L.; Heng, A.K.; Webster, R.D. Simultaneous online monitoring of inorganic compounds in aerosols and gases in an industrialized area. Atmos. Environ. 2013, 80, 352–360. [Google Scholar] [CrossRef]
- Rumsey, I.C.; Cowen, K.A.; Walker, J.T.; Kelly, T.J.; Hanft, E.A.; Mishoe, K.; Rogers, C.; Proost, R.; Beachley, G.M.; Lear, G.; et al. An assessment of the performance of the Monitor for AeRosols and GAses in ambient air (MARGA): A semi-continuous method for soluble compounds. Atmos. Chem. Phys. 2014, 14, 5639–5658. [Google Scholar] [CrossRef] [Green Version]
- Xu, L.; Chen, X.; Chen, J.; Zhang, F.; He, C.; Zhao, J.; Yin, L. Seasonal variations and chemical compositions of PM2.5 aerosol in the urban area of Fuzhou, China. Atmos. Res. 2012, 104–105, 264–272. [Google Scholar] [CrossRef]
- Wang, S.; Yu, S.; Li, P.; Wang, L.; Mehmood, K.; Liu, W.; Yan, R.; Zheng, X. A study of characteristics and origins of haze pollution in Zhengzhou, China, based on observations and hybrid receptor models. Aerosol Air Qual. Res. 2017, 17, 513–528. [Google Scholar] [CrossRef]
- Gao, X.; Yang, L.; Cheng, S.; Gao, R.; Zhou, Y.; Xue, L.; Shou, Y.; Wang, J.; Wang, X.; Nie, W.; et al. Semi-continuous measurement of water-soluble ions in PM2.5 in Jinan, China: Temporal variations and source apportionments. Atmos. Environ. 2011, 45, 6048–6056. [Google Scholar] [CrossRef]
- Abdalmogith, S.S.; Harrison, R.M. The use of trajectory cluster analysis to examine the long-range transport of secondary inorganic aerosol in the UK. Atmos. Environ. 2005, 39, 6686–6695. [Google Scholar] [CrossRef] [Green Version]
- Sun, W.; Sun, J. Daily PM2.5 concentration prediction based on principal component analysis and LSSVM optimized by cuckoo search algorithm. J. Environ. Manag. 2017, 188, 144–152. [Google Scholar] [CrossRef]
- Song, Y.; Xie, S.; Zhang, Y.; Zeng, L.; Salmon, L.G.; Zheng, M. Source apportionment of PM2.5 in Beijing using principal component analysis/absolute principal component scores and UNMIX. Sci. Total Environ. 2006, 372, 278–286. [Google Scholar] [CrossRef]
- Guo, W.; Long, C.; Zhang, Z.; Zheng, N.; Xiao, H.; Xiao, H. Seasonal control of water-soluble inorganic ions in PM2.5 from nanning, a subtropical monsoon climate city in southwestern China. Atmosphere 2020, 11, 5. [Google Scholar] [CrossRef] [Green Version]
- Xiao, K.; Wang, Y.; Wu, G.; Fu, B.; Zhu, Y. Spatiotemporal Characteristics of Air Pollutants (PM10, PM2.5, SO2, NO2, O3, and CO in the Inland Basin City of Chengdu, Southwest China. Atmosphere 2018, 9, 74. [Google Scholar] [CrossRef] [Green Version]
- Rahman, A.; Luo, C.; Khan, M.H.R.; Ke, J.; Thilakanayaka, V.; Kumar, S. Influence of atmospheric PM2.5, PM10, O3, CO, NO2, SO2, and meteorological factors on the concentration of airborne pollen in Guangzhou, China. Atmos. Environ. 2019, 212, 290–304. [Google Scholar] [CrossRef]
- Wang, S.; Yu, S.; Yan, R.; Zhang, Q.; Li, P.; Wang, L.; Liu, W.; Zheng, X. Characteristics and origins of air pollutants in Wuhan, China, based on observations and hybrid receptor models. J. Air Waste Manag. Assoc. 2017, 67, 739–753. [Google Scholar] [CrossRef] [Green Version]
- Wang, Y.; Ying, Q.; Hu, J.; Zhang, H. Spatial and temporal variations of six criteria air pollutants in 31 provincial capital cities in China during 2013–2014. Environ. Int. 2014, 73, 413–422. [Google Scholar] [CrossRef]
- He, Q.; Yan, Y.; Guo, L.; Zhang, Y.; Zhang, G.; Wang, X. Characterization and source analysis of water-soluble inorganic ionic species in PM2.5 in Taiyuan city, China. Atmos. Res. 2017, 184, 48–55. [Google Scholar] [CrossRef]
- Li, M.; Li, C.; Zhang, M. Exploring the spatial spillover effects of industrialization and urbanization factors on pollutants emissions in China’s Huang-Huai-Hai region. J. Clean. Prod. 2018, 195, 154–162. [Google Scholar] [CrossRef]
- Duan, F.; Liu, X.; Yu, T.; Cachier, H. Identification and estimate of biomass burning contribution to the urban aerosol organic carbon concentrations in Beijing. Atmos. Environ. 2004, 38, 1275–1282. [Google Scholar] [CrossRef]
- Yin, L.; Niu, Z.; Chen, X.; Chen, J.; Zhang, F.; Xu, L. Characteristics of water-soluble inorganic ions in PM2.5 and PM2.5–10 in the coastal urban agglomeration along the Western Taiwan Strait Region, China. Environ. Sci. Pollut. Res. 2014, 21, 5141–5156. [Google Scholar] [CrossRef] [PubMed]
- Zhang, T.; Cao, J.J.; Tie, X.X.; Shen, Z.X.; Liu, S.X.; Ding, H.; Han, Y.M.; Wang, G.H.; Ho, K.F.; Qiang, J.; et al. Water-soluble ions in atmospheric aerosols measured in Xi’an, China: Seasonal variations and sources. Atmos. Res. 2011, 102, 110–119. [Google Scholar] [CrossRef]
- Wu, X.; Xu, L.; Hong, Y.; Chen, J.; Qiu, Y.; Hu, B.; Hong, Z.; Zhang, Y.; Liu, T.; Chen, Y.; et al. The air pollution governed by subtropical high in a coastal city in Southeast China: Formation processes and influencing mechanisms. Sci. Total Environ. 2019, 692, 1135–1145. [Google Scholar] [CrossRef] [PubMed]
- Zhang, R.; Sun, X.; Shi, A.; Huang, Y.; Yan, J.; Nie, T.; Yan, X.; Li, X. Secondary inorganic aerosols formation during haze episodes at an urban site in Beijing, China. Atmos. Environ. 2018, 177, 275–282. [Google Scholar] [CrossRef]
- Zhang, Q.; Yan, R.; Fan, J.; Yu, S.; Yang, W.; Li, P.; Wang, S.; Chen, B.; Liu, W.; Zhang, X. A heavy haze episode in Shanghai in december of 2013: Characteristics, origins and implications. Aerosol Air Qual. Res. 2015, 15, 1881–1893. [Google Scholar] [CrossRef] [Green Version]


| City | Time | Mean Concentration (μg·m−3) | Reference | ||
|---|---|---|---|---|---|
| SO2 | NO2 | PM2.5 | |||
| Handan | 2017 | 37.2 | 51.7 | 85.7 | [14] |
| Nanning | 2017/09~2018/08 | 11 | 36 | 36 | [43] |
| Chengdu | 2016 | 16 | 43 | 65 | [44] |
| Guangzhou | 2017 | 10.11 | 52.27 | 31.59 | [45] |
| Wuhan | 2013/03~2014/02 | 32.4 | 54.9 | 89.6 | [46] |
| Zhengzhou | 2017~2018 | 20.5 | 51.6 | 70.5 | [16] |
| Xinxiang | 2017~2018 | 23.8 | 51.4 | 69.0 | [16] |
| Shanghai | 2013/03~2014/02 | 7 | 20 | 56 | [47] |
| Hangzhou | 2013/03~2014/02 | 9 | 23 | 64 | [47] |
| Hangzhou | 2017/05,08,10,12 | 7.95 | 36.49 | 56.03 | This study |
| Mean ± SD | |||||
|---|---|---|---|---|---|
| May | August | October | December | Mean | |
| Meteorological factors | |||||
| RH (%) | 70.58 ± 22.00 | 71.95 ± 17.06 | 76.82 ± 17.32 | 71.17 ± 23.34 | 72.62 ± 20.26 |
| T a (°C) | 22.73 ± 4.73 | 30.14 ± 3.76 | 18.82 ± 4.58 | 6.77 ± 4.14 | 19.62 ± 9.49 |
| WS b (m·s−1) | 1.40 ± 0.75 | 1.45 ± 0.71 | 1.36 ± 0.70 | 1.04 ± 0.64 | 1.31 ± 0.72 |
| Concentrations of gases (μg·m−3) | |||||
| SO2 | 7.70 ± 3.37 | 4.59 ± 1.58 | 6.98 ± 3.37 | 12.57 ±5.37 | 7.95 ± 4.67 |
| NO2 | 39.55 ± 17.99 | 20.23 ± 10.38 | 36.13 ± 15.96 | 50.20 ± 17.35 | 36.49 ± 19.02 |
| Concentrations of PM2.5 and WSIIs (μg·m−3) | |||||
| PM2.5 | 58.39 ± 26.00 | 26.30 ± 13.55 | 47.26 ± 26.05 | 89.35 ± 40.21 | 56.03 ± 36.35 |
| Cl− | 0.68 ± 0.69 | 0.32 ± 0.21 | 0.98 ± 0.60 | 2.65 ± 1.43 | 1.07 ± 1.33 |
| NO3− | 8.38 ± 6.93 | 2.12 ± 1.92 | 10.26 ± 8.44 | 20.62 ± 12.15 | 9.86 ± 10.75 |
| SO42− | 9.22 ± 3.94 | 5.48 ± 3.98 | 7.35 ± 5.05 | 9.36 ± 5.93 | 7.57 ± 4.99 |
| NH4+ | 5.80 ± 3.10 | 2.76 ± 1.85 | 5.54 ± 4.18 | 10.50 ± 6.43 | 5.86 ± 4.91 |
| Na+ | 0.19 ± 0.11 | 0.17 ± 0.10 | 0.23 ± 0.16 | 0.37 ± 0.18 | 0.23 ± 0.16 |
| K+ | 0.75 ± 0.61 | 0.23 ± 0.11 | 0.40 ± 0.24 | 0.94 ± 0.54 | 0.45 ± 0.47 |
| Ca2+ | 0.32 ± 0.35 | 0.16 ± 0.08 | 0.19 ± 0.17 | 0.61 ± 0.47 | 0.27 ± 0.30 |
| Mg2+ | 0.06 ± 0.04 | 0.05 ± 0.03 | 0.08 ± 0.04 | 0.09 ± 0.08 | 0.08 ± 0.10 |
| Calculations | |||||
| Sum c (μg·m−3) | 25.40 ± 13.10 | 11.10 ± 6.91 | 24.88 ± 17.23 | 44.78 ± 24.75 | 26.49 ± 20.78 |
| Percentage d (%) | 47.48 ± 16.62 | 43.37 ± 16.01 | 51.85 ± 14.10 | 49.62 ± 13.54 | 48.28 ± 15.33 |
| Seasons | Cluster | Percents | Mean Concentration (μg·m−3) | Main Area Passed by Air Masses | ||||
|---|---|---|---|---|---|---|---|---|
| PM2.5 | SNA | NO3− | SO42− | NH4+ | ||||
| May | 1 | 9.70% | 65.17 ± 19.92 | 22.24 ± 4.81 | 5.49 ± 1.77 | 11.03 ± 2.62 | 5.72 ± 1.26 | Zhejiang province |
| 2 | 41.08% | 53.91 ± 23.39 | 22.23 ± 10.62 | 8.63 ± 3.40 | 8.11 ± 5.60 | 5.49 ± 2.68 | East China Sea, Zhejiang province | |
| 3 | 35.46% | 64.65 ± 31.06 | 29.43 ± 16.68 | 11.85 ± 6.98 | 10.35 ± 7.79 | 7.23 ± 4.07 | Shandong, Jiangsu provinces | |
| 4 | 13.71% | 57.75 ± 23.21 | 18.77 ± 8.55 | 4.28 ± 1.53 | 9.78 ± 3.92 | 4.71 ± 2.22 | Hubei, Jiangxi provinces | |
| August | 1 | 24.53% | 39.27 ± 12.69 | 19.16 ± 9.32 | 4.87 ± 1.58 | 9.21 ± 4.12 | 5.08 ± 2.44 | Jiangxi, Anhui provinces |
| 2 | 23.13% | 32.74 ± 10.47 | 17.11 ± 4.62 | 5.64 ± 3.02 | 7.18 ± 2.77 | 4.29 ± 1.18 | Yellow Sea | |
| 3 | 19.76% | 34.28 ± 7.63 | 9.96 ± 5.48 | 2.59 ± 0.96 | 4.72 ± 4.26 | 2.65 ± 1.52 | South China Sea | |
| 4 | 32.56% | 30.96 ± 13.73 | 9.59 ± 6.36 | 2.64 ± 1.18 | 4.37 ± 3.14 | 2.58 ± 1.81 | South China Sea; Guangdong, Fujian provinces | |
| October | 1 | 50.30% | 44.85 ± 19.62 | 23.93 ± 15.73 | 10.84 ± 6.00 | 7.38 ± 3.82 | 5.71 ± 3.43 | Liaoning, Jiangsu Provinces; Yellow Sea |
| 2 | 11.77% | 75.33 ± 30.61 | 35.22 ± 21.51 | 17.80 ± 9.32 | 8.96 ± 8.05 | 8.46 ± 5.53 | Henan, Anhui provinces | |
| 3 | 31.04% | 55.96 ± 23.76 | 27.01 ± 13.80 | 13.01 ± 7.97 | 7.34 ± 4.76 | 6.66 ± 3.87 | Bohai Sea, Yellow Sea | |
| 4 | 6.91% | 82.44 ± 31.70 | 29.71 ± 16.34 | 13.47 ± 8.45 | 8.76 ± 4.75 | 7.48 ± 4.18 | Zhejiang province | |
| December | 1 | 36.32% | 78.42 ± 25.12 | 36.02 ± 10.30 | 17.71 ± 5.82 | 8.73 ± 2.32 | 9.58 ± 2.59 | Inner Mongolia region, Hebei, Shandong provinces |
| 2 | 17.71% | 81.00 ± 31.26 | 45.16 ± 27.86 | 22.16 ± 14.03 | 11.22 ± 6.97 | 11.78 ± 7.59 | Jiangsu province | |
| 3 | 46.02% | 100.14 ± 43.05 | 41.02 ± 10.46 | 21.50 ± 6.00 | 9.10 ± 2.48 | 10.42 ± 2.98 | Shanxi, Henan, Anhui provinces | |
| Season | May | August | October | December | ||||||
|---|---|---|---|---|---|---|---|---|---|---|
| Component | Component | Component | Component | |||||||
| 1 | 2 | 1 | 2 | 3 | 1 | 2 | 3 | 1 | 2 | |
| NO3− | 0.88 | −0.01 | 0.86 | −0.08 | −0.18 | 0.93 | −0.14 | −0.18 | 0.90 | −0.23 |
| SO42− | 0.65 | −0.30 | 0.92 | −0.08 | 0.01 | 0.79 | −0.45 | 0.07 | 0.82 | −0.45 |
| NH4+ | 0.92 | −0.13 | 0.98 | −0.11 | −0.05 | 0.95 | −0.25 | −0.12 | 0.91 | −0.37 |
| Cl− | 0.20 | −0.04 | −0.11 | −0.66 | 0.25 | 0.71 | 0.31 | −0.18 | 0.65 | 0.16 |
| K+ | 0.69 | 0.38 | 0.82 | 0.07 | 0.24 | 0.04 | −0.48 | 0.77 | 0.57 | 0.60 |
| Na+ | 0.55 | 0.59 | 0.07 | 0.69 | −0.32 | 0.30 | 0.71 | 0.30 | 0.72 | 0.48 |
| Ca2+ | −0.32 | 0.68 | 0.04 | 0.36 | 0.89 | 0.29 | 0.14 | 0.50 | 0.05 | 0.83 |
| Mg2+ | −0.05 | 0.69 | 0.13 | 0.48 | 0.05 | 0.45 | 0.59 | 0.20 | 0.21 | 0.40 |
| variance (%) | 37.17 | 19.38 | 40.83 | 16.25 | 13.06 | 41.05 | 18.59 | 11.36 | 45.56 | 23.75 |
| Cumulative (%) | 37.17 | 56.55 | 40.83 | 57.08 | 70.14 | 41.05 | 59.64 | 71.00 | 45.56 | 69.31 |
Publisher’s Note: MDPI stays neutral with regard to jurisdictional claims in published maps and institutional affiliations. |
© 2021 by the authors. Licensee MDPI, Basel, Switzerland. This article is an open access article distributed under the terms and conditions of the Creative Commons Attribution (CC BY) license (https://creativecommons.org/licenses/by/4.0/).
Share and Cite
Xiong, C.; Yu, S.; Chen, X.; Li, Z.; Zhang, Y.; Li, M.; Liu, W.; Li, P.; Seinfeld, J.H. Dominant Contributions of Secondary Aerosols and Vehicle Emissions to Water-Soluble Inorganic Ions of PM2.5 in an Urban Site in the Metropolitan Hangzhou, China. Atmosphere 2021, 12, 1529. https://0-doi-org.brum.beds.ac.uk/10.3390/atmos12111529
Xiong C, Yu S, Chen X, Li Z, Zhang Y, Li M, Liu W, Li P, Seinfeld JH. Dominant Contributions of Secondary Aerosols and Vehicle Emissions to Water-Soluble Inorganic Ions of PM2.5 in an Urban Site in the Metropolitan Hangzhou, China. Atmosphere. 2021; 12(11):1529. https://0-doi-org.brum.beds.ac.uk/10.3390/atmos12111529
Chicago/Turabian StyleXiong, Chun, Shaocai Yu, Xue Chen, Zhen Li, Yibo Zhang, Mengying Li, Weiping Liu, Pengfei Li, and John H. Seinfeld. 2021. "Dominant Contributions of Secondary Aerosols and Vehicle Emissions to Water-Soluble Inorganic Ions of PM2.5 in an Urban Site in the Metropolitan Hangzhou, China" Atmosphere 12, no. 11: 1529. https://0-doi-org.brum.beds.ac.uk/10.3390/atmos12111529