
Review of IAQ in Premises Equipped with Façade–Ventilation Systems


Department of Building Physics and Renewable Energy, Faculty of Environmental, Geomatic and Energy Engineering, Kielce University of Technology, 25-314 Kielce, Poland
Atmosphere 2021, 12(2), 220; https://0-doi-org.brum.beds.ac.uk/10.3390/atmos12020220
Submission received: 16 December 2020
/
Revised: 19 January 2021
/
Accepted: 2 February 2021
/
Published: 5 February 2021
(This article belongs to the Special Issue Indoor Air Quality—What Is Known and What Needs to Be Done)
Abstract
:Poor indoor air quality affects the health of the occupants of a given structure or building. It reduces the effectiveness of learning and work efficiency. Among many pollutants, PM 2.5 and 10 dusts are extremely important. They can be eliminated using mechanical ventilation equipped with filters. Façade ventilation devices are used as a way to improve indoor air quality (IAQ) in existing buildings. For their analysis, researchers used carbon dioxide as a tracer gas. They have shown that façade ventilation devices are an effective way to improve IAQ, but require further analysis due to the sensitivity of façade ventilation devices to the effects of wind and outdoor temperature. In addition, legal regulations in some countries require verification in order to enable the use of this type of solution as a way to improve IAQ in an era characterised by the effort to transform buildings into passive houses (standard for energy efficiency in a building).
1. Introduction
The condition of indoor air is primarily its composition. Indoor air is a mixture of dry air and water vapour. Acceptable indoor air quality, in accordance with the American Society of Heating, Refrigerating and Air-Conditioning Engineers (ASHRAE) standard [1], is defined as air in which there are no known pollutants in concentrations considered by the regulations to be harmful, and in which the vast majority of occupants (80% and more) express no dissatisfaction with thermal comfort, noise and vibrations, or with lighting.
The importance of air quality for health varies drastically depending on the level of development of a country. In developing countries, air pollution contributes to 3.7% of the disease burden, while in developed countries, the same factor is not listed among the top 10 pathogens [2,3]. According to the report of the World Health Organization (WHO) [4], 3.8 million deaths worldwide in 2016 were the result of air pollution. In low- and middle-income countries, it is responsible for 10% of all deaths, and for 0.2% of the death in low-income countries. In China alone, the number of deaths as a result of poor air condition was 111,000, and the number of emergency room visits was 4.3 million [5]. Among the threats necessitating the immediate hospitalisation of 37.9–52.2% of the population in China are: Lung diseases, cardiovascular diseases, cancer, or asthma resulting from the accumulation of toxic pollutants, harmful gases, metals, hydrocarbons, etc. [6]. The main sources of pollution are those in the outside air, coming from the industry, power plants, and motor vehicles, but also resulting from the poor quality of the fuels burned (wood, coal, kerosene, etc.) [7]. The increase in mortality is also indicated by the other authors [8], who cite gases produced by cars as the cause of a large number of deaths. How building occupants experience air quality depends on their physical condition and age [9], as well as their gender. It is women who more often than men assess the air quality as bad [10,11].
Poor air quality affects not only health [12], but also work efficiency, reducing it, and increasing the frequency of absenteeism [13,14,15,16,17,18,19,20]. In the case of schools, it lowers learning efficiency, as described in the literature [21,22]. The obvious issue is the investment costs that must be borne to improve the indoor air quality. However, the costs to the employer of the absence of the employee are about 4 to 40 times higher than the costs of installing a ventilation system. In the article [23], Sowa states that simple payback time (SBPT) for ventilation devices used to improve air quality is 1–3 years, which is really not much.
Indoor air is a mixture which is subject to dynamic qualitative and quantitative changes. According to the literature [24], in order to correctly assess the IAQ, it is first necessary to know and characterise the sources of pollutant emissions by determining the total content of pollutants (e.g., volatile organic compounds) in the material which is a potential source of emissions—then to specify the size of the pollutant emission stream from this source and to determine the chemical and physical interaction of air pollutants. When assessing the indoor microclimate, it is important to define the air exchange conditions, i.e., the amount of air and the manner in which it flows (infiltration/mechanical ventilation), as well as the condition of the air supplied from outside (potential sources of pollution in the nearest surroundings of the building). For the assessment of IAQ, the tightness of the building envelope and its permeability to pollutants are also important. Only after the IAQ has been correctly determined should a solution be sought to change its condition.
Many scientists have conducted IAQ analyses. The article collects the results of their research and prepares recommendations for further research. Those recommendations have not yet been defined in detail in the literature. The research gap in the field of IAQ improvement was searched. The aim of the article was to find the direction for further research on façade ventilation, which has not been sufficiently researched so far, while it is a solution that can be used on a very large scale in the future.
2. Contaminants
2.1. House Hold Dust Mites
The house dust mites are a threat mainly in residential premises, but is also present in the work environment [25]. For example, in agriculture, in granaries where workers come into contact with grain and thus with grain weevil, dust mites can cause asthma and skin diseases. In the workplace, it is possible to protect the body by using protective clothing and special equipment, but doing so is impossible in residential buildings. The indoor environment encourages the multiplication of mites. At a temperature of 25 °C and humidity associated with the occurrence of mould, i.e., between 74% and 80%, an increase in house dust mite colonies is observed. The best way to fight mites is by means of a ventilation system for the supply and the exhaust of air.
2.2. Fungi and Moulds
In the interior environment, the fragments of fungi and moulds released from the surfaces on which they have developed cannot be ignored. According to the analysis carried out by Górny [26], they are biologically significantly harmful due to immunological reactivity, cytotoxicity, and mycotoxin transport.
2.3. Humidity
In the current effort to seal the building envelope, it is necessary to control the humidity of the air. According to the literature [27], the weekly amount of water vapour in a room approaches 100 kg. The relative humidity of air influences on the abundance of allergens, pathogens, and noxious chemicals [28], therefore it is very important to control this parameter. Maintaining the air humidity in the premises at a more or less constant level requires intensive removal of water vapour to the outside [29]. At the same time, the share in the moisture balance of the amount of water vapour contained in the air, permeating through partitions by diffusion, determined on the basis of EN 13788 [30], is within 1–3% of the total emission of water vapour [31].
The analyses carried out so far have shown an increase in indoor air humidity in buildings subject to thermal modernisation (Figure 1). This means that investors, while focusing on improving one parameter, take actions affecting other conditions of the internal environment. This clearly indicates the need for a global view of the building as a whole, which is to say, of the structure of the building itself together with its technical equipment, in the event of any changes to the building [32].
Indoor air humidity increased in the premises with insulated partitions without additional ventilation openings, which confirms insufficient air exchange. The analysis showed that higher values of the parameter were achieved in the premises where the only source of moisture was human bodies. Hence, it can be concluded that the increase in humidity is not the result of using the premises equipment (e.g., of cooking). This conclusion is also confirmed by mould fungi that did not occur in the kitchen, bathroom, or social rooms. In buildings where, apart from building insulation, a change in the method of air supply to the building was introduced, the air humidity remained at the same level.
2.4. Carbon Monoxide
A very important source of carbon monoxide (CO) is the burning of natural gas in other than optimal conditions. Not present in natural gas, carbon monoxide is a deadly poisonous by-product of the burning of natural gas in an environment where the fuel to oxygen ratio is imbalanced, for example, in inadequately ventilated spaces. Another significant potential source of carbon monoxide is garages adjoined to apartments.
Carbon monoxide builds up gradually in the body. Its molecule binds with haemoglobin to form a carboxyhaemoglobin called HbCO. HbCO decay occurs as a half-life disintegration, similarly to radioactive isotopes. The half-life of carbon monoxide is about 4 h. If exposure to carbon monoxide occurs during the day, peak blood levels will be observed at bedtime. During an 8-h sleep, the concentration would drop to about a quarter of the maximum concentration. In case of no further exposure to the source, the concentration would have fallen to 1% of the maximum value after one day. Regular exposure to even small levels of the carbon monoxide will cause it to build up significantly in the body. The long-term exposure to sub-lethal concentrations may cause influenza-like symptoms [33]. When using devices with an open gas flow, e.g., a gas heater for heating water, gas cooker, etc., it is most important to ensure an adequate air supply. Contemporary thermal modernisation programs devote considerable attention to the assessment of the carbon monoxide risk. However, according to [34], increases in CO concentrations are episodic and short-lived, and the values before and after modernisation are comparable. The most appropriate change that should be introduced in buildings is to change the heating sources and the cookers for the preparation of meals. The values of the carbon monoxide concentration measured by scientists [35] in classrooms ranged from 0.2 to 0.9 ppm. However, in flats equipped with cookers that burn kerosene and solid materials such as coal and wood, the carbon monoxide concentration ranged from 4.32 to 4.82 ppm [36].
2.5. Carbon Dioxide
The combustion of a natural gas produces carbon dioxide (CO2) and water vapour in addition to carbon monoxide. Moreover, carbon dioxide is a product of the respiration process. It occurs naturally in the outside air in a concentration of approximately 0.03%. It is worth noting that there are also other natural sources of carbon dioxide, for example, when acidic groundwater flows through layers of limestone. It is also a component of landfill gas. It is a toxic gas and exposure to concentrations above 6% is lethal. In commercial and industrial buildings, the short-term concentration of carbon dioxide (20 min) should be a maximum of 1.5% and the exposure limit in the workplace set as an 8-h average is 0.5% [25]. Such concentrations are rarely observed in residential and public buildings. Generally, the limit is 700 ppm (0.07%) above the external CO2 concentration [1]. If the apartments are well-ventilated, the concentration of carbon dioxide will not be exceeded, although it will change significantly with time due to the fact that it is influenced by a number of changing factors [37]. These include internal factors, e.g., metabolism, combustion, and ventilation systems and external factors. The latter, in turn, depend on the environmental conditions and the interaction of the building and the external environment. In most cases, carbon dioxide is correlated with other air pollutants, therefore it is often used to regulate the efficiency of ventilation systems [38]. However, it cannot be regarded as an irrefutable indicator of air quality [39,40] since its relationship to some pollutants is too weak. Moreover, the condition of the internal environment is also determined by thermal, acoustic, and illumination comfort. Nevertheless, too high a concentration of CO2 can have a negative impact on health (headache, dizziness, nausea, fatigue). Therefore, its dilution is an important element to improve IAQ, and it is possible when using efficient ventilation [41,42,43,44].
2.6. Nitrogen Oxides
Nitrogen oxides (NOx) are another pollutant that may appear in the air during combustion. Studies on the presence of nitrogen oxides in rooms have shown the dependence of the distance between buildings and the road and of the traffic intensity [45,46]. However, the main source of NOx is combustion of fuels inside buildings, and smoking. Their formation is not related to an insufficient amount of oxygen for combustion, but results from a secondary chemical reaction in which oxygen combines with nitrogen to form a product mixture consisting primarily of dioxide nitrogen and trioxide nitrogen (NO2 and NO3). The combustion is a majority source of nitrogen oxides, which is confirmed by the discrepancy in the concentration of pollutants between summer and winter [47,48,49,50]. During the heating season, a higher content of NOx was observed. The release of nitrogen oxides during heating or food preparation may cause co-pollution, e.g., a secondary reaction of nitric acid formation. Since nitric acid is formed during the reaction of NO2 with water, this means that if it is inhaled, the reaction will take place in the respiratory system. The reaction of producing NOx is endothermic and depends on the actual combustion conditions, which in practice translates into the design of the burner. It does not depend on the nitrogen content in the combustion gas, but on the content in the ambient air. The role of such co-pollutants is unknow. However, the reduction of NOx, e.g., by improving the air exchange, will also have a positive effect on reducing the correlation. According to WHO [51], candles and mosquito lamps can also be sources of nitrogen dioxide.
2.7. Volatile Organic Compounds
Volatile organic compounds (VOCs), as defined by WHO, are a group of compounds with a vapour pressure at 25 °C greater than 10−1 Tr−1. The melting point of VOCs is lower than room temperature, and the boiling point is in the range of 50 ÷ 260 °C (Table 1). In indoor air, they come from emissions, from building and finishing materials, including carpets, paints, adhesives, wall coverings such as wallpaper, floor coverings, and interior fittings such as photocopiers; from emissions from external sources (especially from motor vehicles); from burning fuel and tobacco smoke; they can be metabolic by-products (from humans, plants, animals, and fungi); and they can also come from the vital activity of a human, i.e., cooking, cleaning, and hobbies [52]. Sometimes they can emanate from landfills. In general, both the concentrations and the variability of exposure time to VOCs are higher indoors than outdoors [53].
It should be noted that VOC emission is not constant over all periods of time. For example, construction materials reach their peak emissions immediately after construction, after which time the emissions gradually diminish. The intensity of ventilation also affects the rate of emission decay. Low ventilation flows will cause the emission to persist for a longer period of time.
In addition to the emission itself, the possibility of VOC absorption and desorption (similar to water vapour) in materials such as wallpaper, soft furniture, etc. should be taken into account. The rate of sorption and desorption depends on the finishing material, the compound in question and environmental parameters such as temperature and relative humidity, as well as ventilation efficiency.
Some VOCs can be present in concentrations that cause unpleasant odours. At high concentrations, unpleasant odours may be responsible for breathing disorders and vomiting. The intensity of the fragrance mixture will be lower than the sum of the individual fragrance intensities of the individual components.
In industrial premises, it is easy to determine whether VOCs will have a negative effect on health as their concentrations are high. In residential buildings, the concentrations will be much lower than the limit values, at which negative health effects are noticeable. However, health effects may be seen due to the combination of VOCs present at low concentrations. Sneezing, coughing, and conjunctivitis may occur, and in extreme cases, skin swelling, rash, and breathing problems are observed. Table 2 shows the degree of harmfulness and the total concentration of total volatile organic compounds (TVOC) in indoor air.
2.8. Formaldehyde
Formaldehyde is the simplest aldehyde and is treated separately from VOC due to some differences. It is colourless, highly chemically reactive, and highly flammable. It has an extremely pungent smell. In the industry, it has many uses, e.g., as a preservative and as a sterilising agent.
Airborne formaldehyde breaks down into carbon monoxide and formic acid. The level of formaldehyde concentration depends on the geographical location, e.g., in villages it is only 0.2 ppb, and in cities with high traffic it is as high as 20 ppb. It can not only be inhaled, but also absorbed through the skin. Once absorbed by the body, it is easily broken down into format (which is removed in the urine) or carbon dioxide (which is removed by breathing). Some by-products are used in building tissues.
Direct contact with formaldehyde causes symptoms including eye, nose, and throat irritation. The skin is irritated by contact with a strong formaldehyde solution. Animal studies indicate that the prolonged exposure to formaldehyde concentrations in the air above 6 ppm causes cancer of the epithelium of the nose (or, the nose). Humans cannot tolerate these concentrations due to the intense irritation. The US Environmental Protection Agency (EPA) has stated, on the available evidence, that formaldehyde is likely to be a human carcinogen substance.
2.9. Radon
All soils and rocks contain the radioactive elements of uranium and radium. The by-product of their decay is radon, another air pollutant. Typically, the uranium content in soils and rocks is around 3 ppm. However, in some locations, especially where the soil is on granite or shale, concentrations as high as 10 ppm can be observed. Sometimes sandstone and limestone deposits can also be of a similar condition.
Radon is odourless and colourless. The gas penetrates through porous soil layers and is then emitted at the earth’s surface. Radon concentration in the external environment is not a threat, a fairly common level of radioactivity is 20 Bq/m3 [25]. However, when it penetrates into a closed space, e.g., a building, where it cannot be dispersed, the concentration constantly increases.
In a building, a so-called draft that sucks radon up through floors and, for example, through pipe penetrations may exist. Typically, the building envelope is a barrier to prevent radon from entering the room, but some building materials contain radioactive isotopes. Hence, radon will be released into the interior (unless the interior surfaces are cleaned). For example, in Hong Kong, where there is no access to large amounts of limestone-based materials (for the production of concrete and cement), a major problem with high radon concentrations is observed. If the facilities are tight and the ventilation is insufficient, radon poses a threat to the life of residents, especially when the users are smokers [56]. Research conducted in schools [57] confirmed that radon migrates through soil and porous materials by diffusion into the interior of buildings. The radon concentration values showed a dependence on the level of the storey.
Radon is a gas and can be inhaled as such, but there is another way it enters the human body. Since it is radioactive, it decays into a wide range of radioactive decay products, including polonium. The decay products are more often solid than gaseous and attach to airborne dust particles. If such dust particles are inhaled, they accumulate in the upper respiratory tract during normal breathing. Radioactive decay continues in the body and the lung tissue is irradiated. The consequence of exposure to radioactive material is the increased risk of cancer. In the case of radon, it is an increased risk of lung cancer [58].
Tobacco smoking and the effects of radon enhance each other’s effects on the risk of cancer. Their combined risk is greater than the sum of both effects. For heavy smokers, the risk of developing cancer from radon exposure may be up to six times greater than that of non-smokers [25].
2.10. Landfill Gas
The next air pollutant is landfill gas, which is a mixture of gases emitted from landfills as a result of the decomposition of organic waste. The biodegradation process is complex, and the rate of gas production and its quantity depend on the age of the landfill, the nature of the waste deposited, and the moisture content. The waste decomposition consists of two stages. The earlier is aerobic decomposition, where the microbes in the landfill use the oxygen trapped in the deposited waste. After all the oxygen has been used, biodegradation goes to the second stage, the anaerobic, which produces methane.
Methane is a colourless and odourless gas. It has suffocating properties since it displaces oxygen from its admixture with air. At a volume concentration of 5–15%, it forms an explosive mixture with air. Below 5%, there is not enough methane to support combustion, above 15%, there is not enough oxygen to support combustion. Hence, the values of 5 and 15% are defined as the lower and upper explosive limits.
2.11. Particulate Matter
Apart from gaseous pollutants in the air, PM 2.5 and 10 dusts are also observed, the main source of which is the air flowing in from outside [59,60]. Their concentrations in indoor air often exceed the permissible values [61]. The PM 2.5 pollutants from the air surrounding a building vary depending on the location of the building. In less industrialised areas, the risk they present to health is much lower [62]. The research carried out by scientists [63] in 179 locations showed an inflow of particulate matters along with the outside air. In this case, the quality of the window joinery is important. When the window joinery is sealed, the amount of particulate matters incoming is reduced.
Particulate matters show seasonal variability [63,64]. The concentrations of PM 2.5 and 10 are higher in winter than in summer. According to the research results [a], the percentage of values higher than the established norm occurred during autumn (68%) and winter (72%), while in summer 99% of the measurements were within the standards. The source of these pollutants is the combustion process. Short-term exposure to high concentrations of dust in the inhaled air increases the risk of morbidity [65]. Due to the observed high concentration of particulate matter in the air, the monitoring of PM 2.5, which is currently implemented in 15 European countries [66], is extremely important.
3. Improving the Indoor Air Quality
A too low exchange of air causes an increase in both the air humidity and the carbon dioxide concentration [67]. However, increasing the amount of air in naturally-ventilated facilities is not an ideal solution, as it carries the risk of lowering the internal temperature [68].
Figure 2 presents the course of changes in the relative humidity, temperature, and concentration of carbon dioxide of the indoor air from the moment students enter the classroom until they leave it. You can clearly see the improvement in air quality and the lowering of the air temperature at the same time. Students in the classroom, sitting in desks near the window, assessed the microenvironment as too cool.
Some people use plants as a way to improve air quality to reduce pollution. Potted plants can be a means of removing chemical fumes from indoor air. The results of research and analyses [69,70] suggest that their greatest effectiveness is manifested in the removal of VOCs in energy-saving and non-ventilated facilities. Scientists document the ability of plants to remove benzene, toluene, octane, and trichlorethylene in particular [71], as well as formaldehyde [72]. However, it should be noted that plants can also be a source of pollution. Placed in plastic pots, they can be a potential source of contamination. Soil with microbes and pesticides can also pose a threat to air quality. According to an analysis conducted by scientists [73], the impact of plants on controlling air quality is actually small. The author states that the required area for green cultivation would be several square meters per person, if we were to balance the work of ventilation. In addition, plants are characterised by a high sensitivity to diseases and pests. Plants, apart from lowering the temperature, increase the humidity in the air, and moulds often appear in potting soil.
The technical equipment for the dilution of pollutants is the ventilation system. Observations presented in the literature [74] showed that the correlation between air leakage through leaks and the pressure difference is the key to understanding the interaction between the building envelope and HVAC systems (heating, ventilation, and air conditioning). Structures that are designed and built safely ensure that the pressure field is controlled, which in turn ensures that the finished buildings are healthy, durable, comfortable, and economical.
It is purposeful to reduce the energy consumption for air exchange in the premises. The solution that combines energy efficiency with an appropriate IAQ and thermal comfort is hybrid ventilation. When it is equipped with automatic regulation with soft-sensors [75], successfully this fulfils its task. In the literature [76], an analysis of indoor air quality was carried out using natural and mechanical ventilation, taking into account energy consumption. The conducted analysis showed that the presence of gaseous pollutants CO2, HCHO, O3, and NO3 does not depend on the ventilation system used. The amount of energy used to heat the air was lower with natural ventilation. In terms of the PM 2.5 dust pollution, the influence of both the type of ventilation system used and the location was observed. Moreover, the higher filtration efficiency significantly reduced the PM 2.5 concentration. The outside air pollution in months with moderate temperatures was higher than in periods of hot and cold temperatures. In the analysed climate model, there was often a need to use a hybrid air recirculation system in combination with natural ventilation in order to maintain comfortable conditions. However, in this case, the effect of filtration was never sufficient compared to mechanical ventilation. The final conclusion from the above-mentioned study is the legitimacy of using natural ventilation from the point of view of energy consumption of systems for air heating and sufficient filtration of gaseous pollutants. However, natural ventilation is insufficient with respect to PM 2.5 dust. Due to the significance of the exposure of the body to the impact of dust on health, it is extremely important to have good filtration of the incoming air, which can be obtained using mechanical ventilation. The confirmation of this thesis was obtained by means of a scientific analysis conducted in urban and rural kindergartens in the area of Silesia [77]. The authors observed an influx of atmospheric pollutants. Only those buildings featuring gas and/or coal stoves had an internal source of pollution. Due to the long stay of children in such facilities, scientists recommend implementing an air quality control strategy. On the other hand, in newly established facilities, they recommend the use of mechanical ventilation equipped with air purification systems.
Research on the harmfulness of air pollutants is of interest to many scientists. C. Arden Pope et al. [78] described the risk of respiratory diseases and cardio-pulmonary mortality due to inhalation of polluted air. In addition to describing the relationship between external pollution and diseases of people staying indoors, Badyda et al. [79,80] described the relationship between road traffic and the amount and type of harmful substances contained in indoor air, such as NO2, PM 10, or CO. They showed that in cities with heavy traffic, and thus with more gases from internal combustion engines in the outside air, the percentage of people with lung and bronchial diseases is higher.
An analysis conducted by scientists [81] showed the enormous health costs of people exposed to ozone and particulate matter. The study involved office buildings with natural ventilation to eliminate the sick building syndrome (SBS). The estimated costs of fighting the symptoms of the syndrome turned out to be lower than the costs of improving the health of people exposed to ozone and particulate matter in naturally-ventilated facilities. Scientists have noticed that the effects of the above-mentioned pollutants in naturally ventilated facilities can be reduced by closing the windows during periods when pollution levels exceed the permissible exposure limits by 10% or more. However, this would require mechanical ventilation to maintain comfort.
Scientists [82] analysed natural ventilation in office buildings as a solution to reduce energy consumption. The conclusion from their analysis is, sufficient air exchange in buildings equals 1 ÷ 6 h−1, provided that the buildings have high heat gains and these are buildings whose architecture has been designed with the awareness of the relationship between the type of building, its shape and location, with the efficiency of its natural ventilation.
The vast majority of facilities in the world are naturally–ventilated. At the same time, newly erected buildings are airtight and therefore require mechanical ventilation. Actions leading to the improvement of indoor air quality are to ensure minimisation of energy costs. This means that the air exchange in buildings cannot be too low or too high. For this reason, it is important for indoor air quality to take into account infiltration and its impact on both ventilation efficiency and energy consumption. The calculation of the infiltration efficiency largely depends on the airtightness of the building. In specific cases, the tightness of the structure is known, but in general terms, the default value should be assumed. The value that was considered reasonable is 0.3 [83,84]. Such an assumption leads to the underestimation of the ventilation efficiency for very leaky buildings, which is, however, acceptable due to erring on the safe side, i.e., the understatement of the share of infiltration in the dilution of pollutants. Similarly, for very tight objects, adopting such a value will overestimate the influence of infiltration, but here also the error is not very important, since infiltration contributes little to the total air exchange.
The distribution of pollutants in the indoor air is also influenced by the fact that movement occurs, e.g., people move about the premises or doors are opened and closed. The analysis in the hospital building was performed by Mazumdar S. et al. [85] comparing mixing and displacement ventilation. Scientists noticed variations of 10 to 90 s in the distribution of pollutants as people moved around and the pollutants following them. The average change in the concentration of pollutants resulting from the movement of the objects was within 25% for all the tested cases and was greater the closer the moving object was to the source of pollution. The authors showed that in premises with objects in motion, the use of displacement ventilation with an air exchange of 4/h will allow the same conditions to be obtained in the room as obtained with the use of a mixing ventilation system featuring an air exchange of 6/h. At the same time, the distribution of pollutant concentration using the displacement ventilation was not homogeneous. The concentration was higher near the source of the pollutants, therefore the risk of pollutant transfer in this case was greater than for the mixing ventilation.
Poor indoor air quality causes symptoms of SBS. In the literature [86], the authors analysed the influence of the ventilation system efficiency on the symptoms of the sick building syndrome. The average frequency of symptoms increased by 23% with a decrease in ventilation efficiency from 36 to 18 m3/h∙person and decreased by approximately 29% with an increase in the air stream from 36 to 90 m3/h∙person. Moreover, scientists [87,88] showed a relationship between the incidence of the sick building syndrome and gender. Regardless of the type of work performed and environmental factors, women were more likely to report ailments.
Poor indoor air quality translates into disease frequency and the efficiency of work and learning [89,90,91]. Scientists are interested in analysing the relationship between the efficiency of ventilation systems and the efficiency of learning. An example is Johnson et al. [92], whose research showed the air quality disturbances in primary schools. In many facilities, the amount of fresh air was insufficient. The dependence of work efficiency on the assessment of thermal comfort in premises and the amount of fresh air per person is shown in Figure 3 and Figure 4.
Other scientists also wrote about poor air quality in educational facilities [94]. They showed insufficient dilution of carbon dioxide and carbon monoxide, and in the conducted survey, they noticed symptoms of disease in students. Vimalanathan and Babu [95] showed that the temperature is the main factor affecting work efficiency, with 21 °C considered optimal. The authors also pay attention to illumination as an important element of the internal environment.
A way to improve the air quality in premises may be opening the windows, provided that the building is not located in an area with high external air pollution (e.g., an industrial area or roads with heavy traffic). Opening windows to exchange air, a method used by residents in dormitories, does not uncomfortably chill the crowded premises even when the outside air temperature is −9 °C, and it significantly reduces the concentration of carbon dioxide. However, in the case of a cubature of 6.5 m3 per student, it is not possible to provide thermal comfort by opening the windows [1].
Indoor air quality also means acoustic comfort. Acoustic waves are airborne vibrations. They are characterised by a frequency expressed in Hz and sound intensity in dB. Noise sources can be related to human behaviour, noise from motor engines, noise from buildings, construction noise, operating noise, and noise generated by social gatherings. Among these sources, in a residential environment, traffic has the largest share. It was found [96,97] that noise induces stressful reactions in exposed persons and may lead to serious physical, psychological, and social damage (it can be harmful both to the hearing organ and the whole human body). With natural ventilation, noise may be generated when air flows through leaks at high wind speeds. In mechanical ventilation and air-conditioning systems, it is related to the flow of air in the ducts and end elements of the installation. Most often it results from design or installation errors. The literature [98] presents an analysis of the impact of HVAC installations and air flow on the noise level in premises. Tests carried out in classrooms showed that in the event that the amount of ventilation air was sufficient, the permissible noise level in the rooms was exceeded. On the other hand, in premises where the sound level was appropriate, the air flow rates were too low. The main sources of noise were excessive turbulence at the inlet to the supply air elements, incorrect settings of the diffusers, and too-high air flow velocity. In the United States, 9 million people are exposed to sounds above 85 dB, and 10 million people have a hearing loss of 25 dB or more due to noise. In Europe, more than 28% of all workers are exposed to noise levels of 85–90 dB. An estimated 120 to 250 million people worldwide suffer from some degree of hearing loss, and noise in the workplace is an important risk factor for hearing loss among workers (16% on average) worldwide [99].
In his study, Połednik [100] described the influence of electromagnetic radiation on the well-being and health of room users. The electromagnetic radiation’s source can be found both in the internal and external environment. One of the sources of electromagnetic radiation is electric underfloor heating, where the recorded values were as high as 800 mG, with the permissible value of 2 mG [101]. Electromagnetic radiation can produce a thermal effect due to the absorption of radiation energy and its conversion into thermal energy, as well as disturbing the basic functions of cells, changing their membrane and functional potential, and disturbing the bioelectric processes between neurons. While electric fields are easily confined by trees, walls, or even human skin, magnetic fields are difficult to shield and their impact diminishes with distance from the source. Scientists are looking for a way to suppress internal electromagnetic fields [102,103] that will reduce the impact of radiation on people in the room.
4. Façade, Decentralised Ventilation
An important issue is the fact that energy consumption by the construction sector will continue to grow. They are already the main energy-consuming sector [104,105,106,107,108]. Heating, ventilation, and air conditioning (HVAC) systems alone account for 40–60% of a building’s energy needs [109,110,111,112], and the ventilation systems themselves account for 20–30% [113]. With this in mind, in order to globally reduce energy consumption and CO2 emissions, old buildings should be modernised [114,115,116,117], and also take reduction energy and CO2 emissions into account in the risk assessment of project management [118,119]. Building managers reduce the heat demand of existing buildings by insulating them and sealing the building envelope. However, such actions have consequences in the form of reduced air exchange and the deterioration of indoor air quality (IAQ). This, in turn, has a negative impact on the performance and health of people in the premises [120,121]. Likewise, the way the air is distributed in the room is important. In the process of designing an installation, it is assumed that fresh air and indoor air are ideally mixed if the flows specified in the regulations are adopted. In fact, with different locations for air inlets and outlets, the air may not be renewed, and this results in an increase in the amount of air to achieve a minimum IAQ. In order to combine the appropriate IAQ in the premises and energy savings, various methods are used to control centralized systems, for example, based on the relative humidity level [122] or the concentration of carbon dioxide in the internal air [123]. In many existing buildings, it may not be possible to install centralised ventilation systems [124,125,126,127,128]. For this purpose, hybrid ventilation systems or decentralised façade ventilation can be used [129,130,131,132]. The latter make it possible to adjust the capacity to the need for a given amount of fresh air. Due to the lack of ventilation ducts, such systems are equipped with small fans, which translates into low pressure losses [133].
The decentralised façade ventilation units can be configured as mini-air handling units (AHU) (Figure 5) equipped with two fans and a heat recovery exchanger, or as façade-mounted units with one fan and with or without a heat recovery exchanger.
In the second case, we have systems with a reversible fan, that alternately in one cycle supplies the air, and in the next cycle exhausts the air to the outside [134] (Figure 6). Another solution are devices with which the cyclical supply and exhaust are affected by changing the dampers system [110,135] (Figure 7). The authors, examining solutions without a heat recovery exchanger [136], indicated the need to heat the air due to the risk of drafts. The risk of drafts was also indicated by Merckx et al. [137], who in their research showed that only airflow directed upward vertically does not cause the phenomenon of drafts.
Typically, air heating in decentralised façade devices is limited to the use of an aluminium or ceramic accumulation exchanger [139,140], which heats the supply air from the exhaust air stream. Choi et al. [141], investigating decentralised façade units, found that in the case of changing the bidirectional mode, the demand for heating and cooling energy is lower by approximately 20% compared to the simulation of the simultaneous supply and exhaust mode. At the same time, it should be noted that the systems mounted in the façade have lower pressure losses, are easily installed, and require no maintenance. However, they generate a higher noise level [134,137] and are more sensitive to wind pressure and to the stack effect [134]. Merzkirch et al. [111] have shown that a large imbalance of the supply and exhaust flows in decentralised units leads to a reduced heat exchange efficiency. Moreover, due to the change in the direction of rotation, decentralised wall units have a time-varying efficiency of heat exchange resulting from the heat charging and removal process [136]. Smith and Svendsen [139], in turn, analysing decentralised façade units, showed that the use of rotary heat exchangers shows a low or moderate risk of mould when ventilating single premises in dry conditions and are not suitable for ventilating damp premises.
The researchers used carbon dioxide as an indicator of air quality when analysing façade ventilation units for single premises. In the case of devices with a reversible fan, at various air flow velocities, a sufficient reduction of CO2 concentration was observed (Figure 8) to ensure an appropriate IAQ [138].
The analysis of the air exchanges achieved by the unit with a dampers system [135] showed that, for both the 2-min supply/exhaust time and the 10-min time, the air exchange was sufficient for an office premise. In addition, the analysis of changes in the mean value of carbon dioxide concentration over a 30-min period showed reductions in the analysed parameter (Figure 9). The reduction of CO2 concentration was also confirmed by others in their studies [142].
On the other hand, the analysis [110] of the influence of the supply/exhaust cycle length on the CO2 concentration showed that for each cycle length, throughout the entire measurement period the carbon dioxide concentration did not exceed the value of 800 ppm, which means that the premises met the requirements of ASHRAE [1] regarding air quality in offices (Figure 10). There is a visible increase in the concentration of carbon dioxide upon entering the user’s room. At the same time, with a longer supply/exhaust time (10 min), the maximum value of the carbon dioxide concentration is lower than for the short cycle (2 min).
Despite studies proving that façade ventilation units effectively reduce the concentration of pollutants and improve IAQ in premises in many countries, e.g., in Poland, regulations prohibit the use of units where an integrated intake and outtake are installed in the wall [143]. The researchers [144,145] proved, however, that there was no recycling of the exhaust air stream in these types of units, which indicates the need to change national regulations. At the same time, decentralised façade units require further research into noise reduction and elimination of the influence of wind on their operation.
5. What Should Be Done in the Field of IAQ?
Indoor air quality is an extremely important aspect of human life, therefore scientists should not stop the research in this field. Façade ventilation has not been sufficiently researched. The test results described in the literature concern the concentration of carbon dioxide. Future work should take into account the ability of façade devices to reduce allergens and analyse the dependence of particulate matters outside the building and in a building ventilated by façade devices. Moreover, experiments on the use of HEPA filters or products such as Molekule are lacking. In addition, long-term analyses of indoor airborne particulate matters levels should be performed.
6. Conclusions
Indoor air quality affects the health of occupants, as well as work efficiency and learning effectiveness. At the present time, we are striving to reduce energy consumption. In existing buildings, modernisation works are carried out, consisting of insulating the building envelope and replacing the window and door frames with tight ones. These works lead to a reduction in air exchange, which results in deterioration of the indoor air quality. To improve the situation, mechanical ventilation is introduced. Due to the limited space in existing facilities, it is usually not possible to introduce central systems. Façade ventilation systems for single premises ventilation are becoming increasingly popular. In the literature are studies on the effective removal of pollutants by these types of units as well as an analysis of the thermal comfort of rooms equipped with façade ventilation units. Based on the literature review, it can be concluded that:
- these solutions are sufficient to maintain IAQ;
- they do not recycle the exhaust air stream;
- they require further research, especially in the field of: Noise reduction; elimination of the impact of wind and outside air temperature on the operation of such units (especially the impact on the amount of heat recovery); capacity of particulate matters removal and ways of filtration;
- the legal regulations of some countries require verification (integrated air intake and outtake are allowed to be mounted only on the roof, not on the façade).
Since the global goal is to make all buildings, including existing ones, passive buildings, the research in field IAQ in the premises with façade ventilation units is important and urgent.
Funding
This research was funded by the program of the Minister of Science and Higher Education under the name: “Regional Initiative of Excellence” in 2019–2022, project number 025/RID/2018/19, financing amount PLN 12,000,000.
Institutional Review Board Statement
Not applicable.
Informed Consent Statement
Not applicable.
Conflicts of Interest
The author declares no conflict of interest.
References
- ASHRAE-ANSI-ASHRAE Standard 62.1-2016 Ventilation for Acceptable Indoor Air Quality; ASHRAE: Atlanta, GA, USA, 2016.
- Miśkiewicz, P. Jakość powietrza wewnętrznego—Perspektywa światowej organizacji zdrowia. In Problemy Jakości Powietrza Wewnętrznego Polsce; Wydział Instalacji Budowlanych, Hydrotechniki i Inżynierii Środowiska Politechniki Warszawskiej: Warszawa, Poland, 2005; pp. 137–140. [Google Scholar]
- Colbeck, I.; Sidra, S.; Ali, Z.; Ahmed, S.; Nasir, Z.A. Spatial and temporal variations in indoor air quality in Lahore, Pakistan. Int. J. Environ. Sci. Technol. 2018, 16, 2565–2572. [Google Scholar] [CrossRef] [Green Version]
- World Health Organization. World Health Statistics (HO-WHS): Monitoring Health for the SDGS; World Health Organization: Geneva, Switzerland, 2018. [Google Scholar]
- Xie, T. Indoor air pollution and control technology. In Proceedings of the IOP Conference Series: Earth and Environmental Science, 2nd International Symposium on Resource Exploration and Environmental Science, Ordos, China, 28–29 April 2018; Volume 170, p. 032084. [Google Scholar]
- Rumana, H.S.; Sharma, R.C.; Beniwal, V.; Sharma, A.K. A retrospective approach to assess human health risks associated with growing air pollution in urbanized area of Thar Desert, western Rajasthan, India. J. Environ. Health Sci. Eng. 2014, 12, 23. [Google Scholar] [CrossRef] [Green Version]
- Sharma, V.K. Importance of source apportionment modeling in air pollution abatement policy. Clean Technol. Environ. Policy 2010, 12, 3–4. [Google Scholar] [CrossRef] [Green Version]
- Ilyas, S.Z.; Khattak, A.I.; Nasir, S.M.; Quarashi, T.; Durrani, R. Air pollution assessment in urban areas and its impact on human health in the city of Quetta, Pakistan. Clean Technol. Environ. Policy 2010, 12, 291–299. [Google Scholar] [CrossRef]
- Dudzińska, M.R.; Staszowska, A.; Połednik, B. Preliminary Study of Effect of Furniture and Finishing Materials on Formaldehyde Concentration in Office Rooms. Environ. Prot. Eng. 2009, 35, 225–233. [Google Scholar]
- Topp, R.; Thefeld, W.; Wichmann, H.-E.; Heinrich, J. The effect of environmental tobacco smoke exposure on allergic sensitization and allergic rhinitis in adults. Indoor Air 2005, 15, 222–227. [Google Scholar] [CrossRef]
- Lindgren, T.; Norbäck, D. Health and perceptron of cabin air quality among Swedish commercial airline crew. Indoor Air 2005, 15, 65–72. [Google Scholar] [CrossRef]
- Carrer, P.; Wargocki, P.; Fanetti, A.; Bischof, W.; Fernandes, E.; De, O.; Hartmann, T.; Kephalopoulos, S.; Palkonen, S.; Sepäpnen, O. What does the scientific literature tell us about the ventilation-health relationship in public and residential buildings? Build Environ. 2015, 94, 273–286. [Google Scholar] [CrossRef]
- Huttunen, K. Indoor Air Pollution. In Clinical Handbook of Air Pollution—Related Diseases; Capello, F., Gaddi, A.V., Eds.; Springer: Berlin, Germany, 2018; pp. 107–114. [Google Scholar]
- Daisey, J.M.; Angell, W.J.; Apte, M. Indoor air quality, ventilation and health symptoms in schools: An analysis of existing information. Indoor Air 2003, 13, 53–64. [Google Scholar] [CrossRef] [PubMed]
- Mendell, M.J.; Heath, G.A. Do indoor pollutants and thermal conditions in schools influence student performance? A critical review of the literature. Indoor Air 2005, 15, 27–52. [Google Scholar] [CrossRef] [PubMed]
- Seppanen, O.A.; Fisk, W.J.; Mendell, M.J. Association of ventilation rates and CO2 concentrations with health and other responses in commercial and industrial buildings. Indoor Air 1999, 9, 226–252. [Google Scholar] [CrossRef] [PubMed]
- Haverinen-Shaughnessy, U.; Moschandreas, D.J.; Shaughnessy, R.J. Association between substandard classroom ventilation rates and students’ academic achievement. Indoor Air 2010, 21, 121–131. [Google Scholar] [CrossRef]
- Tham, K.W. Effects of temperature and outdoor air supply rate on the performance of call center operators in the tropics. Indoor Air 2004, 14, 119–125. [Google Scholar] [CrossRef]
- Apte, M.G.; Fisk, W.J.; Daisey, J.M. Associations Between Indoor CO2 Concentrations and Sick Building Syndrome Symptoms in U.S. Office Buildings: An Analysis of the 1994–1996 BASE Study Data. Indoor Air 2000, 10, 246–257. [Google Scholar] [CrossRef] [PubMed] [Green Version]
- Apte, M.G.; Fisk, W.J.; Daisey, J.M. Indoor carbon dioxide concentrations and SBS in office workers. In Proceedings Healthy Building; Indoor Environment Department, Lawrence Berkeley National Laborator: Berkeley, CA, USA, 2000; Volume 1, pp. 133–138. [Google Scholar]
- Sowa, J. Jakość Powietrza we Wnętrzach Jako Istoty Element Pływający na Komfort Pracy, Cyrkulacje; Kielce University of Technology: Kielce, Poland, 2017; Volume 37, pp. 32–33. [Google Scholar]
- Pulimeno, M.; Piscitelli, P.; Colazzo, S.; Colao, A.; Miani, A. Indoor air quality at school and students’ performance: Recom-mendations of the UNESCO Chair on Health Education and Sustainable Development & the Italian Society of Environmen-tal Medicine (SIMA). Health Promot. Perspect. 2020, 10, 169. [Google Scholar] [CrossRef]
- Sowa, J. Jakość Powietrza Wnętrz, a Komfort Życia i Efekty Ekonomiczne, Cyrkulacje; Kielce University of Technology: Kielce, Poland, 2016; Volume 35, p. 30. [Google Scholar]
- Zabiegała, B. Związki organiczne, ich źródła emisji i wpływ na jakość powietrza wewnętrznego. In Problemy Jakości Powietrza Wewnętrznego w Polsce; Wydział Instalacji Budowlanych, Hydrotechniki i Inżynierii Środowiska Politechniki Warszawskiej: Warszawa, Poland, 2007; pp. 233–254. [Google Scholar]
- Edwards, R. Handbook of Domestic Ventilation; Elsevier Ltd.: London, UK, 2005. [Google Scholar]
- Górny, R.L. Submikronowe cząstki grzybów i bakterii—Nowe zagrożenie środowiska wnętrz. In Problemy Jakości Powietrza Wewnętrznego w Polsce; Hydrotechniki i Inżynierii Środowiska Politechniki Warszawskiej: Warszawa, Poland, 2005; pp. 25–40. [Google Scholar]
- Mijakowski, M. Wilgotność powietrza w relacjach człowiek, środowisko wewnętrzne, architektura. In Problemy Jakości Powietrza Wewnętrznego w Polsce; Hydrotechniki i Inżynierii Środowiska Politechniki Warszawskiej: Warszawa, Poland, 2005; pp. 105–121. [Google Scholar]
- Chiesa, G.; Cesari, S.; Garcia, M.; Issa, M.; Li, S. Multisensor IoT Platform for Optimising IAQ Levels in Buildings through a Smart Ventilation System. Sustainability 2019, 11, 5777. [Google Scholar] [CrossRef] [Green Version]
- Kisilewicz, T. O związkach między szczelnością budynków, a mikroklimatem, komfortem wewnętrznym i zużyciem energii w budynkach niskoenergetycznych. Napędy i Sterow. 2014, 12, 94–97. [Google Scholar]
- EN ISO 13788:2012-05 Hygrothermal Performance of Building Components and Building Elements—Internal Surface Temper-Ature to Avoid Critical Surface Humidity and Interstitial Condensation—Calculation Methods. Available online: https://www.iso.org/standard/22203.html (accessed on 2 February 2021).
- Pogorzelski, J.A. Zagadnienia cieplno–wilgotnościowe przegród budowlanych. In Fizyka Budowli Budownictwo Ogólne; Klemm, P., Ed.; Arkady, 2005; Volume 2. [Google Scholar]
- Zender-Świercz, E.; Telejko, M. Impact of Insulation Building on the Work of Ventilation. Procedia Eng. 2016, 161, 1731–1737. [Google Scholar] [CrossRef] [Green Version]
- Taus, N.; Badea, M.; Taus, R.; Prediger, E. Indoor air pollution and acute intoxication with carbon monoxide. J. Environ. Prot. Ecol. 2008, 9, 773–781. [Google Scholar]
- Francisco, P.W.; Pigg, S.; Cautley, D.; Rose, W.B.; Jacobs, D.E.; Cali, S. Carbon monoxide measurements in homes. Sci. Technol. Built Environ. 2018, 24, 118–123. [Google Scholar] [CrossRef]
- Silva, S.; Monteiro, A.O.; Russo, M.A.; Valente, J.; Alves, C.; Nunes, T.; Pio, C.; Miranda, A.I. Modelling indoor air quality: Validation and sensitivity. Air Qual. Atmos. Health 2017, 10, 643–652. [Google Scholar] [CrossRef]
- Ayodele, J.T.; Adekiya, A.; Yakubu, I. Carbon Monoxide as Indoor Pollutant in Kano Metropolis. J. Appl. Sci. Environ. Manag. 2010, 11, 27–30. [Google Scholar] [CrossRef]
- Szczurek, A.; Maciejewska, M.; Połoczański, R.; Teuerle, M.; Wołomańska, A. Dynamics of carbon dioxide concentration in indoor air. Stoch. Environ. Res. Risk Assess. 2015, 29, 2193–2199. [Google Scholar] [CrossRef] [Green Version]
- Hui, P.S.; Wong, L.T.; Mui, K.W. Using Carbon Dioxide Concentration to Assess Indoor Air Quality in Offices. Indoor Built Environ. 2008, 17, 213–219. [Google Scholar] [CrossRef]
- Ramalho, O.; Wyart, G.; Mandin, C.; Blondeau, P.; Cabanes, P.-A.; Leclerc, N.; Mullot, J.-U.; Boulanger, G.; Redaelli, M. Association of carbon dioxide with indoor air pollutants and exceedance of health guideline values. Build. Environ. 2015, 93, 115–124. [Google Scholar] [CrossRef]
- Marchetti, N.; Cavazzini, A.; Pasti, L.; Catani, M.; Malagù, C.; Guidi, V. A campus sustainability initiative: Indoor air quality monitoring in classroom. In Proceedings of the 2015 IEEE XVIII AISEM Annual Conference, Trento, Italy, 3–5 February 2015; pp. 1–4. [Google Scholar]
- Bonino, S. Carbon dioxide detection and indoor air quality control. Occup. Health Saf. 2016, 85, 46–48. [Google Scholar]
- Khazaei, B.; Shiehbeigi, A.; Haji, A.R.; Kani, M.A. Modeling indoor air carbon dioxide concentration using artificial neural network. Int. J. Environ. Sci. Technol. 2019, 16, 729–736. [Google Scholar] [CrossRef]
- Pitarma, R.; Marques, G.; Caetano, F. Monitoring Indoor Air Quality to Improve Occupational Health. In New Advances in Information Systems and Technologies. Advances in Intelligent Systems and Computing; Rocha, Á., Correia, A., Adeli, H., Reis, L., Mendonça Teixeira, M., Eds.; Springer: Cham, Switzerland, 2016; Volume 445, pp. 13–21. [Google Scholar]
- Sireesha, N.L. Correlation amongst Indoor Air Quality, Ventilation and Carbon Dioxide. J. Sci. Res. 2017, 9, 179–192. [Google Scholar] [CrossRef] [Green Version]
- Kodama, Y.; Arashidani, K.; Tokui, N.; Kawamoto, T.; Matsuno, K.; Kunugita, N.; Minakawa, N. Environmental NO2 concentration and exposure in daily life along main roads in Tokyo. Environ. Res. 2002, 89, 236–244. [Google Scholar] [CrossRef]
- Nakai, S.; Nitta, H.; Maeda, K. Respiratory health associated with exposure to automobile exhaust. Personal NO2 exposure levels according to distance from roadside. J. Exp. Anal. Environ. Epid. 1995, 5, 125–136. [Google Scholar]
- Garrett, M.H.; Hooper, M.A.; Hooper, B.M. Nitrogen dioxide in Australian homes: Levels and sources. J. Air Waste Manag. 1999, 49, 76–81. [Google Scholar] [CrossRef] [PubMed] [Green Version]
- Zota, A.; Adamkiewicz, G.; Levy, J.I.; Spengler, J.D. Ventilation in public housing: Implications for indoor nitrogen dioxide concentration. Indoor Air 2005, 15, 393–401. [Google Scholar] [CrossRef]
- Leung, R.; Lam, C.W.K.; Chan, A.; Lee, M.; Chan, I.H.S.; Pang, S.W.; Lai, C.K.W. Indoor environment of residential homes in Hong Kong—relevance to asthma and allergic disease. Clin. Exp. Allergy 1998, 28, 585–590. [Google Scholar] [CrossRef]
- Vilčeková, S. Indoor Nitrogen Oxides. In Advanced Air Pollution; Nejadkoorki, F., Ed.; IntechOpen: Rijeka, Croatia, 2011. [Google Scholar]
- World Health Organization (WHO). Guidelines for Indoor Air Quality: Selected Pollutants; World Health Organization: Geneva, Switzerland, 2010. [Google Scholar]
- Rösch, C.; Kohajda, T.; Röder, S.; Bergen, M.; Schlink, U. Relationship between sources and patterns of VOCs in indoor air. Atmos. Pollut. Res. 2014, 5, 129–137. [Google Scholar] [CrossRef] [Green Version]
- Ventura, S.G.; Martins, A.O.; Oliveira, F.E.; Guedes, J.; Vasconcelos, M.T.S.D. VOCs in indoor air in several schools of porto. Heal. Build. Creating Heal. Indoor Environ. People 2006, 391–392. [Google Scholar] [CrossRef]
- World Health Organization. Indoor air quality: Organic pollutants. Environ. Technol. Lett. 1989, 10, 855–858. [Google Scholar] [CrossRef]
- Zabiegała, B. Organic compounds in indoor environment. Polish J. Environ. Stud. 2006, 15, 383–393. [Google Scholar]
- Bhandari, M.; Gupta, A. Radon in indoor air: An Indian context. Indian J. Environ. Prot. 2009, 29, 323–329. [Google Scholar]
- Madureira, J.; Paciência, I.; Rufo, J.; Moreira, A.; Fernandes, E.; Pereira, A. Radon in indoor air of primary schools: Determinant factors, their variability and effective dose. Environ. Geochem. Health 2016, 38, 523–533. [Google Scholar] [CrossRef] [PubMed]
- Hazar, N.; Karbakhsh, M.; Yunesian, M.; Nedjat, S.; Naddafi, K. Perceived risk of exposure to indoor residential radon and its relationship to willingness to test among health care providers in Tehran. J. Environ. Health Sci. Eng. 2014, 12, 1–8. [Google Scholar] [CrossRef] [PubMed] [Green Version]
- Wang, Z.; Xie, D.; Tang, R.; Sheng, X. Investigation on Indoor Air Quality at Rural Houses in Winter in Severe Cold Region. In Proceedings of the 8th International Symposium on Heating, Ventilation and Air Conditioning, Xi’an, China, 19–21 October 2013; Springer: Berlin/Heidelberg, Germany, 2013; Volume 261, pp. 69–75. [Google Scholar]
- Alves, C.; Nunes, T.; Silva, J.; Duarte, M. Comfort Parameters and Particulate Matter (PM10 and PM2.5) in School Classrooms and Outdoor Air. Aerosol Air Qual. Res. 2013, 13, 1521–1535. [Google Scholar] [CrossRef] [Green Version]
- Madureira, J.; Paciência, I.; Rufo, J.C.; Moreira, A.; Fernandes, E. Thermal and indoor air conditions in Portuguese residential buildings: Risk factors for childhood health. In Proceedings of the 28th Annual Conference International Society for Environmental, Rome, Italy, 1–4 September 2016. [Google Scholar]
- Rogula-Kozłowska, W.; Klejnowski, K.; Rogula-Kopiec, P.; Ośródka, L.; Krajny, E.; Błaszczak, B.; Mathews, B. Spatial and seasonal variability of the mass concentration and chemical composition of PM2.5 in Poland. Air Qual. Atmos. Health 2014, 7, 41–58. [Google Scholar] [CrossRef] [PubMed] [Green Version]
- Ścibor, M.; Balcerzak, B.; Galbarczyk, A.; Targosz, N.; Jasieńska, G. Are we safe inside? Indoor air quality in relation to outdoor concentration of PM10 and PM2.5 and to characteristics of homes. Sustain. Cities Soc. 2019, 48, 101537. [Google Scholar] [CrossRef]
- Kong, L.; Xin, J.; Zhang, W.; Wang, Y. The empirical correlations between PM2.5, PM10 and AOD in the Beijing metropolitan region and the PM2.5, PM10 distributions retrieved by MODIS. Environ. Pollut. 2016, 216, 350–360. [Google Scholar] [CrossRef] [PubMed]
- Gharehchahi, E.; Mahvi, A.H.; Amini, H.; Nabizadeh, R.; Akhlaghi, A.A.; Shamsipour, M.; Yunesian, M. Health impact assessment of air pollution in Shiraz, Iran: A two-part study. J. Environ. Health Sci. Eng. 2013, 11, 11. [Google Scholar] [CrossRef] [Green Version]
- Milinevsky, G.; Danylevsky, V.; Miatselskaya, N.; Han, W.; Shulga, V.; Simon, A.; Yuke, W. Evaluation of air quality by particu-late matter PM2.5/PM10 in the Ukraine and China cities. In Astronomy and Space physics in the Kyiv University; Kyiv University: Kyiv, Ukraine, 2018. [Google Scholar]
- Lazovic, I.; Stevanović, Z.M.; Jovašević-Stojanović, M.; Živković, M.M.; Banjac, M. Impact of CO2 concentration on indoor air quality and correlation with relative humidity and indoor air temperature in school buildings in Serbia. Therm. Sci. 2016, 20, 297–307. [Google Scholar] [CrossRef]
- Telejko, M.; Zender-Świercz, E. An attempt to improve air quality in primary schools. In Proceedings of the 10th International Conference: Environmental Engineering, Vilnius, Lithuania, 27–28 April 2017. [Google Scholar]
- Wolverton, B.C. How to Grow Fresh Air: 50 House Plants that Purify Your Home Or Office; Pen-guin Books: New York, NY, USA, 1997. [Google Scholar]
- Claudio, L. Planting Healthier Indoor Air. Environ. Health Perspect. 2011, 119, a426–a427. [Google Scholar] [CrossRef] [PubMed] [Green Version]
- Yang, D.S.; Pennisi, S.V.; Son, K.-C.; Kays, S.J. Screening Indoor Plants for Volatile Organic Pollutant Removal Efficiency. HortScience 2009, 44, 1377–1381. [Google Scholar] [CrossRef]
- Xu, Z.; Wang, L.; Hou, H. Formaldehyde removal by potted plant–soil systems. J. Hazard. Mater. 2011, 192, 314–318. [Google Scholar] [CrossRef] [PubMed]
- Sowa, J. Ocena wpływu wybranych procesów heterogenicznych na bilans dwutlenku węgla w pomieszczeniu. In Proceedings of the Problemy Jakości Powietrza Wewnętrznego w Polsce, Warszawa, Poland, 27–28 November 2005; pp. 197–208. [Google Scholar]
- Bomberg, M.; Kisilewicz, T.; Nowak, K. Is there an optimum range of airtightness for a building? J. Build. Phys. 2016, 39, 395–421. [Google Scholar] [CrossRef]
- Vadamalraj, N.; Zingre, K.; Seshadhri, S.; Arjunan, P.; Srinivasan, S. Hybrid Ventilation System and Soft-Sensors for Maintaining Indoor Air Quality and Thermal Comfort in Buildings. Atmosphere 2019, 11, 110. [Google Scholar] [CrossRef] [Green Version]
- Ben-David, T.; Waring, M.S. Impact of natural versus mechanical ventilation on simulated indoor air quality and energy consumption in offices in fourteen U.S. cities. Build. Environ. 2016, 104, 320–336. [Google Scholar] [CrossRef] [Green Version]
- Błaszczyk, E.; Rogula-Kozłowska, W.; Klejnowski, K.; Kubiesa, P.; Fulara, I.; Mielżyńska-Švach, D. Indoor air quality in Urban and rural kindergartens: Short-term studies in Silesia, Poland. Air Qual. Atmos. Health 2017, 10, 1207–1220. [Google Scholar] [CrossRef] [PubMed] [Green Version]
- Pope, C.A.; Dockery, D.W.; Schwartz, J. Review of Epidemiological Evidence of Health Effects of Particulate Air Pollution. Inhal. Toxicol. 1995, 7, 1–18. [Google Scholar] [CrossRef]
- Badyda, A.J.; Dąbrowiecki, P.; Czechowski, P.O.; Majewski, G. Risk of bronchi obstruction among non-smokers—Review of environmental factors affecting bronchoconstriction. Respir. Physiol. Neurobiol. 2015, 209, 39–46. [Google Scholar] [CrossRef] [PubMed]
- Badyda, A.J.; Dąbrowiecki, P.; Czechowski, P.O.; Majewski, G.; Doboszyńska, A. Traffic-Related Air Pollution and Respiratory Tract Efficiency. In Environment Exposure to Pollutants. Advances in Experimental Medicine and Biology; Pokorski, M., Ed.; Springer: Berlin/Heidelberg, Germany, 2015; Volume 834, pp. 31–38. [Google Scholar]
- Dutton, S.M.; Banks, D.; Brunswick, S.L.; Fisk, W.J. Health and economic implications of natural ventilation in California offices. Build. Environ. 2013, 67, 34–45. [Google Scholar] [CrossRef]
- Nomura, M.; Hiyama, K. A review: Natural ventilation performance of office buildings in Japan. Renew. Sustain. Energy Rev. 2017, 74, 746–754. [Google Scholar] [CrossRef]
- Sherman, M. Infiltration in ASHRAE’s Residential Ventilation Standards. In ASHRAE Transactions; Part 2, No LO-09-085; Lawrence Berkeley National Laboratory: Berkeley, CA, USA, 2009; Volume 115, pp. 887–896. [Google Scholar]
- Sherman, M.; Walker, I.S. Measured Air Distribution Effectiveness for Residential Mechanical Ventilation. HVAC&R Res. 2009, 15, 211–229. [Google Scholar] [CrossRef]
- Mazumdar, S.; Yin, Y.; Guity, A.; Marmion, P.; Gulick, B.; Chen, Q. Impact of Moving Objects onContaminant Concentration Distributions in an Inpatient Ward with Displacement Ventilation. HVAC&R Res. 2010, 16, 545–563. [Google Scholar] [CrossRef]
- Fisk, W.J.; Mirer, A.G.; Mendell, M.J. Quantitative relationship of sick building syndrome symptoms with ventilation rates. Indoor Air 2009, 19, 159–165. [Google Scholar] [CrossRef] [PubMed] [Green Version]
- Muchič, S.; Butala, V. The influence of indoor environment in office building on their occupants: Expected–unexpected. Build. Environ. 2004, 39, 289–296. [Google Scholar] [CrossRef]
- Runeson, R.; Wahlstedt, K.; Wieslander, G.; Norbäck, D. Personal and psychosocial factors and symptoms compatible with sick building syndrome in the Swedish workforce. Indoor Air 2006, 16, 445–453. [Google Scholar] [CrossRef]
- Klavina, A.; Proskurina, J.; Rodins, V.; Martinsone, I. Carbon dioxide as indoor air quality indicator in renovated schools in Latvia. In Proceedings of the 14th International Conference of Indoor Air Quality and Climate, Ghent, Belgium, 3–8 July 2016. [Google Scholar]
- Lan, L.; Wargocki, P.; Lian, Z. Quantitative measurement of productivity loss due to thermal discomfort. Energy Build. 2011, 43, 1057–1062. [Google Scholar] [CrossRef]
- Roelofsen, P. The impact of office environments on employee performance: The design of the workplace as strategy for productivity enhancement. J. Facil. Manag. 2002, 1, 247–264. [Google Scholar] [CrossRef]
- Johnson, D.L.; Lynch, R.A.; Floyd, E.L.; Wang, J.; Bartels, J.N. Indoor air quality in classrooms: Environmental measures and effective ventilation rate modeling in urban elementary schools. Build. Environ. 2018, 136, 185–197. [Google Scholar] [CrossRef]
- Wargocki, P.; Wyon, D.P. Ten questions concerning thermal and indoor air quality effects on the performance of office work and schoolwork. Build. Environ. 2017, 112, 359–366. [Google Scholar] [CrossRef] [Green Version]
- Nagendra, S.M.; Harika, P. Indoor air quality assessment in a school building in Chennai City, India. In Air Pollution XVIII, WIT Transactions on Ecology and the Environment; WIT Press: Southampton, UK, 2010; Volume 136, pp. 275–286. [Google Scholar] [CrossRef] [Green Version]
- Vimalanathan, K.; Babu, T.R. The effect of indoor office environment on the work performance, health and well-being of office workers. J. Environ. Health Sci. Eng. 2014, 12, 1–8. [Google Scholar] [CrossRef] [PubMed] [Green Version]
- Kim, K.S. Sources, Effects, and Control of Noise in Indoor/Outdoor Living Environments. J. Ergon. Soc. Korea 2015, 34, 265–278. [Google Scholar] [CrossRef] [Green Version]
- Zhisheng, L.; Dongmei, L.; Sheng, M.; Guoqiang, Z.; Jianlong, L. Noise Impact and Improvement on Indoors Acoustic Comfort for the Building Adjacent to Heavy Traffic Road. Chin. J. Popul. Resour. Environ. 2007, 5, 17–25. [Google Scholar] [CrossRef]
- Hodgson, M. Relationship between HVAC airflow rates and noise levels, and noise control in a mechanically-ventilated uni-versity building. In ASHRAE Transactions; No OR-10-058; ASHRAE Transactions: Atlanta, GA, USA, 2010; Volume 116, pp. 550–555. [Google Scholar]
- Nelson, D.I.; Nelson, R.Y.; Concha-Barrientos, M.; Fingerhut, M. The global burden of occupational noise-induced hearing loss. Am. J. Ind. Med. 2005, 48, 446–458. [Google Scholar] [CrossRef] [Green Version]
- Połednik, B. Zanieczyszczenia, a Jakość Powietrza Wewnętrznego w Wybranych Pomieszczeniach; Polska Akademia Nauk: Lublin, Poland, 2013; Volume 116. [Google Scholar]
- Maisch, D.; Podd, J.; Rapley, B. Electromagnetic Fields in the Built Environment—Design for Minimal Radiation Exposure. In BDP Environment Design Guide; Royal Australian Institute of Architects: Melbourne, Austrilia, 2006; Volume 76. [Google Scholar]
- Vizi, G.N.; VandenBosch, G.A.E. Building materials and electromagnetic radiation: The role of material and shape. J. Build. Eng. 2016, 5, 96–103. [Google Scholar] [CrossRef]
- Youngs, I.J.; Bleay, S.M.; Appleton, S.G. Electromagnetic radiation in buildings. In Proceedings of the IEEE Two Day Conference. Getting the Most Out of the Radio Spectrum, London, UK, 24–25 October 2002; Volume 2002, p. 30. [Google Scholar]
- Tommerup, H.; Svendsen, S. Energy savings in Danish residential building stock. Energy Build. 2006, 38, 618–626. [Google Scholar] [CrossRef]
- Liddament, M.W.; Orme, M. Energy and ventilation. Appl. Therm. Eng. 1998, 18, 1101–1109. [Google Scholar] [CrossRef]
- Meiss, A.; Padilla-Marcos, M.Á.; Poza-Casado, I.; Álvaro-Tordesillas, A. A Graphical Tool to Estimate the Air Change Efficiency in Rooms with Heat Recovery Systems. Sustainability 2020, 12, 1031. [Google Scholar] [CrossRef] [Green Version]
- Dermentzis, G.; Ochs, F.; Siegele, D.; Feist, W. Renovation with an innovative compact heating and ventilation system integrated into the façade—An in-situ monitoring case study. Energy Build. 2018, 165, 451–463. [Google Scholar] [CrossRef]
- Chen, Y.; Yang, H.; Luo, Y. Experimental study of plate type air cooler performances under four operating modes. Build. Environ. 2016, 104, 296–310. [Google Scholar] [CrossRef]
- Cai, W.; Wu, Y.; Zhong, Y.; Ren, H. China building energy consumption: Situation, challenges and corresponding measures. Energy Policy 2009, 37, 2054–2059. [Google Scholar] [CrossRef]
- Zender-Świercz, E. Microclimate in Rooms Equipped with Decentralized Façade Ventilation Device. Atmosphere 2020, 11, 800. [Google Scholar] [CrossRef]
- Merzkirch, A.; Maas, S.; Scholzen, F.; Waldmann, D. Field tests of centralized and decentralized ventilation units in residential buildings—Specific fan power, heat recovery efficiency, shortcuts and volume flow unbalances. Energy Build. 2016, 116, 376–383. [Google Scholar] [CrossRef]
- Kilkis, B. Exergy-Optimum Coupling of Heat Recovery Ventilation Units with Heat Pumps in Sustainable Buildings. J. Sustain. Dev. Energy, Water Environ. Syst. 2020, 8, 815–845. [Google Scholar] [CrossRef]
- Haase, M.; Silva, F.M.D.; Amato, A. Simulation of ventilated facades in hot and humid climates. Energy Build. 2009, 41, 361–373. [Google Scholar] [CrossRef]
- Fehrm, M.; Reiners, W.; Ungemach, M. Exhaust air heat recovery in buildings. Int. J. Refrig. 2002, 25, 439–449. [Google Scholar] [CrossRef]
- El Fouih, Y.; Stabat, P.; Rivière, P.; Hoang, P.; Archambaukt, V. Adequacy of air-to-air heat recovery ventilation system applied in low energy buildings. Energy Build. 2012, 54, 29–39. [Google Scholar] [CrossRef]
- Roulet, C.A.; Heidt, F.D.; Foradini, F.; Pibiri, M.C. Real heat recovery with air handling units. Energy Build. 2001, 33, 495–502. [Google Scholar] [CrossRef]
- Mardiana-Idauy, I.A.; Riffat, S.B. An experimental study on the performance of enthalpy recovery system for building applications. Energy Build. 2011, 43, 2533–2538. [Google Scholar] [CrossRef]
- Krechowicz, M. Risk Management in Complex Construction Projects that Apply Renewable Energy Sources: A Case Study of the Realization Phase of the Energis Educational and Research Intelligent Building. In IOP Conference Series: Materials Science and Engineering; IOP Publishing: Bristol, UK, 2017; Volume 245, p. 62007. [Google Scholar] [CrossRef]
- Krechowicz, M. Effective Risk Management in Innovative Projects: A Case Study of the Construction of Energy-efficient, Sustainable Building of the Laboratory of Intelligent Building in Cracow. In IOP Conference Series: Materials Science and Engineering; IOP Publishing: Bristol, UK, 2017; Volume 245, p. 62006. [Google Scholar] [CrossRef] [Green Version]
- Ghida, B.D. Heat Recovery Ventilation for Energy-Efficient Buildings: Design, Operation and Maintenance. Int. J. Innov. Technol. Explor. Eng. 2019, 9, 3713–3715. [Google Scholar] [CrossRef]
- O’Connor, D.; Kaiser, J.; Calautit, S.; Hughes, B.R. A review of heat recovery technology for passive ventilation applications. Renew. Sustain. Energy Rev. 2016, 54, 1481–1493. [Google Scholar] [CrossRef]
- Kwag, B.C.; Park, J.; Kim, S.; Kim, G.T. Evaluation of Effects of the Humidity Level-Based Auto-Controlled Centralized Exhaust Ventilation Systems on Thermal Comfort of Multi-Family Residential Buildings in South Korea. Sustainability 2019, 11, 4791. [Google Scholar] [CrossRef] [Green Version]
- Franco, A.; Schito, E. Definition of Optimal Ventilation Rates for Balancing Comfort and Energy Use in Indoor Spaces Using CO2 Concentration Data. Buildings 2020, 10, 135. [Google Scholar] [CrossRef]
- Yaïci, W.; Ghorab, M.; Entchev, E. Numerical analysis of heat and energy recovery ventilators performance based on CFD for detailed design. Appl. Therm. Eng. 2013, 51, 770–780. [Google Scholar] [CrossRef]
- Besant, R.W.; Simonson, C.J. Air-to-air energy recovery. ASHRAE J. 2000, 42, 31–42. [Google Scholar]
- Besant, R.W.; Simonson, C. Air-to-air exchangers. ASHRAE J. 2003, 45, 42–52. [Google Scholar]
- Dieckmann, J.; Roth, K.W.; Brodrick, J. Emerging technologies: Air-to-air energy recovery heat exchangers. ASHRAE J. 2003, 45, 57–58. [Google Scholar]
- Li, B.; Wild, P.; Rowe, A. Performance of a heat recovery ventilator coupled with an air-to-air heat pump for residential suites in Canadian cities. J. Build. Eng. 2019, 21, 343–354. [Google Scholar] [CrossRef]
- European Commission. Energy Performance of Buildings Directive 2010/31/EU(EPBD); European Parliament: Brussels, Belgium, 2010. [Google Scholar]
- European Parliament and of the Council. Commission Regulation (EU) No 1253/2014 of 7 July 2014 Implementing Directive 2009/125/EC of the European Parliament and of the Council with Regard to Eco-Design Requirements for Ventilation Units; European Parliament and of the Council: Brussels, Belgium, 2014. [Google Scholar]
- Carlsson, M.; Touchie, M.; Richman, R. Investigating the potential impact of a compartmentalization and ventilation system retrofit strategy on energy use in high-rise residential buildings. Energy Build. 2019, 199, 20–28. [Google Scholar] [CrossRef]
- Dodoo, A. Primary energy and economic implications of ventilation heat recovery for a multi-family building in a Nordic climate. J. Build. Eng. 2020, 31, 101391. [Google Scholar] [CrossRef]
- Koç, A.; Yağli, H.; Bilgic, H.H.; Koç, Y.; Özdemir, A. Performance analysis of a novel organic fluid filled regenerative heat exchanger used heat recovery ventilation (OHeX-HRV) system. Sustain. Energy Technol. Assess. 2020, 41, 100787. [Google Scholar] [CrossRef]
- Manz, H.; Huber, H.; Schälin, H.; Weber, A.; Ferrazzini, M.; Studer, M. Performance of single room ventilation units with recuperative or regenerative heat recovery. Energy Build. 2000, 31, 37–47. [Google Scholar] [CrossRef]
- Zender-Świercz, E. Improvement of indoor air quality by way of using decentralised ventilation. J. Build. Eng. 2020, 32, 101663. [Google Scholar] [CrossRef]
- Han, H.; Kwon, Y.-I. Inhaling/Exhaling Heat Recovery Ventilator Using the Concept of Alternating-Current Ventilation. HVAC R Res. 2006, 12, 843–859. [Google Scholar] [CrossRef]
- Merckx, M.; Bruyneel, G.; Pollet, I.; Laverge, J. Temperature, draft and ventilation efficiency of room based decentralised heat recovery ventilation systems. In Proceeding of The 39th AIVC Conference “Smart Ventilation for Buildings”, Antibes Juan-Les-Pins, France, 18–19 September 2018; pp. 838–847. [Google Scholar]
- Ratajczak, K.; Amanowicz, Ł.; Szczechowiak, E. Assessment of the air streams mixing in wall-type heat recovery units for ventilation of existing and refurbishing buildings toward low energy buildings. Energy Build. 2020, 227, 110427. [Google Scholar] [CrossRef]
- Smith, K.M.; Svendsen, S. The effect of a rotary heat exchanger in room-based ventilation on indoor humidity in existing apartments in temperate climates. Energy Build. 2016, 116, 349–361. [Google Scholar] [CrossRef] [Green Version]
- Alkan, M.A.; Keçebaş, A.; Yamankaradeniz, N. Exergo-economic analysis of a district heating system for geothermal energy. Rising specific energy cost method. Energy 2013, 60, 426–434. [Google Scholar] [CrossRef]
- Choi, Y.; Park, B.; Park, S.; Song, D. How can we simulate the Bi-directional flow and time-variant heat exchange ventilation system? Appl. Therm. Eng. 2020, 181, 115948. [Google Scholar] [CrossRef]
- Mikola, A.; Rehand, J.; Kurnitski, J. Air change efficiency of room ventilation units. In Proceeding of the E3S Web of Conferences; 111(01017), CLIMA 2019; EDP Sciences: Les Ulis, France, 2019. [Google Scholar] [CrossRef]
- Rozporządzenie Ministra Infrastruktury i Budownictwa z dnia 16.09.2020r. zmieniające rozporządzenie w sprawie warunków technicznych, jakim powinny odpowiadać budynki i ich usytuowanie, Dz.U. 2020 poz. 1608. [Regulation of the Minister of Infrastructure and Construction of November 16, 2020 Amending the Regulation on the Technical Conditions to be Met by Buildings and Their Location, Dz.U. 2020 Poz.1608]. Available online: https://isap.sejm.gov.pl/isap.nsf/download.xsp/WDU20200001608/O/D20201608.pdf (accessed on 4 February 2021).
- Amanowicz, Ł.; Ratajczak, K.; Szczechowiak, E. Badania jednorurowych systemów wentylacyjnych pod kątem oceny mieszania się strumieni powietrza w czerpni i wyrzutni. Ciepłownictwo Ogrzew. Went. 2019, 1, 29–36. [Google Scholar] [CrossRef]
- Amanowicz, Ł.; Ratajczak, K.; Szczechowiak, E. Analiza możliwości stosowania systemu wentylacji zdecentralizowanej w budynkach edukacyjnych. Instal 2019, 10, 20–26. [Google Scholar] [CrossRef]
Figure 1.
Course of indoor air humidity in the time before and after thermal modernisation: (a) Premises with heat-insulated walls; (b) premises with a heat-insulated roof; (c) premises with heat-insulated walls and ventilation gaps [32]; RH: Relative humidity, (%); t: Time (h).
Figure 1.
Course of indoor air humidity in the time before and after thermal modernisation: (a) Premises with heat-insulated walls; (b) premises with a heat-insulated roof; (c) premises with heat-insulated walls and ventilation gaps [32]; RH: Relative humidity, (%); t: Time (h).

Figure 2.
Changes in indoor air parameters during class [68]: (a) Surplus concentration of carbon dioxide above the external air concentration (ppm); (b) relative humidity—RH (%); (c) indoor air temperature—T (°C).
Figure 2.
Changes in indoor air parameters during class [68]: (a) Surplus concentration of carbon dioxide above the external air concentration (ppm); (b) relative humidity—RH (%); (c) indoor air temperature—T (°C).

Figure 3.
The relationship between thermal discomfort and the efficiency of office work (based on [93]); PMV: Predicted mean vote.
Figure 3.
The relationship between thermal discomfort and the efficiency of office work (based on [93]); PMV: Predicted mean vote.

Figure 4.
The dependence of the efficiency of office work on the amount of fresh air per person (based on [93]); : Fresh air stream per person, .
Figure 4.
The dependence of the efficiency of office work on the amount of fresh air per person (based on [93]); : Fresh air stream per person, .

Figure 5.
Scheme of the micro-HP (Heat Pump) and HRV (Heating Recovery Ventilation) 1-frost protection, 2-ambient air filter, 3-extract air filter, 4-fan of supply air, 5-fan of exhaust air, 6-compressor, 7-evaporator, 8-expansion valve, 9-valve, 10-hot gas defrost bypass. 11-post-heater, 12-heat exchanger, 13-condenser [107].

Figure 6.
Scheme of the experimental façade ventilation unit with a reverse fan [138].
Figure 6.
Scheme of the experimental façade ventilation unit with a reverse fan [138].

Figure 7.
Decentralised façade ventilation unit with dampers [110]; (1) fan flowing the air constantly in one direction; (2) inflow/outflow grate; (3–6) dampers; (7–10) ducts; (11) intake/outtake.
Figure 7.
Decentralised façade ventilation unit with dampers [110]; (1) fan flowing the air constantly in one direction; (2) inflow/outflow grate; (3–6) dampers; (7–10) ducts; (11) intake/outtake.

Figure 8.
Change of CO2 concentration in the unit in a time [138].
Figure 8.
Change of CO2 concentration in the unit in a time [138].

Figure 9.
The trajectories of changes in the average value of CO2 concentration in time [130]; t: Time, (h:min:s).
Figure 9.
The trajectories of changes in the average value of CO2 concentration in time [130]; t: Time, (h:min:s).

Figure 10.
The course of changes in the concentration of carbon dioxide. Blue and purple colours are the 2-min cycle; yellow and green colours are the 10-min cycle; wp: Workplace; cp: Central; t: Time, (h:min) [110].
Figure 10.
The course of changes in the concentration of carbon dioxide. Blue and purple colours are the 2-min cycle; yellow and green colours are the 10-min cycle; wp: Workplace; cp: Central; t: Time, (h:min) [110].


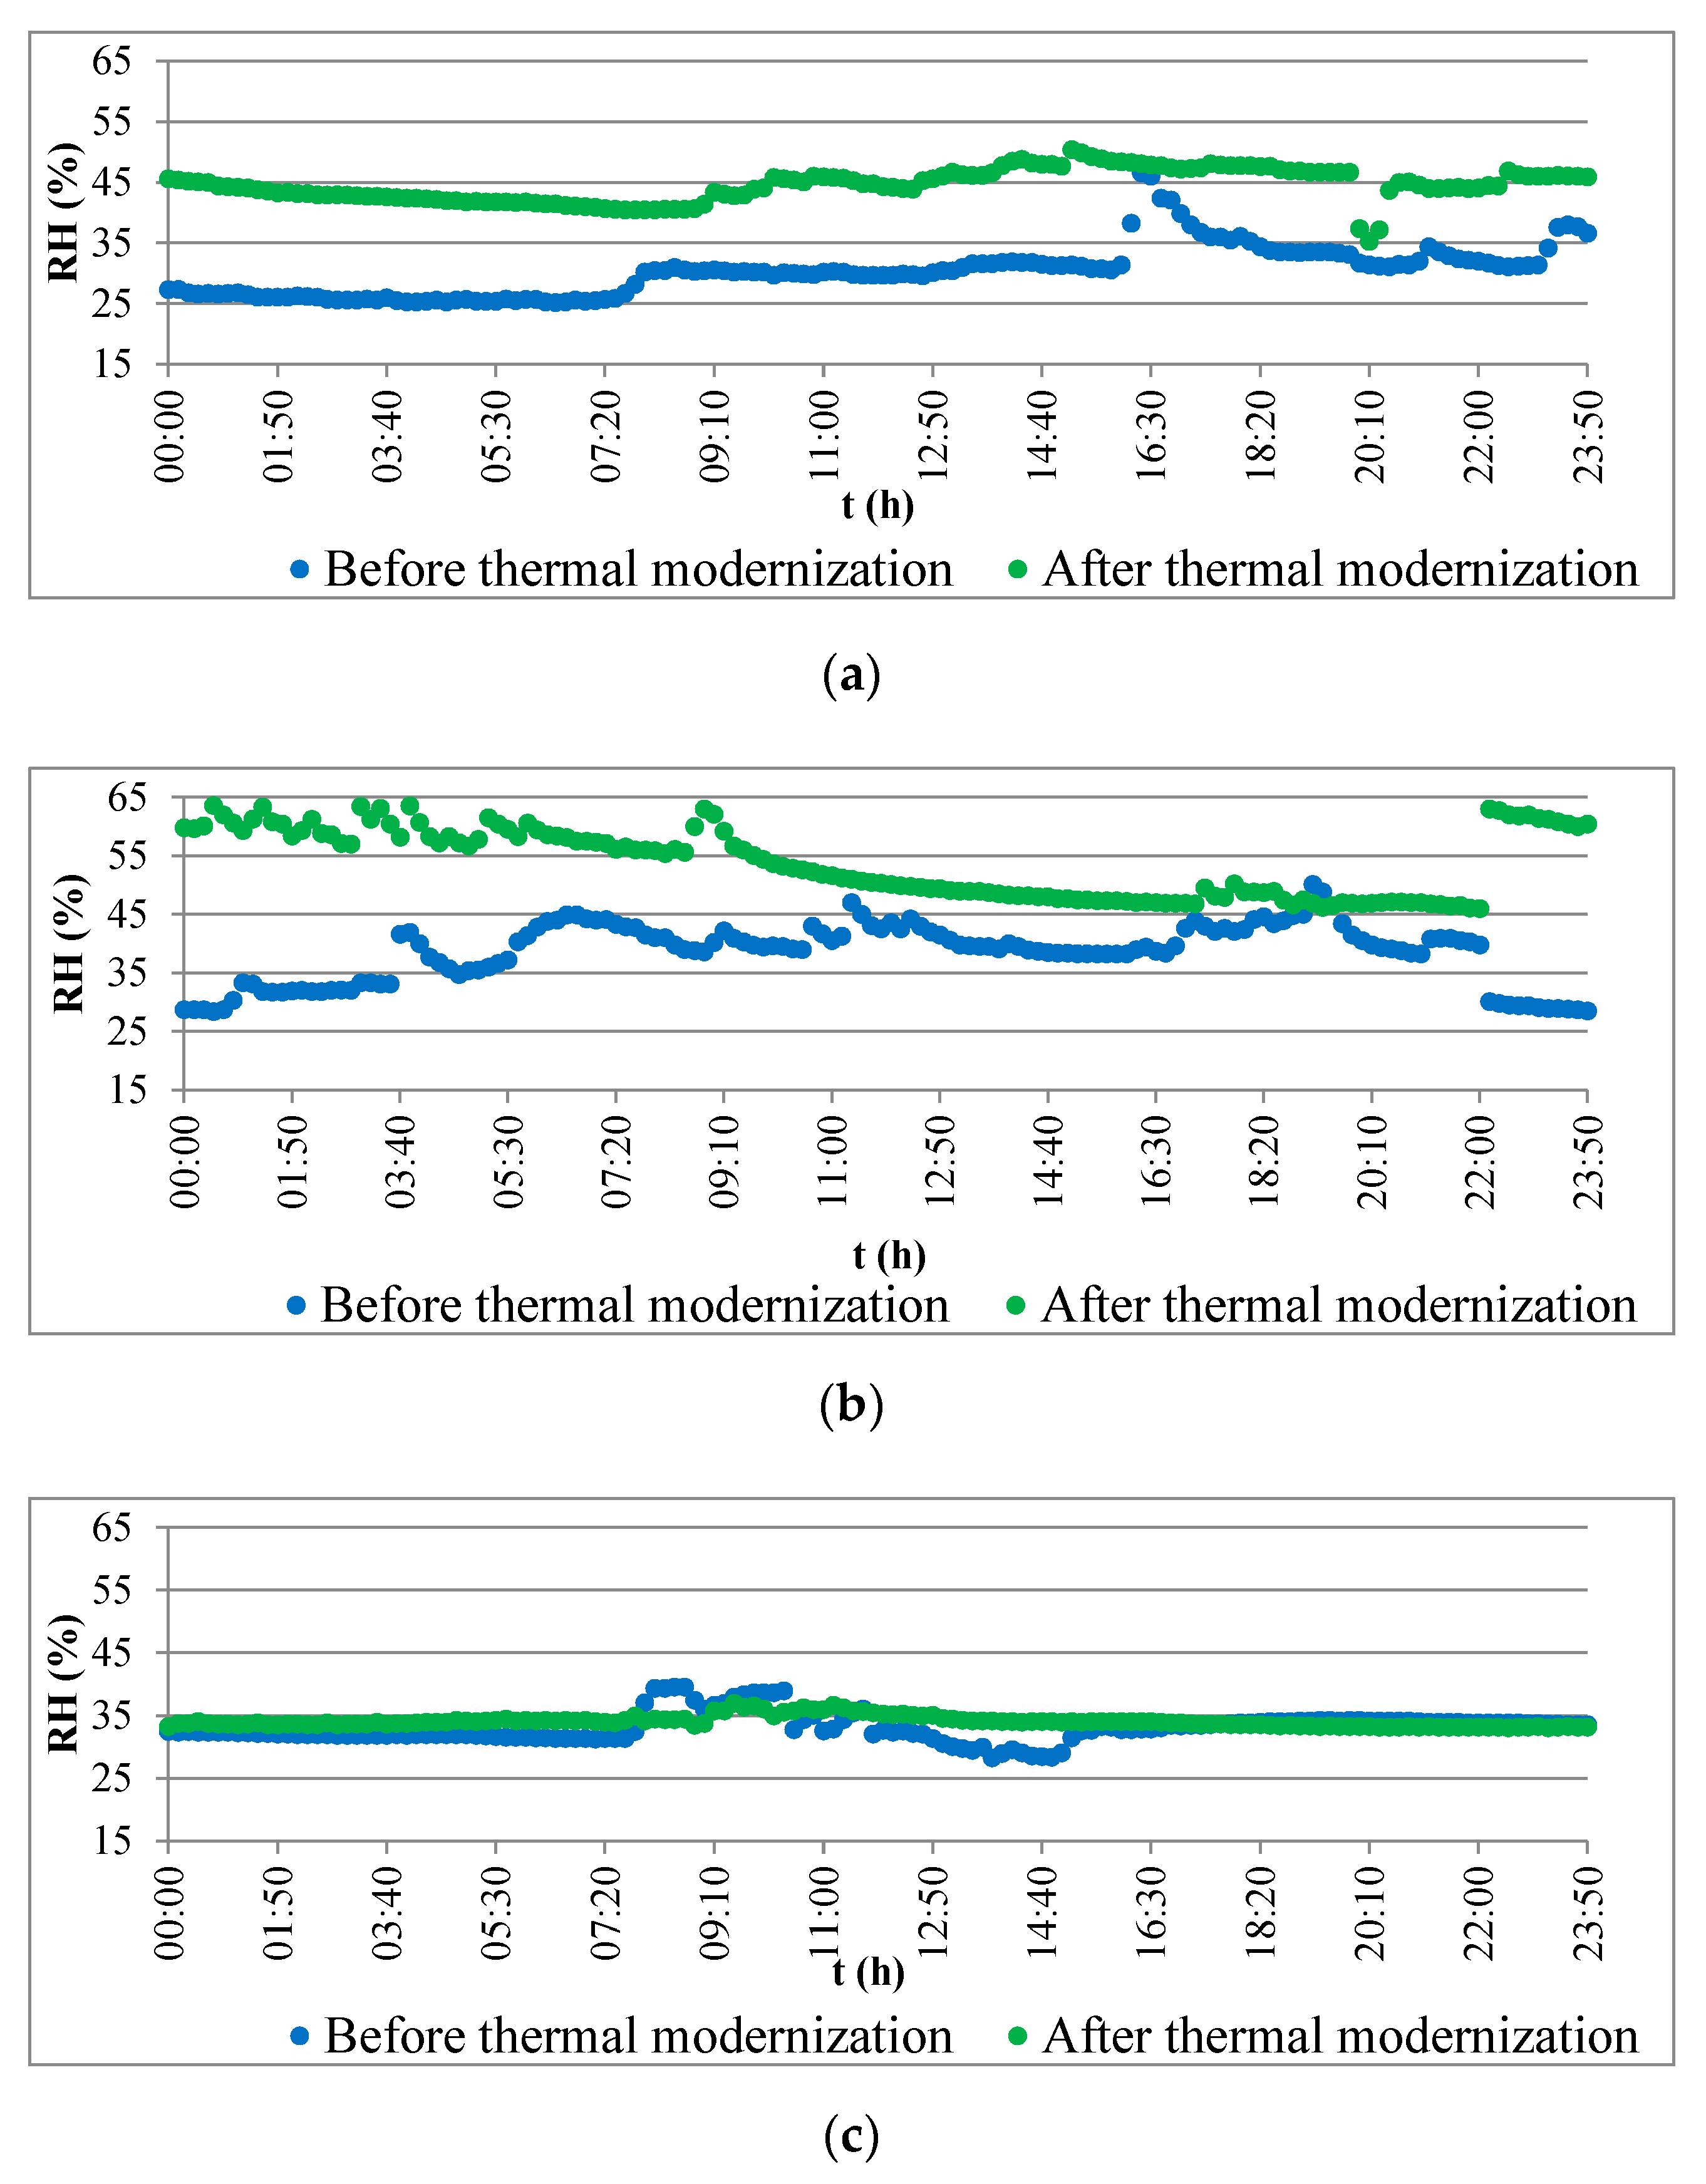
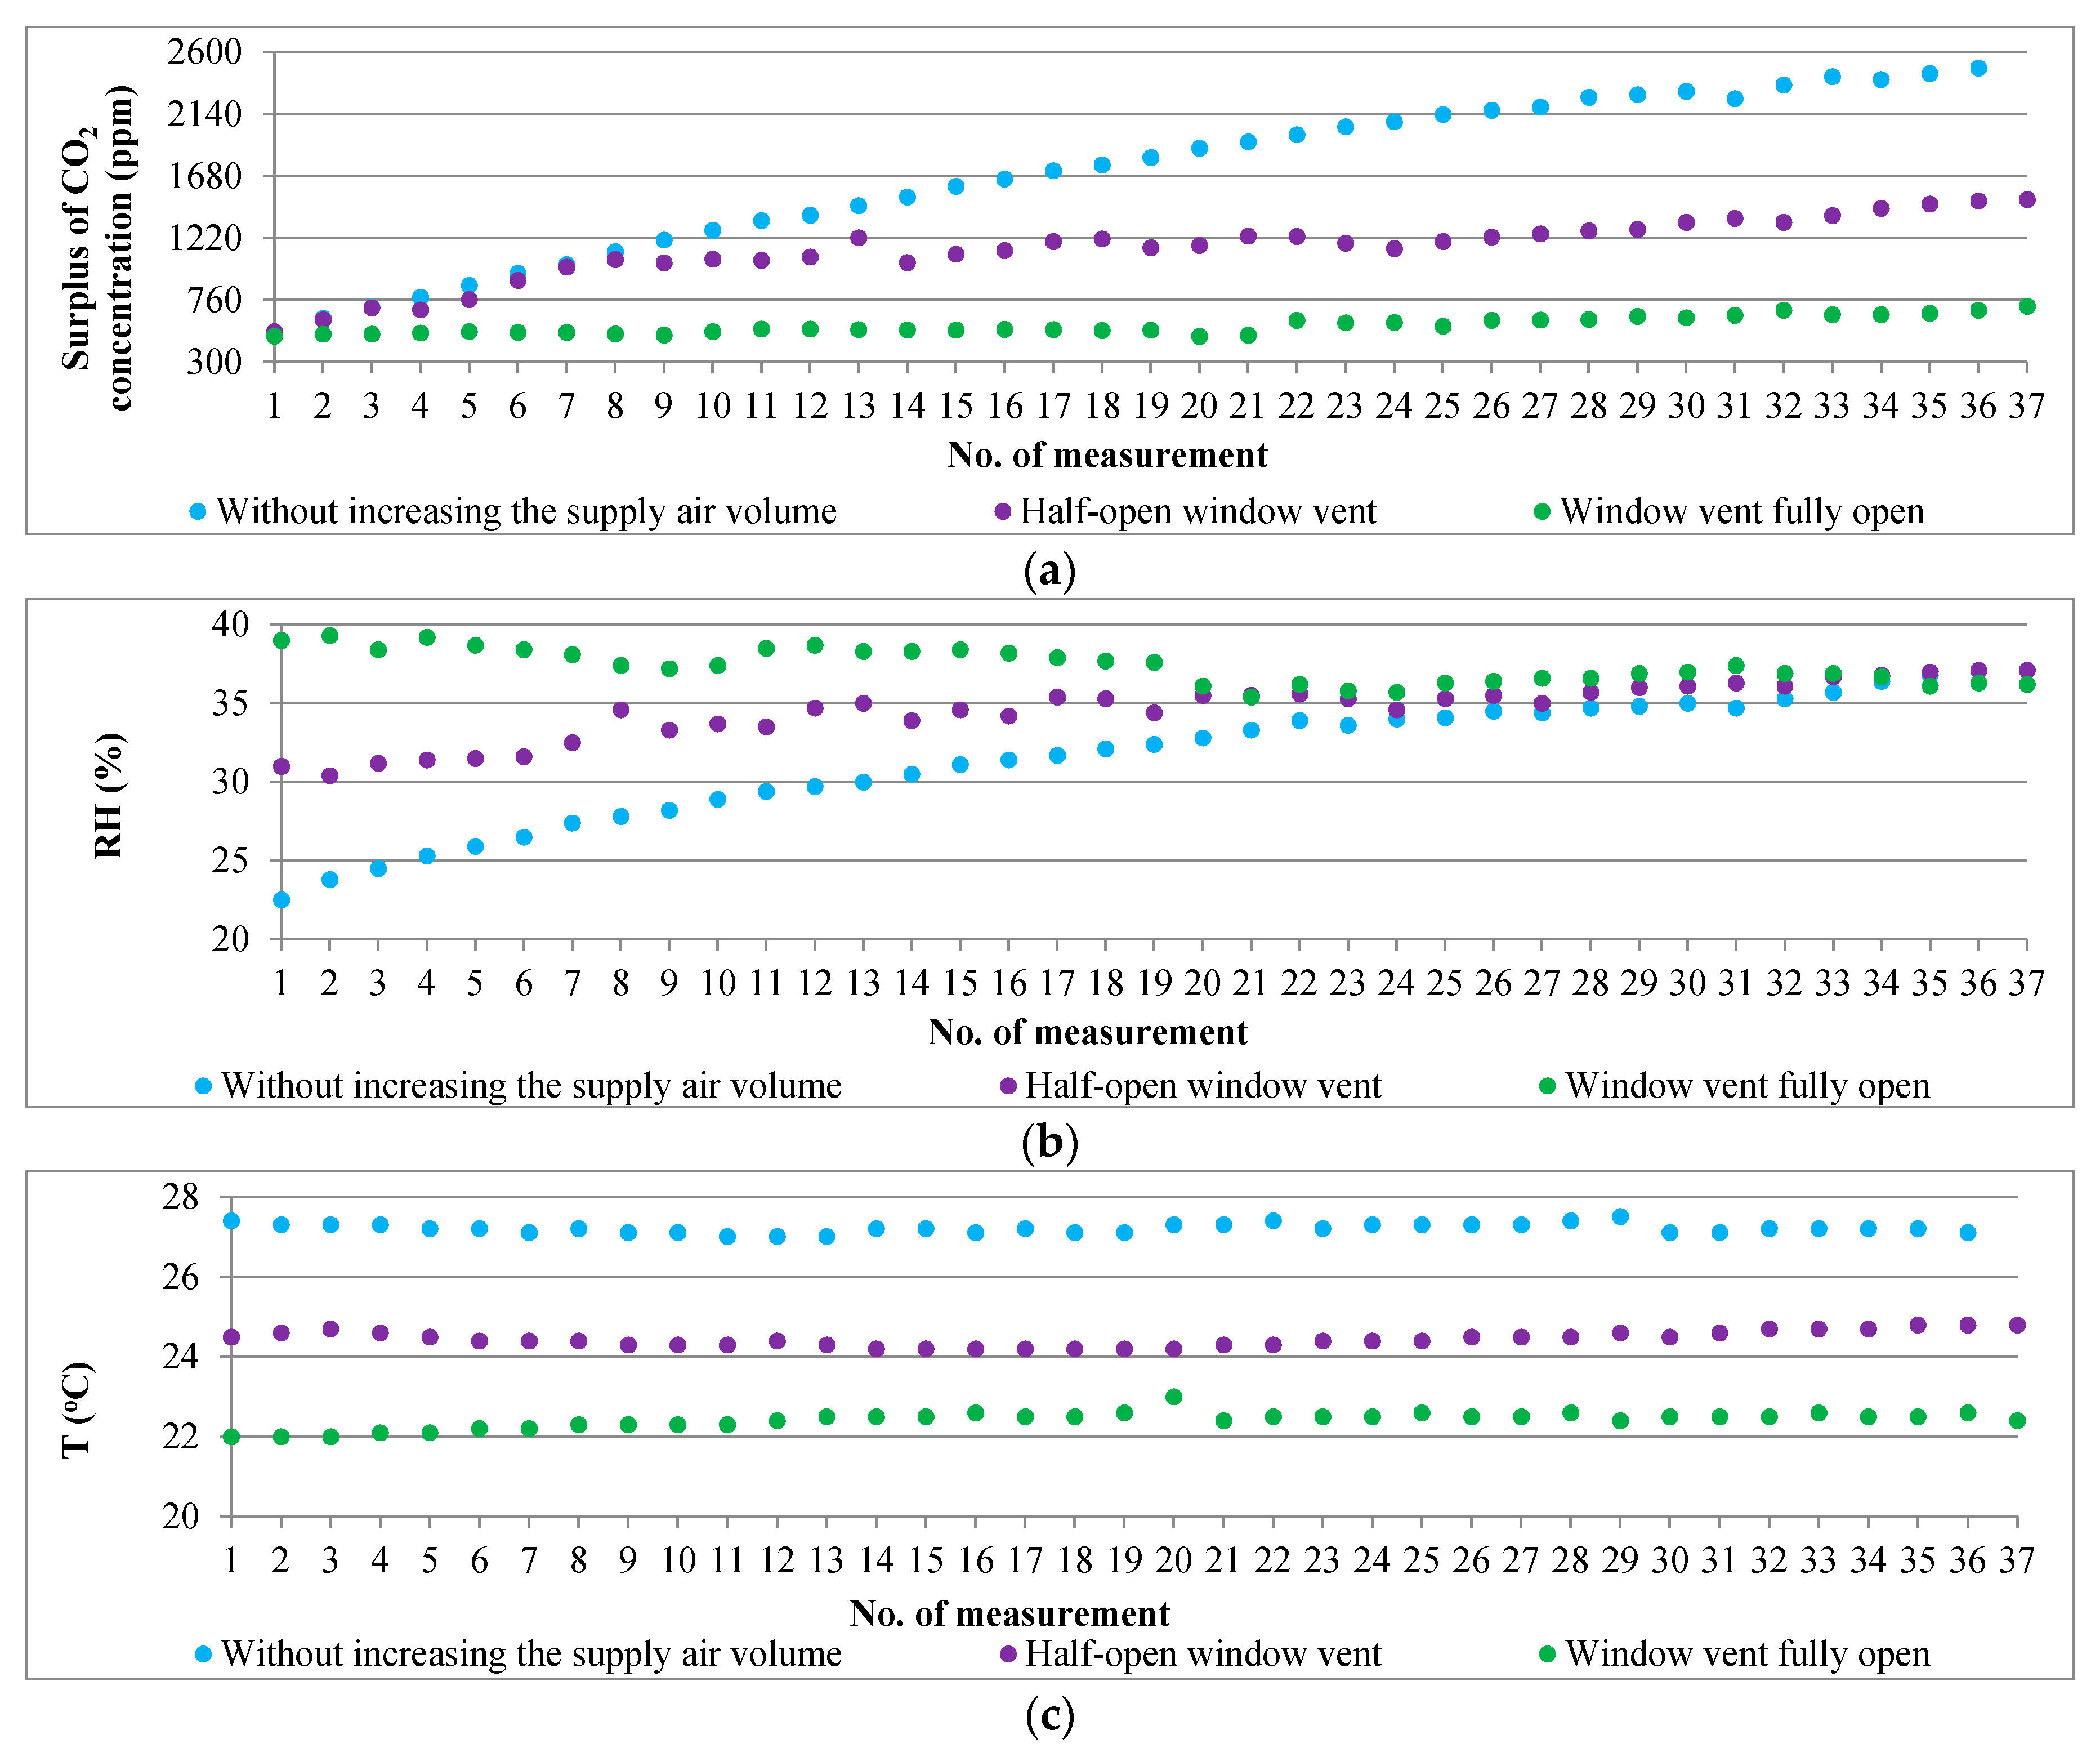
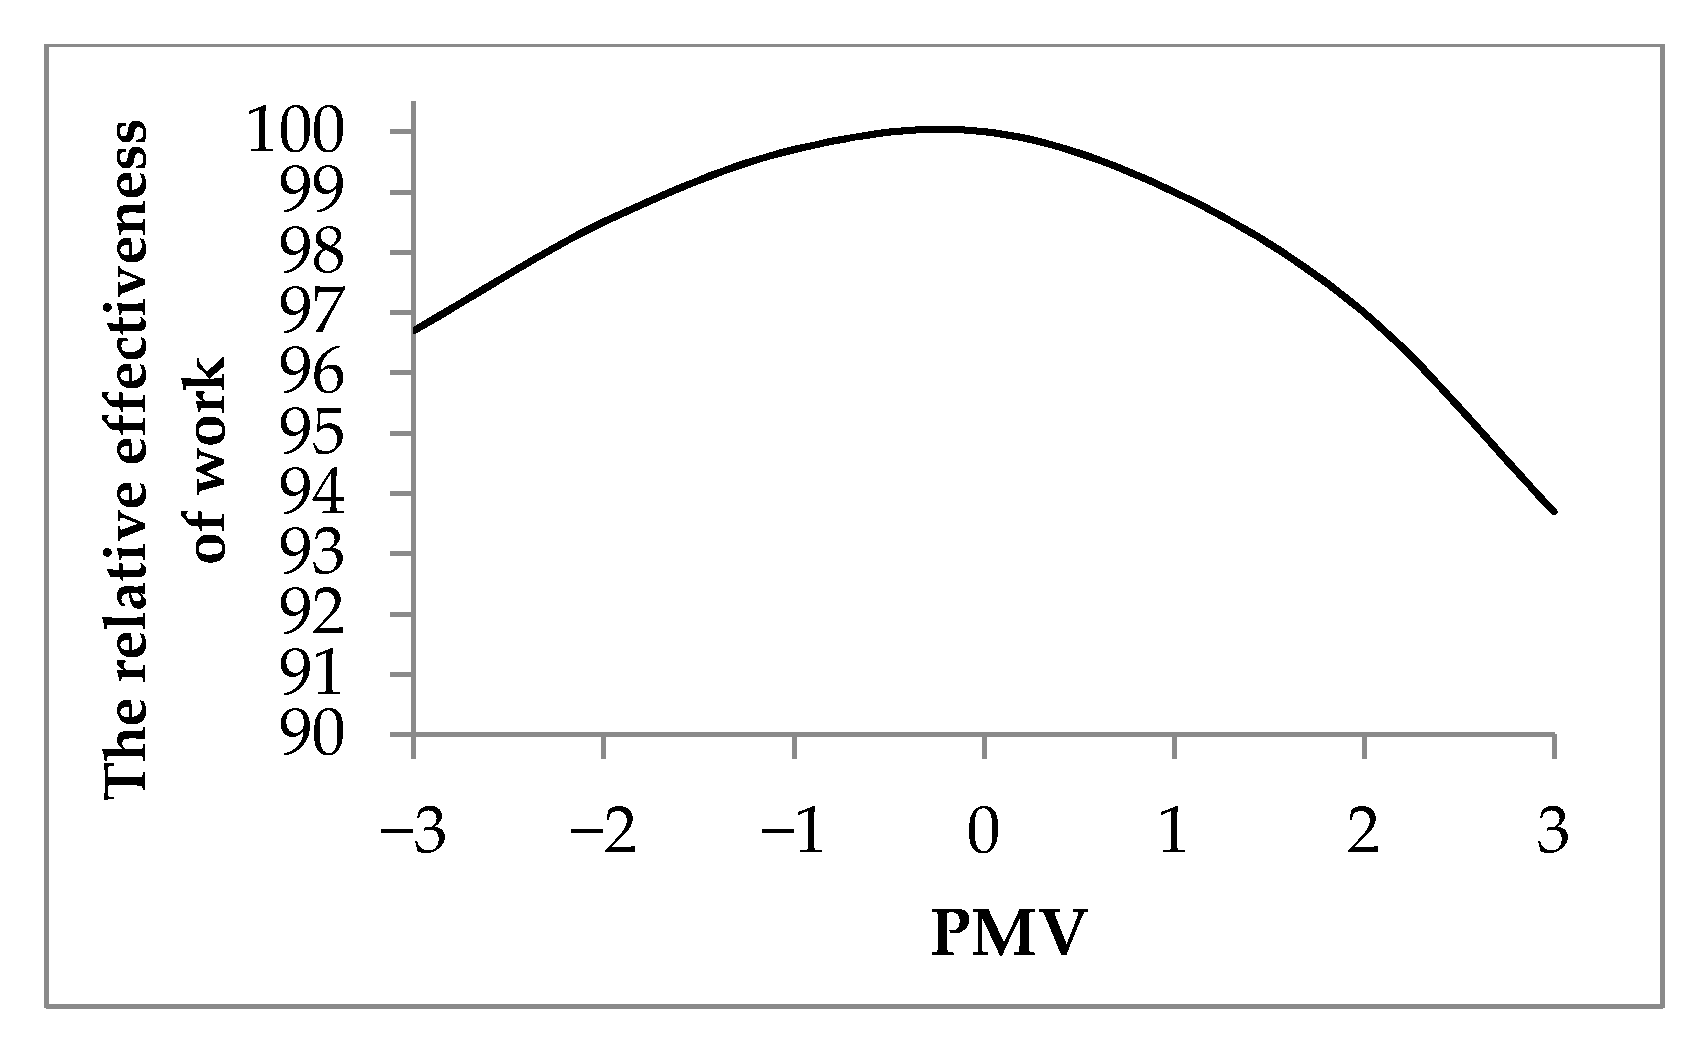
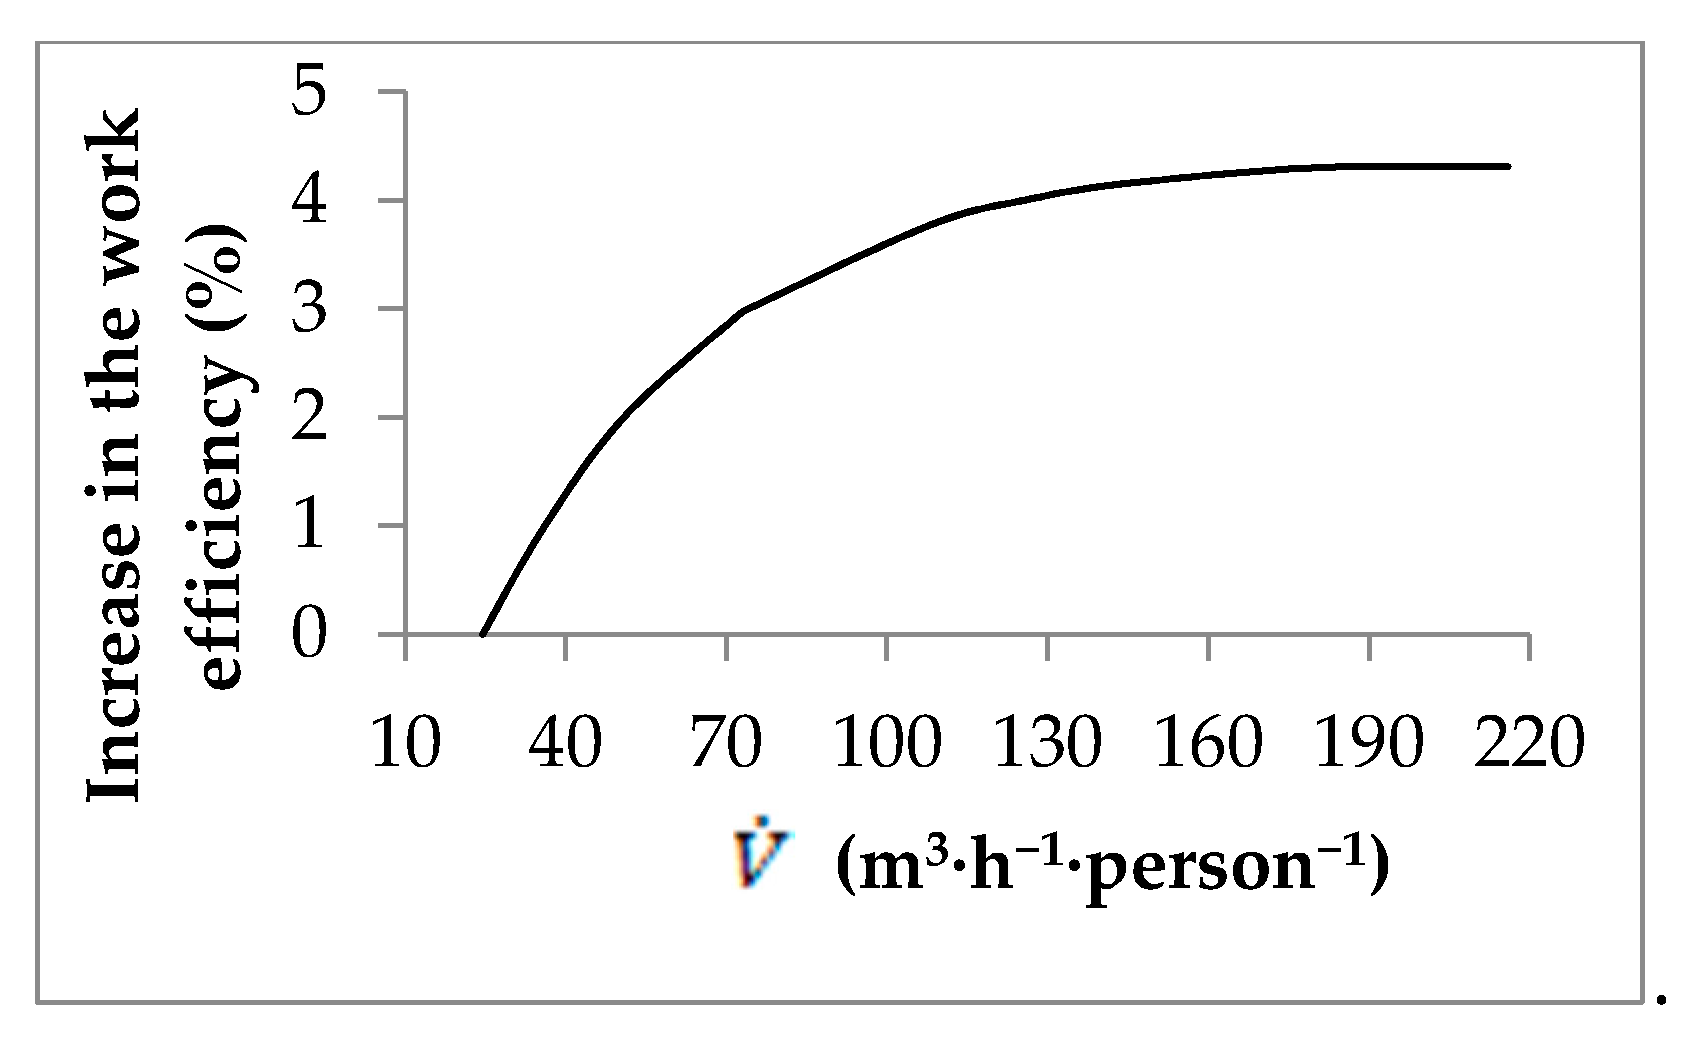
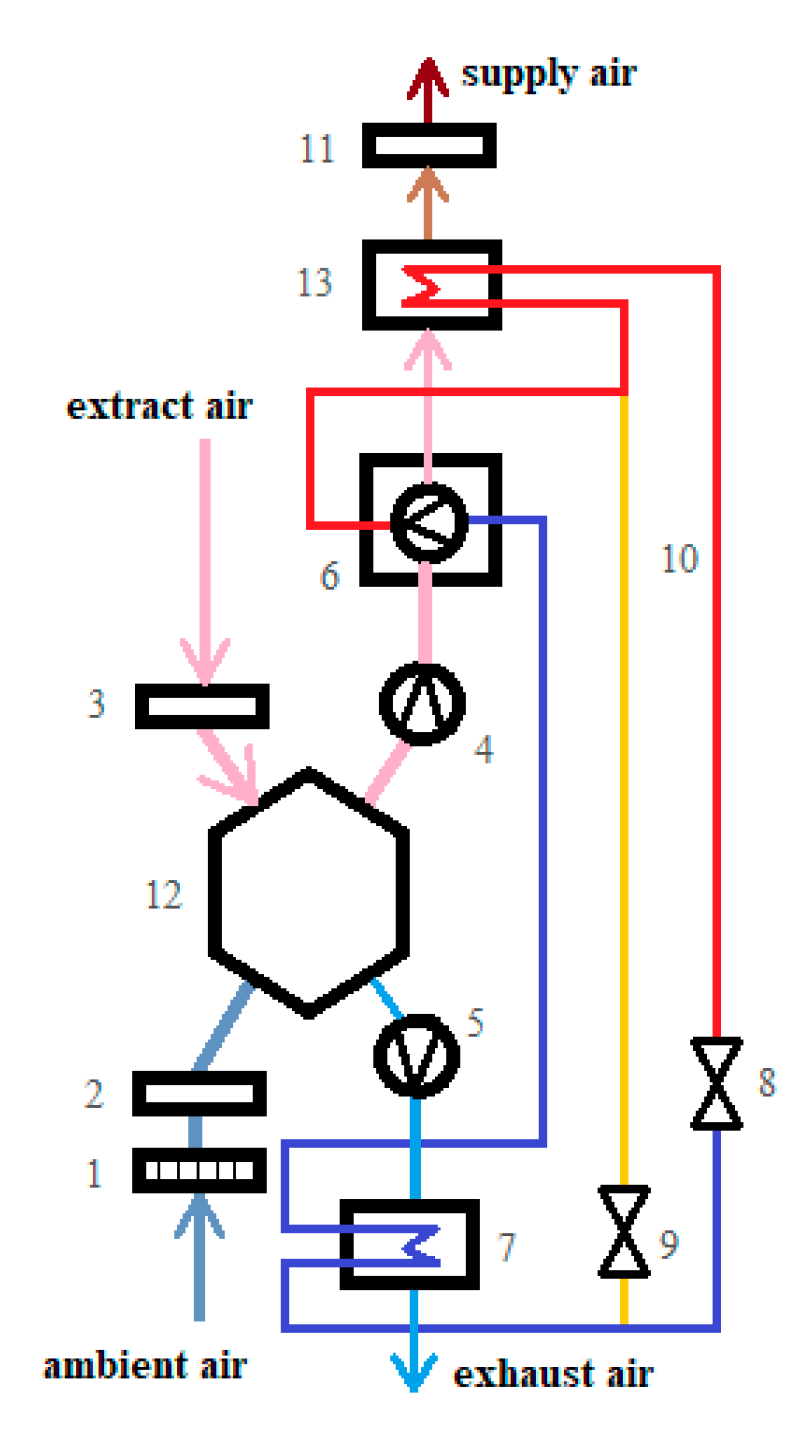
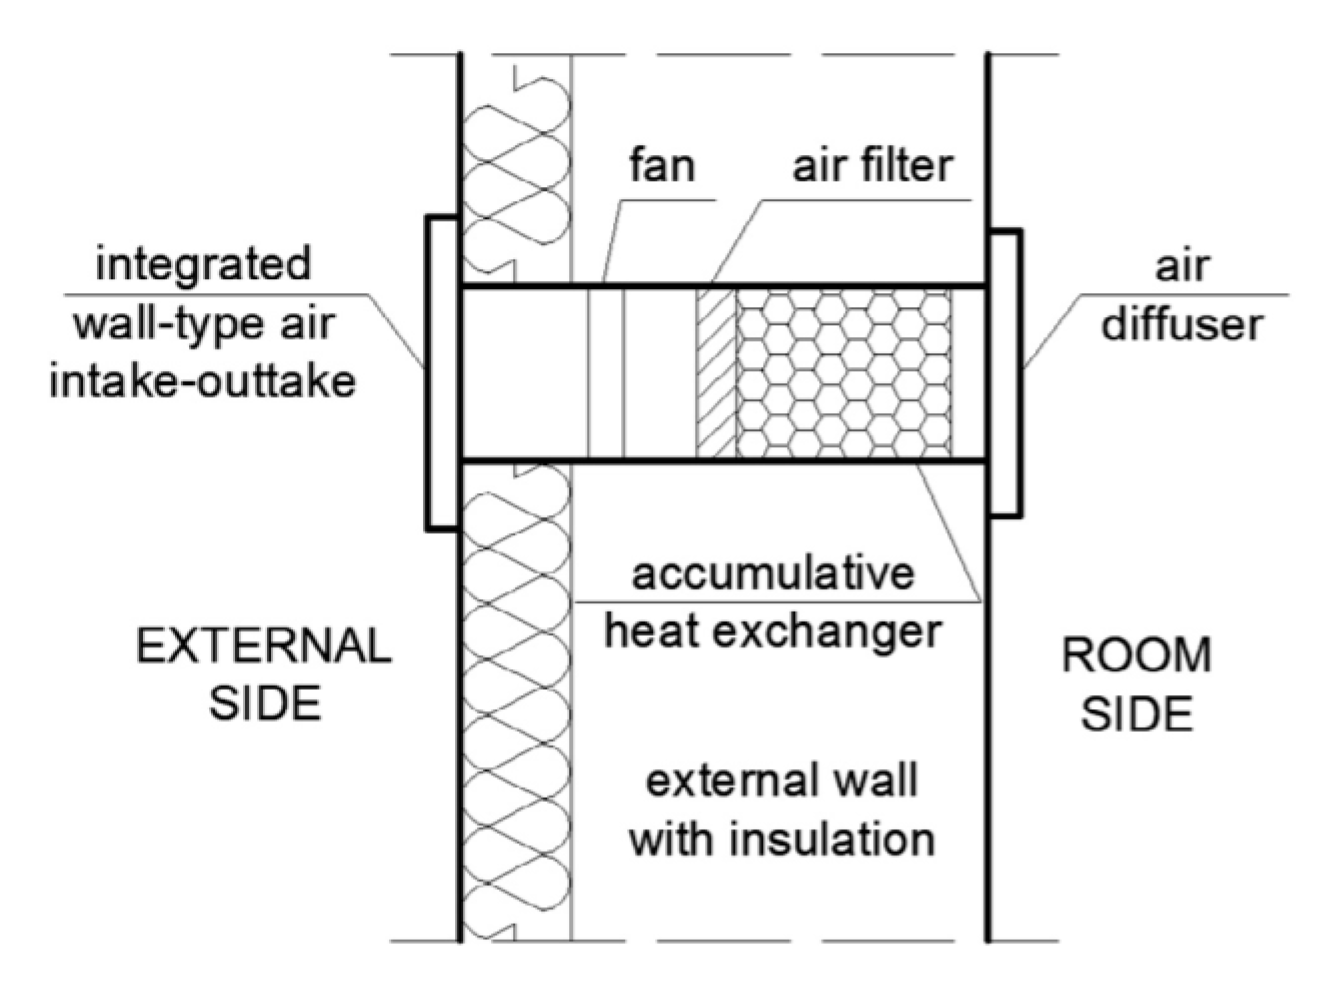
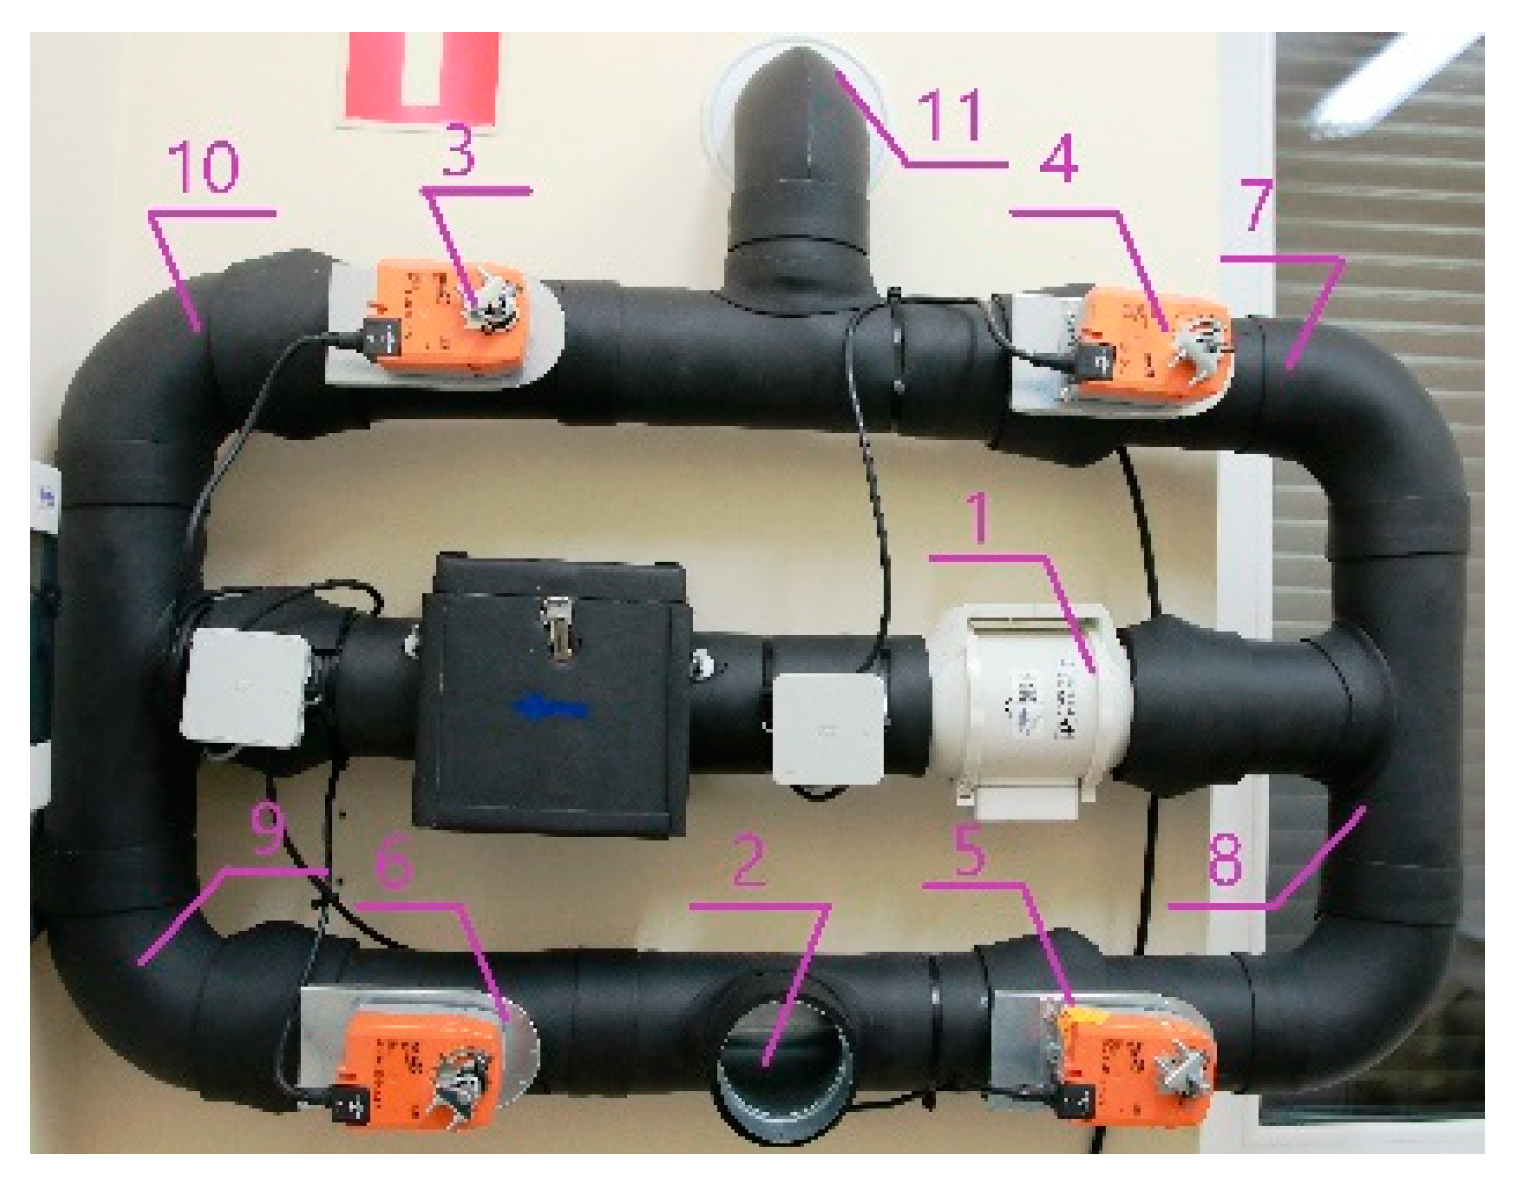
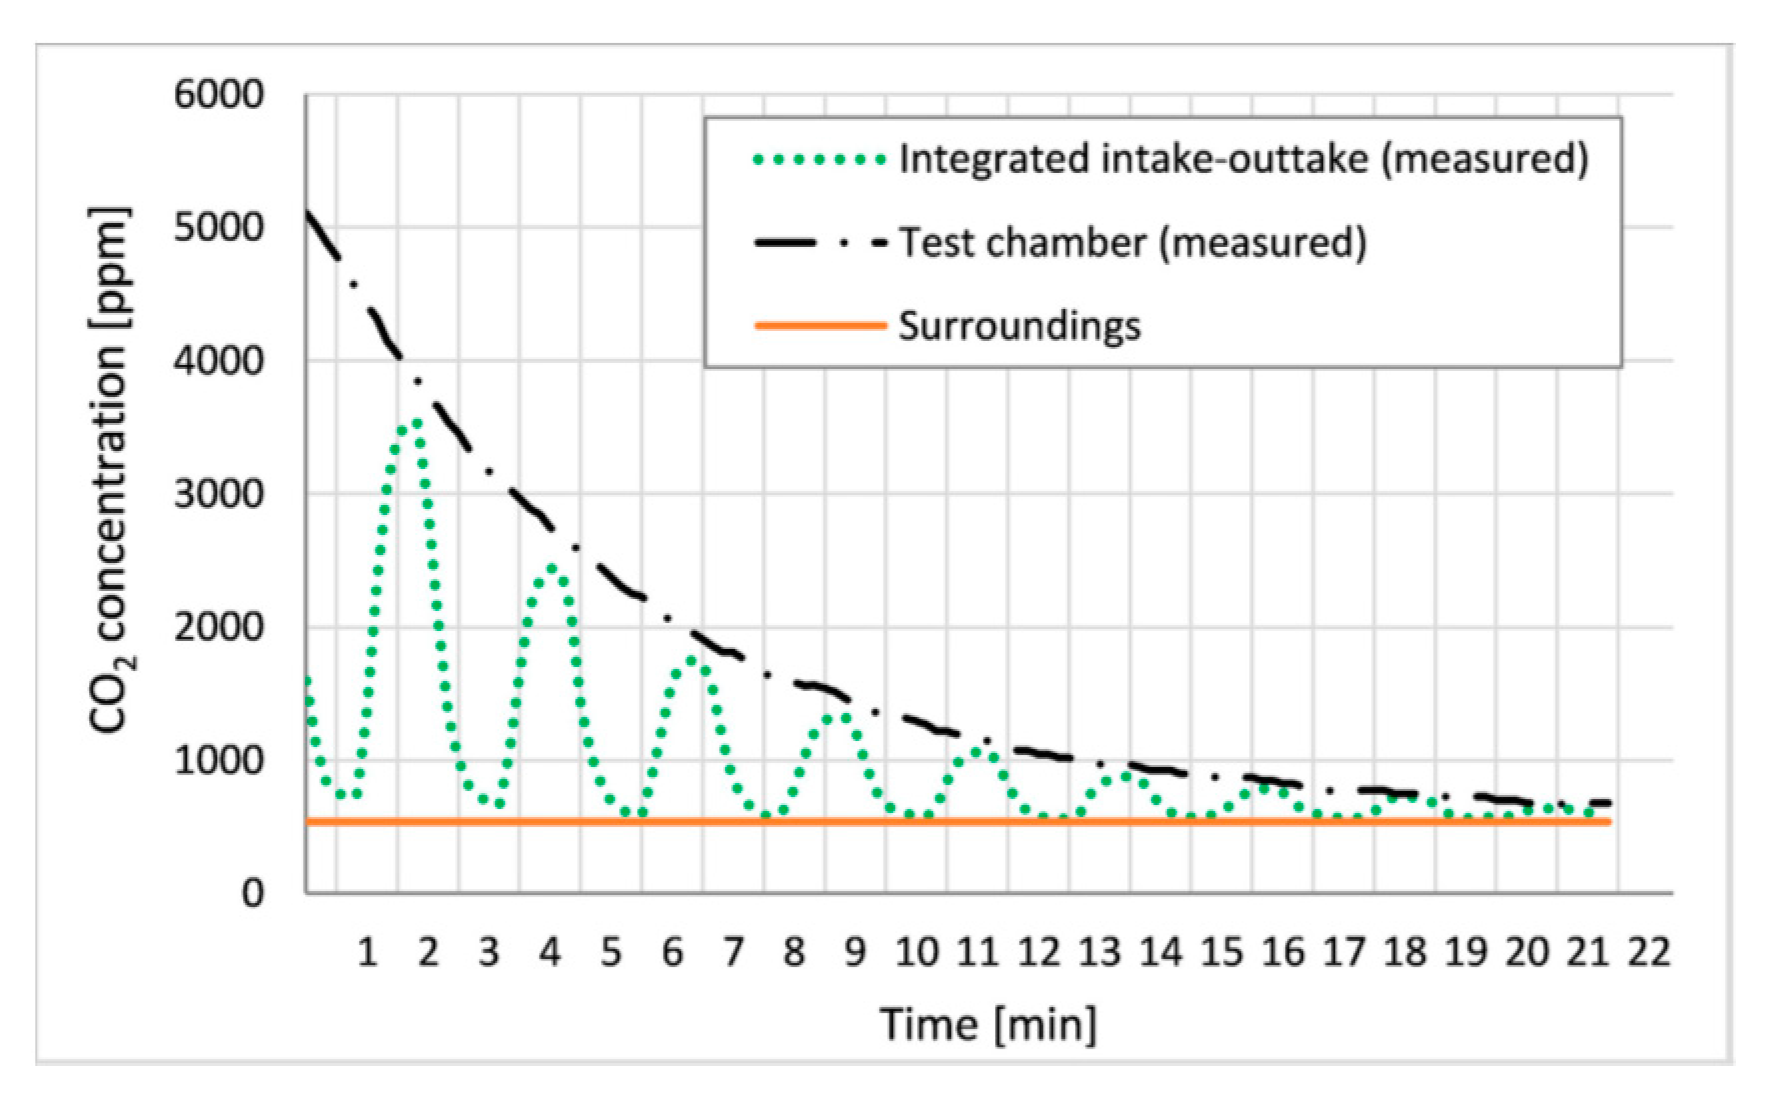
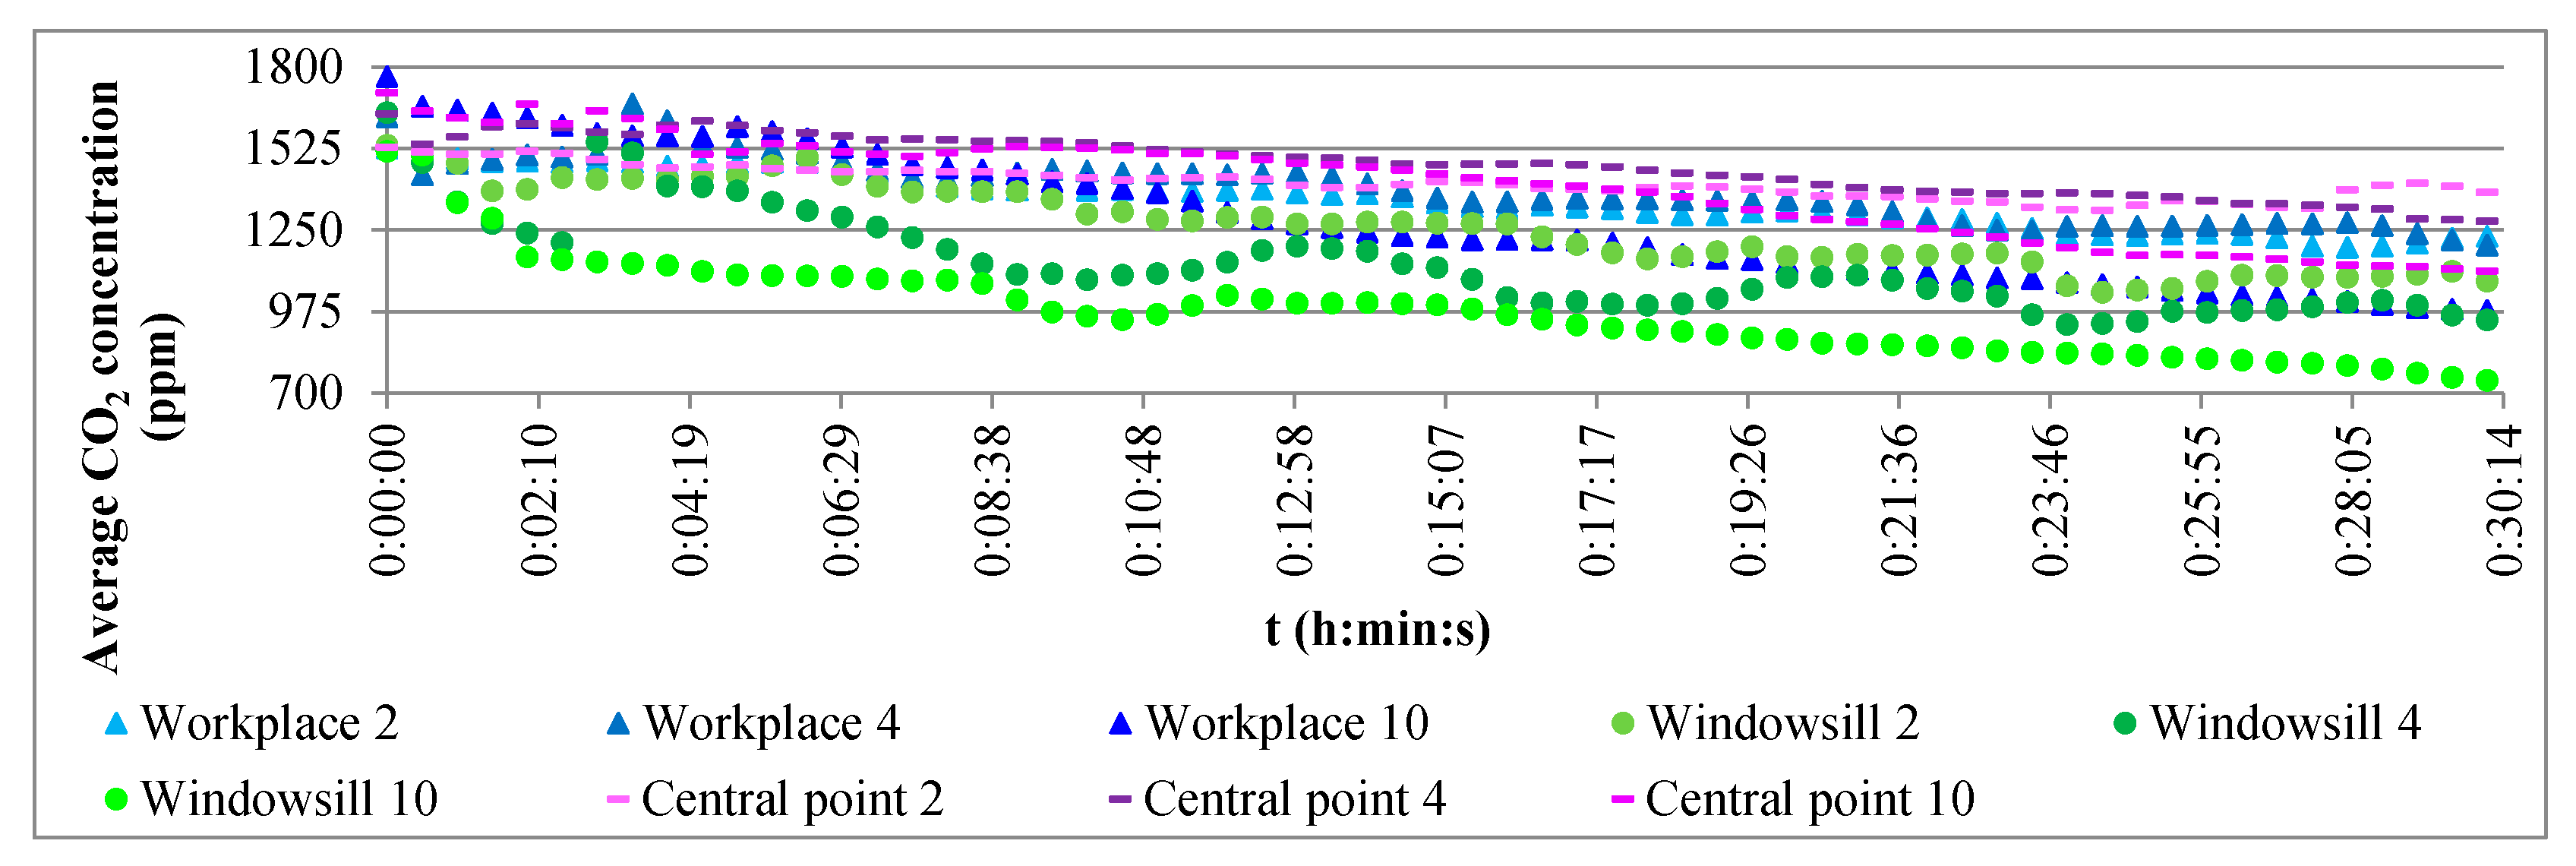
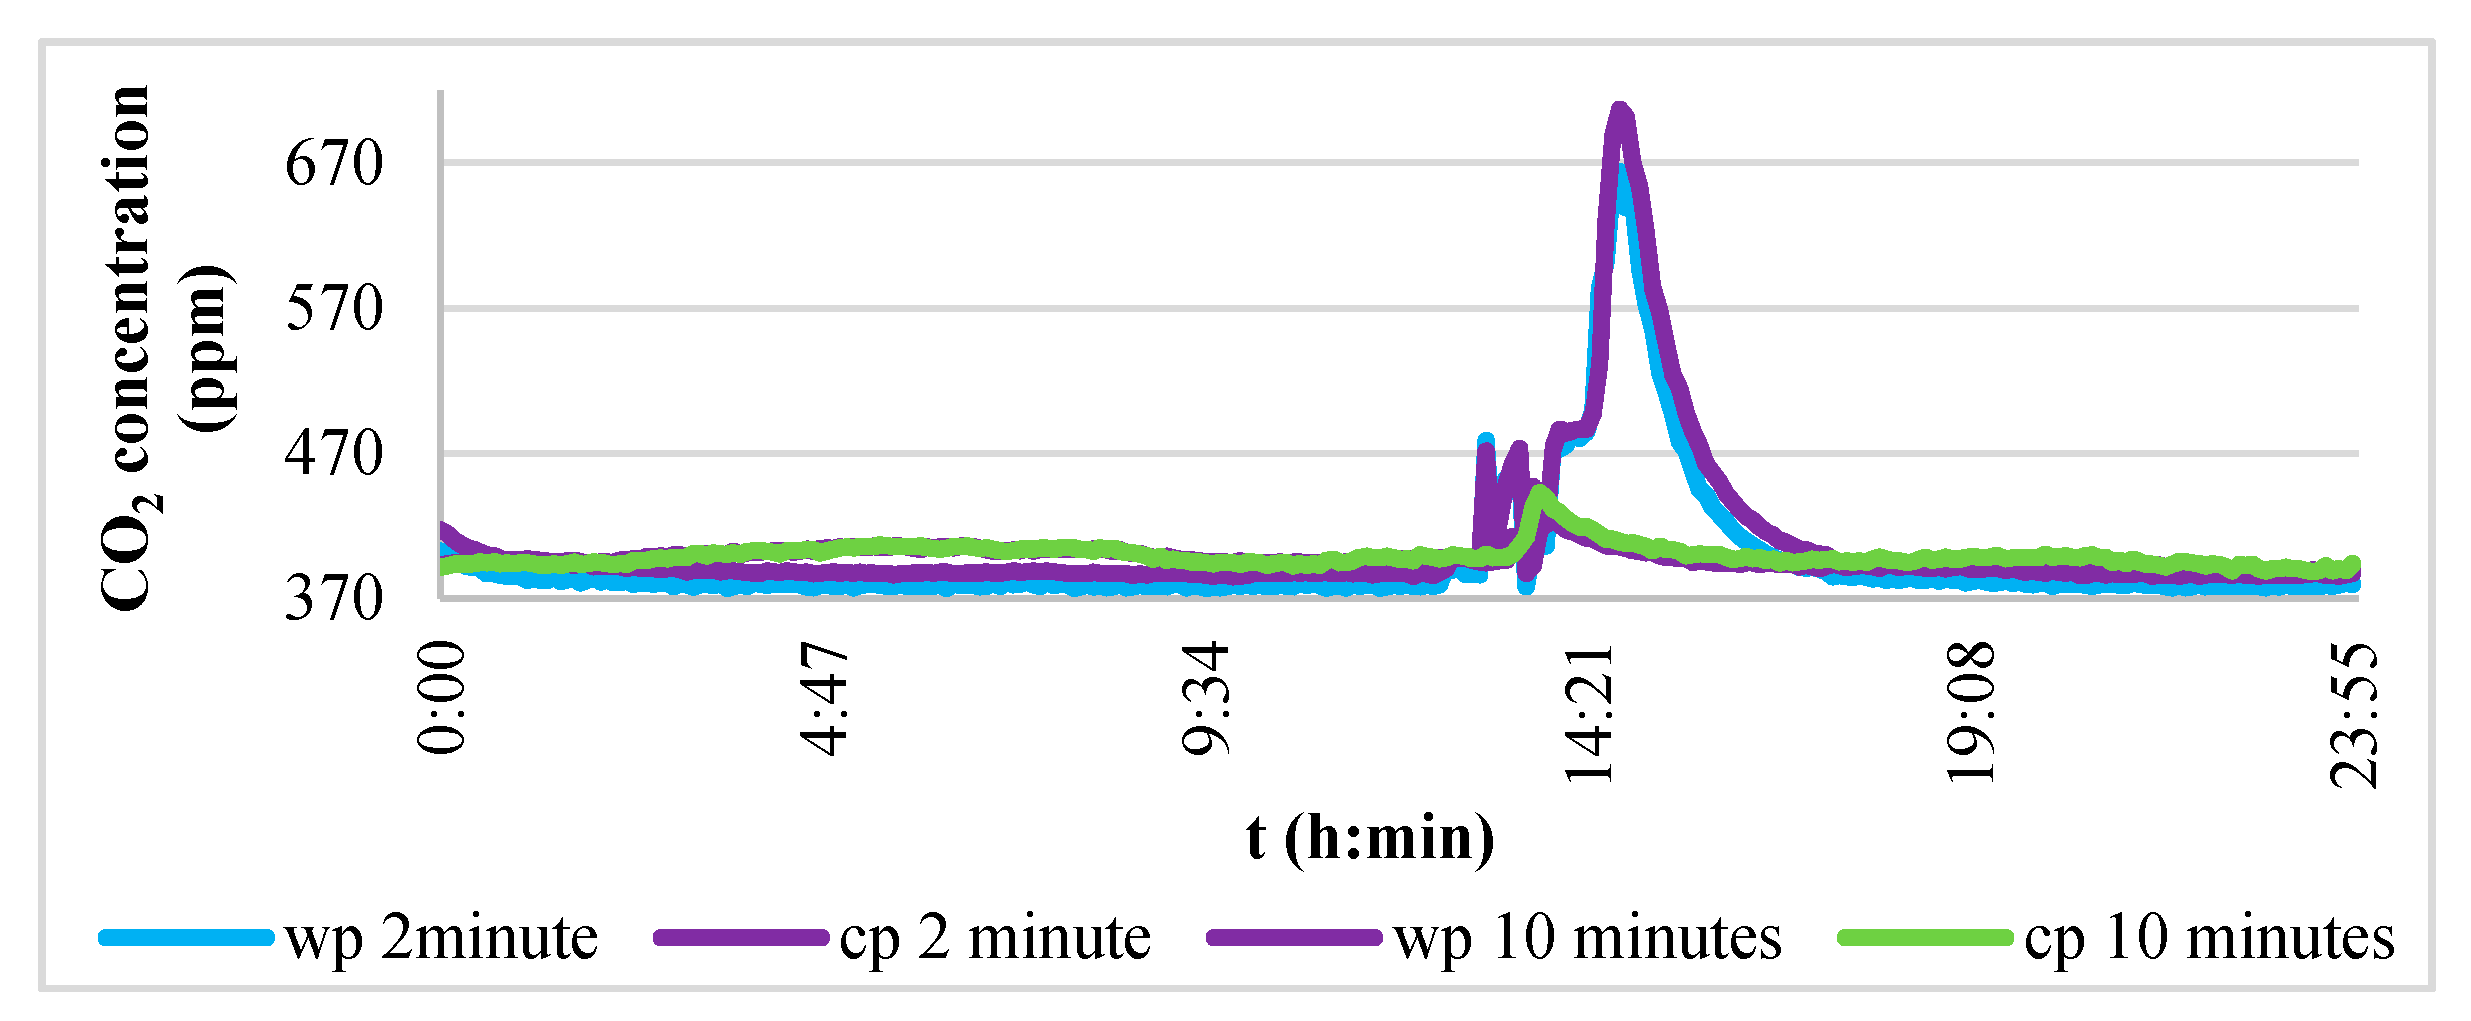
Table 1.
The classification of organic pollutants of indoor air [54].
Table 1.
The classification of organic pollutants of indoor air [54].
| A Group of Compounds | Boiling Point (°C) |
|---|---|
| VOC—Volatile Organic Compounds | 50–100 ÷ 240–260 |
| SVOC—Semi Volatile Organic Compounds | 240–260 ÷ 380–400 |
| POM—Particulate Organic Matter | >380 |
Table 2.
Total volatile organic compounds (TVOC) concentration in indoor air and their health harmfulness [55].
Table 2.
Total volatile organic compounds (TVOC) concentration in indoor air and their health harmfulness [55].
| The Concentration of TVOC μg·m−3 | The Degree of Harmfulness |
|---|---|
| <100 | Potentially harmless |
| 200–300 | Potentially harmful |
| 300–5000 | Harmful to health |
Publisher’s Note: MDPI stays neutral with regard to jurisdictional claims in published maps and institutional affiliations. |
© 2021 by the author. Licensee MDPI, Basel, Switzerland. This article is an open access article distributed under the terms and conditions of the Creative Commons Attribution (CC BY) license (http://creativecommons.org/licenses/by/4.0/).
Share and Cite
MDPI and ACS Style
Zender-Świercz, E. Review of IAQ in Premises Equipped with Façade–Ventilation Systems. Atmosphere 2021, 12, 220. https://0-doi-org.brum.beds.ac.uk/10.3390/atmos12020220
AMA Style
Zender-Świercz E. Review of IAQ in Premises Equipped with Façade–Ventilation Systems. Atmosphere. 2021; 12(2):220. https://0-doi-org.brum.beds.ac.uk/10.3390/atmos12020220
Chicago/Turabian StyleZender-Świercz, Ewa. 2021. "Review of IAQ in Premises Equipped with Façade–Ventilation Systems" Atmosphere 12, no. 2: 220. https://0-doi-org.brum.beds.ac.uk/10.3390/atmos12020220
Note that from the first issue of 2016, this journal uses article numbers instead of page numbers. See further details here.