
Carbon Neutrality Pathways Effects on Air Pollutant Emissions: The Portuguese Case


CENSE—Center for Environmental and Sustainability Research, NOVA School of Science and Technology, NOVA University Lisbon, Campus de Caparica, 2829-516 Caparica, Portugal
*
Author to whom correspondence should be addressed.
Atmosphere 2021, 12(3), 324; https://0-doi-org.brum.beds.ac.uk/10.3390/atmos12030324
Submission received: 15 January 2021
/
Revised: 19 February 2021
/
Accepted: 25 February 2021
/
Published: 2 March 2021
(This article belongs to the Special Issue Climate Change and Air Pollution in Portugal)
Abstract
:Air pollution and climate change are closely interlinked, once both share common emission sources, which mainly arise from fuel combustion and industrial processes. Climate mitigation actions bring co-benefits on air quality and human health. However, specific solutions can provide negative trade-offs for one side. The Portuguese Carbon Neutrality Roadmap was developed to assess conceivable cost-effective pathways to achieve zero net carbon emissions by 2050. Assessing its impacts, on air pollutant emissions, is the main focus of the present work. The bottom-up linear optimization energy system the integrated MARKAL-EFOM system (TIMES) model was selected as a modeling tool for the decarbonization scenarios assessment. The estimation of air pollutant emissions was performed exogenously to the TIMES model. Results show that reaching net zero greenhouse gas (GHG) emissions is possible, and technologically feasible, in Portugal, by 2050. The crucial and most cost-effective vector for decarbonizing the national economy is the end-use energy consumption electrification, renewable based, across all end-use sectors. Decarbonization efforts were found to have strong co-benefits for reducing air pollutant emissions in Portugal. Transport and power generation are the sectors with the greatest potential to reduce GHG emissions, providing likewise the most significant reductions of air pollutant emissions. Despite the overall positive effects, there are antagonistic effects, such as the use of biomass, mainly in industry and residential sectors, which translates into increases in particulate matter emissions. This is relevant for medium term projections, since results show that, by 2030, PM2.5 emissions are unlikely to meet the emission reduction commitments set at the European level, if no additional control measures are considered.
1. Introduction
Ambient air pollution is harmful to the environment and human health, being a local, regional, and hemispheric issue. Climate change is a global challenge driven by the observed increase in atmospheric greenhouse gas concentrations, as a result of emissions from human activities. Most air pollutants (APs) and greenhouse gases (GHGs) are closely interlinked, once they have common sources, which mainly arise from fuel combustion and industrial processes [1]. Reductions in GHG emissions can bring ancillary benefits of improved air quality and reduced premature mortality, in addition to slowing climate change [2,3]. Moreover, air quality co-benefits on morbidity, mortality, and agriculture could globally offset the costs of climate policy [4].
In Europe, emissions of many air pollutants have decreased substantially over the past decades, however, air quality problems persist [5]. A significant proportion of Europe’s population live in areas, especially cities, where exceedances of air quality standards occur. Around 90% of city dwellers in Europe are exposed to pollutants at concentrations higher than the air quality levels deemed harmful to health [5].
Warming of the climate system is unequivocal and the primary cause of this warming is GHG emissions from burning fossil fuels [6]. In order to prevent the most severe impacts of climate change, the Paris Agreement opened a new phase in global climate action, identifying the need to achieve carbon neutrality, by the middle of the 21st century, as a condition to ensure that, by the end of this century, the increase in the global average temperature is held below 2 °C, compared to preindustrial levels, and to pursue efforts to limit the temperature increase up to 1.5 °C [7].
Climate change mitigation actions can provide co-benefits on air quality and human health [8], such as energy efficiency and renewable energies. Although climate mitigation and air pollution policies can be complementary, specific solutions can provide negative trade-offs [9]. Some options that target energy consumption decarbonization, such as biomass combustion and other biofuels, for home heating or transport, can increase particulate matter emissions, including black carbon, and thus endure harm to human health and potentially warm the climate [10].
Emissions from additional non-energy sectors are also important, as is the case of the agriculture sector (regarding methane, nitrous oxide, and black carbon emissions), contributing to important health and climate impacts [11]. A broad and integrated perspective is needed when tackling climate change and air pollution, including all economic sectors, to maximize benefits for climate and health [12,13].
During the twenty-second session of the Conference of the Parties (COP 22) Portugal publically affirmed its commitment to attain net zero GHG emissions, by the end of the first half of the century. To do so the Portuguese Carbon Neutrality Roadmap (CNR2050) [14] project was developed to assess conceivable pathways, integrating all socioeconomic sectors, to achieve zero net carbon emissions by 2050. The CNR2050 was approved by the Portuguese Government with the publication of the Resolution of the Council of Ministers 107/2019.
The CNR2050 explored the range of feasible technologies, economically viable, and socially acceptable strategies, to attain this national deep decarbonization. An overview of the CNR2050 main results is presented and discussed in this paper. The effects of carbon neutrality trajectories, and correspondent solutions, on air pollutant emissions in Portugal were performed additionally to the CNR2050, and those results are the main focus of the present work. Considering the relationship between GHG and AP emission sources, the analysis of the effects of deep decarbonization pathways and associated strategies is highly relevant, to enhance potential benefits and reduce negative trade-offs.
2. Materials and Methods
Projecting the effects of carbon neutrality pathways on air pollutant emissions required multiple tasks, which may be divided in three main steps: (i) the development of socioeconomic scenarios; (ii) the estimation of greenhouse gas emissions, and (iii) the estimation of air pollutants emissions (Figure 1). The two first steps were developed under the CNR2050 methodology, having as a starting point the development of coherent socioeconomic scenarios, based on narratives of possible developments of Portuguese society, up to 2050. These scenarios have been widely discussed with several stakeholders and their main socioeconomic drivers (e.g., GDP growth, demography) have been validated by public entities such as the Bank of Portugal, Ministries of Economy, and Finances and the National Statistics Office.
Three distinct core socioeconomic scenarios have been designed, describing different visions of the country’s development (e.g., production profile, population evolution, spatial planning, energy, and climate policy). The configuration of these different trajectories resulted from prospective analysis, based on macroeconomic, demographic, and technological scenarios, and also on active participation of several stakeholders from different fields of expertise. The prospective analysis was focused on: (a) energy system, including buildings, industry, and transports and mobility; (b) agriculture, land use, and forests; and (c) waste, being also considered options, and different integration levels, of circular economy features (transversal to most economic sectors).
2.1. Storylines and Socioeconomic Scenarios
To explore the technological feasible, economic viability, and the socially acceptable neutrality pathways, the referred three distinct socioeconomic evolution scenarios considered were Yellow Jersey (YJ), Pack (P), and Off Track (OT), with a cycling analogy, reflecting distinct economic activity and climate action levels. These scenarios are characterized by the following:
- The Off Track scenario is characterized by the maintenance of society and economy structure, population is concentrated in large metropolitan areas (with depopulation of medium-sized cities); and by the continuity of current energy/climate policies, which do not guarantee carbon neutrality. Socioeconomic indicators are: (i) average annual GDP growth of around 0.9% from 2020 onwards and (ii) population increase of −0.6%/year;
- The Pack scenario considers economic growth led by a greater integration/alignment of Portugal within the international circuits; the production structure and population living standards do not change significantly, with services lead by tourism representing the biggest sector on economy; there is an higher population concentration in large urban and peri-urban areas; a deep environmental conscience and severe mitigation policies are adopted towards carbon neutrality up to 2050; economic circularity levels are high (but less than in the YJ scenario). Its socioeconomic indicators, until 2050, are: (i) average annual GDP growth of around 1.3% from 2020 onwards and (ii) population increase of −0.4%/year;
- The Yellow Jersey scenario reflects structural changes in production chains associated with the knowledge and creative industry, which leads to an increase of the industry weight in the national GDP; a more decentralized economic growth, with less population concentrated in large metropolitan areas (development of medium-sized cities); a deep environment conscience and severe mitigation policies towards a decarbonization path compatible with carbon neutrality; a strong adoption of circular economy, leading to higher efficiency levels and higher recover and recycling rates. Its socioeconomic growth path until 2050 is characterized by: (i) average annual GDP growth of around 1.7% from 2020 onwards and (ii) population increase of −0.01%/year.
The characteristics of each scenario are represented in Figure 2.
2.2. Energy System Modeling
The bottom-up linear optimization energy system the integrated MARKAL-EFOM system (TIMES) model was selected as a modeling tool for the development of decarbonization scenarios for the energy system. TIMES (the integrated MARKAL-EFOM system) was developed and maintained by the energy technology systems analysis from International Energy Agency. The goal of the model is the satisfaction of the energy services demand at the minimum total system cost, subject to technological, physical, and policy constraints. To do so, the model makes simultaneous choices regarding technology investment, primary energy supply, and energy trade.
The technological peer-reviewed model TIMES_PT [15] was used to evaluate the future penetration of different cost-effective technological options in each of the three storylines/scenarios. The TIMES_PT model represents the whole Portuguese energy system and its possible long-term developments. It takes an integrated energy system, from services demand (in industry, residential/commercial/services, transport, and agriculture sectors), to supply sectors (power and heat production), and to decide over a portfolio of energy technologies, following cost-effective criteria.
The model incorporates an extensive technological database covering current and emergent, demand, and supply technologies. They are characterized in terms of technical (e.g., efficiency, lifetime, availability, and starting year) and economic (e.g., investment, operation, and maintenance costs) features. All scenarios consider three main technological assumptions: no nuclear energy and no bio-energy with carbon capture and storage (BECCS) are available, due to current Portuguese political options, and no electricity imports from 2020 onwards as only the Portuguese energy system is being modeled.
TIMES_PT includes more than 60 end-use demand categories (e.g., lighting, heating, private car short distance, paper and pulp, food, and beverage) associated with five end-use sectors mentioned above: industry, residential, services, agriculture (only energy related activity), and transport.
The demand is triggered by services and product needs, determined exogenously, through bottom-up and top-down approaches as described in previous work [16]. Demand projections consider the evolution of specific socioeconomic indicators (e.g., population, sector gross value added, private consumption, and buildings characteristics, among others) and other parameters according to the rationale underlying each storyline/scenario. Some examples on how the rationale linked to each storyline is translated in energy services demand, and other TIMES_PT parameters, include [17,18]:
- Industry: higher circular economy in YJ than in P and OT is reflected on lower cement production/per capita due to more efficient construction procedures and new materials. YJ also considers higher recycling rates on paper and glass industries and construction and demolition, which influences the technological choices (for example the clinker/cement ratio in cement industries). A modern industry in YJ is reflected in the gross value added of new industries and consequently has higher energy demand, and higher needs for electricity for robotization;
- Residential buildings: the urban character of P results in smaller houses comparing to more rural and decentralized YJ, with the latter displaying a higher demand for heating and cooling due to bigger houses;
- Transports and mobility: the high digital and technological development in P and YJ scenarios, promoting the emergence of new business models such as Mobility-as-a-Service schemes, were converted into high shares of shared vehicles and associated short distanced travelled. The previous condition also allowed one to associate different autonomous vehicles technology penetration between scenarios that in turn were translated in more distance travelled and higher vehicle occupancy rates. The P scenario is characterized by a more urbanized country than YJ, providing conditions for pedestrian and bicycle use, translated into lower use/mobility demand satisfied by passenger vehicles.
The environment component of the model includes main GHG (CO2, CH4, N2O, and F-gases) emissions factors. In line with the storylines, the following climate policy decisions for the energy system have been considered: i) for OT it was assumed the extension of 2020 climate policy goals to the long term, assuming a stagnation of CO2 price at 20€’16/t for EU-ETS sector and ii) for YJ and P “Portugal implements severe climate mitigation policies (…) towards a decarbonization path compatible with carbon neutrality”, which implies, for the case of the energy system, a constant reduction of GHG up to a cap of −90% by 2050 compared to 2005 values (with an intermedium reduction of −60% in 2030, comparable to the goals set in the National Energy Action Plan, approved by the Portuguese Government with the publication of the Resolution of the Council of Ministers 53/2020). To cope with the global GHG emissions cap, the model computes endogenously the reduction, per sector, according to the cost-effectiveness of the decarbonization options.
Since TIME-PT does not include other pollutants, a soft link was further developed to estimate, exogenously to the model, the correspondent air pollutant emissions as explained below. In this case, no National Air Pollution Control Plans have been considered.
2.3. Agriculture and Waste
For these two non-energy sectors, GHG emissions were estimated based on assumptions, aligned with the narratives of the socioeconomic scenarios, exogenously to the model.
For agriculture, forests and other land uses sector, distinct evolutionary trends for crops and animal production were established, being calculated their respective GHG emissions. This sector includes livestock emissions and manure management systems, fertilizer use, rural fires, and the emissions or sequestration of different land uses.
For the waste and wastewater sector, GHG emissions were estimated based on projections of the volume of municipal and industrial waste and wastewater generated each year, considering the resident population, and the impact of the policies already adopted. This sector includes emissions from the disposal and treatment of urban and industrial solid waste and wastewater.
2.4. Air Pollutant Emissions Projection Estimates
The main air pollutants considered were nitrogen oxides (NOx), carbon monoxide (CO), sulphur oxides (SOx), non-methane volatile organic compounds (NMVOC), ammonia (NH3), and fine particulate matter (PM2.5). Its calculation was performed exogenously to the TIMES_PT model.
The estimates of air pollutant emissions, until 2050, were based on the projection of activity variables. These, in turn, result from the energy services and materials demand scenarios, to accommodate the three main and contrasting paths of evolution of the Portuguese economy.
The followed methodological approach is consistent with national submissions on this subject, namely, with the Portuguese Informative Inventory Report (IIR) [19], in particular regarding specific emission factors (EFs) by fuel type, process emission factors, territorial coverage (only for mainland Portugal, excluding islands), and other approach boundaries (i.e., aviation emissions accountability). For instance, the estimation of air pollutant emissions in the power sector resulted from the application of implicit emission factors, by type of fuel, according to the projection of energy consumption. Regarding the refining activity, this was estimated according to the evolution of the amount of crude processed in the refineries, in future scenarios.
In order to ensure adequate adherence to the national methodology, industry estimates were based on the calculation of implicit emission factors, taking into account the latest available dataset from IIR [19]. Implicit emission factors are expressed as the amount of pollutant emitted by energy consumed (fuel-based), or the amount of pollutant emitted by quantity of produced product (activity-based), associated with each technology and fuel used. These EF reflect the national real operating conditions, accounting for technologies that have already been installed to reduce air pollution. For NMVOC, emissions are dominated by non-energy sources, such as fugitive emissions and process emissions from industry. Regarding this, some additional control and abatement measures were taken into account, namely measures with a mitigation potential in the area of industrial use of solvents, and in the distribution of oil products, simulating the implementation of the Stage II and IB controls at service stations [20].
In the case of road transport sector, the EF used (based on the national IIR) considers current technological conditions (i.e., vehicles stock euro standards shares). These EFs were adjusted to future conditions, reflecting technological and fuel evolution. The emission projection considered TIMES_PT modeling outputs of fleet composition and demand satisfaction. Cold start emissions and evaporative emissions were not included. Non-exhaust emissions (including tire, brake, and road wear) were accounted for, using the European Monitoring and Evaluation Programme/ European Environment Agency Emission Guidebook (shortly referred to as EMEP/EEA Emission Guidebook) [21] EF. For railways, estimates were activity–based and, in the case of shipping and aviation subsectors, the calculations were fuel consumption based.
In residential/commercial/services sector, EMEP/EEA Emission Guidebook EF [21] were used, and others, reflecting emission control and efficiency improvement technologies, to be implemented until 2050. The impacts of approved standards (as the so called Ecodesign Directive, referring to Directive 2009/125/EC) for improved technology efficiency and air pollutant emissions, for PM and NMVOC, were additionally included by considering reductions in emission factors correspondent to new wood burning domestic appliances, beyond 2030.
In the case of agriculture and forestry sectors, its evolution assumed different assumptions, aligned with the socioeconomic scenarios storylines. Emissions from this sector resulted from areas occupied by temporary and permanent crops and livestock, and from the respective vegetable and animal production, and areas occupied by pastures and other uses of agricultural soils. EF were compiled from the EMEP/EEA Emission Guidebook [21] and from the IIR [19].
For the waste sector, the methodology adopted for emissions projections considered the physical quantities of municipal solid waste (MSW) and domestic wastewater annually generated, and the correspondent resident population evolution. Air pollutant emissions from MSW incineration were also estimated and allocated under the energy production sector, in coherence with the national inventory approach. The quantification of industrial waste was based on the projections of industrial production, by activity sector.
Recently, a revision of air pollutant emissions estimates was carried out, considering the recent updates in the IIR, submitted in 2020 [22], which brought significant changes, namely for the emissions of non-methane volatile organic compounds (NMVOC). In the current paper the updated version of estimates is presented.
3. Results and Discussion
3.1. Decarbonization Transitions by Sector
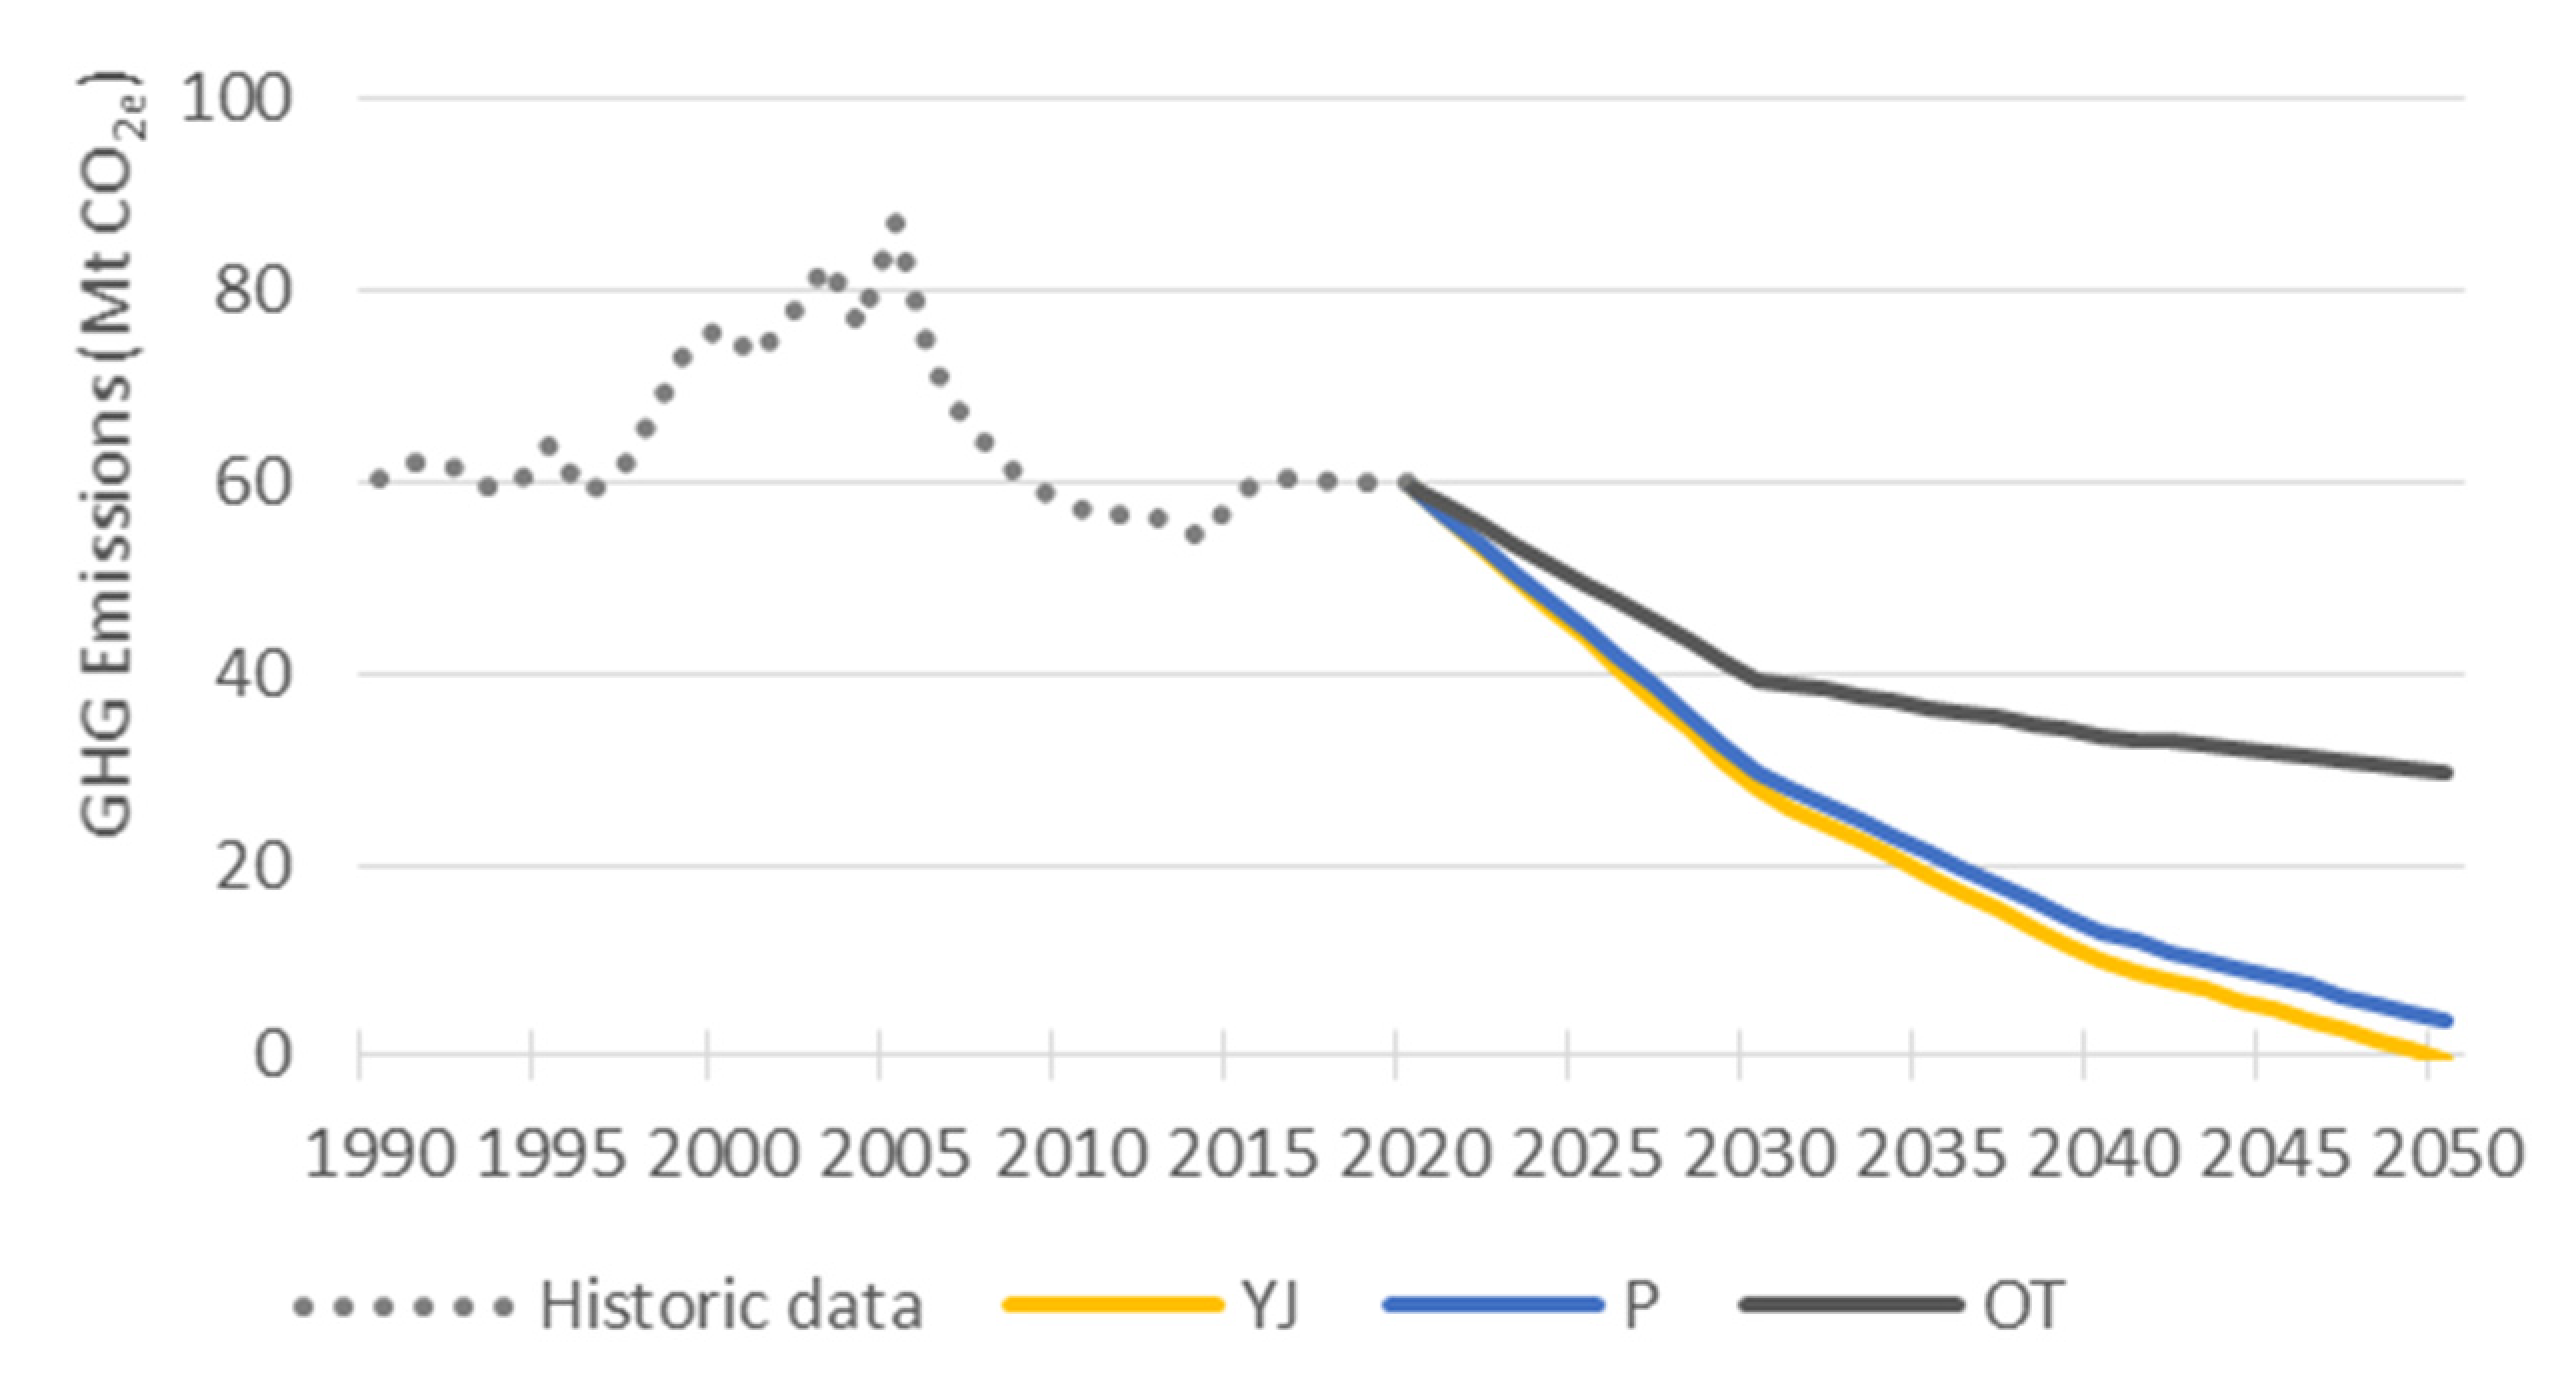
According to the obtained results there is technological viability for carbon neutrality, to be reached by 2050. It seems possible to operate a deep decarbonization of the national economy by using technologies and processes known today (with varying degrees of maturity). Figure 3 represents the GHG emission trend, including the land use, land use change and forestry (LULUCF) offset, allowing one to achieve carbon neutrality by 2050 in both YJ and P scenarios.
All sectors of the economy contribute to trajectories towards carbon neutrality, although with different intensities. This requires a shift on primary energy structure in conjunction with a significant increase in energy efficiency. Endogenous renewables growth significantly, from around 25% of the total primary energy consumption today, to more than 80% by 2050 in YJ and P scenarios. After 2030, endogenous renewable resources surpass oil imports, which currently represent the largest source of primary energy in the country (>40%). The transformation of power sector is depicted in Figure 4.
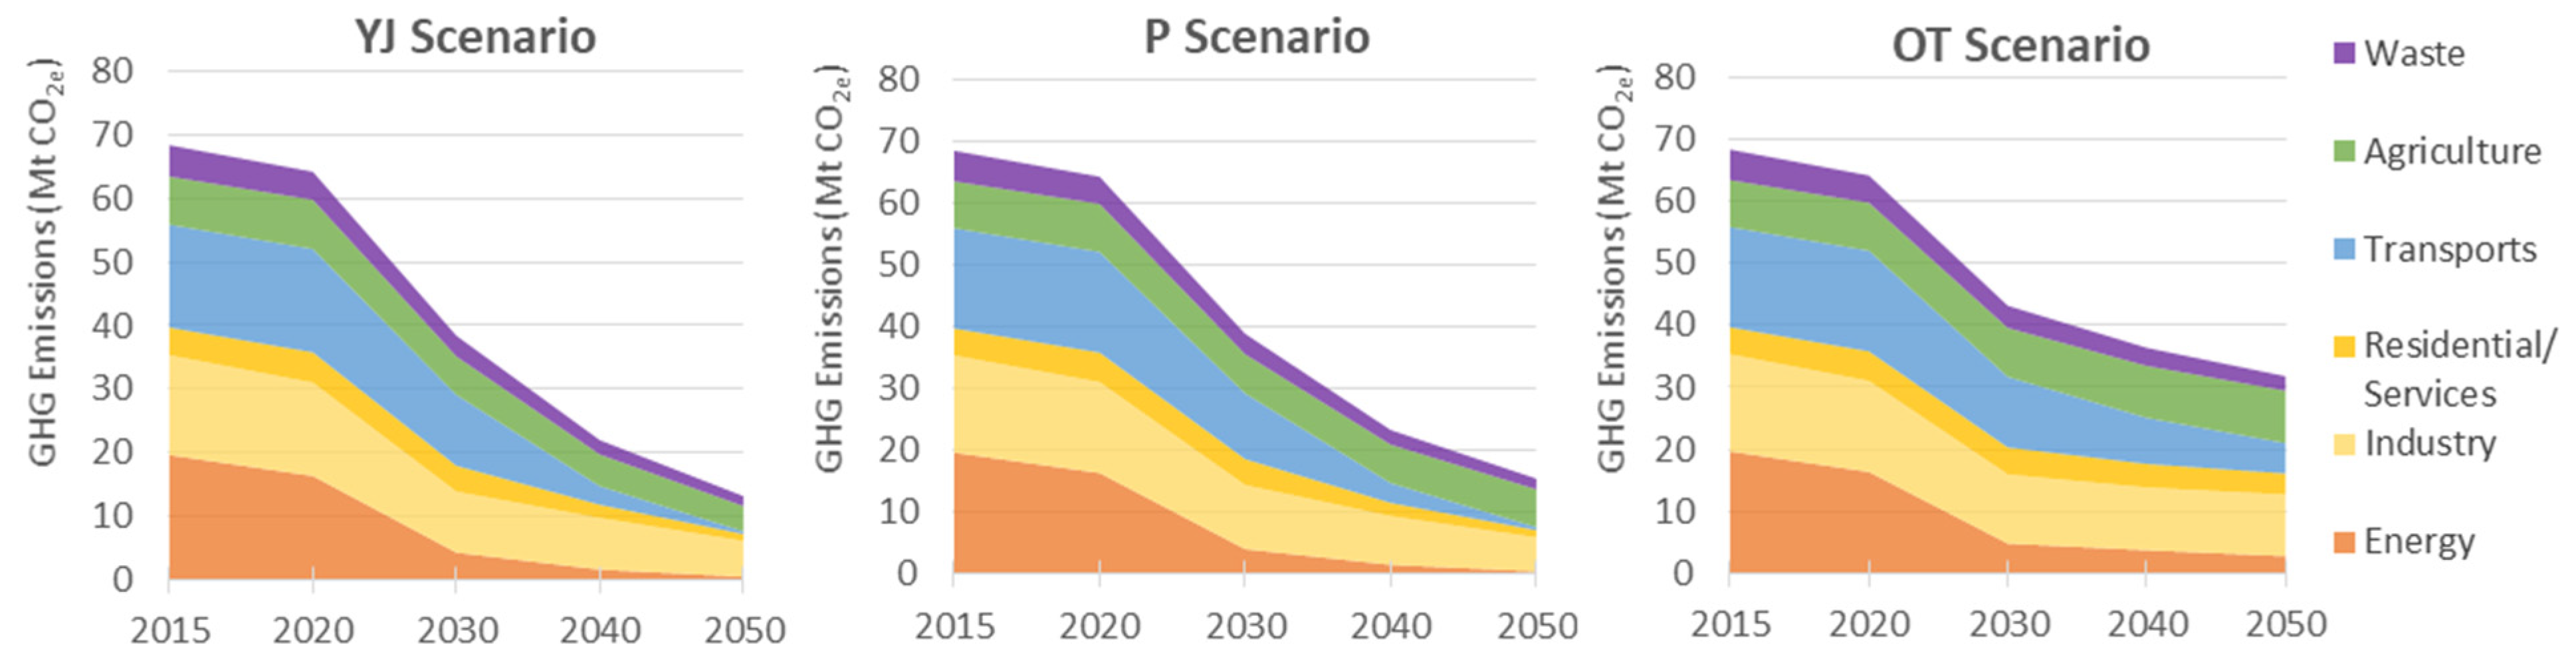
The three scenarios show changes in final energy consumption, up to 2050, within each sector and by fuel type (Figure 5 and Figure 6). The effect in total GHG emissions by sector is depicted in Figure 7. The following analysis is focused mainly in the YJ scenario due to its higher socioeconomic and energy system related activity, providing ambitious impact relevance to air pollutant emission reduction objectives.
In all three scenarios the predominance of renewable energy sources for electricity generation (RES-E), with solar PV and wind increasing their representativeness in the electricity source mix, was evident (Figure 4). The RES-E is a cost-effective solution, even if no GHG emission target is considered (OT scenario). Additionally, in the YJ and P scenario, where the final energy demand increased and was significantly electrified (Figure 6), RES-E maintained their contribution and ensured carbon free electricity consumption.
Regarding energy transition, by 2050, a reduction of total final energy consumption of 24% (YJ scenario) to 28% (P scenario) was obtained, when comparing to 2015. Energy intensity is reduced by more than 50% from 2015 to 2050, at all decarbonization scenarios. An increasing economy electrification trend was obtained (visible as early as 2030), with increased integration of renewable energy sources into final energy consumption (going from 46% in 2030 to 86% in 2050, in the YJ scenario). Similar pathways were shown in previous studies [23,24,25], which demonstrate that ambitious climate policies are to reshape the energy landscape in the coming decades. The decarbonization of the energy supply mix, combined with reduced energy consumption, through efficiency gains, will be key factors in the transformation of energy systems. Energy efficiency drives total global energy consumption down. Moreover, the rising share of renewables represents a structural change in the energy sector, especially in electricity generation [4]. Renewable electricity represents more than 90% and 100% of the electricity generated in 2030 and 2050, respectively in both YJ and P decarbonization scenarios. Solar PV and onshore wind follow by the hydro will be the main sources of electricity, with the first two reaching their maximum technical potential. The high competitiveness of these technologies makes them even a cost-effective solution in OT scenario, which does not consider major decarbonization targets. Offshore wind emerges as a cost-effective technology by 2030 in the decarbonization scenarios due to their high demand for zero-emissions electricity.
Concerning industry transition, both, electrification and biomass use, contribute to sector decarbonization, and the use of solar thermal in some low/medium temperature heat process industries. In this sector, a GHG emission reduction of 37% (in OT scenario) to 65% (in the P scenario) was obtained, evidencing a decarbonization progress at a slower pace than other sectors. The decarbonization potential of different technologies, within each industrial sector, can vary significantly in studies presented for Europe [26].
Decarbonization in residential/commercial/services sector was obtained with extensive electrification of energy services (85% of energy consumption in this sector by 2050 vis-à-vis the 56% of 2020), particularly due to the predominance of heat pumps for space heating. Together with insulation measures, more efficient electric equipment’s and solar thermal (11%) mostly for water heating, allows one to obtain a total GHG reduction of 75% (in YJ scenario) in 2050. Biomass remains a key option for households in the 2020–2040 horizon, almost disappearing in the decade 2040–2050 in the P scenario (representing 1% of final energy consumption), but maintaining in the YJ scenario (accounting for 3% of energy consumption), justified by greater decentralization of the territory, with more rural houses.
Transports and mobility, with a significant share of GHG emissions in 2015 of 24%, show a fast decarbonization trend (with less 97% GHG emissions in 2050 compared to 2015, in YJ and P scenarios), even with a larger demand for mobility in all modes. Traditional fossil fuels are progressively replaced by electricity, biofuels (used in navigation and aviation) and hydrogen (which, combined, represent 92% and 91% of energy consumption in YJ and P scenarios, and 40% in OT). Electricity is dominant in most of the transport modes, with exceptions for aviation and navigation (which account for 19% to 86% of fossil fuels consumption in 2050 in the first mode, and 83% to 93% in the second, considering the three scenarios). Hydrogen has a relevant weight in the road freight transport (representing 49% of energy consumption in YJ, 29% in P and 6% in OT scenarios).
For the agriculture sector there is an increase of cereal cultivated areas, along with changes of cattle composition (decreasing for most of the types of cattle, and increasing in the case of swine, sheep and goats), and in effluent treatment systems. Additionally, an increase of organic farming, and conservation and precision agriculture practices (with less use of animal effluents and fertilizers) is noticed. Emissions reduction for this sector was slower than in other sectors, reaching 47% and 19% in YJ and P scenarios, but with a 12% increase in OT scenario. Agriculture will increase its share of national emissions by 2050, accounting from 27% (OT) to 39% (P) of GHG emissions.
In the waste sector, a significant reduction in the production of urban waste per capita (−82%) is foreseen, with a reduction of organic waste production by 2050 of 60–85%. The wastewater sector did not entail a relevant evolution in relation to the starting point, already favorable. In the whole waste sector a reduction of 53–68% was obtained in 2050, regarding 2015.
Overall, results point out that to attain carbon neutrality by 2050, a strong decarbonization of energy production, mobility, and in residential/commercial/services is needed over the next two decades (2020–2040). Industry and agriculture sectors have a lower decarbonization potential, but still contribute to significant reductions especially on the 2040–2050 period. Effective agroforestry management is a determining factor to reach the objective of carbon neutrality by 2050. The significant GHG emissions reduction is mainly due to coal power plants closure and to the general economy electrification, supported by renewable sources. Additionally, the increase of economy efficiency, resulting in a reduction in primary energy consumption, allows a significant energy intensity reduction.
3.2. Decarbonization Scenarios Effects on Air Pollutant Emissions
The air pollutant emissions estimates, corresponding to the decarbonizing scenarios, are shown in Table 1 and in Figure 8.
Overall, results show that decarbonizing efforts also led to air pollutant emission reductions, due to the significant electrification, technology efficiency improvements, fossil fuels consumption decrease, and a correspondent shift to renewable energy sources. Traditional “end-of pipe” pollution control may have less of a role in reducing emissions than the effects of socioeconomic growth and related fuel and technological shifts, especially over longer time frames [27]. The most significant reductions occur for NOx and CO, reaching a reduction of 73% and 72%, respectively, in 2050 compared to 2015, in the YJ scenario. The lowest reductions are shown for NMVOC and NH3 pollutants, with 27% and 16% respective reduction in 2050, compared to 2015, in the YJ scenario. In line with the scenario’s base assumptions, greater emission reductions were obtained with YJ and P scenarios.
A comprehensive assessment [4] refers that the extent to which CO2 reductions are correlated with changes in air pollutants differs by region and type of air pollutant. Pollutants that mainly result from the combustion of fossil fuels, such as SO2 and NOx, emission reductions tend to be strongly correlated with decreasing emissions of CO2 [4].
Figure 9 displays the sectorial pollutant emissions distribution.
Regarding sectorial results (Figure 9), and as verified for GHG, energy, transports, and residential/commercial/services are the main sectors responsible for air pollutant emissions decrease.
The energy sector (including electricity and heat production, and refining) is the largest contributor to national decarbonization, due to fossil fuels phase-out and progressive integration of cost-effective endogenous renewable sources. This also led to the greatest sectorial reduction in air pollutant emissions, of over 89% by 2050, in the YJ scenario, for all pollutants. NOx and SOx almost reached zero emission values in this sector in 2050 (due to a reduction of coal and oil products consumption).
In the residential/commercial/services sector, there is an overall decrease in emissions, by 2050. This is due to a decrease in the consumption of the most pollutant fossil fuels. Increased use of electricity and renewable energy sources, such as solar thermal in buildings, has a positive impact on reducing emissions of air pollutants. By 2050, CO and PM2.5 emissions are almost exclusively due to biomass consumption in the residential sector.
The transport sector accounted for a significant pollutant emissions reduction, of 95% for NOx and 99% for CO, between 2015 and 2050, in the YJ scenario. Regarding particulate matter, reductions in all scenarios are less expressive, accounting for 49% of PM10 and 67% of PM2.5 (YJ scenario). Within the transport sector, road transport is the major emitter of particulate matter (78% of PM10 and 75% of PM2.5, in 2015). This subsector has a significant role on urban air pollution, heavily contributing to high concentrations of PM10 and NOx. PM emissions reduction, within this subsector, was not so marked, as for NOx, due to the non-exhaust fraction, which would remain in 2050 (Table 2). In 2015 tire, brake wear, and road abrasion were responsible for 37% of PM10 emissions at a national level, and for 24% of PM2.5 emissions, within the road transport subsector, showing a larger impact on the coarser fraction. This set of emission sources will be responsible for 100% of both pollutants’ emissions in 2050. This growing importance of non-tailpipe particulate matter pollution (function of distance travelled and not of the type of fuel used) is in line with current related assessments [28].
The industrial sector led the emissions share for NMVOC, SOx, and PM2.5. Industry shows a reduced GHG mitigation cost-effective priority, resulting also in low air pollutants emissions reduction levels. For PM2.5, there was an increase of 21% in 2050, due to the shift to biomass fuels use and to the weight of process emissions, contrasting with the general decreasing emissions trend. NMVOC were emitted mainly by the industrial sector (60% in 2015, and 86% in 2050). It is important to mention that industry emission factors used, for future energy consumption, include control technologies currently available (i.e., electrostatic precipitators).
The agriculture sector is the major source of NH3, representing 79% of total emissions in 2015, increasing to 82% in 2050, in the YJ scenario. A reduction (ranged from 5% to 13%) in NH3 emissions was obtained in the agriculture sector, in 2050, considering the three scenarios. Ammonia is one of the major precursors of secondary aerosol, with impacts on the formation and transport of secondary particulate matter [29].
NMVOC and NH3 register the lowest global reductions by 2050, being of 27% and 16%, respectively, in the YJ scenario. These results are in line with what previous work [28] pointed out: techno economic energy systems models can provide significant insight on PM, NOx, and SOx air pollution, but not on NMVOC and NH3, as the vast majority of emission sources for these pollutants are non-energy sectors, and therefore not captured in depth within this approach.
Results highlight that the atmospheric emissions sectorial share will change. For NOx, as greater reductions were obtained in the transport sector (with a share of 50% in 2015, and 9% in 2050), industry would appear as the major emission sector in 2050 (responsible for 70% of NOx emissions). For SOx the contribution of power generation would drop from 25% to 3%, with industry rising and contributing to 91% of emissions in 2050. For PM2.5 in the residential sector, an emission decrease from 38% to 5% was foreseen, being the industrial sector, in 2050, the main emitter (84% in YJ scenario). In this sense, industry appears to be a relevant sector to tackle air pollution in the future, when designing strategies to control emissions, especially process emissions, due to the limited range of technological options to reduce them.
In the specific case of biomass consumption, there is an increased relative contribution of biomass combustion, up to 2030, in industry and residential sectors, showing a negative trade off from climate change solutions, once this is an important source of PM2.5 emissions. This situation has been reported in previous works [9,28], highlighting that, depending on the geographic distribution of biomass use, this trend could increment air quality critical situations in urban areas, and where more population is exposed. According to the Second Clean Air Outlook [30], where climate scenarios have been analyzed with regard to their effects on air pollution, in the long term (2050), actions to fight climate change in Europe always help to reduce air pollutant emissions, being the smallest contribution related to PM2.5. This report also highlights that there are clearly measures that benefit both policies, and these need to be promoted, while measures leading to trade-offs should be avoided. Measures to increase the share of non-combustible renewables in energy consumption, to improve the energy performance of buildings and promote more sustainable heating and cooling solutions and to boost energy efficiency overall, as well as measures in support of clean transport, are particularly beneficial. On the other hand, measures that increase bioenergy use in devices without adequate emissions abatement technologies are detrimental to clean air and need to be avoided [30].
3.3. National Emission Reduction Commitments
In the European Union (EU), important progress has been made in the last 20 years, in the field of anthropogenic atmospheric emissions and air quality. However, there are still significant negative impacts and risks to human health and the environment, which led to the adoption of specific policies and legal instruments, as the EU Directive 2016/2284 on the reduction of national emissions of certain atmospheric pollutants, being the main legislative instrument to achieve the 2030 objectives of the Clean Air Programme [31]. This directive—referred to also as the NEC Directive—sets national emission reduction commitments for each EU Member State for the period 2020–2029, and more ambitious ones as of 2030, targeting five air pollutants responsible for significant negative impacts on human health and the environment: SO2, NOx, NMVOC, NH3, and fine particulate matter PM2.5. The aim established in the Clean Air Programme is to reduce the health impacts of air pollution by half by 2030 compared to 2005.
Regarding results obtained with the CNR2050, across the scenarios it is shown that decarbonization efforts had significant benefits for reducing air pollutant emissions in Portugal, by 2050, but are they enough to meet the emission reduction commitments established by the NEC Directive?
The three modeled scenarios allowed for substantial reductions on air pollutant emissions, in 2050 compared to 2005, being those from: (i) 85% to 87% for SO2, (ii) 80% to 84% for NOx, and iii) 66% to 85% for CO. More restrained emission reductions were obtained for pollutants such as PM2.5 (up to 55%), NMVOC (with a maximum 48% reduction), and NH3 (between 17% and 24%). It is with regard to this last set of pollutants that compliance with respective emission ceiling was most uncertain, in the period from 2030, as shown in Table 3. For the period from 2020 to 2029, projected emissions allow to comply with national emission reduction commitments for all the pollutants. Emission projection estimates were similar for the three scenarios, in the 2030-time horizon, reaching a higher degree of differentiation in 2050.
The YJ scenario is the one that presents more pollutants exceeding the respective emission ceiling, namely for PM2.5, NH3, and NMVOC. This scenario, despite achieving a more intense decarbonization, through greater efficiencies and using fewer polluting technologies/fuels, reflects a higher demand for materials, goods, and services, which translates into consequent higher emissions.
The reductions on air pollutant emissions achieved under the CNR2050 are not sufficient to enforce PM2.5 emission commitments, applicable from 2030, in any of the considered scenarios (Table 3). For PM2.5, considering the three scenarios, a distance of 8–11 kt to the target was obtained (representing 12%–17% of total PM2.5 emissions). In 2030 this pollutant was emitted mainly by the industrial sector (59% in YJ scenario), with a significant weight from process emissions. To this pollutant also a significant contribution was obtained from the residential/commercial/services sector (27%), due to the use of biomass for heating. Within this sector, results reflected additional measures included to reduce PM2.5 emissions, being considered the effective adoption of the Ecodesign Directive from 2030 to 2050.
Regarding the industrial sector, additional NMVOC emission abatement measures were taken into account, as a result of the adoption of control strategies with mitigation potential in the area of industrial solvent use. Within this sector, it was not possible to achieve a significant reduction in process emissions, as opposed to combustion emissions, particularly in the subsectors responsible for the highest NMVOC and PM2.5 contributions, such as chemistry, paints, and solvents in the NMVOC case, and ceramics and chemistry in the PM2.5 case. In the long term, the industrial sector acquires the largest weight in national emissions, especially due to the fraction of process emissions, in a growing product demand trend and considering current technological limitations, which do not allow significant reductions.
In the case of NH3, the obtained emission reduction made it possible to meet all emission ceilings, however, after 2030, projections were quite close to the national emission reduction commitment. The agriculture sector is the dominant source of NH3 (accounting for 75% of emissions in 2030).
In the Second Clean Air Outlook [30], results from a modeling exercise underpinning prospects for achieving the NEC Directive air pollutant emission reduction commitments in 2030 and beyond, in the EU, are presented. Taking into account Member States commitments to climate and energy targets for 2030 (which require appropriate policies and measures to be put in place) and the application of existing legislation tackling air pollution at its source, the reductions in all air pollutant emissions, required by the NEC Directive across the EU, would be fulfilled, for the period from 2030 onwards, except for ammonia [30]. This is also the situation pointed out for Portugal (which, in turn fulfills the reduction commitments for PM2.5) in this assessment. Overall, it is underlined that Member States must fully implement all existing legislation and the measures to be identified at the national air pollution control programs (NAPCPs). Additionally, the most cost-effective air pollution control measures are summarized in the document: (i) for SO2, PM2.5, and NOx, they mostly relate to measures in industrial processes and industrial combustion, which is in line with the obtained results, where the industrial sector gains a significant relevance in national emissions; (ii) to reduce NMVOC, the large majority of the cost-efficient measures would tackle emissions from the burning of biomass for domestic heating and, to a lesser extent, from the use of solvents; and (iii) the measures that would cut ammonia emissions, in the most cost-efficient manner, all relate to agriculture and are, to a large extent, related to animal feeding practices, manure management, and use of fertilizers.
4. Conclusions
The transformation to a carbon neutral economy has an overall positive effect on main anthropogenic atmospheric emissions, in all tested scenarios. Figure 10 represents the historic and projected evolution of the main air pollutants and GHG. These substances have common emission sources, in particular those associated with the combustion of fossil fuels in stationary and mobile sources. The trajectories presented in the current work (Yellow Jersey, Pack, and Off Track) had a significant emission reduction potential for pollutants such as NOx and SOx (which was already describing a downward trend) and of lesser expression for NH3, NMVOC, and PM2.5.
Reaching net zero GHG emissions is possible and technologically feasible in Portugal, by 2050, in both Yellow Jersey and Pack modelled scenarios. All economic sectors will contribute to the trajectories of carbon neutrality, although with different intensities. To attain carbon neutrality in 2050, a significant mitigation of GHG emissions is needed in the 2020–2030 decade. The crucial and most cost-effective vector for decarbonising the national economy is the end-use energy consumption electrification, renewable based, across all end-use sectors.
The accomplishment of the carbon neutrality goal has strong co-benefits in reducing air pollutant emissions. Transport and power generation are the sectors with the greatest potential to reduce GHG emissions, providing likewise the most significant reductions of air pollutant emissions. Energy efficiency measures also benefit both GHG and air pollutant emissions.
This study emphasized the relevance of industrial emissions, acquired in the long term, mainly regarding process emissions. This highlights the necessity to develop emission reduction abatement strategies oriented to non-energy sectors, once they appear to be the least cost-effective sectors to reduce GHG and air pollutant emissions.
Despite the overall positive effects, there are antagonistic effects, such as the use of biomass, in industry and residential sectors, which translates into increases in particulate matter emissions. This is relevant for medium term projections, since the results show that, by 2030, PM2.5 emissions are unlikely to meet international commitments on national emission ceilings, if no additional control measures are considered.
The verification of compliance with the national emission ceilings, by 2030, according to the projections made, highlights the need to implement additional measures to reduce emissions in the coming years, for fine particulate matter PM2.5. Compliance with NH3 commitments is verified but with a small margin in relation to the 2030 ceiling, so attention should be paid to measures geared to this pollutant, with an emphasis on the agriculture sector.
The NEC Directive requires that the Member States draw up National Air Pollution Control Programmes, identifying additional measures in order to guarantee emission reduction compliance. Further work is to be developed, identifying and quantifying control and abatement measures, and accessing its impacts on atmospheric emissions. The application of end-of-pipe atmospheric pollutant abatement measures can lead to increases in energy consumption and contribute to the increase of GHG. In this sense, this analysis should be carried out with caution. Additionally, future work could be developed on the air pollutant emissions spatial disaggregation, and subsequent air quality modeling, in order to assess the air quality impacts, on health and ecosystems, and their respective economic costs.
Tackling greenhouse gas mitigation and air pollutant emissions reduction, in an integrated approach, tend to optimize co-benefits, to improve ambient air quality and to reduce damages to human health and ecosystems.
Author Contributions
Conceptualization, J.M., L.D., P.F., H.T.; methodology and analysis, J.M., L.D., P.F. (energy systems modeling); writing—original draft preparation, J.M.; writing—review and editing, J.M., L.D., P.F.; supervision, F.F. and J.S.; project administration, J.S.; funding acquisition, J.S. All authors have read and agreed to the published version of the manuscript.
Funding
This research was based on the outcomes from the Portuguese Carbon Neutrality Roadmap 2050, a project supported by the Ministry of Environment and Energy Transition of the Portuguese Republic. The research work developed at CENSE is financed by the Portuguese Foundation for Science and Technology (FCT) through the strategic project UIDB/04085/2020.
Data Availability Statement
3rd Party Data. Restrictions apply to the availability of these data. Data presented in this research is based on the author’s work developed for the Portuguese Environmental Agency.
Acknowledgments
This project had the collaboration of a large multidisciplinary sectorial team, to whom the authors would like to thank for all the valuable contributions.
Conflicts of Interest
The authors declare no conflict of interest. This paper represents an academic study. The analysis expressed in it are the sole responsibility of the authors and do not necessarily reflect the view of the Portuguese Government.
References
- Bollen, J.; Brink, C. Air pollution policy in Europe: Quantifying the interaction with greenhouse gases and climate change policies. Energy Econ. 2014, 46, 202–215. [Google Scholar] [CrossRef] [Green Version]
- Zhang, Y.; Smith, S.J.; Bowden, J.H.; Adelman, Z.; West, J.J. Co-benefits of global, domestic, and sectoral greenhouse gas mitigation for US air quality and human health in 2050. Environ. Res. Lett. 2017, 12, 114033. [Google Scholar] [CrossRef] [PubMed]
- Gao, J.; Hou, H.; Zhai, Y.; Woodward, A.; Vardoulakis, S.; Kovats, S.; Wilkinson, P.; Li, L.; Song, X.; Xu, L.; et al. Greenhouse gas emissions reduction in different economic sectors: Mitigation measures, health co-benefits, knowledge gaps, and policy implications. Environ. Pollut. 2018, 240, 683–698. [Google Scholar] [CrossRef] [PubMed]
- Vandyck, T.; Keramidas, K.; Kitous, A.; Spadaro, J.V.; Van Dingenen, R.; Holland, M.; Saveyn, B. Air quality co-benefits for human health and agriculture counterbalance costs to meet Paris Agreement pledges. Nat. Commun. 2018, 9, 1–11. [Google Scholar] [CrossRef] [PubMed]
- European Environment Agency. Air Quality in Europe—2020 Report; Publications Office of the European Union: Luxembourg, 2020. [Google Scholar]
- Dean, A.; Green, D. Climate change, air pollution and human health in Sydney, Australia: A review of the literature. Environ. Res. Lett. 2018, 13, 053003. [Google Scholar] [CrossRef] [Green Version]
- UNFCCC. The Paris Agreement. Available online: https://unfccc.int/resource/bigpicture/#content-the-paris-agreement (accessed on 8 January 2021).
- Xie, Y.; Dai, H.; Xu, X.; Fujimori, S.; Hasegawa, T.; Yi, K.; Masui, T.; Kurata, G. Co-benefits of climate mitigation on air quality and human health in Asian countries. Environ. Int. 2018, 119, 309–318. [Google Scholar] [CrossRef] [PubMed]
- Rafaj, P.; Schöpp, W.; Russ, P.; Heyes, C.; Amann, M. Co-benefits of post-2012 global climate mitigation policies. Mitig. Adapt. Strat. Glob. Chang. 2012, 18, 801–824. [Google Scholar] [CrossRef]
- Von Schneidemesser, E.; Monks, P.S. Air quality and climate—Synergies and trade-offs. Environ. Sci. Process. Impacts 2013, 15, 1315. [Google Scholar] [CrossRef] [PubMed]
- Von Schneidemesser, E.; Driscoll, C.; Rieder, H.E.; Schiferl, L.D. How will air quality effects on human health, crops and ecosystems change in the future? Philos. Trans. R. Soc. A Math. Phys. Eng. Sci. 2020, 378, 20190330. [Google Scholar] [CrossRef] [PubMed]
- Dias, L. Climate Change and Air Quality: Integration of NOx and SOx emissions in the TIMES_PT Model and Assessment of Common Mitigation Policies; NOVA School of Science and Technology: Caparica, Portugal, 2009. (In Portuguese) [Google Scholar]
- Monjardino, J.; Dias, L.; Tente, H.; Fortes, P.; Ferreira, F. Net zero GHG pathways effect on Air pollutants emissions. In Proceedings of the 25th ISDRS Conference, Nanjing, China, 26–28 June 2019. [Google Scholar]
- Portuguese Government. Roadmap for Carbon Neutrality 2050 (RNC2050) Long-Term Strategy for Carbon Neutrality of the Portuguese Economy by 2050; Portuguese Government: Lisbon, Portugal, 2019. [Google Scholar]
- Fortes, P.; Simoes, S.G.; Gouveia, J.P.; Seixas, J. Electricity, the silver bullet for the deep decarbonisation of the energy system? Cost-effectiveness analysis for Portugal. Appl. Energy 2019, 237, 292–303. [Google Scholar] [CrossRef]
- Fortes, P.; Alvarenga, A.; Seixas, J.; Rodrigues, S. Long-term energy scenarios: Bridging the gap between socio-economic storylines and energy modeling. Technol. Forecast. Soc. Chang. 2015, 91, 161–178. [Google Scholar] [CrossRef]
- Fortes, P.; Julia, S.; Dias, L.; Lopes, R.; Gouveia, J.P. The mix & match between stakeholders and energy system modelling towards a carbon neutral economy. In Proceedings of the International Energy Workshop, Paris, France, 3–5 June 2019. [Google Scholar]
- Seixas, J.; Fortes, P.; Tente, H.; Monjardino, J.; Gouveia, J.P.; Dias, L.; Palma, P.; Lopes, R.; Avillez, F.; Aies, N.; et al. Complex modelling to achieve Carbon Neutrality in Portugal. In Proceedings of the EU Conference on Modelling for Policy Support, Brussels, Belgium, 26–27 November 2019. [Google Scholar]
- Portuguese Environment Agency. Portuguese Informative Inventory Report 1990—2016 Submission under the NEC Directive (EU) 2016/2284 and the UNECE Convention on Long-Range Transboundary Air Pollution; Portuguese Environmental Agency: Amadora, Portugal, 2018. [Google Scholar]
- IIASA GAINS. Europe Greenhouse Gas—Air Pollution Interactions and Synergies—Control Strategies. 2018. Available online: https://gains.iiasa.ac.at/models/gains_models3.html (accessed on 8 January 2021).
- European Environment Agency. EMEP/EEA Air Pollutant Emission Inventory Guidebook 2016; EEA Report No 21/2016; European Environment Agency: København, Denmark, 2016. [Google Scholar]
- Portuguese Environment Agency. Portuguese Informative Inventory Report 1990—2018 Submission under the NEC Directive (EU) 2016/2284 and the UNECE Convention on Long-Range Transboundary Air Pollution; Portuguese Environmental Agency: Amadora, Portugal, 2020. [Google Scholar]
- Vandyck, T.; Keramidas, K.; Saveyn, B.; Kitous, A.; Vrontisi, Z. A global stocktake of the Paris pledges: Implications for energy systems and economy. Glob. Environ. Chang. 2016, 41, 46–63. [Google Scholar] [CrossRef]
- Rogelj, J.; Luderer, G.; Pietzcker, R.C.; Kriegler, E.; Schaeffer, M.; Krey, V.; Riahi, K. Energy system transformations for limiting end-of-century warming to below 1.5 °C. Nat. Clim. Chang. 2015, 5, 519–527. [Google Scholar] [CrossRef]
- Mccollum, D.L.; Zhou, W.; Bertram, C.; De Boer, H.-S.; Bosetti, V.; Busch, S.; Després, J.; Drouet, L.; Emmerling, J.; Fay, M.; et al. Energy investment needs for fulfilling the Paris Agreement and achieving the Sustainable Development Goals. Nat. Energy 2018, 3, 589–599. [Google Scholar] [CrossRef] [Green Version]
- Gerres, T.; Ávila, J.P.C.; Llamas, P.L.; Román, T.G.S. A review of cross-sector decarbonisation potentials in the European energy intensive industry. J. Clean. Prod. 2019, 210, 585–601. [Google Scholar] [CrossRef]
- Rao, S.; Klimont, Z.; Leitao, J.; Riahi, K.; Van Dingenen, R.; Reis, L.A.; Calvin, K.; Dentener, F.; Drouet, L.; Fujimori, S.; et al. A multi-model assessment of the co-benefits of climate mitigation for global air quality. Environ. Res. Lett. 2016, 11, 124013. [Google Scholar] [CrossRef]
- Lott, M.C.; Pye, S.; Dodds, P.E. Quantifying the co-impacts of energy sector decarbonisation on outdoor air pollution in the United Kingdom. Energy Policy 2017, 101, 42–51. [Google Scholar] [CrossRef] [Green Version]
- Backes, A.M.; Aulinger, A.; Bieser, J.; Matthias, V.; Quante, M. Ammonia emissions in Europe, part II: How ammonia emission abatement strategies affect secondary aerosols. Atmos. Environ. 2016, 126, 153–161. [Google Scholar] [CrossRef] [Green Version]
- European Commission. The Second Clean Air Outlook—Report from the Commission to the European Parliament, the Council, the European Economic and Social Committee and the Committee of the Regions; European Commission: Brussels, Belgium, 2021. [Google Scholar]
- European Commission. Communication from the Commission to the European Parliament, the Council, the European Economic and Social Committee and the Committee of the Regions, A Clean Air Programme for Europe, COM (2013)918, 18.12.2013; European Commission: Brussels, Belgium, 2013. [Google Scholar]
Figure 1.
General methodology applied to estimate air pollutant emissions associated to CNR2050.

Figure 2.
Narratives underlying the three macroeconomic scenarios considered: Off Track, Pack, and Yellow Jersey.
Figure 2.
Narratives underlying the three macroeconomic scenarios considered: Off Track, Pack, and Yellow Jersey.

Figure 3.
Greenhouse gas (GHG) emission trajectories for three studied scenarios (Mt of CO2e including land use, land use change and forestry (LULUCF)).
Figure 3.
Greenhouse gas (GHG) emission trajectories for three studied scenarios (Mt of CO2e including land use, land use change and forestry (LULUCF)).

Figure 4.
Power generation (TWh) per technology and scenario: Yellow Jersey (YJ), Pack (P), and Off Track (OT).
Figure 4.
Power generation (TWh) per technology and scenario: Yellow Jersey (YJ), Pack (P), and Off Track (OT).

Figure 5.
Final energy consumption (PJ) by sector and scenario: (YJ) Yellow Jersey; (P) Pack; and (OT) Off Track.
Figure 5.
Final energy consumption (PJ) by sector and scenario: (YJ) Yellow Jersey; (P) Pack; and (OT) Off Track.

Figure 6.
Final energy consumption (PJ) by fuel and scenario: Yellow Jersey (YJ), Pack (P), and Off Track (OT).
Figure 6.
Final energy consumption (PJ) by fuel and scenario: Yellow Jersey (YJ), Pack (P), and Off Track (OT).

Figure 7.
GHG emissions (Mt CO2e excluding LULUCF) by sector and scenario: Yellow Jersey (YJ), Pack (P), and Off Track (OT).
Figure 7.
GHG emissions (Mt CO2e excluding LULUCF) by sector and scenario: Yellow Jersey (YJ), Pack (P), and Off Track (OT).

Figure 8.
Air pollutant emission trajectories (kt) for three scenarios: Yellow Jersey (YJ), Pack (P), and Off Track (OT).
Figure 8.
Air pollutant emission trajectories (kt) for three scenarios: Yellow Jersey (YJ), Pack (P), and Off Track (OT).

Figure 9.
Sectorial contribution for total GHG and air pollutant emissions from 2015 to 2050 (pie charts represent YJ scenario).
Figure 9.
Sectorial contribution for total GHG and air pollutant emissions from 2015 to 2050 (pie charts represent YJ scenario).

Figure 10.
Historic and projected trends of air pollutant and GHG emissions in Portugal (projections for YJ scenario).
Figure 10.
Historic and projected trends of air pollutant and GHG emissions in Portugal (projections for YJ scenario).


Table 1.
Air pollutant emission estimates for three scenarios (YJ, P, and OT).
| Scenario | Pollutant | Historic Emissions (kt) | Projected Emissions (kt) | Δ2050–2015 (%) | |||
|---|---|---|---|---|---|---|---|
| 2015 | 2020 | 2030 | 2040 | 2050 | |||
| YJ | NOx | 146 | 125 | 73 | 49 | 39 | −73% |
| CO | 315 | 305 | 243 | 179 | 88 | −72% | |
| NMVOC | 145 | 136 | 124 | 110 | 106 | −27% | |
| SOx | 34 | 30 | 27 | 25 | 23 | −32% | |
| PM2.5 | 50 | 46 | 42 | 40 | 33 | −34% | |
| NH3 | 50 | 48 | 48 | 44 | 42 | −16% | |
| P | NOx | 146 | 125 | 73 | 48 | 40 | −73% |
| CO | 315 | 305 | 250 | 170 | 73 | −77% | |
| NMVOC | 145 | 136 | 120 | 103 | 97 | −33% | |
| SOx | 34 | 30 | 27 | 25 | 23 | −31% | |
| PM2.5 | 50 | 46 | 40 | 37 | 29 | −42% | |
| NH3 | 50 | 48 | 47 | 44 | 43 | −13% | |
| OT | NOx | 146 | 127 | 75 | 58 | 49 | −66% |
| CO | 315 | 306 | 246 | 215 | 170 | −46% | |
| NMVOC | 145 | 136 | 119 | 105 | 101 | −30% | |
| SOx | 34 | 30 | 26 | 26 | 26 | −22% | |
| PM2.5 | 50 | 46 | 39 | 39 | 35 | −30% | |
| NH3 | 50 | 48 | 47 | 47 | 46 | −7% | |
Legend: ∆2050–2015: Emissions reduction in 2050 compared to 2015 (%); NOx (expressed as NO2); SOx (expressed as SO2).
Table 2.
Road transport particulate matter emissions (YJ scenario).
| Pollutant | Emission Type | Historic Emissions 2015 | Projected Emissions 2030 | Projected Emissions 2050 | |||
|---|---|---|---|---|---|---|---|
| kt | % | kt | % | kt | % | ||
| PM10 | Exhaust | 3.2 | 63% | 1.4 | 34% | 0.0 | 0% |
| Tire, brake wear, and road abrasion | 1.9 | 37% | 2.7 | 66% | 2.6 | 100% | |
| PM10 Total | 5.1 | 100% | 4.1 | 100% | 2.6 | 100% | |
| PM2.5 | Exhaust | 3.2 | 76% | 0.9 | 38% | 0.0 | 0% |
| Tire, brake wear, and road abrasion | 1.0 | 24% | 1.5 | 62% | 1.4 | 100% | |
| PM2.5 Total | 4.2 | 100% | 2.3 | 100% | 1.4 | 100% | |
Table 3.
National emission reduction commitments compliance according to CNR2050 scenarios, for the 2030-time horizon.
Table 3.
National emission reduction commitments compliance according to CNR2050 scenarios, for the 2030-time horizon.
| Pollutant | Parameter | Historic Emissions 2005 | NEC 2030 | Projected Emissions 2030 | |||
|---|---|---|---|---|---|---|---|
| YJ | P | OT | |||||
| NOx * | Emissions | Emissions (kt) | 245 | 91 | 72 | 71 | 73 |
| Δ/2005 (%) | - | −63% | −71% | −71% | −70% | ||
| Compliance assessment | Compliance | - | - | Yes | Yes | Yes | |
| Distance to target (kt) | - | - | −19 kt | −20 kt | −18 kt | ||
| Distance to target (%) | - | - | −8% | −8% | −7% | ||
| SO2 | Emissions | Emissions (kt) | 172 | 29 | 27 | 27 | 26 |
| Δ/2005 (%) | - | −83% | −84% | −85% | −85% | ||
| Compliance with NEC | Compliance | - | - | Yes | Yes | Yes | |
| Distance to target (kt) | - | - | −2 kt | −3 kt | −3 kt | ||
| Distance to target (%) | - | - | −1% | −2% | −2% | ||
| NH3 | Emissions | Emissions (kt) | 55 | 47 | 48 | 47 | 47 |
| Δ/2005 (%) | - | −15% | −13% | −15% | −15% | ||
| Compliance with NEC | Compliance | - | - | No | Yes | Yes | |
| Distance to target (kt) | - | - | 1 kt | 0 kt | 0 kt | ||
| Distance to target (%) | - | - | 2% | 0% | 0% | ||
| NMVOC * | Emissions | Emissions (kt) | 176 | 109 | 112 | 108 | 108 |
| Δ/2005 (%) | - | −38% | −36% | −39% | −39% | ||
| Compliance with NEC | Compliance | - | - | No | Yes | Yes | |
| Distance to target (kt) | - | - | 3 kt | −1 kt | −2 kt | ||
| Distance to target (%) | - | - | 2% | −1% | −1% | ||
| PM2.5 | Emissions | Emissions (kt) | 66 | 31 | 42 | 40 | 39 |
| Δ/2005 (%) | - | −53% | −36% | −39% | −41% | ||
| Compliance with NEC | Compliance | - | - | No | No | No | |
| Distance to target (kt) | - | - | 11 kt | 9 kt | 8 kt | ||
| Distance to target (%) | - | - | 17% | 14% | 12% | ||
Legend: NEC: National Emission Ceiling; YJ: Yellow Jersey emission scenario; P: Pack emission scenario; OT: Off Track emission scenario; -: non-applicable; Yes: NEC compliance; No: NEC non-compliance; *according to NECD Article 4, Point 3(d), emissions of NOx and NMVOC from activities of NFR categories 3B (manure management) and 3D (agricultural soils) are not accounted for the purpose of complying.
Publisher’s Note: MDPI stays neutral with regard to jurisdictional claims in published maps and institutional affiliations. |
© 2021 by the authors. Licensee MDPI, Basel, Switzerland. This article is an open access article distributed under the terms and conditions of the Creative Commons Attribution (CC BY) license (http://creativecommons.org/licenses/by/4.0/).
Share and Cite
MDPI and ACS Style
Monjardino, J.; Dias, L.; Fortes, P.; Tente, H.; Ferreira, F.; Seixas, J. Carbon Neutrality Pathways Effects on Air Pollutant Emissions: The Portuguese Case. Atmosphere 2021, 12, 324. https://0-doi-org.brum.beds.ac.uk/10.3390/atmos12030324
AMA Style
Monjardino J, Dias L, Fortes P, Tente H, Ferreira F, Seixas J. Carbon Neutrality Pathways Effects on Air Pollutant Emissions: The Portuguese Case. Atmosphere. 2021; 12(3):324. https://0-doi-org.brum.beds.ac.uk/10.3390/atmos12030324
Chicago/Turabian StyleMonjardino, Joana, Luís Dias, Patrícia Fortes, Hugo Tente, Francisco Ferreira, and Júlia Seixas. 2021. "Carbon Neutrality Pathways Effects on Air Pollutant Emissions: The Portuguese Case" Atmosphere 12, no. 3: 324. https://0-doi-org.brum.beds.ac.uk/10.3390/atmos12030324
Note that from the first issue of 2016, this journal uses article numbers instead of page numbers. See further details here.