
Species of Fungi and Pollen in the PM1 and the Inhalable Fraction of Indoor Air in Homes


1
The National Research Centre for the Working Environment, Lersø Parkallé 105, DK-2100 Copenhagen, Denmark
2
School of Water and Environment, Chang’an University, Xi’an 710054, China
3
House Test ApS, Petersmindevej 1A, DK-5000 Odense C, Denmark
*
Author to whom correspondence should be addressed.
Atmosphere 2021, 12(3), 404; https://0-doi-org.brum.beds.ac.uk/10.3390/atmos12030404
Submission received: 7 February 2021
/
Revised: 14 March 2021
/
Accepted: 17 March 2021
/
Published: 20 March 2021
(This article belongs to the Section Aerosols)
Abstract
:Airborne microbial fragments in the PM1 fraction (particles with aerodynamic diameters less than 1 µm) are a cause for concern as they may potentially deposit in the alveoli of the human airways. This study aimed to use qPCR to identify and quantify 24 different species or groups of genera in the PM1 and the inhalation fraction (particles that may enter the mouth or nose during breathing) of indoor air and to relate this to what has previously been found for each species. Results showed that eight fungal species, and Aspergillus/Penicillium/Paecilomyces variotii, as well as Alnus/Corylus and actinobacteria belonging to the Streptomyces genus were detected both in the PM1 and the inhalable fraction. Five fungal species were only detected in the inhalable fraction. A significant effect of season was found on the fungal composition in the PM1 (p = 0.001) and the inhalable (p = 0.017) fraction. This study demonstrated that it is possible to use qPCR to identify and quantify different microbes in the PM1 fraction, and it has improved our understanding of the qualitative and quantitative relationship between the PM1 and the inhalable microbial particles in indoor air. Combined with the literature review it also shows a large variation within and between species in the share of fungi which is present as fragments.
1. Introduction
Airborne fungi and pollen are always present as inhalable particles in indoor environments and they are important risk factors for asthma symptoms [1,2]. According to a review study, fungal fragments are derived from broken or fractured conidia and hyphae that have been aerosolized following disturbances to fungi colonies [3]. Of the airborne fungi, fragments smaller than spore size have received attention since 1999 when they were first found to be released from gypsum boards colonized by fungi [4]. Studies of fungal fragments using scanning electron microscopy (SEM) show that they do not have common characteristics regarding shape and size [5,6,7,8,9], and cannot be identified to genus or species level by morphology.
The fungal fragments have been found in air samples from different settings, such as biofuel plants [10], open horticultural fields [11], agricultural farms [12], indoor air [13,14,15], and outdoor air [16,17]. Due to their small size, these fragments are expected to stay airborne for a longer time than larger particles, and thus the period of exposure may be extended. Under laboratory conditions, some fungal species, like Stachybotrys chartarum, can release more fragments than spores, and these fragments showed higher respiratory deposition than their spores [18]. Other laboratory studies have found that a larger number of spores than fragments are released from e.g., mixed fungal cultures [19], Aspergillus fumigatus [7], and Aspergillus versicolor under certain air velocity condition [20]. Fungal fragments can be allergenic [3] and inflammogenic [19], and have been found in higher concentrations in homes with asthmatic children than in homes without asthmatic children [21].
Grass pollen has been found to be associated with the development of dermatitis [22], asthma [23], and other allergic respiratory diseases [24]. In a controlled-environment chamber study, flowering grasses exposed to a cycle of wetting and drying followed by wind disturbance released pollen fragments smaller than <1 µm; the fragments were detected using high-resolution microscopy and immunolabeling with antibodies [25]. Furthermore, grass-pollen allergens have been detected in the atmospheric aerosol fraction of particles smaller than 0.6 µm in outdoor air [26]. A recent study showed that the concentration of submicron pollen fragments (0.25–1.0 µm) as detected by microscopy can increase to peak value during rain events, and can persist in outdoor air for several hours [27].
Apart from microscopy, there is no method to discriminate between fragments of pollen and fungi and intact pollen and fungi in environmental samples, and therefore the size-selective sampling is important to differentiate them from each other. Fungal spores and pollen have an aerodynamic diameter larger than 1 µm, and to exclude non-fragmented spores and pollen from the sample, fragments of fungi can be sampled as part of the PM1 fraction. The fungal fragments were first detected in pure fungal aerosols generated at laboratory level using an aerodynamic particle sizer e.g., [4,28,29,30], and later also as different fungal components, such as β-d-glucan [14,31], chitinase [10], and immunostaining combined with a field emission SEM [32].
Streptomyces is the most commonly found genus of actinobacteria in indoor environments [33], some Streptomyces species have aerial hyphae that consist of long, straight filaments, which bear spores [34]. The health effects of exposure to the spores of Streptomyces were described in a previous study [35]. The presence of airborne Streptomyces spp. as single spores is of relevance as a species within this genus has caused hypersensitivity pneumonitis [36].
In this study, we wanted to investigate whether it is possible to identify and quantify fragments of fungi, pollen, and actinomycetes in the PM1 fraction from indoor air using qPCR. We have used specific primers for targeting 16 fungal species, three groups of fungal genera, in addition to pollen from one plant species and two groups of plant species, and one actinomycetes. Pairs of PM1 and inhalable particle samples were taken at the same time in the same houses during different seasons have been analyzed. By combining the results obtained in this study and a review of the literature, we also want to see whether the degree of fragmentation is related to species.
2. Materials and Methods
2.1. Selection of Homes and Sampling of the Inhalable and PM1 Fraction in Five Homes
Five homes in Greater Copenhagen were selected, and out of the five homes, there were three detached houses, one townhouse, and one apartment. One of the detached houses has previously had moisture problems while the other did not have any water-damage [37].
Four samples were taken simultaneously each time, two samples of the PM1 fraction and another two of the inhalable fraction. In total 4 × 15 air samples were taken in five homes with an average 6-h sampling period [37]. All samples were taken in the living room of the homes. For a sampling of the inhalable fraction, Gesamtstaubprobenahme (GSP) conical inhalable samplers (CIS by BGI, INC Waltham, Watertown, MA, USA) were mounted with polycarbonate filters (37 mm, pore size 1.0 µm, GE Water Technologies & Solutions, Trevose, PA, USA), more details of the GSP sampler can be found in a previous study [38]. For a sampling of the PM1 fractions, Triplex cyclones (BGI, MA) were also mounted with polycarbonate filters. The Triplex cyclone has a well-defined, sharp penetration curve, with a D50 = 1 µm at a flow rate of 3.5 L per minute, but still, about 1% of particles with a D50 between 1.7 and 2.0 µm penetrate the cyclone [39]. Some spores will be present as clusters or associated with other particles. We assume that 30% of the fungal spores and none of the pollen grains are between 1.7 and 2.0 µm [40]. Based on this, 0.3% of the spores will enter the triplex cyclone. The two samplers were suspended 1.5 m above floor level in the living room of the homes and they sampled simultaneously during the day time with an average sampling period of 345 min (average volume = 1208 l air). Most of the time the occupants were not at home during sampling, and all windows of the homes were kept closed during sampling. One hour after sampling, the filters were frozen at −80 °C and later extracted and used for this study. The inhalable particles collected by the GSP sampler include respirable particles (aerodynamic diameter < 10 μm) but also large particles (aerodynamic diameter up to 100 μm) [38] and they are called GSP samples in the results and discussion.
2.2. Extraction of Filters and Plating
One of the PM1 samples and one of the GSP samples from each sampling position were extracted in 5.0 mL sterile solution (0.05% Tween 80 and 0.85% NaCl) by orbital shaking (500 rpm) for 15 min at room temperature. Following, 100 µl solution of extracts were plated on dichloran glycerol agar (DG-18 agar, Oxoid, Basingstoke, UK) plates for quantification of cultivable fungi. The plates were incubated at 25 °C and the number of colony-forming units (CFUs) were counted after 3, 5, and 7 days of incubation. The data are presented as time-weighted average exposures (TWA) in CFU/m3 air. The CFU data have been part of a previous study [37].
2.3. qPCR of the Inhalable (GSP) and PM1 Fraction
Particles were extracted from the polycarbonate filter samples in 5.0 mL buffer by centrifugation (12,300× g) for 5 min. For total-DNA isolation, the GeneJET DNA Purification Kit (Thermo Scientific, Roskilde, Denmark) was applied with minor modifications. The particles in the GSP samples and PM1 fraction were dissolved in 180 µl of digestion solution and 20 µL of proteinase K (supplied by the manufacturer) and disrupted by bead-beating (Disruptor Genie, Scientific Industries, Bohemia, NY, USA) using acid-washed glass beads (Sigma-Aldrich, Copenhagen, Denmark) for twenty minutes at 2840 rpm. The homogenized supernatant was transferred to a silica-based spin-column for the purification of the DNA and removal of PCR inhibitory compounds. The final elutants were used directly for qPCR analysis. Quantitative polymerase chain reaction (qPCR) assays were prepared using SYBR Green Master Mix (Bio-Rad Laboratories Inc., Hercules, CA, USA), individually optimized concentrations of target-specific primers for the 24 assays, and DNA template for a total volume of 7 μL. qPCR-assays were performed in a Bio-Rad CFX384 Touch Real-Time PCR Detection System (Bio-Rad Laboratories Inc., Hercules, CA, USA). Estimation of spore equivalents was based on the use of standard curves specific for each target (fungal species/fungal group). Standard curves were made from spores harvested from pure cultures. Post spore harvesting and spore counting using a hemocytometer and microscopy, dilution series were made in the range of 1 up to 3 × 10⁷ cells and each dilution was used for separate DNA extractions and qPCR to produce the standard curves. DNA from the following microorganisms was detected using primers for (1) one bacterial genus (Streptomyces spp.), (2) 16 fungal species (Acremonium strictum, Alternaria alternata, Aspergillus fumigatus, Aspergillus versicolor, Aspergillus niger, Chaetomium globosum, Cladosporium cladosporioides, Cladosporium herbarum, Cladosporium sphaerospermum, Penicillium chrysogenum, Pencillium expansum, Rhizopus stolonifer, Stachybotrys chartarum, Trichoderma viride, Ulocladium chartarum, Wallemia sebi), (3) three fungal groups (Mucor/Rhizopus spp., Aspergillus glaucus spp., Penicillium/Aspergillus/Paecilomyces variotii spp.), and (4) one universal measure for the total fungal load. All primer sequences used are designed to target the internal transcribed spacer (ITS) region of the nuclear ribosomal repeat unit. The design is made in-house at House Test and are proprietary. Sequence requests can be made to House Test.. DNA from at least one of these microorganisms was detected in all samples. qPCR results are presented as spore equivalents (SE) per m3 air (SE/m3). In addition, DNA from the following pollen was included in the study, Alnus/Corylus, Betula, and Grasses/Artemisia. The lowest values considered as positive are shown in Table A1.
2.4. Data Treatment
The proportion of fragments (PM1) to inhalable particles (GSP) were calculated as a percentage, and are in the following called PM1/GSP; these values were used to evaluate which species were present as fragments. According to the limitation of the sampler as mentioned in Section 2.1, 0.3% of the particles found in the GSP sampler may by chance have entered the PM1 fraction. Consequently, it could be relevant to have a quantitative approach. As the Triplex cyclone (PM1 sampler) and the GSP samplers sampled the same air volume, the samples can be compared directly, and the DNA copies in the PM1 sample should constitute at least 0.3% of the amount of DNA sampled by the GSP, to be sure that the measured DNA in the PM1 fraction is actually from particles smaller than spores. Hence, when the PM1/GSP was more than 0.3%, it was considered that fungal fragments were detected in PM1 samples.
The data analyses were performed in IBM SPSS Statistics 25 for Windows and SAS 9.4. The concentration data were log-transformed before analysis. Paired samples t-test analysis was used to compare the concentrations in PM1 and GSP samples. An independent sample t-test was used to compare the difference in the concentration between qPCR and CFU. The Pearson correlation between the different measures were calculated. A mixed-effects linear regression model was used to test whether there was an effect of season on the concentration of fragments with the home as a random effect. A positive β-coefficient means there is an elevated concentration in the season. A p-value below 0.05 was considered statistically significant. Statistical analyses for microbial community composition and structure for the airborne fragments were performed and visualized using RStudio with the following R CRAN packages: ggplot2, ampvis2 and vegan. Canonical correspondence analysis (CCA) plots based on weighted Bray–Curtis distance measurements were used to explore the β-diversity. Analysis of similarity (ANOSIM) using Bray–Curtis index values was used to estimate significant differences in microbial diversity between the different sampling seasons and between different homes.
3. Results
3.1. Detection of Different Fungi in PM1 and GSP Samples
The qPCR results showed the universal fungi and the Asp/Pen/Pae group had the most copies of all the fungal species and groups in PM1 (811 and 196 SE/m3) and GSP samples (2.8 × 10⁴ and 4.0 × 10³ SE/m3). The universal primers for fungi were positive in all PM1 and GSP samples, and the Asp/Pen/Pae group was positive in 80% (12/15) and 100% (15/15) of PM1 and GSP samples, respectively. The species Cl. cladosporioides, Cl. herbarum, and Cl. sphaerospermum were the most commonly detected species of all the fungi in both PM1 and GSP samples.
Eight fungal species, Asp. fumigatus, Asp. versicolor, Cl. cladosporioides, Cl. herbarum, Cl. sphaerospermum, Pen. expansum, U. chartarum, and W. sebi were detected in the PM1 samples from the indoor environments, and these fungi were detected in the GSP samples as well (Table 1). In addition to the species found in both the GSP and PM1 samples, five other fungal species: Ac. strictum, Asp. niger, Ch. globosum, R. stolonifer, and T. viride, and two fungal groups: the Aspergillus glaucus group and Mucor/Rhizopus group were detected in the GSP samples.
The concentration of cultivable fungi in GSP samples was between 20 and 1.78 × 10³ CFU/m3, with a geometric mean value (GM) of 148 CFU/m3, and it was significantly higher (p < 0.05) than the fungal concentration in PM1 samples. Of the PM1 samples, 6 out of 15 contained cultivable fungi (n = 6, GM of positive samples = 15 CFU/m3). The concentration of universal fungi in GSP samples measured using qPCR was significantly higher than the concentration of cultivable fungi in GSP samples (p < 0.05).
3.2. PM1/GSP and Correlation between PM1 and GSP Samples—Fungi
The total concentration of fungi as measured using universal fungal primers in GSP samples was significantly higher than that in PM1 samples (p < 0.05) (Table 1).
The PM1/GSP was studied to evaluate whether the fungal DNA found in the PM1 fraction is from fragments or intact spores; a percentage above 0.3 is considered as positive for fragments. The PM1/GSP for the universal fungal primer were in all the samples above 0.3% (n = 15, GM = 2.95%). This shows that fungal fragments smaller than spore size were present and can be detected. For each fungal species with at least 1 positive PM1 sample, the geometric mean of the PM1/GSP was above 0.3%. Of the fungi, the following species had the largest PM1/GSP: U. chartarum (39.64%), Pen. expansum (16.47%), W. sebi (1.16%), and Cl. sphaerospermum (1.08%). The PM1/GSP was 4.68% for the Asp/Pen/Pae group (Table 1).
Correlations between the fungal taxa found in most samples and between PM1 and GSP samples were studied, and only positive correlations were significant (Table A2). For the PM1 samples, the universal fungi correlated significantly with all three Cladosporium species, Asp. versicolor, Asp. fumigatus, and the Asp/Pen/Pae group (all r > 0.50, p < 0.05). For the GSP samples, the universal fungi correlated significantly with the concentration of all three Cladosporium species and with the Asp/Pen/Pae group (all r > 0.50, p < 0.05).
The concentrations of the three Cladosporium species in the PM1 samples correlated significantly with each other and the same was found for the GSP samples (all r > 0.50, p < 0.05). The concentration of Cl. herbarum, Cl. sphaerospermum, the Asp/Pen/Pae group, and universal fungi in the PM1 samples correlated significantly with their concentration in the GSP samples (all r > 0.50, p < 0.05, Table A2).
The concentration of universal fungi in GSP samples correlated significantly with the cultivable fungi in GSP samples (r = 0.84, p < 0.001).
3.3. Differences in Microbial Composition between Seasons—Fungi
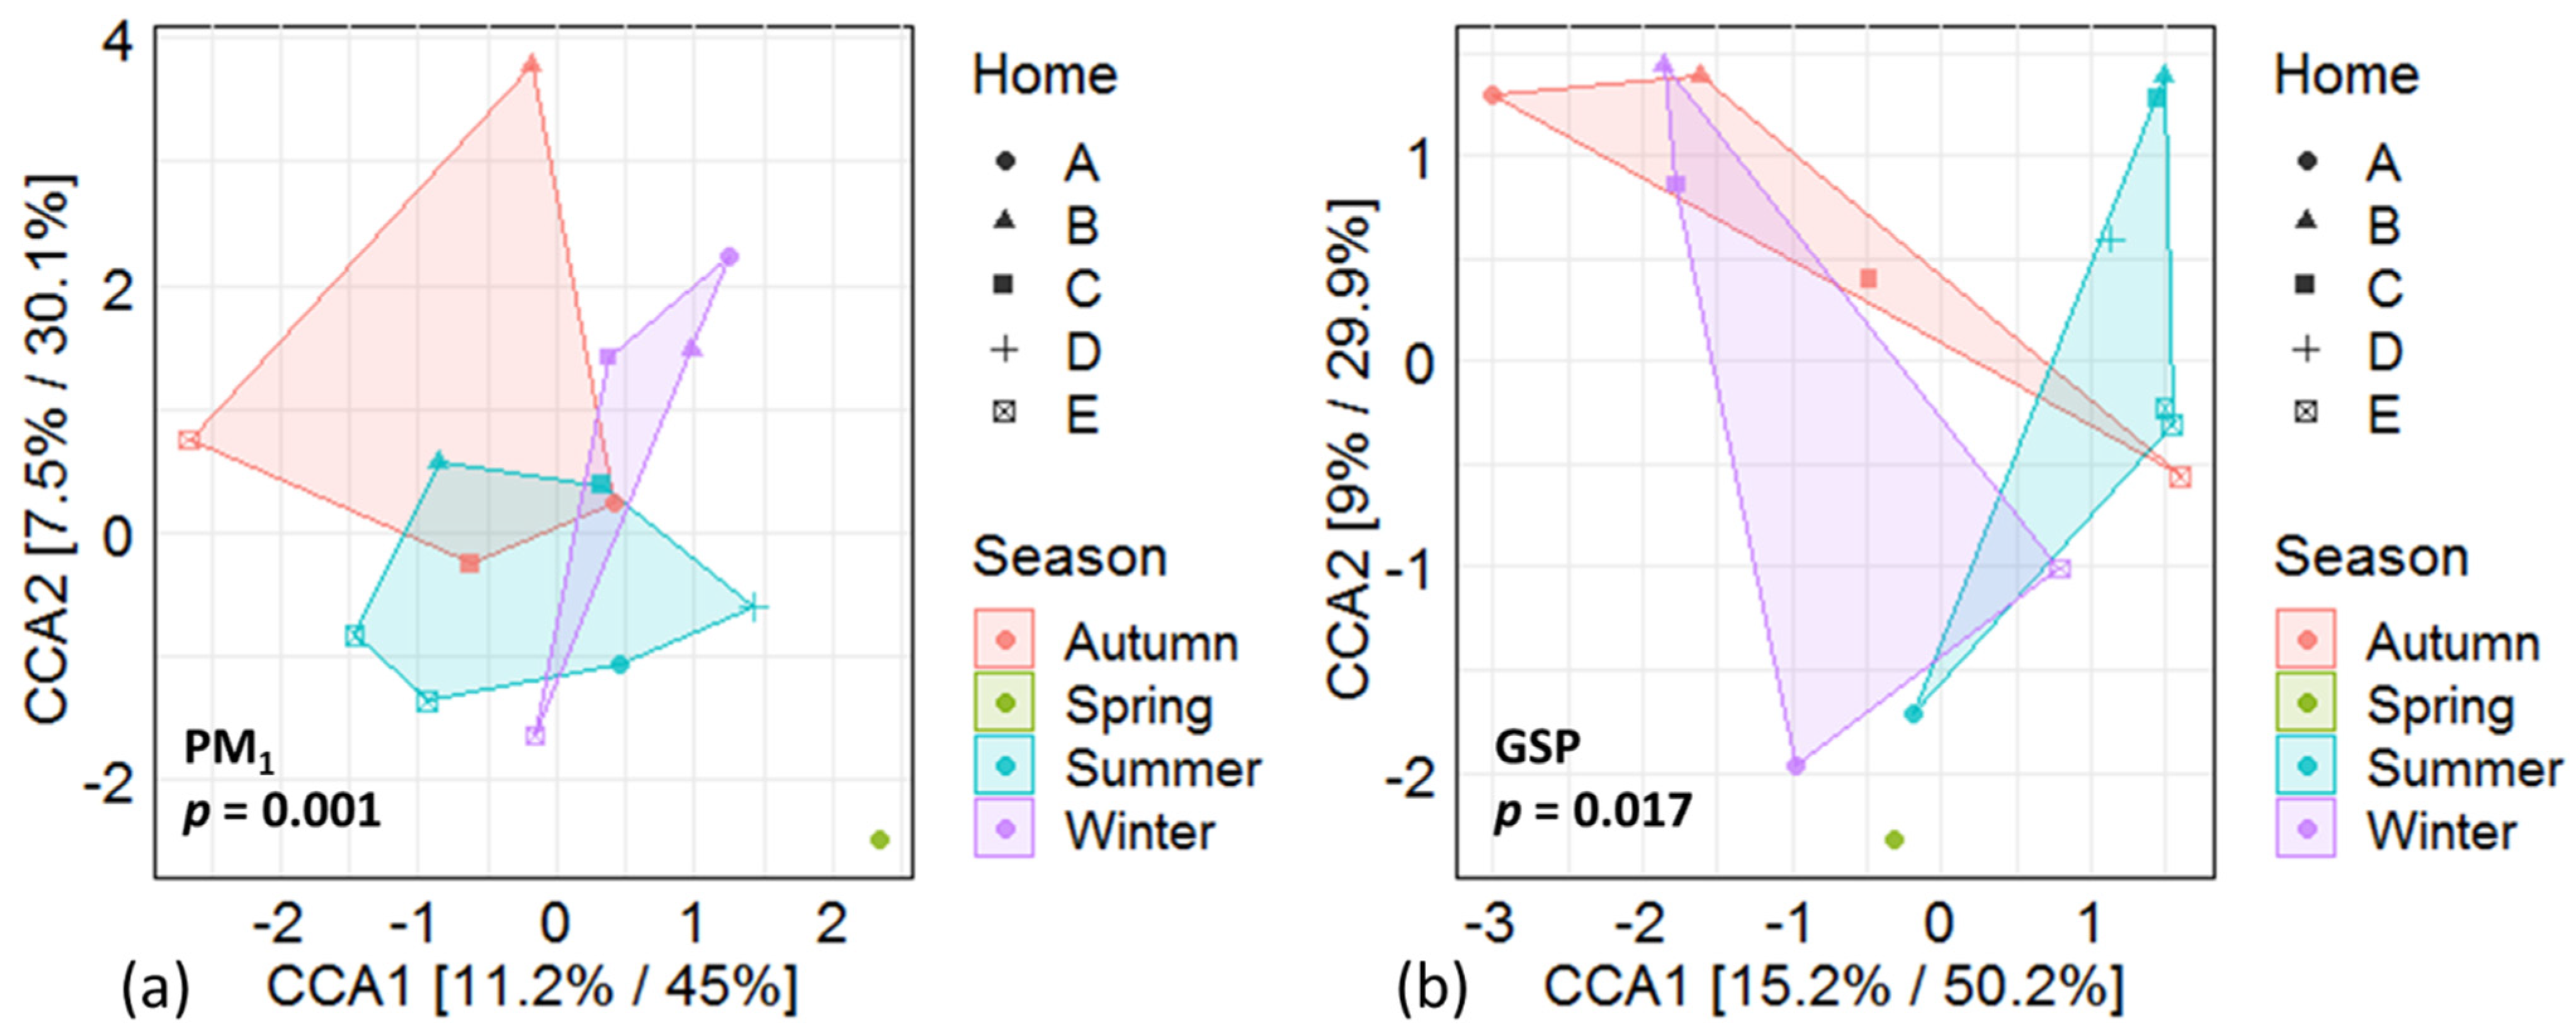
A significant effect of season was found in regards to the fungal β-diversity in the PM1 (p = 0.001; Figure 1a) and GSP samples (p = 0.017; Figure 1b), but no significant difference in β-diversity was found between the 5 homes (p > 0.05, no further data shown). For some of the targeted fungal species, differences in concentrations of DNA copies between seasons were found in the PM1 (Table 2) and GSP (Table 3) samples.
3.4. Pollen
The Alnus/Corylus group of pollen was detected in 4 of 15 PM1 samples, these 4 samples were sampled from 4 different seasons, and 3 of the samples were from the same house, and the fragments might have been re-aerosolized. In contrast, Betula and Grasses/Artemisia were not found in the PM1 fraction. The concentration of Alnus/Corylus pollen in GSP samples was significantly higher than that in the PM1 samples (p < 0.05, Table 1), but the PM1/GSP was relatively large (16.7%). Pollen from all three groups, Alnus/Corylus, Betula, and Grasses/Artemisia were detected in 4, 10, and 6 of the 15 GSP samples, respectively. No significant difference in Alnus/Corylus concentration was found between seasons in both PM1 and GSP samples (p > 0.05, Table 2 and Table 3.). Grasses/Artemisia was present in the highest concentration in spring in GSP samples (Table 3).
3.5. Bacteria
The bacterial genus Streptomyces was found in 9 of 15 PM1 samples and in all of the 15 GSP samples. The concentrations of Streptomyces spp. in PM1 and GSP samples were significantly different (p < 0.05, Table 1). The concentration of Streptomyces spp. in GSP samples correlated significantly with the universal fungi in GSP samples (r = 0.52, p < 0.05) and in PM1 samples (r = 0.61, p < 0.05, Table A2). Significant seasonal differences were found in PM1 samples (p = 0.0041, Table 2), but not in GSP samples (p = 0.27, Table 3).
4. Discussion
The result in this study showed that qPCR can be used to identify the genus or species of airborne fungal and pollen fragments in field samples. Fungal fragments from 8 species were detected in PM1 samples. The knowledge about health effects of exposure to fungal fragments is still not clear, but it can’t be ignored, as for example, an in vitro study with human HL-60 cells showed that fungal fragments of PM1 size induced a pro-inflammatory response [19], and β-glucan has been found in higher concentrations in the fungal fragment size particles in homes with asthmatic children than in homes with non-asthmatic children [21]. To our knowledge, this is the first study to show that Alnus/Corylus pollen, Cladosporium herbarum, Cladosporium sphaerospermum, Penicillium expansum, and Wallemia sebi can be present as airborne particles of PM1 size.
All the species found in the PM1 samples were as expected also detected in the GSP samples, although with higher concentrations in the latter. Based on the data for total fungi 2.95% fungal particles in GSP samples were present as fragments with a particle size less than 1 µm. A study using microscopy found that hyphal fragments in indoor air constituted 6.3% of total fungi (spores + hyphal fragments), however, these fragments were large (2–20 μm, i.e., PM10 fraction) [46]. The high percentages that PM1 constituted out of the amount present in the GSPs for U. chartarum (39.64%), Pen. expansum (16.47%), W. sebi (1.16%), and Cl. Sphaerospermum (1.08%) indicates that these fungal species were more fragmented than the rest of the targeted species. A review of the literature shows that the share of fungi that are present as fragments are very different from study to study and within a study, and this difference is also seen for both field and laboratory studies (Table 1), and it is not clear how much this fragmentation is related to species. For laboratory-generated aerosols, the share of fungi being present as fragments decrease with exposure of fungal colonies to increasing air velocity [28], but the share seems also to be affected by age of culture and the material the fungus is growing on [30,31]. Fungal fragments of the PM1 size seem not to be cultivable [10]. In line with this cultivable fungi were in this study detected only in 6 out of 15 PM1 samples and in concentrations near the detection limit. This corresponds to the aforementioned fraction of larger particles penetrating the cyclone when used for sampling PM1 particles [39]. Studies using another sampler type, the Andersen six-stage sampler, showed low concentrations of cultivable Penicillium, Aspergillus, and Cladosporium spp. in submicron particle size (0.65–1.1 µm) in samples from e.g., homes [48], public buildings [49], and pig farms [50]. A study using a two-stage bioaerosol cyclone sampler found cultivable fungi in the PM1 size in 3 out of 4 agricultural farms [12]. For studies using the electrical low-pressure impactor for sampling, few cultivable fungi are also found in the PM1 size, and the presence of cultivable fungi in that size fraction is suggested to be due to particle bouncing between the different stages of the sampler [6]. Hence, whether some of the small fragments actually can be cultivated or if larger, cultivable fungal spores or hyphae are present by chance or due to bouncing, still need to be further studied.
Thirteen different fungal species were detected in the GSP samples in this study. In a previous study, nineteen samples were taken in the same five living rooms in the same periods, and the dominating fungal species were identified using a combination of culturing and subsequent analysis by MALDI-TOF MS. Compared with analysis by qPCR, MALDI-TOF MS method has the advantage that not only predetermined species are possible to detect. Thus in addition to the species found in the GSP samples in this study, Asp. flavus, Asp. nidulans, Asp. glaucus and Asp. penicilloides, Epicoccum nigrum, Fusarium proliferatum, two Candida species, and eight Penicillium species were found [51]. The use of DNA-primers for quantification and identification of airborne microorganisms has the advantage that also non-viable species and dormant and dead microorganisms as long as DNA is present can be identified. However, the concentration of DNA from fungal fragments in the tested sample may not be proportional to the concentration of the “true” fungal fragments as some DNA can be lost during purification and some fragments may not contain genomic DNA. Previous studies with aerosolized Cladosporium [52] and Wallemia sebi [53] from different environments found that PCR quantification detected higher concentrations than CFU counting. Similar results were also found in this study. On the other hand, we found a significant correlation between the concentration of fungi measured as universal fungi by qPCR and measured by cultivation in GSP samples (r = 0.837, p < 0.001). Similarly, a study found a significant correlation between qPCR and CFU counts for Thermoactinomyces vulgaris [54] while a study with surface samples showed the only correlation between the two methods for samples with high fungal and Streptomyces spp. concentrations [55]. For future studies, it could be relevant to use e.g., cultivation and MALDI-TOF MS as the first step to obtaining knowledge about dominating viable species in general, and following use primers for the dominating species and/or for the most health-relevant species.
Cladosporium was the most common genus in both sample types, which was also reflected in the correlation between total fungi and each Cladosporium species. The dominance of Cladosporium spp. is in accordance with a review study about fungi in indoor air [56]. The concentration of total fungi correlated also with Asp/Pen/Pae group in both GSP and PM1 samples. In our previous studies with the cultivation of fungi, we found Penicillium, Aspergillus, and Cladosporium to be present in the highest concentrations [19].
The fungal species composition in the GSP sampled from indoor air varied between seasons, and similar results have previously been reported in indoor air in homes in the USA [57]. The seasonal variation of fungal species composition and concentration may be due to variation in air change rate and relative humidity through a year [51], and the seasonality in outdoor species [58]. The highest concentration of Cladosporium species was found in summer, similar to an outdoor air study in Poland [59]. In this study, seasonality was found for Asp. niger and this has also been found in indoor dust in Finland [60]. The allergenic species U. chartarum was found in a sample taken in autumn and spring. A study from France has also found this species in indoor air [61]. The species Pen. expansum was found in the highest concentrations in spring. This species has previously been found in nursing homes in Denmark [62] and in dwellings in France [63]. In vitro studies with human cell lines show that this species can be cytotoxic [64] and inflammogen [62].
Three groups of pollen, Alnus/Corylus, Betula, and Grasses/Artemisia, were detected in GSP samples with the qPCR method. We chose to investigate Alnus/Corylus as they are among the first pollen to appear in outdoor air in Europe (December to April), and as they act as primers of allergic sensitization to other pollen allergens, like Betula allergens [65]. We have chosen to investigated Betula pollen as they are considered as major allergens, and they have been long-term monitored in several European countries e.g., Denmark [66], Finland [67], and Croatia [68]. Artemisia pollen allergy is also common in Europe [69], and a recent study has identified it as the main vector for airborne endotoxin from gram-negative bacteria [70].
On one hand, pollen fragments of small particle sizes have been described to be only rarely found, probably because the pollen-grain wall resists fragmentation [65]. On the other hand, some severe weather, like thunderstorms and rain events can cause that pollen to break into small fragments [27]. A study showed that exposure to water can induce the respirable allergen-bearing particles to be released from grass pollens [71]. Furthermore, a review study describes that pollen fragments contain allergens and a range of other compounds [72]. In addition, grass pollen allergens were detected in the fraction with small particles (0.6–1.3 μm) of atmospheric dust [73]. As mentioned, we found pollen fragments of Alnus/Corylus in four PM1 samples in normal indoor air. We expected it to be possible to obtain knowledge about the importance of these small particles in environments with complex exposure using the combination of methods used in this study. Thunderstorm-related asthma is a health risk that is suggested to be caused by the small pollen fragments entering the airways [74]. With this study, we show fragments of Alnus/Corylus pollen can be found in normal indoor air.
The concentration of airborne Betula pollen tended to be lower in the winter than during the other seasons, and according to the Danish pollen calendar, the highest concentrations are expected in spring. Alnus/Corylus pollen and pollen fragments tended to be highest in the spring, and this is in accordance with the Danish pollen calendar. Grasses/Artemisia concentrations tended to be highest in spring and summer which is also in accordance with the pollen calendar [75].
In this study, Streptomyces were detected in 60% of the PM1 samples and all the GSP samples. Streptomyces has in a previous study been found in the indoor air in up to 8% of the samples [76]. Similar to a previous study [33], we found Streptomyces spp. to significantly correlate with total fungi. Of the airborne inhalable Streptomyces spp. 3.7% had a particle size of less than 1 µm in our study. At the laboratory level aerosols generated from Streptomyces albus had a geometric mean diameter of 0.98 µm [77] and spores an optical diameter of 0.7 µm [78]. Thus, based on data from that species most particles would be expected to belong to the PM1 fraction. The small share present in the PM1 fraction in this study shows that spores were present in clusters or associated with other particles, or were present as larger fragments of hyphae.
5. Conclusions
This study showed that it is possible to identify fungi, pollen, and the bacterial genus Streptomyces in the PM1 aerosol fraction using a qPCR assay. Eight fungal species, Asp. fumigatus, Asp. versicolor, Cl. cladosporioides, Cl. herbarum, Cl. sphaerospermum, Pen. expansum, U. chartarum, and W. sebi, the Asp/Pen/Pae group, the universal fungi, pollen from Alnus/Corylus, and Streptomyces spp. were found in both PM1 and GSP samples from indoor air using a qPCR approach, and this approach can be relevant in future epidemiological studies. Alnus/Corylus fragments constituted 17% of what was found in the inhalable fraction. Even though spores of Streptomyces spp. have an optical diameter smaller than 1 µm only 4% of the inhalable fraction was present in the PM1 fraction. A significant effect of season was found on fungal species concentrations and composition in the PM1 and GSP samples. For the universal fungal primers, 3% were present as fragments, and for the individual species, the PM1 fraction constituted between 0.4 and 40% of what was found in the inhalable fraction.
Using qPCR analysis to detect microorganisms in the PM1 fraction had some advantages, but there are still factors that can affect the results as e.g., DNA-free fragments in the PM1 fraction, hence, further studies are needed to focus on the effects of these factors on this method.
Author Contributions
R.L., writing—original draft preparation, formal analysis, data curation visualization, investigation; A.D.P. and J.N.L., methodology and formal analysis; Y.L., writing—review and editing; A.M.M., formal analysis, supervision, project administration, funding acquisition and writing—review and editing. All authors have read and agreed to the published version of the manuscript.
Funding
This research was funded by the REALDANIA foundation and the National Research Centre for the Working Environment, Denmark.
Institutional Review Board Statement
Not applicable.
Informed Consent Statement
Not applicable.
Data Availability Statement
The data presented in this study are available on request from the corresponding author. The data are not publicly available because the company House Test wants to keep data priority.
Acknowledgments
We thank Mika Frankel and Margit W. Frederiksen from National Research Centre for the Working Environment (NRCWE) for their work on the project. We also want to thank John Kerr White for providing language help. Special thanks to the occupants of the homes where the sampling was conducted.
Conflicts of Interest
The authors declare no conflict of interest.
Appendix A

Table A1.
The lowest value considered as positive for each organism in PM1 and GSP samples, and in brackets the highest measured value for organisms below the detection (bd).
Table A1.
The lowest value considered as positive for each organism in PM1 and GSP samples, and in brackets the highest measured value for organisms below the detection (bd).
| SE */Sample | ||
|---|---|---|
| PM1 | GSP | |
| Fungal species | ||
| Acremonium strictum | Bd (7) | 10 |
| Alternaria alternata | Bd (0) | Bd (1) |
| Aspergillus fumigatus | 14 | 14 |
| Aspergillus niger | Bd (2) | 17 |
| Aspergillus versicolor | 9 | 86 |
| Chaetomium globosum | Bd (2) | 14 |
| Cladosporium cladosporioides | 17 | 54 |
| Cladosporium herbarum | 12 | 76 |
| Cladosporium sphaerospermum | 9 | 14 |
| Penicillium chrysogenum | Bd (0) | Bd (0) |
| Penicillium expansum | 12 | 12 |
| Rhizopus stolonifer | Bd (1) | 18 |
| Stachybotrys chartarum | Bd (1) | Bd (2) |
| Tricoderma viride | 11 | 11 |
| Ulocladium chartarum | 8 | 8 |
| Wallemia sebi | 19 | 55 |
| Fungal Group | ||
| Aspergillus glaucus group | Bd (3) | 17 |
| Mucor/Rhizopus group | Bd (13) | 30 |
| Asp/Pen/Pae group | 50 | 54 |
| Universal fungi | 338 | 4300 |
| Pollen | ||
| Betula | Bd (14) | 25 |
| Alnus/Corylus | 15 | 15 |
| Grasses/Artemisia | Bd (7) | 30 |
| Bacterial genus | ||
| Streptomyces spp. | 19 | 50 |
* SE: spore equivalent.
Appendix B
Table A2.
Correlation coefficients (r) between concentrations of fungi and pollen in PM1 and GSP samples as measured using Pearson’s correlation coefficient.
Table A2.
Correlation coefficients (r) between concentrations of fungi and pollen in PM1 and GSP samples as measured using Pearson’s correlation coefficient.
| Organisms | Sample Type Number | GSPa | GSPb | GSPc | GSPd | GSPe | GSPf | GSPg | GSPh | GSPi | GSPj | GSPk | GSPl | PMa | PMb | PMc | PMd | PMe | PMf | PMg | PMh | PMi | PMj | PMk | PMl |
|---|---|---|---|---|---|---|---|---|---|---|---|---|---|---|---|---|---|---|---|---|---|---|---|---|---|
| As. fumigatus | GSPa | 1.00 | |||||||||||||||||||||||
| As. versicolor | GSPb | −0.13 | 1.00 | ||||||||||||||||||||||
| Cl.cladosporioides | GSPc | 0.54 * | 0.19 | 1.00 | |||||||||||||||||||||
| Cl. herbarum | GSPd | 0.58 * | 0.14 | 0.94 ** | 1.00 | ||||||||||||||||||||
| Cl. sphaerospermum | GSPe | 0.67 ** | 0.08 | 0.90 ** | 0.95 ** | 1.00 | |||||||||||||||||||
| Alnus/Corylus | GSPf | 0.39 | 0.19 | 0.15 | 0.05 | 0.19 | 1.00 | ||||||||||||||||||
| Asp/Pen/Paegroup | GSPg | 0.39 | 0.75 ** | 0.49 | 0.45 | 0.42 | 0.36 | 1.00 | |||||||||||||||||
| Pen. expansum | GSPh | −0.23 | 0.69 ** | −0.28 | −0.31 | −0.29 | 0.39 | 0.38 | 1.00 | ||||||||||||||||
| Streptomyces spp. | GSPi | 0.69 ** | 0.18 | 0.60 * | 0.64 ** | 0.75 ** | 0.46 | 0.54 * | 0.05 | 1.00 | |||||||||||||||
| U. chartarum | GSPj | 0.10 | 0.33 | −0.02 | −0.05 | −0.07 | 0.65 ** | 0.48 | 0.54 * | 0.28 | 1.00 | ||||||||||||||
| Universal fungi | GSPk | 0.48 | 0.35 | 0.87 ** | 0.85 ** | 0.78 * | 0.37 | 0.56 * | 0.03 | 0.52 * | 0.19 | 1.00 | |||||||||||||
| W. sebi | GSPl | −0.05 | 0.30 | −0.14 | −0.22 | −0.21 | 0.46 | 0.04 | 0.56* | −0.09 | 0.32 | 0.19 | 1.00 | ||||||||||||
| As. fumigatus | PMa | 0.43 | 0.16 | 0.25 | 0.26 | 0.36 | 0.42 | 0.41 | 0.15 | 0.36 | 0.47 | 0.36 | −0.04 | 1.00 | |||||||||||
| As. versicolor | PMb | 0.56 * | 0.16 | 0.17 | 0.30 | 0.28 | 0.14 | 0.48 | 0.15 | 0.53 * | 0.26 | 0.26 | 0.09 | 0.46 | 1.00 | ||||||||||
| Cl.cladosporioides | PMc | 0.46 | 0.06 | 0.37 | 0.41 | 0.51 | 0.36 | 0.29 | 0.05 | 0.58 * | 0.14 | 0.48 | 0.28 | 0.48 | 0.60 * | 1.00 | |||||||||
| Cl. herbarum | PMd | 0.32 | −0.08 | 0.58 * | 0.61 * | 0.62 * | 0.12 | 0.31 | −0.39 | 0.49 | 0.15 | 0.46 | −0.27 | 0.46 | 0.44 | 0.58 * | 1.00 | ||||||||
| Cl. sphaerospermum | PMe | 0.53 * | 0.29 | 0.56 * | 0.62 * | 0.66 ** | 0.40 | 0.62 * | −0.01 | 0.79 ** | 0.31 | 0.54 * | −0.05 | 0.43 | 0.69 ** | 0.58 * | 0.77 ** | 1.00 | |||||||
| Alnus/Corylus | PMf | 0.54 * | 0.15 | 0.32 | 0.27 | 0.37 | 0.76 ** | 0.51 | 0.16 | 0.71 ** | 0.58 * | 0.37 | 0.17 | 0.56 * | 0.57 * | 0.64 * | 0.57 * | 0.78 ** | 1.00 | ||||||
| Asp/Pen/Paegroup | PMg | 0.55 * | 0.24 | 0.51 | 0.56 * | 0.64 * | 0.38 | 0.56 * | 0.06 | 0.82 ** | 0.30 | 0.45 | −0.07 | 0.52 * | 0.73 ** | 0.62 * | 0.75 ** | 0.95 ** | 0.79 ** | 1.00 | |||||
| Pen. expansum | PMh | 0.21 | 0.45 | 0.09 | −0.01 | 0.08 | 0.42 | 0.49 | 0.38 | 0.22 | 0.39 | 0.23 | 0.17 | 0.81 ** | 0.42 | 0.32 | 0.18 | 0.33 | 0.48 | 0.39 | 1.00 | ||||
| Streptomyces spp. | PMi | 0.02 | 0.54 * | 0.16 | 0.20 | 0.21 | 0.25 | 0.55 * | 0.48 | 0.49 | 0.64 ** | 0.17 | 0.16 | 0.33 | 0.37 | 0.27 | 0.38 | 0.57 * | 0.46 | 0.62 * | 0.26 | 1.00 | |||
| U. chartarum | PMj | 0.12 | 0.33 | 0.08 | 0.11 | 0.07 | −0.03 | 0.41 | −0.06 | 0.24 | 0.13 | −0.05 | −0.23 | 0.33 | 0.48 | 0.29 | 0.42 | 0.52 * | 0.47 | 0.50 | 0.34 | 0.37 | 1.00 | ||
| Universal fungi | PMk | 0.53 * | 0.32 | 0.51 | 0.58 * | 0.60 * | 0.40 | 0.57 * | 0.20 | 0.61 * | 0.31 | 0.65 ** | 0.19 | 0.59 * | 0.71 ** | 0.83 ** | 0.64 * | 0.76 ** | 0.70 ** | 0.79 ** | 0.38 | 0.46 | 0.44 | 1.00 | |
| W. sebi | PMl | −0.32 | 0.28 | 0.10 | 0.08 | 0.06 | 0.22 | 0.15 | 0.08 | 0.21 | 0.24 | 0.13 | 0.02 | −0.22 | −0.35 | 0.04 | 0.06 | 0.12 | 0.10 | −0.05 | −0.14 | 0.23 | 0.04 | −0.13 | 1.00 |
* Correlation is significant at the 0.05 level (2-tailed). ** Correlation is significant at the 0.01 level (2-tailed). Only the Organisms which were detected both in PM1 and GSP samples were listed. Sample type number: GSP and PM1 are two sample types, letters a to l are different organisms that are listed in the left-most column.
References
- Denning, D.W.; O’Driscoll, B.R.; Hogaboam, C.M.; Bowyer, P.; Niven, R.M. The link between fungi and severe asthma: A summary of the evidence. Eur. Respir. J. 2006, 27, 615–626. [Google Scholar] [CrossRef] [PubMed] [Green Version]
- Dellavalle, C.T.; Triche, E.W.; Leaderer, B.P.; Bell, M.L. Effects of ambient pollen concentrations on frequency and severity of asthma symptoms among asthmatic children. Epidemiology 2012, 23, 55–63. [Google Scholar] [CrossRef] [Green Version]
- Green, B.J.; Tovey, E.R.; Sercombe, J.K.; Blachere, F.M.; Beezhold, D.H.; Schmechel, D. Airborne fungal fragments and allergenicity. Med. Mycol. 2006, 44, 245–255. [Google Scholar] [CrossRef] [Green Version]
- Kildesø, J.; Würtz, H.; Nielsen, K.F. Quantification of the release of fungal spores from water damaged plasterboards. In Proceedings of the Danish-Finnish Workshop on Moulds in Buildings, Helsingør, Denmark, 7–8 October 1999. [Google Scholar]
- Afanou, K.A.; Straumfors, A.; Skogstad, A.; Nilsen, T.; Synnes, O.; Skaar, I.; Hjeljord, L.; Tronsmo, A.; Green, B.J.; Eduard, W. Submicronic fungal bioaerosols: High-resolution microscopic characterization and quantification. Appl. Environ. Microbiol. 2014, 80, 7122–7130. [Google Scholar] [CrossRef] [PubMed] [Green Version]
- Madsen, A.M.; Larsen, S.T.; Koponen, I.K.; Kling, K.I.; Barooni, A.; Karottki, D.G.; Tendal, K.; Wolkoff, P. Generation and characterization of indoor fungal aerosols for inhalation studies. Appl. Environ. Microbiol. 2016, 82, 2479–2493. [Google Scholar] [CrossRef] [PubMed] [Green Version]
- Afanou, K.A.; Straumfors, A.; Skogstad, A.; Skaar, I.; Hjeljord, L.; Skare, Ø.; Green, B.J.; Tronsmo, A.; Eduard, W. Profile and morphology of fungal aerosols characterized by field emission scanning electron microscopy (FESEM). Aerosol Sci. Technol. 2015, 49, 423–435. [Google Scholar] [CrossRef] [PubMed] [Green Version]
- Green, B.J.; Schmechel, D.; Summerbell, R.C. Aerosolized fungal fragments. In Fundamentals of Mold Growth in Indoor Environments and Strategies for Healthy Living; Wageningen Academic Publishers: Wageningen, The Netherlands, 2011; Volume 8, pp. 211–243. [Google Scholar]
- Górny, R.L. Filamentous microorganisms and their fragments in indoor air—A review. Ann. Agric. Environ. Med. 2004, 11, 185–197. [Google Scholar] [PubMed]
- Madsen, A.M.; Schlünssen, V.; Olsen, T.; Sigsgaard, T.; Avci, H. Airborne fungal and bacterial components in PM1 dust from biofuel plants. Ann. Occup. Hyg. 2009, 53, 749–757. [Google Scholar] [CrossRef] [PubMed] [Green Version]
- Tendal, K.; Madsen, A.M. Exposure to airborne microorganisms, hyphal fragments, and pollen in a field of organically grown strawberries. Aerobiologia 2011, 27, 13–23. [Google Scholar] [CrossRef]
- Lee, S.A.; Liao, C.H. Size-selective assessment of agricultural workers’ personal exposure to airborne fungi and fungal fragments. Sci. Total Environ. 2014, 466–467, 725–732. [Google Scholar] [CrossRef] [PubMed]
- Adhikari, A.; Reponen, T.; Rylander, R. Airborne fungal cell fragments in homes in relation to total fungal biomass. Indoor Air 2013, 23, 142–147. [Google Scholar] [CrossRef] [PubMed]
- Singh, U.; Reponen, T.; Cho, K.J.; Grinshpun, S.A.; Adhikari, A.; Levin, L.; Indugula, R.; Green, B.J. Airborne endotoxin and β-D-glucan in PM1 in agricultural and home environments. Aerosol Air Qual. Res. 2011, 11, 376–386. [Google Scholar] [CrossRef]
- Reponen, T.; Seo, S.C.; Grimsley, F.; Lee, T.; Crawford, C.; Grinshpun, S.A. Fungal fragments in moldy houses: A field study in homes in New Orleans and Southern Ohio. Atmos. Environ. 2007, 41, 8140–8149. [Google Scholar] [CrossRef] [PubMed] [Green Version]
- Gou, H.; Lu, J.; Li, S.; Tong, Y.; Xie, C.; Zheng, X. Assessment of microbial communities in PM1 and PM10 of Urumqi during winter. Environ. Pollut. 2016, 214, 202–210. [Google Scholar] [CrossRef] [PubMed]
- Xu, C.; Wei, M.; Chen, J.; Zhu, C.; Li, J.; Lv, G.; Xu, X.; Zheng, L.; Sui, G.; Li, W.; et al. Fungi diversity in PM2.5 and PM1 at the summit of Mt. Tai: Abundance, size distribution, and seasonal variation. Atmos. Chem. Phys. 2017, 17, 11247–11260. [Google Scholar] [CrossRef] [Green Version]
- Cho, S.H.; Seo, S.C.; Schmechel, D.; Grinshpun, S.A.; Reponen, T. Aerodynamic characteristics and respiratory deposition of fungal fragments. Atmos. Environ. 2005, 39, 5454–5465. [Google Scholar] [CrossRef]
- Frankel, M.; Hansen, E.W.; Madsen, A.M. Effect of relative humidity on the aerosolization and total inflammatory potential of fungal particles from dust-inoculated gypsum boards. Indoor Air 2014, 24, 16–28. [Google Scholar] [CrossRef] [PubMed]
- Lee, J.H.; Hwang, G.B.; Jung, J.H.; Lee, D.H.; Lee, B.U. Generation characteristics of fungal spore and fragment bioaerosols by airflow control over fungal cultures. J. Aerosol Sci. 2010, 41, 319–325. [Google Scholar] [CrossRef]
- Seo, S.C.; Choung, J.T.; Cehn, B.T.; Lindsley, W.G.; Kim, K.Y. The level of submicron fungal fragments in homes with asthmatic children. Environ. Res. 2014, 131, 71–76. [Google Scholar] [CrossRef] [PubMed] [Green Version]
- Paulskn, E.; Søgaard, J.; Anderskn, K.E. Occupational dermatitis in Danish gardeners and greenhouse workers (III). Compositae-related symptoms. Contact Dermat. 1998, 38, 140–146. [Google Scholar] [CrossRef] [PubMed]
- Suphioglu, C.; Singh, M.B.; Taylor, P.; Knox, R.B.; Bellomo, R.; Holmes, P.; Puy, R. Mechanism of grass-pollen-induced asthma. Lancet 1992, 339, 569–572. [Google Scholar] [CrossRef]
- Davies, J.M. Grass pollen allergens globally: The contribution of subtropical grasses to burden of allergic respiratory diseases. Clin. Exp. Allergy 2014, 44, 790–801. [Google Scholar] [CrossRef] [PubMed]
- Taylor, P.E.; Flagan, R.C.; Valenta, R.; Glovsky, M.M. Release of allergens as respirable aerosols: A link between grass pollen and asthma. J. Allergy Clin. Immunol. 2002, 109, 51–56. [Google Scholar] [CrossRef] [PubMed]
- Spieksma, F.T.M.; Kramps, J.A.; Van der Linden, A.C.; Nikkels, B.H.; Plomp, A.; Koerten, H.K.; Dijkman, J.H. Evidence of grass-pollen allergenic activity in the smaller micronic atmospheric aerosol fraction. Clin. Exp. Allergy 1990, 20, 273–280. [Google Scholar] [CrossRef] [PubMed]
- Hughes, D.D.; Mampage, C.B.A.; Jones, L.M.; Liu, Z.; Stone, E.A. Characterization of Atmospheric Pollen Fragments during Springtime Thunderstorms. Environ. Sci. Technol. Lett. 2020, 7, 409–414. [Google Scholar] [CrossRef]
- Mensah-Attipoe, J.; Saari, S.; Veijalainen, A.M.; Pasanen, P.; Keskinen, J.; Leskinen, J.T.T.; Reponen, T. Release and characteristics of fungal fragments in various conditions. Sci. Total Environ. 2016, 547, 234–243. [Google Scholar] [CrossRef] [PubMed]
- Górny, R.L.; Reponen, T.; Willeke, K.; Schmechel, D.; Robine, E.; Boissier, M.; Grinshpun, S.A. Fungal fragments as indoor air biocontaminants. Appl. Environ. Microbiol. 2002, 68, 3522–3531. [Google Scholar] [CrossRef] [Green Version]
- Kildesø, J.; Würtz, H.; Nielsen, K.F.; Kruse, P.; Wilkins, K.; Thrane, U.; Gravesen, S.; Nielsen, P.A.; Schneider, T. Determination of fungal spore release from wet building materials. Indoor Air 2003, 13, 148–155. [Google Scholar] [CrossRef]
- Madsen, A.M. Effects of Airflow and Changing Humidity on the Aerosolization of Respirable Fungal Fragments and Conidia of Botrytis cinerea. Appl. Environ. Microbiol. 2012, 78, 3999–4007. [Google Scholar] [CrossRef] [PubMed] [Green Version]
- Afanou, K.A.; Straumfors, A.; Skogstad, A.; Nayak, A.P.; Skaar, I.; Hjeljord, L.; Tronsmo, A.; Eduard, W.; Green, B.J. Indirect immunodetection of fungal fragments by field emission scanning electron microscopy. Appl. Environ. Microbiol. 2015, 81, 5794–5803. [Google Scholar] [CrossRef] [PubMed] [Green Version]
- Johansson, E.; Reponen, T.; Meller, J.; Vesper, S.; Yadav, J. Association of Streptomyces community composition determined by PCR-denaturing gradient gel electrophoresis with indoor mold status. Environ. Monit. Assess. 2014, 186, 8773–8783. [Google Scholar] [CrossRef] [PubMed]
- Mazza, P.; Noens, E.E.; Schirner, K.; Grantcharova, N.; Mommaas, A.M.; Koerten, H.K.; Muth, G.; Flärdh, K.; Van Wezel, G.P.; Wohlleben, W. MreB of Streptomyces coelicolor is not essential for vegetative growth but is required for the integrity of aerial hyphae and spores. Mol. Microbiol. 2006, 60, 838–852. [Google Scholar] [CrossRef] [PubMed]
- Jussila, J.; Pelkonen, J.; Kosma, V.M.; Mäki-Paakkanen, J.; Komulainen, H.; Hirvonen, M.R. Systemic immunoresponses in mice after repeated exposure of lungs to spores of Streptomyces californicus. Clin. Diagn. Lab. Immunol. 2003, 10, 30–37. [Google Scholar] [CrossRef] [PubMed] [Green Version]
- Kagen, S.L.; Fink, J.N.; Schlueter, D.P.; Kurup, V.P.; Fruchtman, R.B. Streptomyces albus: A new cause of hypersensitivity pneumonitis. J. Allergy Clin. Immunol. 1981, 68, 295–299. [Google Scholar] [CrossRef]
- Frankel, M.; Bekö, G.; Timm, M.; Gustavsen, S.; Hansen, E.W.; Madsen, A.M. Seasonal variations of indoor microbial exposures and their relation to temperature, relative humidity, and air exchange rate. Appl. Environ. Microbiol. 2012, 78, 8289–8297. [Google Scholar] [CrossRef] [Green Version]
- Kenny, L.C.; Aitken, R.J.; Baldwin, P.E.J.; Beaumont, G.C.; Maynard, A.D. The sampling efficiency of personal inhalable aerosol samplers in low air movement environments. J. Aerosol Sci. 1999, 30, 627–638. [Google Scholar] [CrossRef]
- Kenny, L.C.; Gussman, R.A. A direct approach to the design of cyclones for aerosol-monitoring applications. J. Aerosol Sci. 2000, 31, 1407–1420. [Google Scholar] [CrossRef]
- Choi, S.-J. The Effect of Outdoor Air and Indoor Human Activity on Mass Concentrations of Size-Selective Particulate in Classrooms. Korean J. Environ. Heal. Sci. 2008, 34, 137–147. [Google Scholar] [CrossRef] [Green Version]
- Green, B.J.; Schmechel, D.; Tovey, E.R. Detection of Aerosolized alternaria alternata conidia, hyphae, and fragments by using a novel double-immunostaining technique. Clin. Diagn. Lab. Immunol. 2005, 12, 1114–1116. [Google Scholar] [CrossRef] [PubMed] [Green Version]
- Kanaani, H.; Hargreaves, M.; Ristovski, Z.; Morawska, L. Fungal spore fragmentation as a function of airflow rates and fungal generation methods. Atmos. Environ. 2009, 43, 3725–3735. [Google Scholar] [CrossRef] [Green Version]
- Górny, R.L.; Ławniczek-Wałczyk, A. Effect of two aerosolization methods on the release of fungal propagules from a contaminated agar surface. Ann. Agric. Environ. Med. 2012, 19, 279. [Google Scholar] [PubMed]
- Madsen, A.M.; Kruse, P.; Schneider, T. Characterization of microbial particle release from biomass and building material surfaces for inhalation exposure risk assessment. Ann. Occup. Hyg. 2006, 50, 175–187. [Google Scholar] [CrossRef] [PubMed] [Green Version]
- Afanou, A.K.; Straumfors, A.; Eduard, W. Fungal aerosol composition in moldy basements. Indoor Air 2019, 29, 780–790. [Google Scholar] [CrossRef] [PubMed]
- Li, D.-W.; Kendrick, B. A year-round comparison of fungal spores in indoor and outdoor air. Mycologia 1995, 29, 190–195. [Google Scholar] [CrossRef]
- Hammed, A.A.A.; Khodr, M.I. Suspended particulates and bioaerosols emitted from an agricultural non-point source. J. Environ. Monit. 2001, 3, 206–209. [Google Scholar] [CrossRef]
- Liu, Z.; Li, A.; Hu, Z.; Sun, H. Study on the potential relationships between indoor culturable fungi, particle load and children respiratory health in Xi’an, China. Build. Environ. 2014, 80, 105–114. [Google Scholar] [CrossRef]
- Kim, K.Y.; Kim, C.N. Airborne microbiological characteristics in public buildings of Korea. Build. Environ. 2007, 42, 2188–2196. [Google Scholar] [CrossRef]
- White, J.K.; Nielsen, J.L.; Madsen, A.M. Potential Respiratory Deposition and Species Composition of Airborne Culturable, Viable, and Non-Viable Fungi during Occupancy in a Pig Farm. Atmosphere 2020, 11, 639. [Google Scholar] [CrossRef]
- Knudsen, S.M.; Gunnarsen, L.; Madsen, A.M. Airborne fungal species associated with mouldy and non-mouldy buildings—Effects of air change rates, humidity, and air velocity. Build. Environ. 2017, 122, 161–170. [Google Scholar] [CrossRef]
- Zeng, Q.Y.; Westermark, S.O.; Rasmuson-Lestander, Å.; Wang, X.R. Detection and quantification of Cladosporium in aerosols by real-time PCR. J. Environ. Monit. 2006, 8, 153–160. [Google Scholar] [CrossRef] [PubMed]
- Zeng, Q.Y.; Westermark, S.O.; Rasmuson-Lestander, Å.; Wang, X.R. Detection and quantification of Wallemia sebi in aerosols by real-time PCR, conventional PCR, and cultivation. Appl. Environ. Microbiol. 2004, 70, 7295–7302. [Google Scholar] [CrossRef] [PubMed] [Green Version]
- Betelli, L.; Duquenne, P.; Grenouillet, F.; Simon, X.; Scherer, E.; Géhin, E.; Hartmann, A. Development and evaluation of a method for the quantification of airborne Thermoactinomyces vulgaris by real-time PCR. J. Microbiol. Methods 2013, 92, 25–32. [Google Scholar] [CrossRef] [PubMed]
- Pietarinen, V.M.; Rintala, H.; Hyvärinen, A.; Lignell, U.; Kärkkäinen, P.; Nevalainen, A. Quantitative PCR analysis of fungi and bacteria in building materials and comparison to culture-based analysis. J. Environ. Monit. 2008, 10, 655–663. [Google Scholar] [CrossRef]
- Brandl, H. Bioaerosols in Indoor Environment—A Review with Special Reference to Residential and Occupational Locations. Open Environ. Biol. Monit. J. 2011, 4, 83–96. [Google Scholar] [CrossRef] [Green Version]
- Adams, R.I.; Miletto, M.; Taylor, J.W.; Bruns, T.D. Dispersal in microbes: Fungi in indoor air are dominated by outdoor air and show dispersal limitation at short distances. ISME J. 2013, 7, 1262–1273. [Google Scholar] [CrossRef] [PubMed] [Green Version]
- Garrett, M.H.; Hooper, B.M.; Cole, F.M.; Hooper, M.A. Airborne fungal spores in 80 homes in the Latrobe Valley, Australia: Levels, seasonality and indoor-outdoor relationship. Aerobiologia 1997, 13, 121–126. [Google Scholar] [CrossRef]
- Grinn-Gofroń, A.; Rapiejko, P. Occurrence of Cladosporium spp. and Alternaria spp. spores in Western, Northern and Central-Eastern Poland in 2004–2006 and relation to some meteorological factors. Atmos. Res. 2009, 93, 747–758. [Google Scholar] [CrossRef]
- Kaarakainen, P.; Rintala, H.; Vepsäläinen, A.; Hyvärinen, A.; Nevalainen, A.; Meklin, T. Microbial content of house dust samples determined with qPCR. Sci. Total Environ. 2009, 407, 4673–4680. [Google Scholar] [CrossRef]
- Reboux, G.; Bellanger, A.P.; Roussel, S.; Grenouillet, F.; Sornin, S.; Piarroux, R.; Dalphin, J.C.; Millon, L. Indoor mold concentration in Eastern France. Indoor Air 2009, 19, 446–453. [Google Scholar] [CrossRef] [PubMed]
- Lu, R.; Tendal, K.; Frederiksen, M.W.; Uhrbrand, K.; Li, Y.; Madsen, A.M. Strong variance in the inflammatory and cytotoxic potentials of Penicillium and Aspergillus species from cleaning workers’ exposure in nursing homes. Sci. Total Environ. 2020, 724, 138231. [Google Scholar] [CrossRef]
- Reboux, G.; Rocchi, S.; Vacheyrou, M.; Millon, L. Identifying indoor air Penicillium species: A challenge for allergic Patients. J. Med. Microbiol. 2019, 68, 812–821. [Google Scholar] [CrossRef] [PubMed]
- Lewis, C.W.; Smith, J.E.; Anderson, J.G.; Murad, Y.M. The Presence of Mycotoxin-Associated Fungal Spores Isolated from the Indoor Air of the Damp Domestic Environment and Cytotoxic to Human Cell Lines. Indoor Built Environ. 1994, 3, 323–330. [Google Scholar] [CrossRef]
- D’Amato, G.; Cecchi, L.; Bonini, S.; Nunes, C.; Annesi-Maesano, I.; Behrendt, H.; Liccardi, G.; Popov, T.; Van Cauwenberge, P. Allergenic pollen and pollen allergy in Europe. Allergy Eur. J. Allergy Clin. Immunol. 2007, 62, 976–990. [Google Scholar] [CrossRef] [PubMed]
- Rasmussen, A. The effects of climate change on the birch pollen season in Denmark. Aerobiologia 2002, 18, 253–265. [Google Scholar] [CrossRef]
- Yli-Panula, E.; Fekedulegn, D.B.; Green, B.J.; Ranta, H. Analysis of airborne Betula pollen in Finland; a 31-year perspective. Int. J. Environ. Res. Public Health 2009, 6, 1706–1723. [Google Scholar] [CrossRef] [PubMed] [Green Version]
- Peternel, R.; Srnec, L.; Hrga, I.; Hercog, P.; Čulig, J. Airborne pollen of Betula, Corylus and Alnus in Zagreb, Croatia. A three-year record. Grana 2005, 44, 187–191. [Google Scholar] [CrossRef]
- Stach, A.; García-Mozo, H.; Prieto-Baena, J.C.; Czarnecka-Operacz, M.; Jenerowicz, D.; Silny, W.; Galán, C. Prevalence of Artemisia species pollinosis in western Poland: Impact of climate change on aerobiological trends, 1995-2004. J. Investig. Allergol. Clin. Immunol. 2007, 17, 39–47. [Google Scholar] [PubMed]
- Oteros, J.; Bartusel, E.; Alessandrini, F.; Núñez, A.; Moreno, D.A.; Behrendt, H.; Schmidt-Weber, C.; Traidl-Hoffmann, C.; Buters, J. Artemisia pollen is the main vector for airborne endotoxin. J. Allergy Clin. Immunol. 2019, 143, 369–377. [Google Scholar] [CrossRef] [PubMed] [Green Version]
- Grote, M.; Vrtala, S.; Niederberger, V.; Wiermann, R.; Valenta, R.; Reichelt, R. Release of allergen-bearing cytoplasm from hydrated pollen: A mechanism common to a variety of grass (poaceae) species revealed by electron microscopy. J. Allergy Clin. Immunol. 2001, 108, 109–115. [Google Scholar] [CrossRef] [PubMed]
- Taylor, P.E.; Jacobson, K.W.; House, J.M.; Glovsky, M.M. Links between pollen, atopy and the asthma epidemic. Int. Arch. Allergy Immunol. 2007, 144, 162–170. [Google Scholar] [CrossRef] [PubMed]
- Spieksma, F.T.M.; Nikkels, B.H.; Dijkman, J.H. Seasonal appearance of grass pollen allergen in natural, pauci-micronic aerosol of various size fractions. Relationship with airborne grass pollen concentration. Clin. Exp. Allergy 1995, 25, 234–239. [Google Scholar] [CrossRef] [PubMed]
- Losappio, L.; Heffler, E.; Contento, F.; Cannito, C.; Rolla, G. Thunderstorm-related asthma epidemic owing to Olea Europaea pollen sensitization. Allergy Eur. J. Allergy Clin. Immunol. 2011, 66, 1510–1511. [Google Scholar] [CrossRef]
- Taylor, P.; Goldberg, C.; Buch, H.; Moseholm, L.; Weeke, E.R. Airborne Pollen Records in Denmark, 1977–1986. Grana 1988, 27, 209–217. [Google Scholar] [CrossRef]
- Lumpkins, E.D.; Corbit, S.L.; Tiedeman, G.M. Airborne fungi survey. I. Culture plate survey of the home environment. Ann. Allergy 1973, 31, 361–370. [Google Scholar] [PubMed]
- Grinshpun, S.A.; Reponen, T.; Willeke, K. Aerosol characteristics of airborne actinomycetes and fungi. J. Aerosol Sci. 1997, 28, 667–668. [Google Scholar] [CrossRef]
- Reponen, T.; Grinshpun, S.A.; Conwell, K.L.; Wiest, J.; Anderson, M. Aerodynamic versus physical size of spores: Measurement and implication for respiratory deposition. Grana 2001, 40, 119–125. [Google Scholar] [CrossRef]
Figure 1.
Canonical correspondence analysis (CCA) of the fungal β-diversity of the different fungi in PM1 (a) and GSP (b) samples both constrained by season.
Figure 1.
Canonical correspondence analysis (CCA) of the fungal β-diversity of the different fungi in PM1 (a) and GSP (b) samples both constrained by season.

Table 1.
The number of positive PM1 and Gesamtstaubprobenahme (GSP) samples as measured using qPCR; PM1/GSP (%); and references to other papers where fragments have also been found using other methods.
Table 1.
The number of positive PM1 and Gesamtstaubprobenahme (GSP) samples as measured using qPCR; PM1/GSP (%); and references to other papers where fragments have also been found using other methods.
| This Study | Fragments Found in Previous Studies | |||||||
|---|---|---|---|---|---|---|---|---|
| Number of Positive Samples out of 15 Samples | PM1/GSP (GM, %) | |||||||
| PM1 | GSP | PM1/GSP | Fragment/Spore | Place of Sampling | Method of Quantification | Reference | ||
| Fungal species | ||||||||
| Acremonium strictum | Bd | 8 | Bd | - | - | - | - | |
| Alternaria alternata | Bd | Bd | Bd | NM | Laboratory c | No. by microscopy | [41] | |
| Aspergillus fumigatusb | 1 | 14 | 0.37% | ~1% | Laboratory | No. by microscopy | [7] | |
| Aspergillus niger | Bd | 2 | Bd | 0–19.2% | Laboratory | No. particles | [42] | |
| Aspergillus versicolorb | 6 | 15 | 0.59% | 100% | Laboratory | No. by microscopy | [18] | |
| <30% | Laboratory | No. of particles | [30] | |||||
| ~2% | Laboratory | No. by microscopy | [7] | |||||
| 10% | Laboratory | No. of particles | [28] | |||||
| ~50% | Laboratory | No. of particles | [43] | |||||
| Chaetomium globosum | Bd | 2 | Bd | - | - | - | - | |
| Cladosporium cladosporioidesb | 5 | 13 | 0.71% | 0–22.4% | Laboratory | No. of particles | [42] | |
| 2% | Laboratory | No. of particles | [28] | |||||
| ~50% | Laboratory | No. of particles | [43] | |||||
| Cladosporium herbaruma, b | 9 | 15 | 0.63% | - | - | |||
| Cladosporium sphaerospermuma, b | 2 | 15 | 1.08% | - | - | |||
| Penicillium chrysogenum | Bd | Bd | Bd | ~0.01% | Laboratory | No. of particles | [44] | |
| ~2% | Laboratory | No. by microscopy | [7] | |||||
| ~40% | Laboratory | No. of particles | [43] | |||||
| Penicillium expansumb | 1 | 8 | 16.47% | - | - | - | - | |
| Rhizopus stolonifer | Bd | 1 | Bd | - | - | - | - | |
| Stachybotrys chartarum | Bd | Bd | Bd | 51,400% | Laboratory | No. by microscopy | [18] | |
| Tricoderma viride | Bd | 4 | Bd | - | - | - | ||
| Ulocladium chartarumb | 1 | 2 | 39.64% | ~15% | Laboratory | No. of particles | [30] | |
| Wallemia sebib | 2 | 11 | 1.16% | - | - | - | - | |
| Fungal Groups | ||||||||
| Aspergillus glaucus group | Bd | 6 | Bd | - | - | - | - | |
| Mucor/Rhizopus group | Bd | 14 | Bd | - | - | - | - | |
| Asp/Pen/Pae group a, b | 12 | 15 | 4.68% | - | - | |||
| Universal fungia, b | 15 | 15 | 2.95% | ~35% | Open field | No. by microscopy | [11] | |
| <1% | Laboratory gypsum | No. particles | [19] | |||||
| ~5% | Laboratory gypsum | (1→3)-β-D-glucan | [19] | |||||
| 0.3–1.3% | Laboratory gypsum | No. particles | [6] | |||||
| 170% | Basement | No. by microscopy | [45] | |||||
| 1–216% | Homes | (1→3)-β-D-glucan | [15] | |||||
| 6.3% | Home | No. by microscopy | [46] | |||||
| 0.08–19.5% | Farms | (1→3)-β-D-glucan | [12] | |||||
| Pollen | ||||||||
| Betula | Bd | 4 | Bd | - | - | - | - | |
| Alnus/Corylusa, b | 4 | 10 | 16.70% | - | - | - | - | |
| Grasses/Artemisia | Bd | 6 | Bd | <62% | Outdoor | No. by microscopy | [26] | |
| Bacterial genus | ||||||||
| Streptomyces spp. b | 9 | 15 | 3.66% | - | Field | Cultivable | [47] | |
a Significant correlation between PM1 and GSP concentration. b significant difference between PM1 and GSP concentration. Bd, below detection limit; GM, geometric mean; NM, not mentioned.
Table 2.
Seasonal differences between the concentrations of DNA copies in PM1 samples positive for fragments.
Table 2.
Seasonal differences between the concentrations of DNA copies in PM1 samples positive for fragments.
| PM1 | Season | Spring | Summer | Autumn | Winter | ||||
|---|---|---|---|---|---|---|---|---|---|
| p-Value | β | p-Value | β | p-Value | β | p-Value | β | p-Value | |
| Fungal species | |||||||||
| Aspergillus fumigatus | <0.0001 | 1.94 | <0.0001 | 0.32 | 0.05 | 0.103 | 0.54 | Ref. | - |
| Aspergillus versicolor | 0.0757 | 2.74 | 0.050 | 0.40 | 0.58 | −0.91 | 0.28 | Ref. | - |
| Cladosporiumcladosporioides | 0.25 | 1.44 | 0.11 | 0.51 | 0.30 | −0.088 | 0.87 | Ref. | - |
| Cladosporium herbarum | 0.095 | 2.28 | 0.07 | 1.76 | 0.027 | 0.91 | 0.24 | Ref. | - |
| Cladosporium sphaerospermum | 0.17 | 1.40 | 0.047 | 0.61 | 0.12 | 0.38 | 0.35 | Ref. | - |
| Penicillium expansum | 0.0019 | 2.94 | 0.0002 | 0.26 | 0.43 | 0.32 | 0.39 | Ref. | - |
| Ulocladium chartarum | 0.76 | 0.50 | 0.36 | 0.08 | 0.79 | −0.06 | 0.85 | Ref. | - |
| Wallemia sebi | 0.23 | 0.078 | 0.91 | 0.12 | 0.74 | 0.79 | 0.075 | Ref. | - |
| Fungal Group | |||||||||
| Asp/Pen/Pae group | 0.15 | 1.58 | 0.037 | 0.56 | 0.17 | 0.28 | 0.52 | Ref. | |
| Universal fungi | 0.12 | 0.74 | 0.030 | 0.22 | 0.22 | 0.02 | 0.91 | Ref. | - |
| Pollen | |||||||||
| Alnus/Corylus | 0.26 | 1.33 | 0.058 | 0.255 | 0.49 | 0.36 | 0.39 | Ref. | - |
| Bacterial genus | |||||||||
| Streptomyces spp. | 0.0041 | 2.47 | 0.0035 | −0.21 | 0.52 | 1.10 | 0.015 | Ref. | - |
Statistically significant values are in bold. β (β-coefficient) is the estimate of each season. A positive β-coefficient means there is an elevated concentration in the season. A mixed-effects linear regression model was used with the home as a random effect and season as a fixed factor. Winter was chosen as the reference (Ref.).
Table 3.
Seasonal differences between the concentrations of DNA copies in the GSP samples.
| GSP | Season | Spring | Summer | Autumn | Winter | ||||
|---|---|---|---|---|---|---|---|---|---|
| p-Value | β | p-Value | β | p-Value | β | p-Value | β | p-Value | |
| Fungal species | |||||||||
| Acremonium strictum | 0.13 | 1.74 | 0.065 | 0.98 | 0.071 | 0.24 | 0.66 | Ref. | - |
| Aspergillus fumigatus | 0.057 | 0.62 | 0.22 | 0.64 | 0.037 | −0.11 | 0.69 | Ref. | - |
| Aspergillus niger | 0.0057 | 1.77 | 0.0011 | 0.67 | 0.0087 | 0.47 | 0.05 | Ref. | - |
| Aspergillus versicolor | 0.20 | 0.77 | 0.10 | 0.017 | 0.95 | 0.39 | 0.17 | Ref. | - |
| Chaetomium globosum | 0.56 | −0.18 | 0.78 | −0.05 | 0.90 | −0.51 | 0.22 | Ref. | - |
| Cladosporiumcladosporioides | 0.0002 | 1.44 | 0.016 | 2.12 | <0.0001 | 1.37 | 0.0013 | Ref. | - |
| Cladosporium herbarum | 0.0025 | 1.05 | 0.061 | 1.501 | 0.0003 | 0.66 | 0.06 | Ref. | - |
| Cladosporium sphaerospermum | 0.0085 | 1.28 | 0.042 | 1.36 | 0.0014 | 0.57 | 0.13 | Ref. | - |
| Penicillium expansum | 0.014 | 0.95 | 0.15 | −0.93 | 0.02 | 0.14 | 0.73 | Ref. | - |
| Rhizopus stolonifera | 0.42 | 0.82 | 0.20 | −0.17 | 0.61 | −0.12 | 0.74 | Ref. | - |
| Tricoderma viride | 0.29 | −0.17 | 0.53 | −0.29 | 0.07 | −0.11 | 0.48 | Ref. | - |
| Ulocladium chartarum | 0.0048 | 1.39 | 0.008 | −0.19 | 0.41 | 0.74 | 0.016 | Ref. | - |
| Wallemia sebi | 0.13 | 0.011 | 0.99 | −0.58 | 0.22 | 0.59 | 0.23 | Ref. | - |
| Fungal Groups | |||||||||
| Aspergillus glaucus group | 0.44 | 0.037 | 0.91 | 0.0004 | 0.99 | 0.27 | 0.18 | Ref. | - |
| Mucor/Rhizopus group | 0.0003 | 1.78 | 0.0005 | 1.29 | <0.0001 | 0.64 | 0.018 | Ref. | - |
| Asp/Pen/Pae group | 0.062 | 1.27 | 0.01 | 0.34 | 0.17 | 0.44 | 0.11 | Ref. | - |
| Universal fungi | 0.018 | 0.86 | 0.029 | 0.77 | 0.004 | 0.55 | 0.03 | Ref. | - |
| Pollen | |||||||||
| Betula | 0.056 | 1.05 | 0.059 | 0.48 | 0.11 | 0.87 | 0.015 | Ref. | - |
| Alnus/Corylus | 0.23 | 1.58 | 0.15 | −0.061 | 0.92 | 0.89 | 0.18 | Ref. | - |
| Grasses/Artemisia | 0.13 | 2.91 | 0.02 | 0.72 | 0.29 | 0.59 | 0.41 | Ref. | - |
| Bacterial genus | |||||||||
| Streptomyces spp. | 0.27 | 1.05 | 0.096 | 0.55 | 0.13 | 0.31 | 0.42 | Ref. | - |
Statistically significant values are in bold. β (β-coefficient) is the estimate of the season. A positive β-coefficient means there is an elevated concentration in the season. A mixed-effects linear regression model was used with the home as a random effect and season as a fixed factor. Winter was chosen as the reference (Ref.).
Publisher’s Note: MDPI stays neutral with regard to jurisdictional claims in published maps and institutional affiliations. |
© 2021 by the authors. Licensee MDPI, Basel, Switzerland. This article is an open access article distributed under the terms and conditions of the Creative Commons Attribution (CC BY) license (http://creativecommons.org/licenses/by/4.0/).
Share and Cite
MDPI and ACS Style
Lu, R.; Pørneki, A.D.; Lindgreen, J.N.; Li, Y.; Madsen, A.M. Species of Fungi and Pollen in the PM1 and the Inhalable Fraction of Indoor Air in Homes. Atmosphere 2021, 12, 404. https://0-doi-org.brum.beds.ac.uk/10.3390/atmos12030404
AMA Style
Lu R, Pørneki AD, Lindgreen JN, Li Y, Madsen AM. Species of Fungi and Pollen in the PM1 and the Inhalable Fraction of Indoor Air in Homes. Atmosphere. 2021; 12(3):404. https://0-doi-org.brum.beds.ac.uk/10.3390/atmos12030404
Chicago/Turabian StyleLu, Rui, Ann Dorte Pørneki, Jonas N. Lindgreen, Yanpeng Li, and Anne Mette Madsen. 2021. "Species of Fungi and Pollen in the PM1 and the Inhalable Fraction of Indoor Air in Homes" Atmosphere 12, no. 3: 404. https://0-doi-org.brum.beds.ac.uk/10.3390/atmos12030404
Note that from the first issue of 2016, this journal uses article numbers instead of page numbers. See further details here.