
Current State of Indoor Air Phytoremediation Using Potted Plants and Green Walls


1
Department of Chemical Engineering, Arak University, Arak 38156-8-8349, Iran
2
School of Chemical Engineering, University of Birmingham, Birmingham B15 2TT, UK
3
Global Centre for Clean Air Research (GCARE), Department of Civil and Environmental Engineering, Faculty of Engineering and Physical Sciences, University of Surrey, Guildford GU2 7XH, UK
*
Author to whom correspondence should be addressed.
Atmosphere 2021, 12(4), 473; https://0-doi-org.brum.beds.ac.uk/10.3390/atmos12040473
Submission received: 11 February 2021
/
Revised: 23 March 2021
/
Accepted: 5 April 2021
/
Published: 9 April 2021
(This article belongs to the Special Issue Air Quality in the UK)
Abstract
:Urban civilization has a high impact on the environment and human health. The pollution level of indoor air can be 2–5 times higher than the outdoor air pollution, and sometimes it reaches up to 100 times or more in natural/mechanical ventilated buildings. Even though people spend about 90% of their time indoors, the importance of indoor air quality is less noticed. Indoor air pollution can be treated with techniques such as chemical purification, ventilation, isolation, and removing pollutions by plants (phytoremediation). Among these techniques, phytoremediation is not given proper attention and, therefore, is the focus of our review paper. Phytoremediation is an affordable and more environmentally friendly means to purify polluted indoor air. Furthermore, studies show that indoor plants can be used to regulate building temperature, decrease noise levels, and alleviate social stress. Sources of indoor air pollutants and their impact on human health are briefly discussed in this paper. The available literature on phytoremediation, including experimental works for removing volatile organic compound (VOC) and particulate matter from the indoor air and associated challenges and opportunities, are reviewed. Phytoremediation of indoor air depends on the physical properties of plants such as interfacial areas, the moisture content, and the type (hydrophobicity) as well as pollutant characteristics such as the size of particulate matter (PM). A comprehensive summary of plant species that can remove pollutants such as VOCs and PM is provided. Sources of indoor air pollutants, as well as their impact on human health, are described. Phytoremediation and its mechanism of cleaning indoor air are discussed. The potential role of green walls and potted-plants for improving indoor air quality is examined. A list of plant species suitable for indoor air phytoremediation is proposed. This review will help in making informed decisions about integrating plants into the interior building design.
1. Introduction
Air pollution is one of the major issues in urban areas, especially in developing countries [1]. The human population in urban areas is expected to reach 8.5 billion by 2030 and 9.7 billion by 2050 [2]. The critical factors in increasing the air pollution level include heavy traffic, industrialization, and combustion of fossil fuels for heating [3,4]. Another source of air pollution is chemical complexes used in pesticides such as insecticides, fungicides, household cleaning materials, fabrics, paints, sofa and etc., which are common all over the world [5]. Waste treatment plants (WTP) can be a cause of pollution in the atmosphere and are insalubrious and reduce personal well-being. Formaldehyde and volatile organic compounds (VOC) are among the pollutants from WTP [6,7]. These pollutants could be either in water, soil, or in the air, but they should be considered as important atmospheric pollutant sources as eventually they partially evaporate into the air [5]. Global Health Observatory (GHO) data suggest that more than 50% of the people in 2014 lived in cities, and this percentage will increase in the future. In Europe, urban areas continue to grow fast and broaden into the surrounding regions [8,9].
Usually, indoor air pollution is worse than outdoor air pollution, especially in industrialized areas, both in terms of concentration of pollutants as well as their effects on health [3,10,11].
CO, NO2, SO2, PM2.5, ozone as well other VOC such as BTEX (benzene, toluene, ethylbenzene and xylene) are in the scope of indoor air pollutants. These pollutants can be in much higher concentrations indoors, especially when there is no air conditioning in a building. The studies reviewed are from different part of the world, including low-income households in Europe [11] and recent United States Environmental Protection Agency (EPA) studies on USA schools [12].
One might ask why CO2 is considered and studied as indoor air pollution while it is hardly concerned as a health problem in itself. Although an indoor CO2 level of 600 ppm provides adequate air quality, a 1000 ppm indicates poor air quality [13]. A study by [13] shows that even at low and moderate CO2 levels (1000 and 2500 ppm), significant decrements occur in decision-making performance. Furthermore, the level of indoor CO2 can be considered as a reasonable indicator of the effectiveness of the air conditioning system. In other words, high CO2 concentrations can be linked to higher concentrations of other indoor contaminants, which result from poor ventilation [14].
Generally, the concentration of indoor pollution is up to 5 times more than outdoor and in some cases reaches up to 100 times [15,16]. For example, Vasile et al. [17] showed that the concentration of CO2 in the kitchen and bedrooms of the housing sector in Central and Eastern Europe could be three times higher indoors than those outdoors. Another example is the work of Cheng et al. [18], showing that the indoor CO2, formaldehyde and Total volatile organic compounds (TVOCs) concentration is higher than the outdoor concentration in multi-story department store buildings in seven cities of China.
In 2012, the World Health Organization (WHO) reported 4.3 million premature deaths due to indoor air pollution [19,20,21]. Nowadays, people spend most of their times indoors, such as in the home, office, and laboratory. In the case of elders, this is very significant [19,21]. For example, in North America, elders spend approximately 90% of their living in the indoors area [22,23,24]. Segalin et al. [25] investigated the life of older adults who spend most of their time in the indoor environment and showed that there is a high exposure to particulate matter [26], especially fine particles.
As the price of cooling and heating is increasing due to increasing prices of energy in many countries [4,23,27] most people attempt to build their houses and offices more airtight to make a saving in the energy bills [22,27], which could result in accumulation of indoor air pollutants. The air that circulates in our homes, schools, and offices, which have low ventilation rate can be more polluted than the outdoor air and is becoming a principal health threat [3,22,28]. The associated time spent indoors against outdoors will influence the intake of indoor pollutants [29,30,31].
The concentrations of indoor air pollutants depend on both indoor and outdoor discharge rate of pollutant sources (Figure 1). To be more specific, the following parameters affect the indoor air quality: rate of air infiltration, ventilation type (mechanical vs. natural), building position and direction, number of covering walls and windows, surrounding space and boundary, the speed and direction of wind, indoor-outdoor temperature gradient, and air-conditioning system type (e.g., heating, ventilation, air-conditioning system) [32,33,34].
This literature review covers publications on the removal of indoor air pollutants using plants and is based on the databases of ScienceDirect, Scopus, and Web of Science as well as related books. The main criteria for the selection of the publications were the topic of indoor air pollution removal with the plant, and the keywords used were phytoremediation, removal of indoor air pollution with a potted plant and green wall. Some of the publications are about indoor air pollutants and their relationship with human health. The majority of the air pollution-related publications are explaining different technologies for indoor air pollutants removal. Among these techniques, nearly half of the articles discussed indoor air pollutants removal, especially VOCs by plants and green systems. Also, 47% of articles are about the relationship between indoor and outdoor pollutants and their effect on public health and some of the articles investigate the removal of particulate materials using plants.
In this review, indoor air pollutants were classified, and then different technologies were presented for removal of each class of indoor air pollutants. Furthermore, the adverse effect of each class of indoor air pollutants on human health was discussed. Lastly, the phytoremediation technique and its major parameters for indoor air pollutant removal were highlighted, and its advantages were discussed.
2. Indoor Air Pollution: Sources and Their Health Effects
Indoor air pollutants include a wide variety of materials, including organic and inorganic pollutants [3], and particulate matter (PM) [28,35,36]. Some of the more important pollutants are briefly discussed below.
2.1. Inorganic Pollutants
Nitrogen oxides are combustion by-products, produced by the burning of natural gas or oil in oxygen-rich environments such as kitchen stoves and ovens, furnaces, and unventilated gas and kerosene heaters. When a fireplace or wood stove is used, some of these pollutants will enter the room. Cracks in the stovepipe, downdrafts, or wood spillage from a fireplace can worsen the condition [3,37]. A recent study shows that nitrogen dioxide (NO2) in kitchens with a gas cooker were three times higher than outdoors [22]. Adverse effects of NO2 exposure are breathing symptoms, bronchoconstriction, growing of bronchial reactivity, airway painfulness, and reduced immune protection leading to increased susceptibility to respiratory infection [9]. High levels of NO2 are linked to an increased sequence of respiratory symptoms and poorer respiratory action in asthmatic children [38].
Trace elements: generally, toxic trace elements are related to PM and are Fe, Al, Mg, Zn, Co, As, Cr, Cd, Mn, Cu, Ni, and Pb. Trace elements such as Mg, Fe, and Al are greatly released from crustal sources such as parent rocks, metallic minerals, seas, and oceans. Fossil fuel combustion, forest and biomass burning and metal processing are also sources releasing many trace elements [28]. These toxic pollutants either are ingressed from outside of the buildings or generated inside because of fossil fuel combustion.
Mercury (Hg) is a persistent, poisonous, and bio-accumulative heavy metal. It can discharge into the atmosphere from a diversity of anthropogenic and natural sources. A substantial amount of observed mercury is transmitted from the burning process of fuels (36%) and biomass (33%) [39,40].
Ozone can cause the muscles in the airways to constrict, trapping air in the alveoli. This leads to wheezing and shortness of breath. Ozone has a strong, pungent odor. The source of ozone in a building is electrostatic copying devices, mercury-raised light bulbs, and electrostatic air cleaners [3,41,42].
Inhalable particulate matter is classified into three groups according to their sizes: coarse particles (2.5 < dp < 10 μm), fine particles (≤2.5 μm) and ultrafine particles (UFP, <0.1 μm) [43,44]. Fine particles are more potent when inhaled in comparison to the coarse fraction since they can penetrate more into the lungs. UFP can penetrate alveoli and enter the blood, which can be very harmful. Numerous epidemiological and clinical research works exist that establish the relationship between particulate matter [26] exposure and different health effects and references therein [45]. The Department for Environment, Food and Rural Affairs (Defra, UK) estimated that the health costs incurred by particulate matter (PM10) pollution in the UK is in the range of £9.1 and £21.4 billion per year [45,46,47]. Sources that can increase the PM10 concentration are Earth’s crust elements that are the result of oil burning and human activities, and motor vehicles [48]. An increase in the exposure to PM leads to increased hospital admissions, certainly in the sensitive group cohorts such as the old and individual with cardiopulmonary and respiratory illness. PM concentration inside a building is basically governed by indoor sources of fine particles, outside PM concentration, the rate of air circulation, and the particles’ depositional speed [45]. Bozlaker et al. [49] and Mohammadyan et al. [50] studied the relation between indoor and outdoor particulate materials. The result shows the indoor concentration PM2.5 is usually higher than outdoor [45].
Asbestos exposure for an extended period of time could lead to lung cancer known as mesothelioma and asbestosis. Insulation and other building materials such as floor tiles, drywall compounds, and reinforced plasters are sources of asbestos [51].
2.2. Organic Pollutants
VOCs
VOCs are chemicals that mostly vaporized easily at room temperature, and their concentration is higher than other pollutants in the indoor air. Aerosols, cleaning agents, polishes, varnishes, paints, pressed-wood products, and pesticides are some of the VOC sources at homes and offices [3,52,53].
Toluene and ethylbenzene: toluene exists in many materials such as gasoline, paints, and fingernail polish. Ethylbenzene is also present in paints, lacquers, and insecticides. These compounds are a hazard for human health and can have adverse effects on the nerve, liver, kidneys, and respiratory system [9,54].
Formaldehyde is a class of aldehydes that is a colorless gas. The source of formaldehyde is different building materials, household products, or combustion processes. Indoor sources include pressed-wood products, including particleboard, paneling, fiberboard, resins, and wallboard as well as textiles, such as carpet backings, drapes, and upholstery fabrics, linens, and clothing; urea–formaldehyde foam insulation; adhesives; paints; coatings; and carpet shampoos plus tobacco smoke. Decreasing ventilation rate will increase the level of formaldehyde [53,55,56]. Formaldehyde enters the body via the respiratory system, skin, or gastrointestinal tract. Formaldehyde absorbed in the respiratory tract is rapidly metabolized. Formaldehyde exposure could cause respiratory symptoms, reductions in lung function, headaches, and asthma, and it can affect the nervous system [53].
Carbon dioxide and carbon monoxide result from poorly ventilated kitchens, rooms over garages, and unvented combustion appliances (stoves, ovens, heaters, and the presence of tobacco smoke) [10]. Sneezing, coughing, and minor eye irritation are symptoms of exposure [51].
Acetaldehyde is toxic to the cilia of respiratory epithelia and may interfere with respiratory clearance mechanisms. Acetaldehyde is also a central nervous system depressant and a proven carcinogen in animals, and a potential carcinogen in humans. The acetaldehyde source of indoor is construction materials, furnishing materials such as vinyl, polyvinyl chloride (PVC) and rubber floorings, nylon carpets, particleboard furniture, plywood, fiberboard, flooring adhesives, wood paneling, caulking, paint removers, and other consumer products. Also, it emitted by printers and photocopiers [9,57].
Acrolein is a very potent eye irritant, causing lacrimation at concentrations of approximately 2 mg/m3. At high concentrations, acrolein can cause significant lung injury, including dyspnea, asthma, congestion, edema, and persistent respiratory insufficiency with decreased lung function [9].
Naphthalene is a volatile white solid. It is an aromatic hydrocarbon, including a fused pair of benzene rings [9]. Naphthalene is mostly used in toilet deodorant and also as moth repellents. Extended exposure to a large amount of naphthalene may damage or destroy some of the red blood cells; 10 parts per million (ppm) for the level of naphthalene in workplace air over an 8 h workday is the limit set by the Occupational Safety and Health Administration (OSHA) [58].
Trichloroethylene (TCE) is a clear, non-flammable liquid used mainly for vapor degreasing and cold cleaning of manufactured metal parts and to a less degree as a solvent for a variety of organic materials. The primary sources of TCE in the indoor air include varnishes, finishes, lubricants, adhesives, wood stains, paint removers, cleaning liquids containing TCE, and contaminated food and water [9]. The EPA classified the TCE as carcinogenic to humans [59]. TCE can affect the central nervous system (CNS), eyes, kidney, liver, lungs, mucous membranes, and skin [60].
Tetrachloroethylene (PCE) is a colorless liquid mostly used for dry cleaning fabrics, as a solvent for organic materials, and to degrease metal parts in the automotive and other metalworking industries. Another source of PCE is dry cleaned clothes. Exposure to PCE vapor could cause damage to the following organs: kidneys, liver, the peripheral nervous system [9], upper respiratory tract, skin, the central nervous system (CNS) [61].
The WHO has categorized indoor VOCs into various classes, as seen in Table 1. Based on the available literature, some of the major sources of VOCs are listed in Table 2 in which a guideline for the maximum exposure is provided. It should be noted that the concentration of TVOC should not exceed 300 μg/m3 [9,62]. Furthermore, there is no safe level of exposure for some of these pollutants (asbestos and radon).
Polybrominated diphenyl ethers (PBDEs) include materials such as plastics, television sets, textiles, synthetic building materials, computers, and cars. Human exposure to PBDEs includes food consumption and ingestion of polluted air and house dust. Studies show that computer clerks have higher PBDE levels in their blood than others. It should be noted that exposure to PBDEs via inhalation is of minor importance [66]. PBDEs are toxins that disrupt developing fetuses and infants. PBDEs can act as endocrine disruptors by the change of thyroid hormones homeostasis [67,68].
Insecticide affects the environment, depending on their physical and chemical properties [5]. For example, each year, malaria is responsible for 584,000 deaths worldwide. Hence, indoor residual spraying (IRS) is an important source of Insecticide indoor pollution [69].
Radon (222Rn) is a radioactive gas that is odorless and colorless. It is the result of the radioactive decay of radium-226. The soil and rock in the building can be the primary source of radon in indoor air. Another source of indoor radon is groundwater—Rn concentration changes with seasonal and daily variation [70]. A high concentration of radon leads to lung cancer [71].
Tobacco smoke is the largest source of air pollutant in indoor environments. It has more than 4000 chemical compositions, which could lead to pneumonia and bronchitis in childhood [9,72,73].
Biomass fuels and coal are a source of energy for cooking and heating. Almost 3 billion people use biomass (wood, charcoal, crop residues, and animal dung) and coal worldwide as their primary and other household needs [74]. The CO2 and NO2, arsenic, fluorine and organic matter such as polycyclic aromatic hydrocarbons emit from biomass and coal combustion. Chronic obstructive pulmonary disease, asthma, respiratory infections, lung cancer and eye diseases are the exposure effects of biomass and coal [75,76].
3. Indoor Air Pollution Control Techniques
There are different methods to control indoor air pollution. These methods include (i) eliminating the pollution at source [9,77,78], for example, through altering the building structure such as insulation of external walls [79], (ii) improving the living environment by optimizing ventilation and kitchen design, (iii) modifying individual’s behavior by alteration of cooking methods and decreasing exposure via avoiding smoke [80], and (iv) utilizing heating, ventilation and air conditioning (HVAC) systems [79,81].
The following systems or a combination of them can be used to remove organic pollutants from contaminated air: filtration, ventilation, isolation, air cleaners, adsorption, and air stripping [3,82], ozonation, ultraviolet (UV) photolysis, photocatalytic oxidation, cold plasma or non-thermal plasma (NTP), membrane separation [81,83,84].
Ventilation, isolation, air cleaning, and other techniques include removing or modifying the source of pollution and replacing it with a low-pollution source. These methods need high energy and substantial capital investment [54,83]. However, the biofiltration and botanical system are alternative methods to treat indoor air pollution by the plants that need lower energy and much lower capital investments and are much more natural and environmentally friendly processes [83,85,86,87,88].
4. The Role of Plants for Indoor Pollutant Removal
Green plants’ role is improving the air quality by removing air pollutants [88,89,90,91], but green areas are reducing due to the number of buildings and the decrease of the accessible area to light. The urban heat island (UHI) is resulting in changes in the surface of ground and temperature increases, and the lack of proper evapotranspiration in urban areas [92]. Greenery should be emphasized in urban areas in order to bring fresh air and nature back into them [4,93,94]. Fortunately, the use of plants in city architecture has increased over the past decade [95].
According to recent research, there are challenges in green building, such as creating an effective green environment and providing a relaxing surrounding [96,97]. Nevertheless, people are doubtful about additional capital cost of green buildings, and so this should be justified [97]. Fewer researchers have investigated the effect of plants to remove indoor air pollution and thermal regulation [23,98]. Published research indicates that green buildings in urban areas give many benefits, such as productivity enhancements that can be explained by financial achievement. Many of the studies have examined office buildings in industrialized countries placed usually in temperate climate zones. It is necessary to research different climate areas of industrialized countries [97].
4.1. Green Walls
Green walls are a new development. Many of them are using continuous or modular, planted sections. These are made of pre-vegetated frame upright modules or planted covers (vegetated flat wall) which are fixed to a wall or other structures [34,77,95,98,99]. Green walls include two types of green facade and can be used indoors or outdoors [100,101]. Also, green walls can be classified as passive and active green walls [101,102]. Passive green wall or inactive living wall systems are manufactured in square or rectangular modular panels. These panels have directly growing media in the form of plants and are connected to a building facade or structure and usually of a lightweight construction system (Figure 2a) [101]. Active living walls are a newer version that incorporates the ventilation, heating, and cooling of the building (Figure 2b). A green wall system that purifies inside air also acts as a thermal regulator. The plants remove CO and CO2 and assist in removing particulate material of air, and normal processes of plants create fresh air which is drawn into the system by an outlet and then let into the house [101,103]. The application of an active and passive living wall is linked to various parameters such as cost, location, and infrastructure limits. Active living walls with hydroponic plants (botanical system) show a high rate of pollutant removal, especially VOCs, in a high airflow rate [103]. Passive living walls have a lower rate of pollutant removal than active living walls. However, passive living walls are simpler with a lower capital cost [104,105,106,107].
A green wall system (GWS) is a wall partly or entirely covered with plants that involve a growing medium, such as soil. Many of the green walls also have an integrated water delivery system. Other names for green walls are vertical gardens or living walls. The idea of green walls have been referred to for 11 centuries and the first green wall was used by the Vikings. The Vikings used stones, timber and peat bricks to make their habitations [98,108]. The green wall system is a way of growing plants directly on it or some structures installed on the building facade. These can be vegetated in several ways, such as directly into the ground, in pots, planter boxes or other constructions to fasten the plants. Green walls are gradually being more utilized, and self-reliant assessment devices have expanded in order to evaluate them [97].
A green wall system can also be used for reducing pollution, controlling temperature and increasing biodiversity [4,98,109]. Green walls have a different classification that is based on the type of plants, the structure of the green wall system, and the growing media [98,110]. Mechanisms of air pollutant removals by plants are discussed in detail in Section 4.2.
Botanical and Biofiltration System
A biofiltration system is an ‘active’ living wall and can be incorporated into the design of all kinds of building. A biofiltration system can provide fresh air and temperature regulation in buildings. The active living wall could include a hydroponic system, nutrient-rich water that is circulated in the system. The dense root mass and microbes are supported by putting roots among synthetic fabric layers [100,111,112,113]. This system removes pollutants by microorganisms or plants and their rhizosphere microorganisms [34]. Microbes in the root would remove volatile organic compounds (VOCs) in the air, and carbon monoxide and dioxide would be absorbed by the foliage. Cold fresh air is drawn into the home by a fan (Figure 2b). Therefore, one can use green facade systems for cooling and improving air quality. Also, these systems potentially can be used as a hybrid system in the building [100]. Compared with a ventilation air system, greenery systems are noticeably better at removing air pollution [114,115,116].
There are two major types of biological air pollution control methods in active living wall systems: biofiltration and phytoremediation. The combination of these two techniques results in the bio-wall technique. The bio-wall is a simplified form of a combination of these two methods [95,117].
Phytoremediation means using plants (trees, shrubs, grasses and aquatic plants [118,119] and their associated microorganisms to delete, degrade or isolate toxic substances from the environment [120,121,122]. The phytoremediation method contains different modalities, the chemical matter and nature of the contaminant (such as an inactive substance or volatile or degradation matter in the plant or the soil) and the properties of the plant affect it. Phytoremediation utilizes six different strategies [123,124,125] to remove pollutants. Simultaneously, the plant can apply several strategies [123]. The phytoremediation method is cheaper than other techniques and is an environmentally friendly process. However, the time of removal of pollutants can be lengthy [126].
4.2. Mechanisms of Air Pollutant Removal by Plants
Plant microorganisms have an essential role in pollutant removal, especially VOCs removal. These pollutants are used as nutrients and energy source or to degrade them co-metabolically using unspecific enzymes. The intrinsic biodegradability of VOCs related to many parameters, such as hydrophobicity, solubility, and toxicity [84]. Studies are limited in the investigation of factors affecting phytoremediation and their process in pollutant removal. These factors are microorganism types, pollutant composition, and light source. The studies showed that the effectiveness of phytoremediation decreased due to the competition between rhizosphere microorganisms and plants under limited nutrient resources circumstance [81,127]. Competition between the root zone and the aerial plant was shown in the adsorption of formaldehyde by Aydogan et al. [128]. Their study showed that rhizosphere degradation has an essential role in VOC removal of botanical systems [127].
There are different forms of pollution removal by plants. One of the pathways is the uptake of pollutants by the root from soil and water. The root uptake is linked to pollutant concentration and properties, plant species/composition, exposure time, and other system variables. When organic pollutants (such as trichloroethylene) are in shoots, they may be moved toward roots by the phloem. The transformation or degradation of the contaminant by plant tissues is another major issue in phytoremediation [129].
Other pathways are: (i) gaseous pollution and particulates such as dust and bioaerosols adsorb onto leaf surfaces, (ii) gaseous pollution absorbs by stomata, and they accumulate in various internal structures, (iii) photosynthesis can remove CO2 and produce O2, (iv) enhancing humidity levels by leaf transpiration and evaporation from rooting media (soil, sediments, sludge, wastewater) [130,131,132].
Phytoremediation is the collection of the above mechanisms in which green plants capture and degrade indoor air pollutants [133]. Phytoremediation of contaminated soils accumulates or degrades pollutants by plants. However, in botanical air filters, applying microbial activity has an important role in removing indoor pollutants. Also, VOC biodegradation can occur by the growth of bacteria on the level of plants. Generally, plants and bacteria have the complexity and importance of interactions. However, the time of interaction between plant and bacteria is limited; thus, it is necessary to find the critical mechanisms of VOC uptake or release by plants and their microbial hosts [134].
4.3. Volatile Organic Compounds (VOCs) Removal from Indoor Air by Plants
The idea of removing VOCs from indoor air by plants was introduced by Wolverton and his colleagues in 1989; this field of study led to the National Aeronautics and Space Administration’s (NASA) research on biological life support systems for space travel [117]. These research studies have positively shown that potted plants could delete significant or large amounts of gaseous VOCs in sealed chambers, reducing VOCs from 10% to 90% in 24 h [135]. Wolverton et al. investigated 12 plants to remove VOCs and proved the possibility of enhancing indoor air quality by abolishing trace organic pollutants from the air in energy-efficient houses. They showed that the contact of the root-soil area with air has a higher efficiency in removing organic pollutants [136]. The researchers of NASA illustrated the role of household plants to remove and manage pollutants [3]. Kvesitadze et al. [131] analyzed plants’ ability for organic contaminants uptake and cleansing, identifying their roles in environmental remediation and protection.
4.3.1. Formaldehyde
Wolverton et al. [136] used fixed pull-down experiments, utilizing small, sealed chambers holding plants that were spiked with the type of contaminants (formaldehyde, benzene, trichloroethylene (TCE)) and the headspace concentration was detected over time. For example, the level of formaldehyde decreased from 19,000–46,000 μg m−3 to lower than 2500 μg m−3, and the microorganisms of the rhizosphere zone were most effective in removal benzene and formaldehyde. Following this work, they applied nine species of potted plant in the test chamber to remove VOCs at home. Household plants could remove high values of VOCs (0.2, 1, 10, 100 ppm) during the 24 h [133].
Bondarevs et al. [137] applied two types of pollutant (universal glue and formaldehyde 4% solution) in a greenhouse with the size of 406 × 203 × 223 cm, and green wall with the size of 200 × 200 × 18 cm insert into the greenhouse. Acetone and methyl acetate are the substances that produce universal glue. Commonly, formaldehyde and acetone are VOC pollutants in indoor air. They were applied a green wall to remove air pollutants. The VOC substances were put into the greenhouse. As shown in Figure 3, formaldehyde concentration decreases at 0.033 ppm·h−1 without a fan, 0.076 ppm·h−1 with a fan (airflow of 28.8 m3/h) and 0.09 ppm·h−1 with a fan (airflow of 82.8 m3/h). These values were measured when the light was on. Adsorption of formaldehyde is 5 times faster than the dark condition. However, formaldehyde adsorption did not change with the intensifying of light.
The dynamic botanical air filtration system (DBAF) is suggested to be an effective technique for VOC removal, especially toluene and formaldehyde [81,138]. Wang et al. [133] applied the dynamic botanical air filtration system (DBAF) for removing VOCs (Figure 4). Two Golden Photos (E. aureum) were used in this system. Figure 5 shows formaldehyde removal by the static potted plant in which A1 is removed by soil only; A2 is removed by leaf only (with sealing the surface of the soil),; A3 is removed by the leaf and soil. They utilized A. aurescens TC1 bacteria due to their high potential of formaldehyde adsorption. According to Figure 4, the airflow was applied to increase the availability of formaldehyde to microorganisms.
Formaldehyde removal depends on the size of the plants. Wang et al. (2014) showed that the speed of formaldehyde removal is not only linked to the size of potted plants but also is strongly linked to the dynamics of air. They used the equivalent clean air delivery rates (CADR) parameter, which is usually used to quantify the air cleaning ability and showed that CADR is only 5.1 m3/h per m2 bed for static air while CADR was sharply raised to the value of 233 m3/h per m2 bed when the air was conveyed through the potted plants [133].
Also, studies showed that using microbes has a considerable effect on pollutant removal. As microorganisms did not present downstream of the botanical filtration system, i.e., microorganisms stay in the system, they can be used in the indoor environment [139]
The type of plant and growing media in hydroponic systems are other factors affecting formaldehyde removal. Aydogan et al. [128] reported the application of three growing media grow stones (a commercially available hydroponic growing medium made of recycled glass), expanded clay and activated carbon in a potted plant. They used four plant spices Hedera helix, Chrysanthemum, morifolium, Dieffenbachia. Activated carbon used in pots showed lower adsorption of formaldehyde than activated carbon that is alone. It can be due to lower surface area exposure of activated carbon to formaldehyde. Grow stone as a growing media showed high formaldehyde adsorption. Among four plant spices considering the aerial plant, C. morifolium had the fastest formaldehyde adsorption while H. helix showed the slowest adsorption of formaldehyde. Also, the aerial part of the plant in the D. compacta and E. aurenum, exhibited faster adsorption under dark condition. Su et al. [129] showed the concentration of formaldehyde decrease in plant rhizosphere solution during the passing time. Leaves showed formaldehyde adsorption, possibly due to the potential of leaf oxidation as well as formaldehyde accumulation. Furthermore, they showed that the oldest leaves had a higher decomposition of formaldehyde than the big mature leaves.
The studies so far show that the botanical systems have a high potential for formaldehyde removal of up to 20% removal per pass of air over the plant [84]. Among those plants, spider plant and philodendron have a higher potential to remove formaldehyde and carbon dioxide from indoor air [3,140]. Moisture has an essential role in the adsorption of water-soluble pollutant such as formaldehyde [84]. Formaldehyde is less absorbed by the root compared to the leaves [141]. However, botanical systems can be used to remove many VOCs, especially soluble contaminants. However, one problem about botanical systems is that they are slow, and air treatment would take a while [84].
An exact safe level of benzene exposure is unknown. As reported in 2000 by the European Union, the concentration of benzene in ambient air should be lower than 5 µg m−3 [142,143]. By considering the potential of plants to remove VOCs, there are some studies on benzene removal. Studies showed that plants have high resistance against toxic pollutants [144,145,146]. Recently, Sriprapat et al. [8] exhibited the experimental data for eight species of plant, including Sansevieria trifasciata, Euphorbia milii, Epipremnum aureum, Syngonium podophyllum, Hedera helix, Chlorophytum comosum, Dracaena sanderiana, and Clitoria ternatea, for removing benzene in air and water pollutants. These household plants are well known for high tolerance to toxic contaminants. During 96 h, it appeared that C. Comosum had the most potential among other plants for removing benzene from air and water pollutants (Figure 6). When the bacteria were used, C. Comosum showed a lower benzene removal rate than without bacteria.
4.3.2. Benzene, Toluene and TVOC Compounds
In another work, Sriprapat et al. [54] showed that C. Comosum has a high potential for ethylbenzene removal (11.11 ± 0.07 µmol at 72 h), while S. trifasciata has high efficiency to toluene removal (10.17 ± 0.38 µmol at 72 h). The chemical and physical properties of the plant are a critical factor in pollutant removal. Toluene and benzene removal depends on the quantity of cuticle. However, this relation is not clear. The plant that includes higher hexadecanoic acid and alpha-linolenic acid has higher adsorption of toluene and ethylbenzene.
Furthermore, the physicochemical properties of pollutants should be considered in pollution removal. The toxic pollutants such as toluene and ethylbenzene change the removal efficiency of plant, i.e., high toxicity pollutant can decrease the removal efficiency because of the role of chloroplasts in the adsorption of organic pollution [131]. The size of a molecule of pollutants is another factor in removal efficiency. In other words, the pollutant with a small size shows higher uptake according to Fick’s law [147]. For example, Z. zamiifolia, et al. showed that benzene, toluene, ethylbenzene, and xylene had higher uptake by plants, especially benzene with due to its small size, and xylene while the lowest removal rate. Also, benzene removal had a higher uptake rate in dark conditions [147,148].
Liu et al. [142] investigated ornamental houseplants’ ability to remove benzene from indoor air in the laboratory. Twenty-three plant species among 73 species did not change the concentration of benzene in the air; the value of removing benzene was between 0.1–9.99% for 13 species while 17 species removed 10–20%, another 17 species removed 20–40%, and three species removed 60–80%. They showed that a Crassula portulacea with a leaf area of 1 m2 could remove all the 150 ppb benzene in a 25 m3 room in less than one hour. Orwell et al. [149] applied seven potted-plants for removing benzene in different condition. The rate of removing benzene was for each pot about 12–27 ppm d−1. The main agents for removal were known microorganisms of the potting mix rhizosphere. Also, the microorganisms of the plant rhizosphere had the highest role in benzene removal, and the rate of benzene removal increased linearly with benzene concentration.
Tarran et al. [150] investigated nine household plants in 60 offices. It was shown that potted plants could be removed VOCs 75% in indoor air, to below 100 ppm. This experiment was done with or without air-conditioning and in light or dark. Also, the experimental data showed that CO, CO2 can be removed. Orwell et al. [149] and Wood et al. [151] investigated the effects of two potted plants on total VOCs (TVOCs) levels in 60 offices during two 5–9 week periods. It was observed that the value of VOCs decreased to below 100 ppm. Thus, it is possible to decrease VOCs at typical indoor concentrations. Another work on removing indoor air pollution was carried out by the botanical indoor air biofilter (BIAB) system. The use of this system reduce the concentration of VOCs (VOCs: ketones, acetone, methyl ethyl ketone, and methyl isobutyl ketone), alcohols (ethanol, butanol), BTEX (benzene, toluene, ethylbenzene, o-xylene and p-xylene), halogens (trichloroethylene, dichloromethane, and tetrachloroethylene), limonene and pinene). Depending on the experimental condition, the concentration of VOCs controlled between 20 and 300 ppb [135]. Caron studied the types of indoor air VOC pollutants by a green wall. The result showed that the concentration of formaldehyde, toluene, and acetaldehyde decreased by 47%, 94%, 96%, respectively. This novel technology has been applied in several universities in Eastern Canada, and it is attractive to companies that improve indoor air quality in buildings [152].
Wood et al. [153] investigated the effect of potted Dracaena deremensis ‘Janet Craig’ plants for removing TVOCs in office air. The diameter of the pots was 300 mm, with and without air-conditioning settings. These potted-plants dramatically decreased the value of TVOC concentration.
Toxic pollutant with high concentration can damage plants. One of the essential technologies to decrease this problem is tailoring transgenic plants such as the transgenic plant Nicotiana tabacum for SO2, Arabidopsis for NO2, Arabidopsis and Nicotiana tabacum for CH2O, and transgenic Nicotiana tabacum for VOCs such as benzene [127,154]. Indoor air treatment by botanical systems depends on many factors such as the content of moisture, the interfacial areas, and the type (hydrophobicity) of the biomass used can influence pollutant removal in biological purifiers; the studies showed that botanical systems could remove toluene [84].
4.4. Particulate Matter Removal from Indoor Air by Plants
There are few studies on PM removal by botanical systems. PMs can be reduced in indoor air by different methods: (i) control at source and (ii) control during transmission. Botanical systems are a suitable method for PM removal. The plants that are used for PM removal are Chlorophytum comosum and Epipremnum aureus. These plants show high PM absorption [155]. Bondarevs et al. [131,137] investigated particle materials containing PM10, PM2.5, and PM1.0. As shown in Figure 7, the PM1.0 concentration reduces at a rate of –1.87 μg m3 h−1 with fan off, −6.67 μg m3 h−1 with a fan at airflow 28.8 m3/h and −20.06 μg m3 h−1 with a fan at airflow 82.8 m3/h.
Furthermore, factors/forces such as gravity play a role in the accumulation of PM on plant leaves [126,156]. Generally, the amount of PM accumulation on the surface of the leaf depends on the place that the plant take it in [89]. Usually, particulate matter with smaller size has more attachment on a leaf surface than large-sized PM; the interception of dust with plants related to their canopy shape and size, leaf phyllotaxy, and leaf surface hairs and cuticle. Usually, the fine particles adsorb on the leaf surface and can be easily re-suspended [157,158]. For example, Gawrońska et al. [126] showed that large PM and fine PM accumulated on the leaf of Chlorophytum comosum L. plant with the amount of 68% and 7%, respectively, in indoor environments. Recently Irga et al. [44] showed good potential of the green wall (spider plant) for PM removal. They also showed that the rate of air affects PM removal. The 11 L·s−1 of airflow rate has the highest filtration among the rates of 4 to 15 L·s−1, and the removal efficiency reached up to 53 ± 10%.
4.5. The Choice of Plant
Normally, the selection of suitable plant should be appropriated to the urban landscapes in order to prevent financial or environmental losses [159]. One of the best tools for selecting plant is the Air Pollution Tolerance Index (APTI). APTI considers biochemical properties of leaves such as ascorbic acid, relative water content, total chlorophyll, and leaf extract PH. These properties affect the value of the plant’s tolerance to air pollutants. For example, under water stress, the content of chlorophyll induces reactive oxygen species (ROS) in the chloroplast. The high value of ascorbic acid in leaves is one strategy to prevent oxidative damage to thylakoid membranes under water stress conditions [4]. In 1989, NASA’s research work on indoor air pollution led to a thorough study called “interior landscape plants for indoor air pollution abatement”. These research studies classified the best indoor plants for removing a pollutant that is easily accessible. In summary, Peace lily (Spathiphyllum sp.), Boston fern (Nephrolepis exaltata ‘Bostoniensis’ English ivy (Hedera helix) can be used for removal of formaldehyde (CH2O), Spider plant (Chlorophytum comosum), Janet Craig Dracaena (Dracaena deremensis ‘Janet Craig’), Ficus sp. for removal of carbon monoxide (CO), Golden Pothos (Epipremnum aures), Devil’s ivy (Epipremnum aureum), Philodendron for removal of VOCs, Mother-in-law’s tongue (Sansevieria trifasciata ‘Laurentii’) Chrysanthemum (Chrysantheium morifolium), Dracaena sp. for removal of trichloroethylene (TCE), and Kimberly Queen Fern (Nephrolepis obliterate), Orchid sp. (Phalaenopsis sp.) Dieffenbachia sp. for removal of benzene (C6H6)/toluene (C7H8)/xylene (C8H10) [95]. Table 3 illustrates some of the studies focusing on the removal of pollutant from indoor air. The potted-plants that were used for VOC removal are Dracaena deremensis var. “Janet Craig” (Dracaenaceae) and Spathiphyllum wallissii var. Petite (Peace Lily). These plants are the type of common tropical house plants and they do not have high efficiency in pollutant removal. Plants with excellent efficiency are Hemigraphis alternata (Purple waffle), Tradescantia pallida (Purple heart), Hedera helix (English Ivy), Asparagus densiflorous (Asparagus fern), Hoya camosa (Variegated wax) and Crassula portulacea (Crassulaceae) [127].
5. Benefits and Economic Analysis
Table 4 show examples of green walls used to remove indoor air pollution. Not only can plants remove pollutants, but also the temperature in an indoor environment can be regularised by green walls. Therefore, the cost of energy consumption could be decreased. Green walls can induce temperature in the 0.5–5 °C range [164,165,166]. As shown by Tudiwer and Azra Korjenic [167], air relative humidity increases if a green wall used. If airflow passes among indoor plants as a biofiltration system, it is useful to decrease air volume from outdoors, which can decrease energy consumption [109]. Potted-plants and green walls have a high potential to decrease noise pollution [101]. D’Alessandro et al. [168] illustrated plants’ ability to absorb acoustic energy, especially when there was soil and it has to adsorb acoustic incident energy up to 80% at frequencies above 1000 Hz. Also, the greenery system in an indoor environment decreases social stress and is beneficial to human mental health [98,169]. Furthermore, it creates an aesthetically pleasing environment [101].
6. Summary, Conclusions and Future Outlook
The source of indoor air pollutants, the effect of pollutants on human health, and the essential methods to purify polluted indoor air, including phytoremediation, were reviewed. Biofiltration and botanical systems are alternative methods to treat indoor air pollution by the plants, which need lower energy and much lower capital investment and are much more natural and environmentally friendly.
A list of plants for removing specific pollutants are presented. It is found that spider plants and philodendron show high potential to remove formaldehyde, while Chlorophytum comosum can remove PMs. Active living walls are among the newest varieties of phytoremediation systems that include the incorporation of ventilation, heating, and cooling of the house. The studies showed that botanical air filtration’s efficiency is linked to the size of potted plants and more strongly to the dynamics of air.
The published studies indicate that green buildings in urban areas give many benefits, including productivity enhancements that can be explained by financial achievement. However, it was found that some of the important air pollutants such as acetaldehyde, acrolein, naphthalene, trichloroethylene, tetrachloroethylene were not studied. Available studies also lack detailed mechanisms of phytoremediation and the chemical property of pollutants. Furthermore, there is a need for removing pollution in high concentration by plants and the use of microorganisms to enhance plant resistance against pollutants, particularly toxic pollutants. Particulate matter was not studied in great detail in indoor air and, therefore, more investigations are needed to consider their effect on indoor air quality.
This review highlights the significant potential for phytoremediation to treat indoor air pollution. More studies are recommended on green walls and plants in building architecture to fill existing research gaps and derive best practice guidelines that could be used by urban planners, designers, or individual house owners.
Author Contributions
Conceptualization, S.B., T.M., H.O. and P.K.; methodology, S.B., T.M., H.O. and P.K.; software, S.B. and T.M.; data curation, S.B., T.M., H.O., and P.K.; writing—original draft preparation, S.B. and T.M.; writing—review and editing, S.B., T.M., H.O. and P.K. All authors have read and agreed to the published version of the manuscript.
Funding
This research received no external funding. PK thanks the support received via the University of Surrey’s awards for the Clear Air Engineering for Homes (CArE-Homes) project under the Research England’s Global Challenge Research Fund (GCRF).
Institutional Review Board Statement
Not applicable.
Informed Consent Statement
Not applicable.
Data Availability Statement
Not applicable.
Conflicts of Interest
The authors declare that they have no conflict of interest.
References
- Kumar, P.; Hama, S.; Omidvarborna, H.; Sharma, A.; Sahani, J.; Abhijith, K.; Debele, S.E.; Zavala-Reyes, J.C.; Barwise, Y.; Tiwari, A. Temporary reduction in fine particulate matter due to ‘anthropogenic emissions switch-off’ during COVID-19 lockdown in Indian cities. Sustain. Cities Soc. 2020, 62, 102382. [Google Scholar] [CrossRef]
- Saha, S.; Monroe, A.; Day, M.R. Growth, yield, plant quality and nutrition of basil (Ocimum basilicum L.) under soilless agricultural systems. Ann. Agric. Sci. 2016, 61, 181–186. [Google Scholar] [CrossRef]
- Aller, M. Environmental Laws and Regulations. In Library of Congress Cataloging; CRC Press LLC: Boca Raton, FL, USA, 1999. [Google Scholar]
- Pandey, A.K.; Pandey, M.; Tripathi, B. Air Pollution Tolerance Index of climber plant species to develop Vertical Greenery Systems in a polluted tropical city. Landsc. Urban. Plan. 2015, 144, 119–127. [Google Scholar] [CrossRef]
- Sanjuán-Herráez, D.; Rodríguez-Carrasco, Y.; Juan-Peiró, L.; Pastor, A.; De la Guardia, M. Determination of indoor air quality of a phytosanitary plant. Anal. Chim. Acta 2011, 694, 67–74. [Google Scholar] [CrossRef] [PubMed]
- Gallego, E.; Roca, F.J.; Perales, J.F.; Guardino, X.; Gadea, E.; Garrote, P. Impact of formaldehyde and VOCs fromwaste treatment plants upon the ambient air nearby an urban area. Sci. Total Environ. 2016, 568, 369–380. [Google Scholar] [CrossRef]
- Marć, M. Problems and challenges associated with estimating the emissions of organic compounds from indoor materials. Trac Trends Anal. Chem. 2017, 97, 297–308. [Google Scholar] [CrossRef]
- Sriprapat, W.; Thiravetyan, P. Efficacy of ornamental plants for benzene removal from contaminated air and water: Effect of plant associated bacteria. Int. Biodeterior. Biodegrad. 2016, 113, 262–268. [Google Scholar] [CrossRef]
- Schwela, P.D. Indoor Air; Kotzias, D., Ed.; Wiley Online Library: Hoboken, NJ, USA, 2005; Volume 3, pp. 475–489. [Google Scholar]
- Schwela, D. Pollution, Indoor Air A2—Wexler, Philip. In Encyclopedia of Toxicology, 3rd ed.; Oxford University Press: Oxford, UK, 2014; pp. 1003–1017. [Google Scholar]
- Kolokotsa, D.; Santamouris, M. Review of the indoor environmental quality and energy consumption studies for low income households in Europe. Sci. Total Environ. 2015, 536, 316–330. [Google Scholar] [CrossRef] [PubMed]
- EPA. Why Indoor Air Quality Is Important to Schools. Available online: https://www.epa.gov/iaq-schools/why-indoor-air-quality-important-schools (accessed on 5 March 2021).
- Satish, U.; Mendell, M.J.; Shekhar, K.; Hotchi, T.; Sullivan, D.; Streufert, S.; Fisk, W.J. Is CO2an Indoor Pollutant? Direct Effects of Low-to-Moderate CO2Concentrations on Human Decision-Making Performance. Environ. Health Perspect. 2012, 120, 1671–1677. [Google Scholar] [CrossRef] [PubMed] [Green Version]
- Pereira, M.; Tribess, A.; Buonanno, G.; Stabile, L.; Scungio, M.; Baffo, I. Particle and Carbon Dioxide Concentration Levels in a Surgical Room Conditioned with a Window/Wall Air-Conditioning System. Int. J. Environ. Res. Public Health 2020, 17, 1180. [Google Scholar] [CrossRef] [Green Version]
- Torpy, F.; Irga, P.; Burchett, M. Profiling indoor plants for the amelioration of high CO2 concentrations. Urban For. Urban Green. 2014, 13, 227–233. [Google Scholar] [CrossRef]
- Australia, E. BTEX Personal Exposure Monitoring in Four Australian Cities; Technical Report No. 6; Common-Wealth of Australia: Sydney, Australia, 2003; pp. 1–62. [Google Scholar]
- Vasile, V.; Petran, H.; Dima, A.; Petcu, C. Indoor Air Quality—A Key Element of the Energy Performance of the Buildings. Energy Procedia 2016, 96, 277–284. [Google Scholar] [CrossRef] [Green Version]
- Cheng, L.; Li, B.; Cheng, Q.; Baldwin, A.N.; Shang, Y. Investigations of indoor air quality of large department store buildings in China based on field measurements. Build. Environ. 2017, 118, 128–143. [Google Scholar] [CrossRef]
- Kazemi, A.; Ghorbanpour, M. Introduction to Environmental Challenges in All Over the World. In Medicinal Plants and Environmental Challenges; Springer: Cham, Switzerland, 2017; pp. 25–48. [Google Scholar] [CrossRef]
- Luengas, A.T.; Hort, C.; Platel, V.; Elias, A.; Barona, A.; Moynault, L. Removal of traces of toluene and p-xylene in indoor air using biofiltration and a hybrid system (biofiltration + adsorption). Environ. Sci. Pollut. Res. 2017, 24, 10674–10684. [Google Scholar] [CrossRef] [PubMed]
- Katsoyiannis, A.; Bogdal, C. Interactions between indoor and outdoor air pollution—Trends and scientific challenges. Environ. Pollut. 2012, 169, 150–151. [Google Scholar] [CrossRef]
- Veetil, D.S.P. Air Pollution: Sources and Effects in Urban Areas and How it Affect the Investment and Economy. Envirocities Emagazine 2012, 3, 5. [Google Scholar]
- Wetzel, T.A.; Doucette, W.J. Plant leaves as indoor air passive samplers for volatile organic compounds (VOCs). Chemosphere 2015, 122, 32–37. [Google Scholar] [CrossRef]
- Śmiełowska, M.; Marć, M.; Zabiegała, B. Indoor air quality in public utility environments—A review. Environ. Sci. Pollut. Res. 2017, 24, 11166–11176. [Google Scholar] [CrossRef] [PubMed] [Green Version]
- Segalin, B.; Kumar, P.; Micadei, K.; Fornaro, A.; Gonçalves, F.L. Size–Segregated particulate matter inside residences of elderly in the Metropolitan Area of São Paulo, Brazil. Atmos. Environ. 2017, 148, 139–151. [Google Scholar] [CrossRef] [Green Version]
- PM, V. Processing and Characterizations: State-of-the-Art and New Challenges. Nanostruct. Polym. Membr. 2016, 1, 1. [Google Scholar]
- Thatcher, A.; Milner, K. Is a green building really better for building occupants? A longitudinal evaluation. Build. Environ. 2016, 108, 194–206. [Google Scholar] [CrossRef]
- Ugranli, T.; Gungormus, E.; Sofuoglu, A.; Sofuoglu, S. Indoor Air Quality in Chemical Laboratories. In Elsevier Comprehensive Analytical Chemistry; Elsevier: Amsterdam, The Netherlands, 2016; pp. 859–878. [Google Scholar] [CrossRef]
- Arif, M.; Katafygiotou, M.; Mazroei, A.; Kaushik, A.; Elsarrag, E. Impact of indoor environmental quality on occupant well-being and comfort: A review of the literature. Int. J. Sustain. Built Environ. 2016, 5, 1–11. [Google Scholar]
- Balmes, J.R.; Eisner, M.D. Indoor and outdoor air pollution. In Murray & Nadel’s Textbook of Respiratory Medicine E-Book; Elsevier: Amsterdam, The Netherlands, 2016; p. 2208. [Google Scholar]
- Chandrappa, R.; Kulshrestha, U.C. Sustainable Air Pollution Management Theory and Practice; Hamburg, U.F., Rulkens, W.H., Salomons, W., Eds.; Springer: Cham, Switzerland, 2016. [Google Scholar]
- Goyal, R.; Khare, M.; Kumar, P. Indoor air quality: Current status, missing links and future road map for India. J. Civ. Environ. Eng. 2012, 2, 2–4. [Google Scholar] [CrossRef] [Green Version]
- Nazaroff, W.W. Exploring the consequences of climate change for indoor air quality. Environ. Res. Lett. 2013, 8, 015022. [Google Scholar] [CrossRef] [Green Version]
- Leung, D.Y.C. Outdoor-indoor air pollution in urban environment: Challenges and opportunity. Front. Environ. Sci. 2015, 2. [Google Scholar] [CrossRef]
- Kiurski, J.S.; Marić, B.B.; Aksentijević, S.M.; Oros, I.B.; Kecic, V.S.; Kovačević, I.M. Indoor air quality investigation from screen printing industry. Renew. Sustain. Energy Rev.. 2013, 28, 224–231. [Google Scholar] [CrossRef]
- Jovanović, M.; Vučićević, B.; Turanjanin, V.; Živković, M.; Spasojević, V. Investigation of indoor and outdoor air quality of the classrooms at a school in Serbia. Energy Environ. Sci. 2014, 77, 42–48. [Google Scholar] [CrossRef]
- Dėdelė, A.; Miškinytė, A. Seasonal variation of indoor and outdoor air quality of nitrogen dioxide in homes with gas and electric stoves. Environ. Sci. Pollut. Res. 2016, 23, 17784–17792. [Google Scholar] [CrossRef] [PubMed]
- Cibella, F.; Cuttitta, G.; Della Maggiore, R.; Ruggieri, S.; Panunzi, S.; De Gaetano, A.; Bucchieri, S.; Drago, G.; Melis, M.R.; La Grutta, S.; et al. Effect of indoor nitrogen dioxide on lung function in urban environment. Environ. Res. 2015, 138, 8–16. [Google Scholar] [CrossRef] [Green Version]
- Shen, H.; Tsai, C.M.; Yuan, C.S.; Jen, Y.H.; Ie, I.R. How incense and joss paper burning during the worship activities influences ambient mercury concentrations in indoor and outdoor environments of an Asian temple. Chemosphere 2017, 167, 530–540. [Google Scholar] [CrossRef]
- Loupa, G.; Polyzou, C.; Zarogianni, A.M.; Ouzounis, K.; Rapsomanikis, S. Indoor and outdoor elemental mercury: A comparison of three different cases. Environ. Monit. Assess. 2017, 189. [Google Scholar] [CrossRef] [PubMed]
- Darling, E.; Morrison, G.C.; Corsi, R.L. Passive removal materials for indoor ozone control. Build. Environ. 2016, 106, 33–44. [Google Scholar] [CrossRef]
- Fadeyi, M.O. Ozone in indoor environments: Research progress in the past 15 years. Sustain. Cities Soc. 2015, 18, 78–94. [Google Scholar] [CrossRef]
- Heal, M.R.; Kumar, P.; Harrison, R.M. Particles, air quality, policy and health. Chem. Soc. Rev. 2012, 41, 6606–6630. [Google Scholar] [CrossRef] [Green Version]
- Irga, P.; Paull, N.; Abdo, P.; Torpy, F. An assessment of the atmospheric particle removal efficiency of an in-room botanical biofilter system. Build. Environ. 2017, 115, 281–290. [Google Scholar] [CrossRef]
- Buczyńska, A.J.; Krata, A.; Van Grieken, R.; Brown, A.; Polezer, G.; De Wael, K.; Potgieter-Vermaak, S. Composition of PM2.5 and PM1 on high and low pollution event days and its relation to indoor air quality in a home for the elderly. Sci. Total Environ. 2014, 490, 134–143. [Google Scholar] [CrossRef]
- Defra The Air Quality Strategy for England, Scotland, Wales and Northern Ireland; Department for Environment, Food and Rural Affairs, The Stationery Office: London, UK, 2007.
- Abd El Aziz, N.G.; Mahgoub, M.H.; Azza, M.M.M.; Farahat, M.M.; Abouziena, H.F. Potentiality of Ornamental Plants and Woody Trees as Phytoremidators of Pollutants in the Air: A Review. Int. J. Chemtech Res. 2015, 8, 468–482. [Google Scholar]
- Othman, M.; Latif, M.T.; Mohamed, A.F. The PM10 compositions, sources and health risks assessment in mechanically ventilated office buildings in an urban environment. Air Qual. Atmos. Health 2015, 9, 597–612. [Google Scholar] [CrossRef]
- Bozlaker, A.; Peccia, J.; Chellam, S. Indoor/Outdoor Relationships and Anthropogenic Elemental Signatures in Airborne PM2.5 at a High School: Impacts of Petroleum Refining Emissions on Lanthanoid Enrichment. Environ. Sci. Technol. 2017, 51, 4851–4859. [Google Scholar] [CrossRef] [PubMed]
- Mohammadyan, M.; Ghoochani, M.; Kloog, I.; Abdul-Wahab, S.A.; Yetilmezsoy, K.; Heibati, B.; Pollitt, K.J.G. Assessment of indoor and outdoor particulate air pollution at an urban background site in Iran. Environ. Monit. Assess. 2017, 189, 29. [Google Scholar] [CrossRef] [PubMed]
- Kaur, A.; Misra, A. Impact of Indoor Surface Materials and Environment on Perceived Air Quality. J. Environ. Hum. 2014, 2014, 25–35. [Google Scholar] [CrossRef]
- Mentese, S.; Mirici, N.A.; Otkun, M.T.; Bakar, C.; Palaz, E.; Tasdibi, D.; Cevizci, S.; Cotuker, O. Association between respiratory health and indoor air pollution exposure in Canakkale, Turkey. Build. Environ. 2015, 93, 72–83. [Google Scholar] [CrossRef]
- De Gennaro, G.; Dambruoso, P.R.; Loiotile, A.D.; Di Gilio, A.; Giungato, P.; Tutino, M.; Marzocca, A.; Mazzone, A.; Palmisani, J.; Porcelli, F. Indoor air quality in schools. Environ. Chem. Lett. 2014, 12, 467–482. [Google Scholar] [CrossRef]
- Sriprapat, W.; Suksabye, P.; Areephak, S.; Klantup, P.; Waraha, A.; Sawattan, A.; Thiravetyan, P. Uptake of toluene and ethylbenzene by plants: Removal of volatile indoor air contaminants. Ecotoxicol. Environ. Saf. 2014, 102, 147–151. [Google Scholar] [CrossRef]
- Nielsen, G.D.; Larsen, S.T.; Wolkoff, P. Recent trend in risk assessment of formaldehyde exposures from indoor air. Arch. Toxicol. 2012, 87, 73–98. [Google Scholar] [CrossRef] [PubMed] [Green Version]
- Nielsen, G.D.; Larsen, S.T.; Wolkoff, P. Re-evaluation of the WHO (2010) formaldehyde indoor air quality guideline for cancer risk assessment. Arch. Toxicol. 2016, 91, 35–61. [Google Scholar] [CrossRef] [Green Version]
- Destaillats, H.; Maddalena, R.L.; Singer, B.C.; Hodgson, A.T.; McKone, T.E. Indoor pollutants emitted by office equipment: A review of reported data and information needs. Environ. Energy Technol. Div. 2007, 42, 1371–1388. [Google Scholar] [CrossRef] [Green Version]
- ATSDR. Naphthalene, 1-Methylnapthalene, 2-Methylnapthalene; ATSDR: Atlanta, GA, USA, 2011.
- ATSDR. Trichloroethylene (TCE); ATSDR: Atlanta, GA, USA, 2011.
- Bahr, D.E.; Aldrich, T.E.; Seidu, D.; Brion, G.M.; Tollerud, D.J.; Muldoon, S.; Reinhart, N.; Youseefagha, A.; McKinney, P.; Hughes, T.; et al. Occupational exposure to trichloroethylene and cancer risk for workers at the Paducah Gaseous Diffusion Plant. Int. J. Occup. Med. Environ. Health 2011, 24, 67–77. [Google Scholar] [CrossRef]
- Environmental Health and Medicine Education. Tetrachloroethylene Toxicity, What Are the Physiological Effects of Tetrachloroethylene Exposure? In Agency for Toxic Substances and Disease Registry; ATSDR: Atlanta, GA, USA, 2008. [Google Scholar]
- Ayoko, G.A.; Wang, H. Volatile Organic Compounds. In Indoor Environments; Pluschke, P., Schleibinger, H., Eds.; Springer: Berlin/Heidelberg, Germany, 2014; pp. 69–107. [Google Scholar] [CrossRef]
- World Health Organization. Indoor Air Quality: Organic Pollutants. Report on a WHO Meeting, Berlin, Germany, 23–27 August 1987; EURO Reports and Studies 111; World Health Organization Regional Office for Europe: Copenhagen, Denmark, 1989. [Google Scholar]
- WHO. Air Quality Guidelines for Europe, 2nd ed.; World Health Organization Regional Office for Europe: Copenhagen, Denmark, 2000. [Google Scholar]
- EPA. United States Environmental Protection Agency; EPA: Washington, DC, USA, 1971.
- Besis, A.; Samara, C. Polybrominated diphenyl ethers (PBDEs) in the indoor and outdoor environments—A review on occurrence and human exposure. Environ. Pollut. 2012, 169, 217–229. [Google Scholar] [CrossRef] [PubMed]
- Darnerud, P.O.; Eriksen, G.S.; Jóhannesson, T.; Larsen, P.B.; Viluksela, M. Polybrominated diphenyl ethers: Occurrence, dietary exposure, and toxicology. Environ. Health Perspect. 2001, 109, 49–68. [Google Scholar]
- Hooper, K.; McDonald, T.A. The PBDEs: An emerging environmental challenge and another reason for breast-milk monitoring programs. Environ. Health Perspect. 2000, 108, 387–392. [Google Scholar] [CrossRef]
- Gaspar, F.W.; Chevrier, J.; Bornman, R.; Crause, M.; Obida, M.; Barr, D.B.; Bradman, A.; Bouwman, H.; Eskenazi, B. Corrigendum to Undisturbed dust as a metric of long-term indoor insecticide exposure: Residential DDT contamination from indoor residual spraying and its association with serum levels in the VHEMBE cohort. Environ. Int. 2016, 94, 778–783. [Google Scholar] [CrossRef] [PubMed]
- Sánchez, A.M.; Nuevo, M.J. Actions for remediation in cases with large concentration of radon indoor. J. Radioanal. Nucl. Chem. 2016, 311, 1219–1225. [Google Scholar] [CrossRef]
- Al-Zoughool, M.; Krewski, D. Health effects of radon: A review of the literature. Int. J. Radiat. Biol. 2009, 85, 57–69. [Google Scholar] [CrossRef] [PubMed]
- Jenkins, P.L.; Phillips, T.J.; Mulberg, E.J.; Hui, S.P. Activity patterns of Californians: Use of and proximity to indoor pollutant sources. Atmos. Environ. Part A Gen. Top. 1992, 26, 2141–2148. [Google Scholar] [CrossRef]
- Bruce, N.; Perez-Padilla, R.; Albalak, R. Indoor air pollution in developing countries: A major environmental and public health challenge. Bull. World Health Organ. 2000, 78, 1078–1092. [Google Scholar] [PubMed]
- Ezzati, M. Indoor Air Pollution/Developing Countries; Elsevier Inc.: Amsterdam, The Netherlands, 2008; pp. 547–553. [Google Scholar] [CrossRef]
- Smith, K.R.; Mehta, S.; Maeusezahl-Feuz, M. Indoor air pollution from household solid fuel use. In Comparative Quantification of Health Risks: Global and Regional Burden of Disease Attributable to Selected Major Risk Factors; Ezzati, M., Ed.; World Health Organization: Geneva, Switzerland, 2004; pp. 1435–1493. [Google Scholar]
- Smith, K.R. Biofuels, Air Pollution, and Health: A Global Review; Plenum Press: New York, NY, USA, 1987. [Google Scholar]
- Moya, T.A.; Dobbelsteen, A.V.D.; Ottelé, M.; Bluyssen, P.M. A review of green systems within the indoor environment. Indoor Built Environ. 2018, 28, 298–309. [Google Scholar] [CrossRef]
- Irga, P.J.; Pettit, T.; Irga, R.F.; Paull, N.J.; Douglas, A.N.; Torpy, F.R. Does plant species selection in functional active green walls influence VOC phytoremediation efficiency? Environ. Sci. Pollut. Res. 2019, 26, 1–8. [Google Scholar] [CrossRef] [Green Version]
- Kaunelienė, V.; Prasauskas, T.; Krugly, E.; Stasiulaitienė, I.; Čiužas, D.; Šeduikytė, L.; Martuzevičius, D. Indoor air quality in low energy residential buildings in Lithuania. Build. Environ. 2016, 108, 63–72. [Google Scholar] [CrossRef]
- Rounaghi, G.; Kakhki, R.M.; Eshghi, H. Efficient transport of lead (II) cations in natural water using a liquid membrane system with dicyclohexano-18-crown-6 as carrier. Arab. J. Chem. 2017, 10, S339–S346. [Google Scholar] [CrossRef] [Green Version]
- Liu, G.; Xiao, M.; Zhang, X.; Gal, C.; Chen, X.; Liu, L.; Pan, S.; Wu, J.; Tang, L.; Clements-Croome, D. A review of air filtration technologies for sustainable and healthy building ventilation. Sustain. Cities Soc. 2017, 32, 375–396. [Google Scholar] [CrossRef]
- Jimenez-Relinque, E.; Castellote, M. Influence of the inlet air in efficiency of photocatalytic devices for mineralization of VOCs in air-conditioning installations. Environ. Sci. Pollut. Res. 2014, 21, 11198–11207. [Google Scholar] [CrossRef] [PubMed]
- Luengas, A.; Barona, A.; Hort, C.; Gallastegui, G.; Platel, V.; Elias, A. Reviews in Environmental Science and Bio/Technology. Rev. Environ. Sci. Biotechnol. 2015, 14, 499–522. [Google Scholar] [CrossRef]
- Guieysse, B.; Hort, C.; Platel, V.; Munoz, R.; Ondarts, M.; Revah, S. Biological treatment of indoor air for VOC removal: Potential and challenges. Biotechnol. Adv. 2008, 26, 398–410. [Google Scholar] [CrossRef] [PubMed]
- Agarwal, P.; Sarkar, M.; Chakraborty, B.; Banerjee, T. Phytoremediation of Air Pollutants: Prospects and Challenges. In Phytomanagement of Polluted Sites; Elsevier: Amsterdam, The Netherlands, 2019; pp. 221–241. [Google Scholar]
- Brilli, F.; Fares, S.; Ghirardo, A.; de Visser, P.; Calatayud, V.; Muñoz, A.; Annesi-Maesano, I.; Sebastiani, F.; Alivernini, A.; Varriale, V.; et al. Plants for Sustainable Improvement of Indoor Air Quality. Trends Plant. Sci. 2018, 23, 507–512. [Google Scholar] [CrossRef] [PubMed]
- Cummings, B.E.; Waring, M.S. Potted plants do not improve indoor air quality: A review and analysis of reported VOC removal efficiencies. J. Expo. Sci. Environ. Epidemiol. 2019, 30, 253–261. [Google Scholar] [CrossRef] [PubMed] [Green Version]
- Han, K.-T.; Ruan, L.-W. Effects of indoor plants on air quality: A systematic review. Environ. Sci. Pollut. Res. 2020, 27, 16019–16051. [Google Scholar] [CrossRef]
- Abhijith, K.; Kumar, P.; Gallagher, J.; McNabola, A.; Baldauf, R.; Pilla, F.; Broderick, B.; Di Sabatino, S.; Pulvirenti, B. Air pollution abatement performances of green infrastructure in open road and built-up street canyon environments—A review. Atmos. Environ. 2017, 162, 71–86. [Google Scholar] [CrossRef]
- Wannomai, T.; Kemacheevakul, P.; Thiravetyan, P. Removal of Trimethylamine from Indoor Air Using Potted Plants under Light and Dark Conditions. Aerosol Air Qual. Res. 2019, 19, 1105–1113. [Google Scholar] [CrossRef]
- Aydogan, A.; Cerone, R. Review of the effects of plants on indoor environments. Indoor Built Environ. 2020. [Google Scholar] [CrossRef]
- Tiwari, A.; Kumar, P.; Kalaiarasan, G.; Ottosen, T.-B. The impacts of existing and hypothetical green infrastructure scenarios on urban heat island formation. Environ. Pollut. 2021, 274, 115898. [Google Scholar] [CrossRef]
- Weyens, N.; Thijs, S.; Popek, R.; Witters, N.; Przybysz, A.; Espenshade, J.; Gawronska, H.; Vangronsveld, J.; Gawronski, S.W. The Role of Plant–Microbe Interactions and Their Exploitation for Phytoremediation of Air Pollutants. Mol. Sci. 2015, 16, 25576–25604. [Google Scholar] [CrossRef] [Green Version]
- Cuce, E. Thermal regulation impact of green walls: An experimental and numerical investigation. Appl. Energy 2017, 194, 247–254. [Google Scholar] [CrossRef]
- Maslauskas, T. Green Walls—The Vertical Planting Systems; VIA University College: Horsens, Denmark, 2015; p. 43. [Google Scholar]
- Pastore, L.; Corrao, R.; Heiselberg, P.K. The effects of vegetation on indoor thermal comfort: The application of a multi-scale simulation methodology on a residential neighborhood renovation case study. Energy Build. 2017, 146, 1–11. [Google Scholar] [CrossRef]
- Ravindu, S.; Rameezdeen, R.; Zuo, J.; Zhou, Z.; Chandratilake, R. Indoor environment quality of green buildings: Case study of an LEED platinum certified factory in a warm humid tropical climate. Build. Environ. 2015, 84, 105–113. [Google Scholar] [CrossRef]
- Safikhani, T.; Abdullah, A.M.; Ossen, D.R.; Baharvand, M. A review of energy characteristic of vertical greenery systems. Renew. Sustain. Energy Rev. 2014, 40, 450–462. [Google Scholar] [CrossRef]
- Gunawardena, K.; Steemers, K. Living walls in indoor environments. Build. Environ. 2019, 148, 478–487. [Google Scholar] [CrossRef]
- Green Roofs for Healthy Cities: Introduction to Green Walls, Introduction to Green Walls Technology Benefits & Design. 2008. Available online: www.greenroofs.org (accessed on 1 April 2021).
- Modirrousta, S.; Mohammadi, Z. Necessity and Methods of Designing Green Buildings in Cities and its Effect on Energy Efficiency. Eur. Online J. Nat. Soc. Sci. Proc. 2015, 4, 304–314. [Google Scholar]
- Tomson, M.; Kumar, P.; Barwise, Y.; Perez, P.; Forehead, H.; French, K.; Morawska, L.; Watts, J.F. Green infrastructure for air quality improvement in street canyons. Environ. Int. 2021, 146, 106288. [Google Scholar] [CrossRef] [PubMed]
- Wolverton, B.C.B.; NASA. Improving Indoor Air Quality with Plant-Based Systems; NASA: Washington, DC, USA, 2009.
- Darlington, A.B.; Dat, J.F.; Dixon, M.A. The Biofiltration of Indoor Air: Air Flux and Temperature Influences the Removal of Toluene, Ethylbenzene, and Xylene. Environ. Sci. Technol. 2000, 35, 240–246. [Google Scholar] [CrossRef]
- Darlington, A.B. Room Air Cleansing Using Hydroponic Plants. U.S. Patent No. 6,727,09, 27 April 2004. [Google Scholar]
- Llewellyn, D.; Darlington, A.; van Ras, N.; Kraakman, B.; Dixon, M. A hybridized membrane-botanical biofilter for improving air quality in occupied spaces. In Proceedings of the 37th COSPAR Scientific Assembly, Montreal, QC, Canada, 13–20 July 2008; Volume 37, p. 1813. [Google Scholar]
- Prodanovic, V.; Wang, A.; Deletic, A. Assessing water retention and correlation to climate conditions of five plant species in greywater treating green walls. Water Res. 2019, 167, 115092. [Google Scholar] [CrossRef]
- Sadeghian, M.M. A Review on Green Wall Classification and Function. Sci. Technol. 2016, 2, 47–51. [Google Scholar]
- Pérez-Urrestarazu, L.; Fernández-Cañero, R.; Franco, A.; Egea, G. Influence of an active living wall on indoor temperature and humidity conditions. Ecol. Eng. 2016, 90, 120–124. [Google Scholar] [CrossRef]
- Pettit, T.; Irga, P.; Torpy, F. Functional green wall development for increasing air pollutant phytoremediation: Substrate development with coconut coir and activated carbon. J. Hazard. Mater. 2018, 360, 594–603. [Google Scholar] [CrossRef] [PubMed]
- Irga, P.J.; Pettit, T.J.; Torpy, F.R. The phytoremediation of indoor air pollution: A review on the technology development from the potted plant through to functional green wall biofilters. Rev. Environ. Sci. Bio/Technol. 2018, 17, 395–415. [Google Scholar] [CrossRef]
- Sowa, J.; Hendiger, J.; Maziejuk, M.; Sikora, T.; Osuchowski, L.; Kamińska, H. Potted Plants as Active and Passive Biofilters Improving Indoor Air Quality. Iop Conf. Ser. Earth Environ. Sci. 2019, 290, 012150. [Google Scholar] [CrossRef]
- Abdo, P.; Huynh, B.P.; Irga, P.J.; Torpy, F.R. Evaluation of air flow through an active green wall biofilter. Urban For. Urban Green. 2019, 41, 75–84. [Google Scholar] [CrossRef]
- Hernandez, M.; Peden, D.B. Air Pollution: Indoor and Outdoor. In Middleton’s Allergy: Principles and Practice; Adkinson, N.F., Jr., Bochner, B.S., Eds.; Elsevier Inc.: Amsterdam, The Netherlands, 2013; pp. 482–496. [Google Scholar]
- Pettit, T.; Bettes, M.; Chapman, A.R.; Hoch, L.M.; James, N.D.; Irga, P.J.; Torpy, F.R.; Plants and Environmental Quality Research Group. The botanical biofiltration of VOCs with active airflow: Is removal efficiency related to chemical properties? Atmos. Environ. 2019, 214, 116839. [Google Scholar] [CrossRef]
- Fleck, R.; Pettit, T.J.; Douglas, A.N.; Irga, P.J.; Torpy, F.R. 15—Botanical biofiltration for reducing indoor air pollution. In Bio-Based Materials and Biotechnologies for Eco-Efficient Construction; Pacheco-Torgal, F., Ivanov, V., Tsang, D.C.W., Eds.; Woodhead Publishing: Sawston, UK, 2020; pp. 305–327. [Google Scholar]
- Curtis, L.; Stuart, M. Enhancing CHBE Indoor Air Quality: Biowall Technology; Student Report; University of British Columbia Social Ecological Economic Development Studies (SEEDS): Vancouver, BC, Canada, 2010. [Google Scholar]
- Dickinson, N.M.; Baker, A.J.; Doronila, A.; Laidlaw, S.; Reeves, R.D. Phytoremediation of inorganics: Realism and synergies. Int. J. Phytoremediat. 2009, 11, 97–114. [Google Scholar] [CrossRef]
- Rostami, S.; Azhdarpoor, A. The application of plant growth regulators to improve phytoremediation of contaminated soils: A review. Chemosphere 2019, 220, 818–827. [Google Scholar] [CrossRef]
- Chaney, R.; Malik, M.; Li, Y.M.; Brown, S.L.; Brewer, E.P.; Angle, J.S.; Baker, A.J. Phytoremediation of soil metals. Curr. Opin. Biotechnol. 1997, 8, 279–284. [Google Scholar] [CrossRef]
- Ensley, B. Rationale for use of phytoremediation. In Phytoremediation of Toxic Metals: Using Plants to Clean Up the Environment; Raskin, I., Ensley, B.D., Eds.; John Wiley & Sons: New York, NY, USA, 2000; pp. 3–11. [Google Scholar]
- Prasad, M.N.V.; Freitas, H.M.D.O. Metal hyperaccumulation in plants—Biodiversity prospecting for phytoremediation technology. Electron. J. Biotechnol. 2003, 6, 285–321. [Google Scholar] [CrossRef]
- Schnoor, J.; Light, L.A.; McCutcheon, S.C.; Wolfe, N.L.; Carreia, L.H. Phytoremediation of organic and nutrient contaminants. Environ. Sci. Technol. 1995, 29, 318A–323A. [Google Scholar] [CrossRef] [PubMed]
- Mendez, M.O.; Maier, R.M. Phytoremediation of mine tailings in temperate and arid environments. Rev. Environ. Sci. Bio/Technol. 2007, 7, 47–59. [Google Scholar] [CrossRef]
- Teiri, H.; Pourzamani, H.; Hajizadeh, Y. Phytoremediation of VOCs from indoor air by ornamental potted plants: A pilot study using a palm species under the controlled environment. Chemosphere 2018, 197, 375–381. [Google Scholar] [CrossRef] [PubMed]
- Gawrońska, H.; Bakera, B. Phytoremediation of particulate matter from indoor air by Chlorophytum comosum L. plants. Air Qual. Atmos. Health 2014, 8, 265–272. [Google Scholar] [CrossRef] [PubMed] [Green Version]
- Soreanu, G.; Dixon, M.; Darlington, A. Botanical biofiltration of indoor gaseous pollutants—A mini-review. Chem. Eng. J. 2013, 229, 585–594. [Google Scholar] [CrossRef]
- Aydogan, A.; Montoya, L.D. Formaldehyde removal by common indoor plant species and various growing media. Atmos. Environ. 2011, 45, 2675–2682. [Google Scholar] [CrossRef]
- Su, Y.; Liang, Y. Foliar uptake and translocation of formaldehyde with Bracket plants (Chlorophytum comosum). J. Hazard. Mater. 2015, 291, 120–128. [Google Scholar] [CrossRef]
- Lee, J.H. An overview of phytoremediation as a potentially promising technology for environmental pollution control. Biotechnol. Bioprocess. Eng. 2013, 18, 431–439. [Google Scholar] [CrossRef]
- Kvesitadze, E.; Sadunishvili, T.; Kvesitadze, G. Mechanisms of organic contaminants uptake and degradation in plants. World Acad. Sci. Eng. Technol. 2009, 55, 458–468. [Google Scholar]
- Pettit, T.; Irga, P.J.; Torpy, F.R. The in situ pilot-scale phytoremediation of airborne VOCs and particulate matter with an active green wall. Air Qual. Atmos. Health 2018, 12, 33–44. [Google Scholar] [CrossRef]
- Wang, Z.; Pei, J.; Zhang, J.S. Experimental investigation of the formaldehyde removal mechanismsin a dynamic botanical filtration system for indoor air purification. Hazard. Mater. 2014, 280, 235–243. [Google Scholar] [CrossRef] [PubMed]
- Wang, Y.; Groot, F.B.; Wörtche, H. Effect of ecosystem services provided by urban green infrastructure on indoor environment: A literature review. Build. Environ. 2014, 77, 88–100. [Google Scholar] [CrossRef]
- Llewellyn, D.; Dixon, M. Can Plants Really Improve Indoor Air Quality? Reference Module in Life Sciences. In Comprehensive Biotechnology, 2nd ed.; Elsevier: Amsterdam, The Netherlands, 2011; Volume 4, pp. 331–337. [Google Scholar]
- Wolverton, B.C.; Johnson, A.; Bounds, K. Interior Landscape Plants for Indoor Air Pollution Abatement; NASA Stennis Space Centre: Hancock, MS, USA, 1989.
- Bondarevs, A.; Huss, P.; Gong, S.; Weister, O.; Liljedahl, R. Green Walls Utilizing Internet of Things. Sens. Transduct. 2015, 192, 16–21. [Google Scholar]
- Treesubsuntorn, C.; Thiravetyan, P. Botanical biofilter for indoor toluene removal and reduction of carbon dioxide emission under low light intensity by using mixed C3 and CAM plants. J. Clean. Prod. 2018, 194, 94–100. [Google Scholar] [CrossRef]
- Wang, Z.; Zhang, J.S. Characterization and performance evaluation of a full-scale activated carbon-based dynamic botanical air filtration system for improving indoor air quality. Build. Environ. 2011, 46, 758–768. [Google Scholar] [CrossRef]
- Xu, Z.; Qin, N.; Wang, J.; Tong, H. Formaldehyde biofiltration as affected by spider plant. Bioresour. Technol. 2010, 101, 6930–6934. [Google Scholar] [CrossRef]
- Weidner, M.; Da Silvia, J.A.T. Potential and Limitations of Ornamental Plants for Indoor-Air Purification; Silva, J.A.T.D., Ed.; Floriculture, Ornamental and Plant Biotechnology Advances and Topical Issues; Global Science Books: London, UK, 2006; pp. 54–63. [Google Scholar]
- Liu, Y.J.; Mu, Y.J.; Zhu, Y.G.; Ding, H.; Arens, N.C. Which ornamental plant species effectively remove benzene from indoor air? Atmos. Environ. 2007, 41, 650–654. [Google Scholar] [CrossRef]
- Gong, Y.; Zhou, T.; Wang, P.; Lin, Y.; Zheng, R.; Zhao, Y.; Xu, B. Fundamentals of Ornamental Plants in Removing Benzene in Indoor Air. Atmosphere 2019, 10, 221. [Google Scholar] [CrossRef] [Green Version]
- Yoo, M.H.; Kwon, Y.J.; Son, K.-C.; Kays, S.J. Efficacy of Indoor Plants for the Removal of Single and Mixed Volatile Organic Pollutants and Physiological Effects of the Volatiles on the Plants. J. Am. Soc. Hortic. Sci. 2006, 131, 452–458. [Google Scholar] [CrossRef] [Green Version]
- Yang, D.S.; Pennisi, S.V.; Son, K.-C.; Kays, S.J. Screening Indoor Plants for Volatile Organic Pollutant Removal Efficiency. HortScience 2009, 44, 1377–1381. [Google Scholar] [CrossRef]
- Treesubsuntorn, C.; Thiravetyan, P. Removal of benzene from indoor air by Dracaena sanderiana: Effect of wax and stomata. Atmos. Environ. 2012, 57, 317–321. [Google Scholar] [CrossRef]
- Sriprapat, W.; Thiravetyan, P. Phytoremediation of BTEX from Indoor Air by Zamioculcas zamiifolia. Water Air Soil Pollut. 2013, 224, 1–9. [Google Scholar] [CrossRef]
- Kim, K.J.; Kim, H.J.; Khalekuzzaman, M.; Yoo, E.H.; Jung, H.H.; Jang, H.S. Removal ratio of gaseous toluene and xylene transported from air to root zone via the stem by indoor plants. Environ. Sci. Pollut. Res. 2016, 23, 6149–6158. [Google Scholar] [CrossRef] [PubMed] [Green Version]
- Orwell, R.L.; Wood, R.L.; Tarran, J.; Torpy, F.; Burchett, M.D. Removal of Benzene by the Indoor Plant/Substrate Microcosm and Implications for Air Quality. Water Air Soil Pollut. 2004, 157, 193–207. [Google Scholar] [CrossRef]
- Tarran, J.; Torpy, F.; Burchett, M. Use of living pot-plants to cleanse indoor air—Research review. In Proceedings of the 6th International Conferece on Indoor Air Quality, Ventilation & Energy Conservation, Sustainable Built Environment, Sendai, Japan, 28–31 October 2007; pp. 249–256. [Google Scholar]
- Jen, M.S.; Hoylman, A.M.; Edwards, N.T.; Walton, B.T. Experimental method to measure gaseous uptake of 14C-toluene by foliage. Environ. Exp. Bot. 1995, 35, 389–398. [Google Scholar] [CrossRef]
- Caron, A.; Redon, N.; Thevenet, F.; Hanoune, B.; Coddeville, P. Performances and limitations of electronic gas sensors to investigate an indoor air quality event. Build. Environ. 2016, 107, 19–28. [Google Scholar] [CrossRef]
- Wood, R.A.; Burchett, M.D.; Alquezar, R.; Orwell, R.L.; Tarran, J.; Torpy, F. The Potted-Plant Microcosm Substantially Reduces Indoor Air VOC Pollution: I. Office Field-Study. Water Air Soil Pollut. 2006, 175, 163–180. [Google Scholar] [CrossRef]
- Gupta, G.P.; Kulshrestha, U. Biomonitoring and Remediation by Plants. Plant. Responses Air Pollut. 2016, 119–132. [Google Scholar] [CrossRef]
- Li, Z.; Wen, Q.; Zhang, R. Sources, health effects and control strategies of indoor fine particulate matter (PM 2.5): A review. Sci. Total Environ. 2017, 586, 610–622. [Google Scholar] [CrossRef] [PubMed]
- Shaneyfelt, K.M.; Anderson, A.R.; Kumar, P.; Hunt, W.F. Air quality considerations for stormwater green street design. Environ. Pollut. 2017, 231, 768–778. [Google Scholar] [CrossRef]
- Tomašević, M.; Anicic, M. Trace element content in urban tree leaves and SEM-EDAX characterization of deposited particles. Facta Univ. Ser. Phys. Chem. Technol. 2010, 8, 1–13. [Google Scholar] [CrossRef]
- Ram, S.S.; Majumder, S.; Chaudhuri, P.; Chanda, S.; Santra, S.C.; Chakraborty, A.; Sudarshan, M. A Review on Air Pollution Monitoring and Management Using Plants with Special Reference to Foliar Dust Adsorption and Physiological Stress Responses. Crit. Rev. Environ. Sci. Technol. 2015, 45, 2489–2522. [Google Scholar] [CrossRef]
- Barwise, Y.; Kumar, P. Designing vegetation barriers for urban air pollution abatement: A practical review for appropriate plant species selection. NPJ Clim. Atmos. Sci. 2020, 3, 1–19. [Google Scholar] [CrossRef] [Green Version]
- Abbass, O.A.; Sailor, D.J.; Gall, E.T. Effectiveness of indoor plants for passive removal of indoor ozone. Build. Environ. 2017, 119, 62–70. [Google Scholar] [CrossRef]
- Cruz, M.D.; Müller, R.; Svensmark, B.; Pedersen, J.S.; Christensen, J.H. Assessment of volatile organic compound removal by indoor plants—A novel experimental setup. Environ. Sci. Pollut. Res. 2014, 21, 7838–7846. [Google Scholar] [CrossRef] [PubMed]
- Oh, G.; Jung, G.J.; Seo, M.H.; Im, Y.B. Experimental study on variations of CO2 concentration in the presence of in door plants and respiration of experimental animals. Environ. Biotechnol. 2011, 52, 321–329. [Google Scholar]
- Pennisi, S.V.; van Iersel, M.W. Quantification of carbon assimilation of plants in simulated and in situ interiorscapes. HortScience 2012, 47, 468–476. [Google Scholar] [CrossRef] [Green Version]
- Kumar, P.; Morawska, L. Energy-Pollution Nexus for Urban Buildings. Environ. Sci. Technol. 2013, 47, 7591–7592. [Google Scholar] [CrossRef] [Green Version]
- Zhang, Y.; Kacira, M.; An, L. A CFD study on improving air flow uniformity in indoor plant factory system. Biosyst. Eng. 2016, 147, 193–205. [Google Scholar] [CrossRef]
- Pichatwatana, K.; Wang, F.; Roaf, S.; Anunnathapong, M. An integrative approach for indoor environment quality assessment of large glazed air-conditioned airport terminal in the tropics. Energy Build. 2017, 148, 37–55. [Google Scholar] [CrossRef]
- Tudiwer, D.; Korjenic, A. The effect of an indoor living wall system on humidity, mould spores and CO 2 -concentration. Energy Build. 2017, 146, 73–86. [Google Scholar] [CrossRef]
- D’Alessandro, F.; Asdrubali, F.; Mencarelli, N. Experimental evaluation and modelling of the sound absorption properties of plants for indoor acoustic applications. Build. Environ. 2015, 94, 913–923. [Google Scholar] [CrossRef]
- Collins, R.; Schaafsma, M.; Hudson, M.D. The value of green walls to urban biodiversity. Land Use Policy 2017, 64, 114–123. [Google Scholar] [CrossRef]
- Coombs, K.C.; Chew, G.L.; Schaffer, C.; Ryan, P.H.; Brokamp, C.; Grinshpun, S.A.; Adamkiewicz, G.; Chillrud, S.; Hedman, C.; Colton, M.; et al. Indoor air quality in green-renovated vs. non-green low-income homes of children living in a temperate region of US (Ohio). Sci. Total Environ. 2016, 554–555, 178–185. [Google Scholar] [CrossRef] [Green Version]
- Poddar, S.; Park, D.Y.; Chang, S. Simulation Based Analysis on the Energy Conservation Effect of Green Wall Installation for Different Building Types in a Campus. Energy Procedia 2017, 111, 226–234. [Google Scholar] [CrossRef]
- Koyama, T.; Yoshinaga, M.; Maeda, K.-I.; Yamauchi, A. Transpiration cooling effect of climber greenwall with an air gap on indoor thermal environment. Ecol. Eng. 2015, 83, 343–353. [Google Scholar] [CrossRef]
- Torpy, F.; Zavattaro, M.; Irga, P. Green wall technology for the phytoremediation of indoor air: A system for the reduction of high CO2 concentrations. Air Qual. Atmos. Health 2016, 10, 575–585. [Google Scholar] [CrossRef]
Figure 1.
Relations between outdoor and indoor air pollution and health effects [30].
Figure 1.
Relations between outdoor and indoor air pollution and health effects [30].

Figure 2.
(a) Passive and (b) active living wall or biofiltration system; adapted from [109].
Figure 2.
(a) Passive and (b) active living wall or biofiltration system; adapted from [109].

Figure 3.
Formaldehyde concentration versus time. A—fan off. B—fan with airflow of 28.8 m3/h. C—fan with airflow of 82.8 m3/h, dehumidifier is off; vertical lines are the boundaries of lights on and off [137].
Figure 3.
Formaldehyde concentration versus time. A—fan off. B—fan with airflow of 28.8 m3/h. C—fan with airflow of 82.8 m3/h, dehumidifier is off; vertical lines are the boundaries of lights on and off [137].

Figure 4.
Dynamic botanical air filtration (DBAF) system: (a) schematics; (b) photo of the prototype [133].
Figure 4.
Dynamic botanical air filtration (DBAF) system: (a) schematics; (b) photo of the prototype [133].

Figure 5.
Formaldehyde removed by a static potted plant, formaldehyde concentration 10 ppm [133].
Figure 5.
Formaldehyde removed by a static potted plant, formaldehyde concentration 10 ppm [133].

Figure 6.
Comparison of benzene removal rate for eight plant species [8].
Figure 6.
Comparison of benzene removal rate for eight plant species [8].

Figure 7.
PM1.0 concentration reduction vs time. A: fan with airflow 82.8 m3/h speed 5 B: fan with airflow 28.8 m3/h C: fan off adopted from [137].
Figure 7.
PM1.0 concentration reduction vs time. A: fan with airflow 82.8 m3/h speed 5 B: fan with airflow 28.8 m3/h C: fan off adopted from [137].


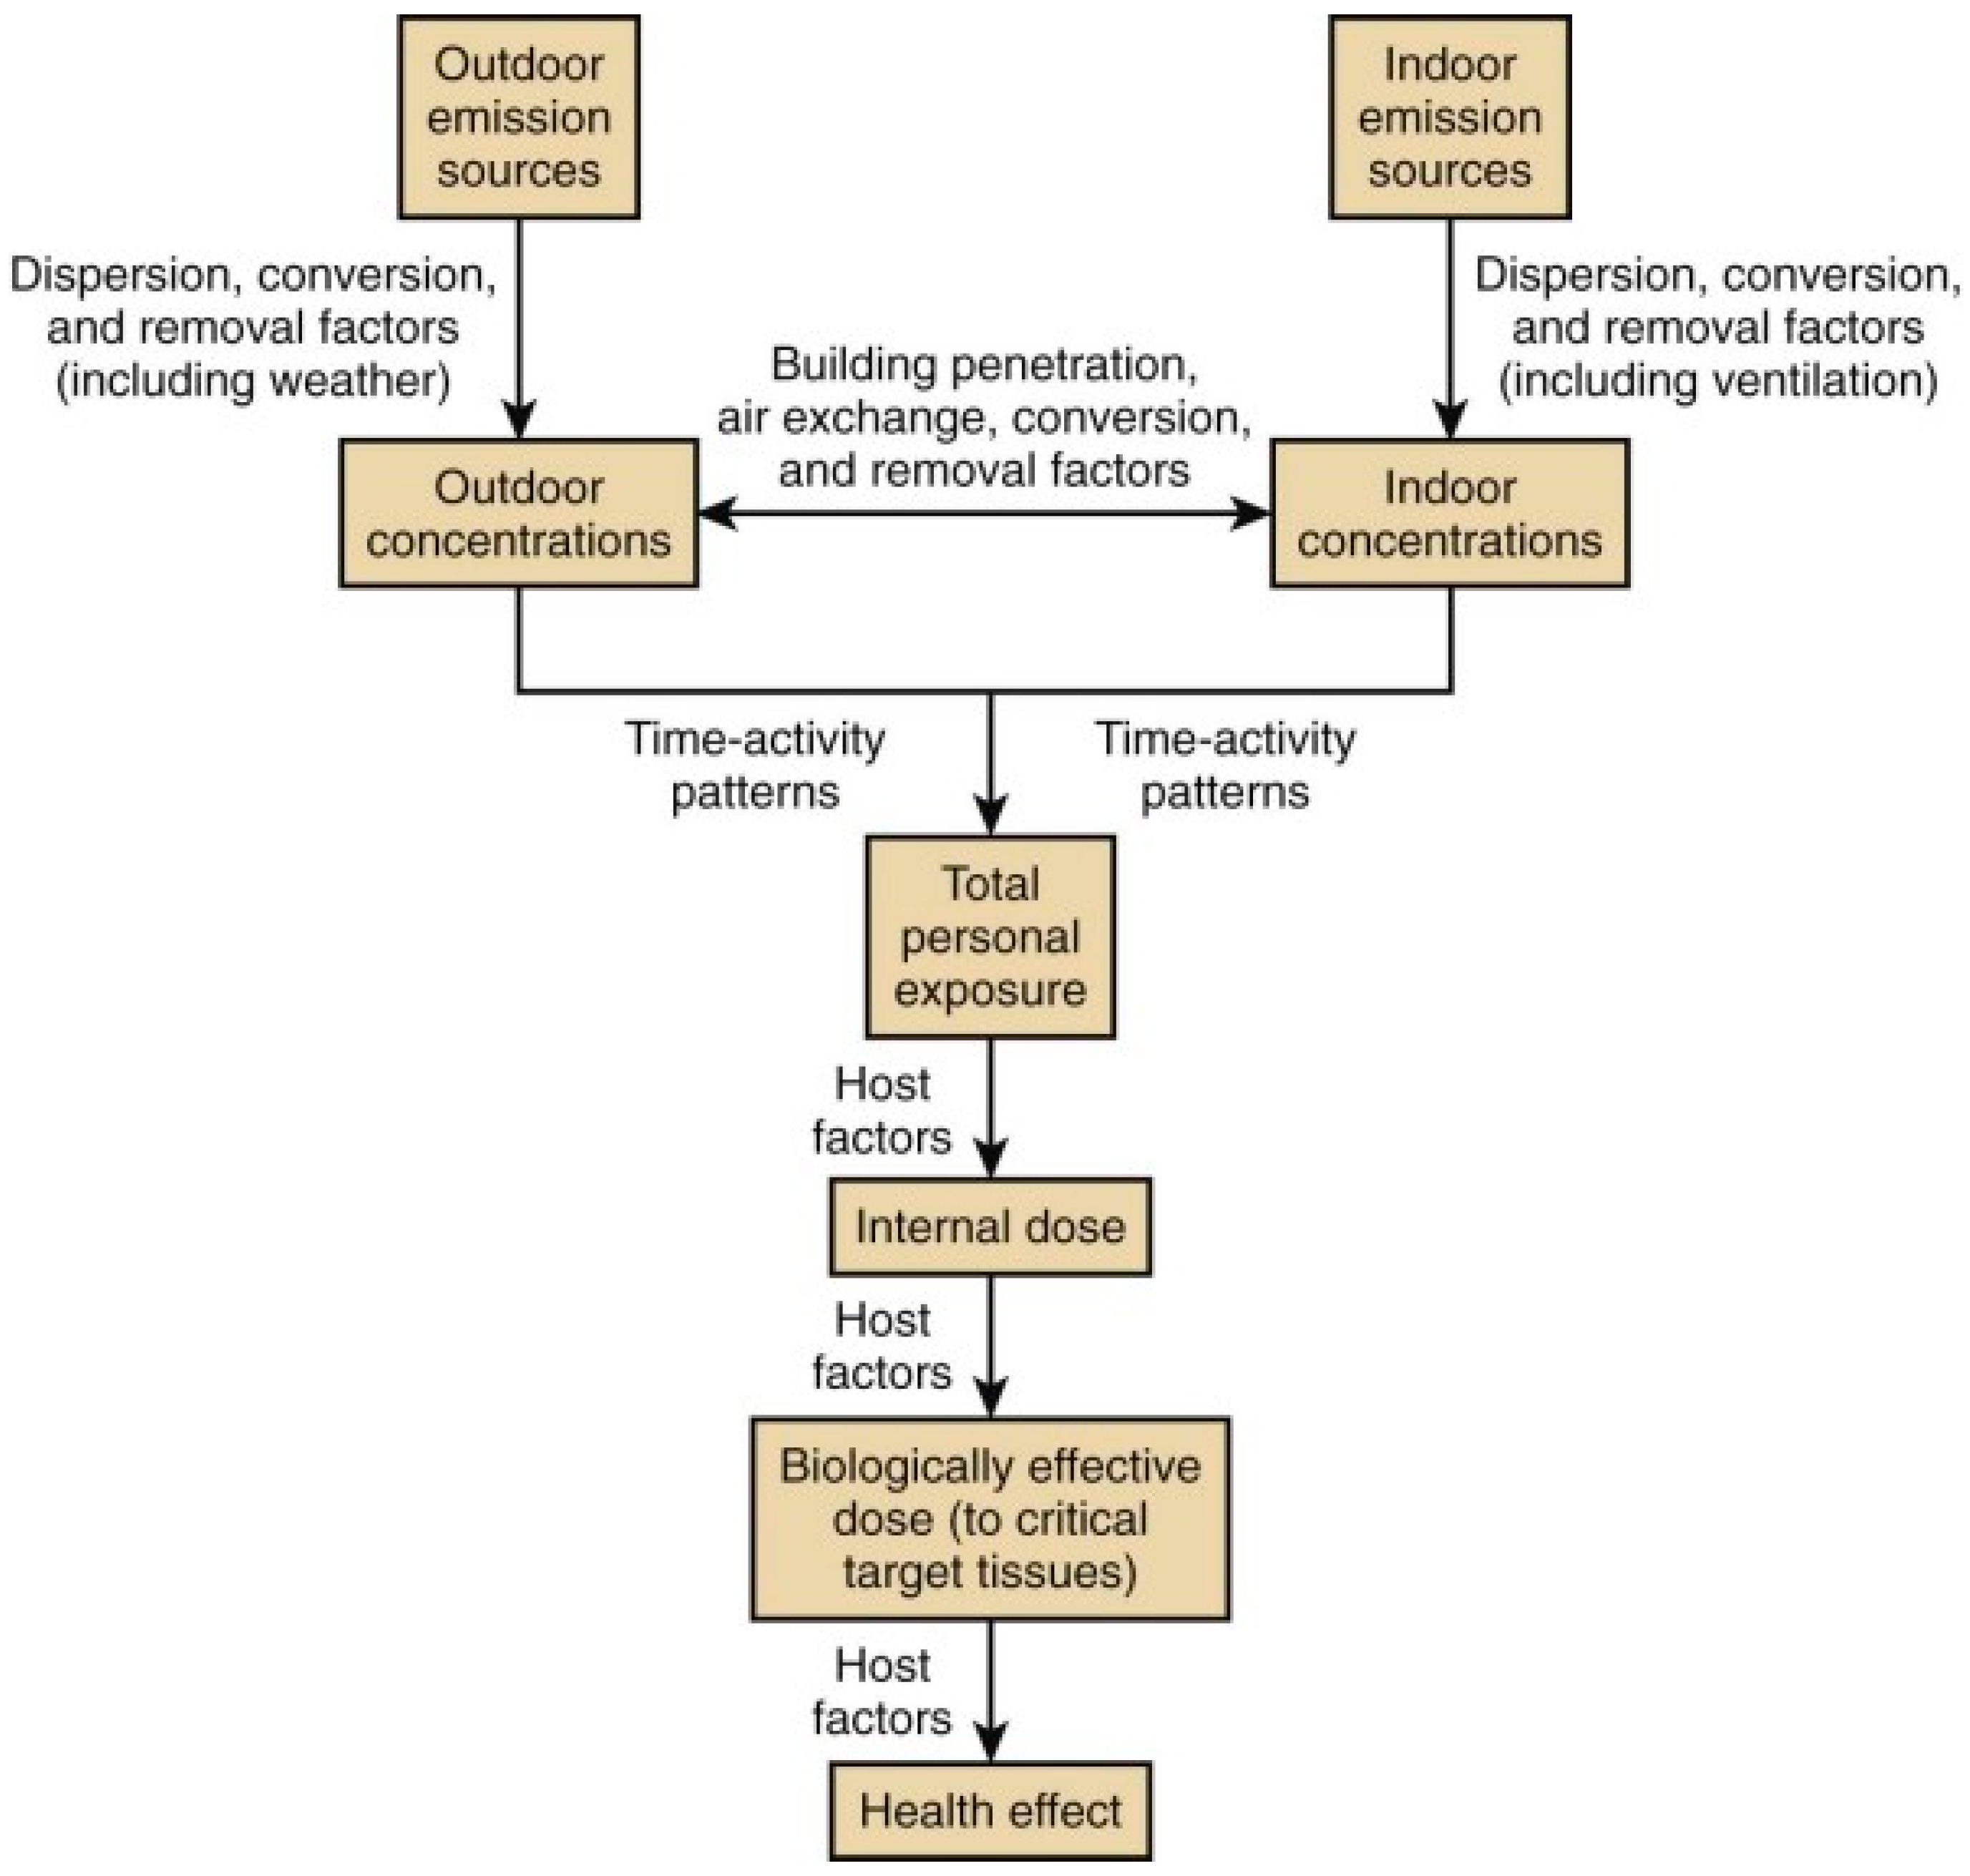
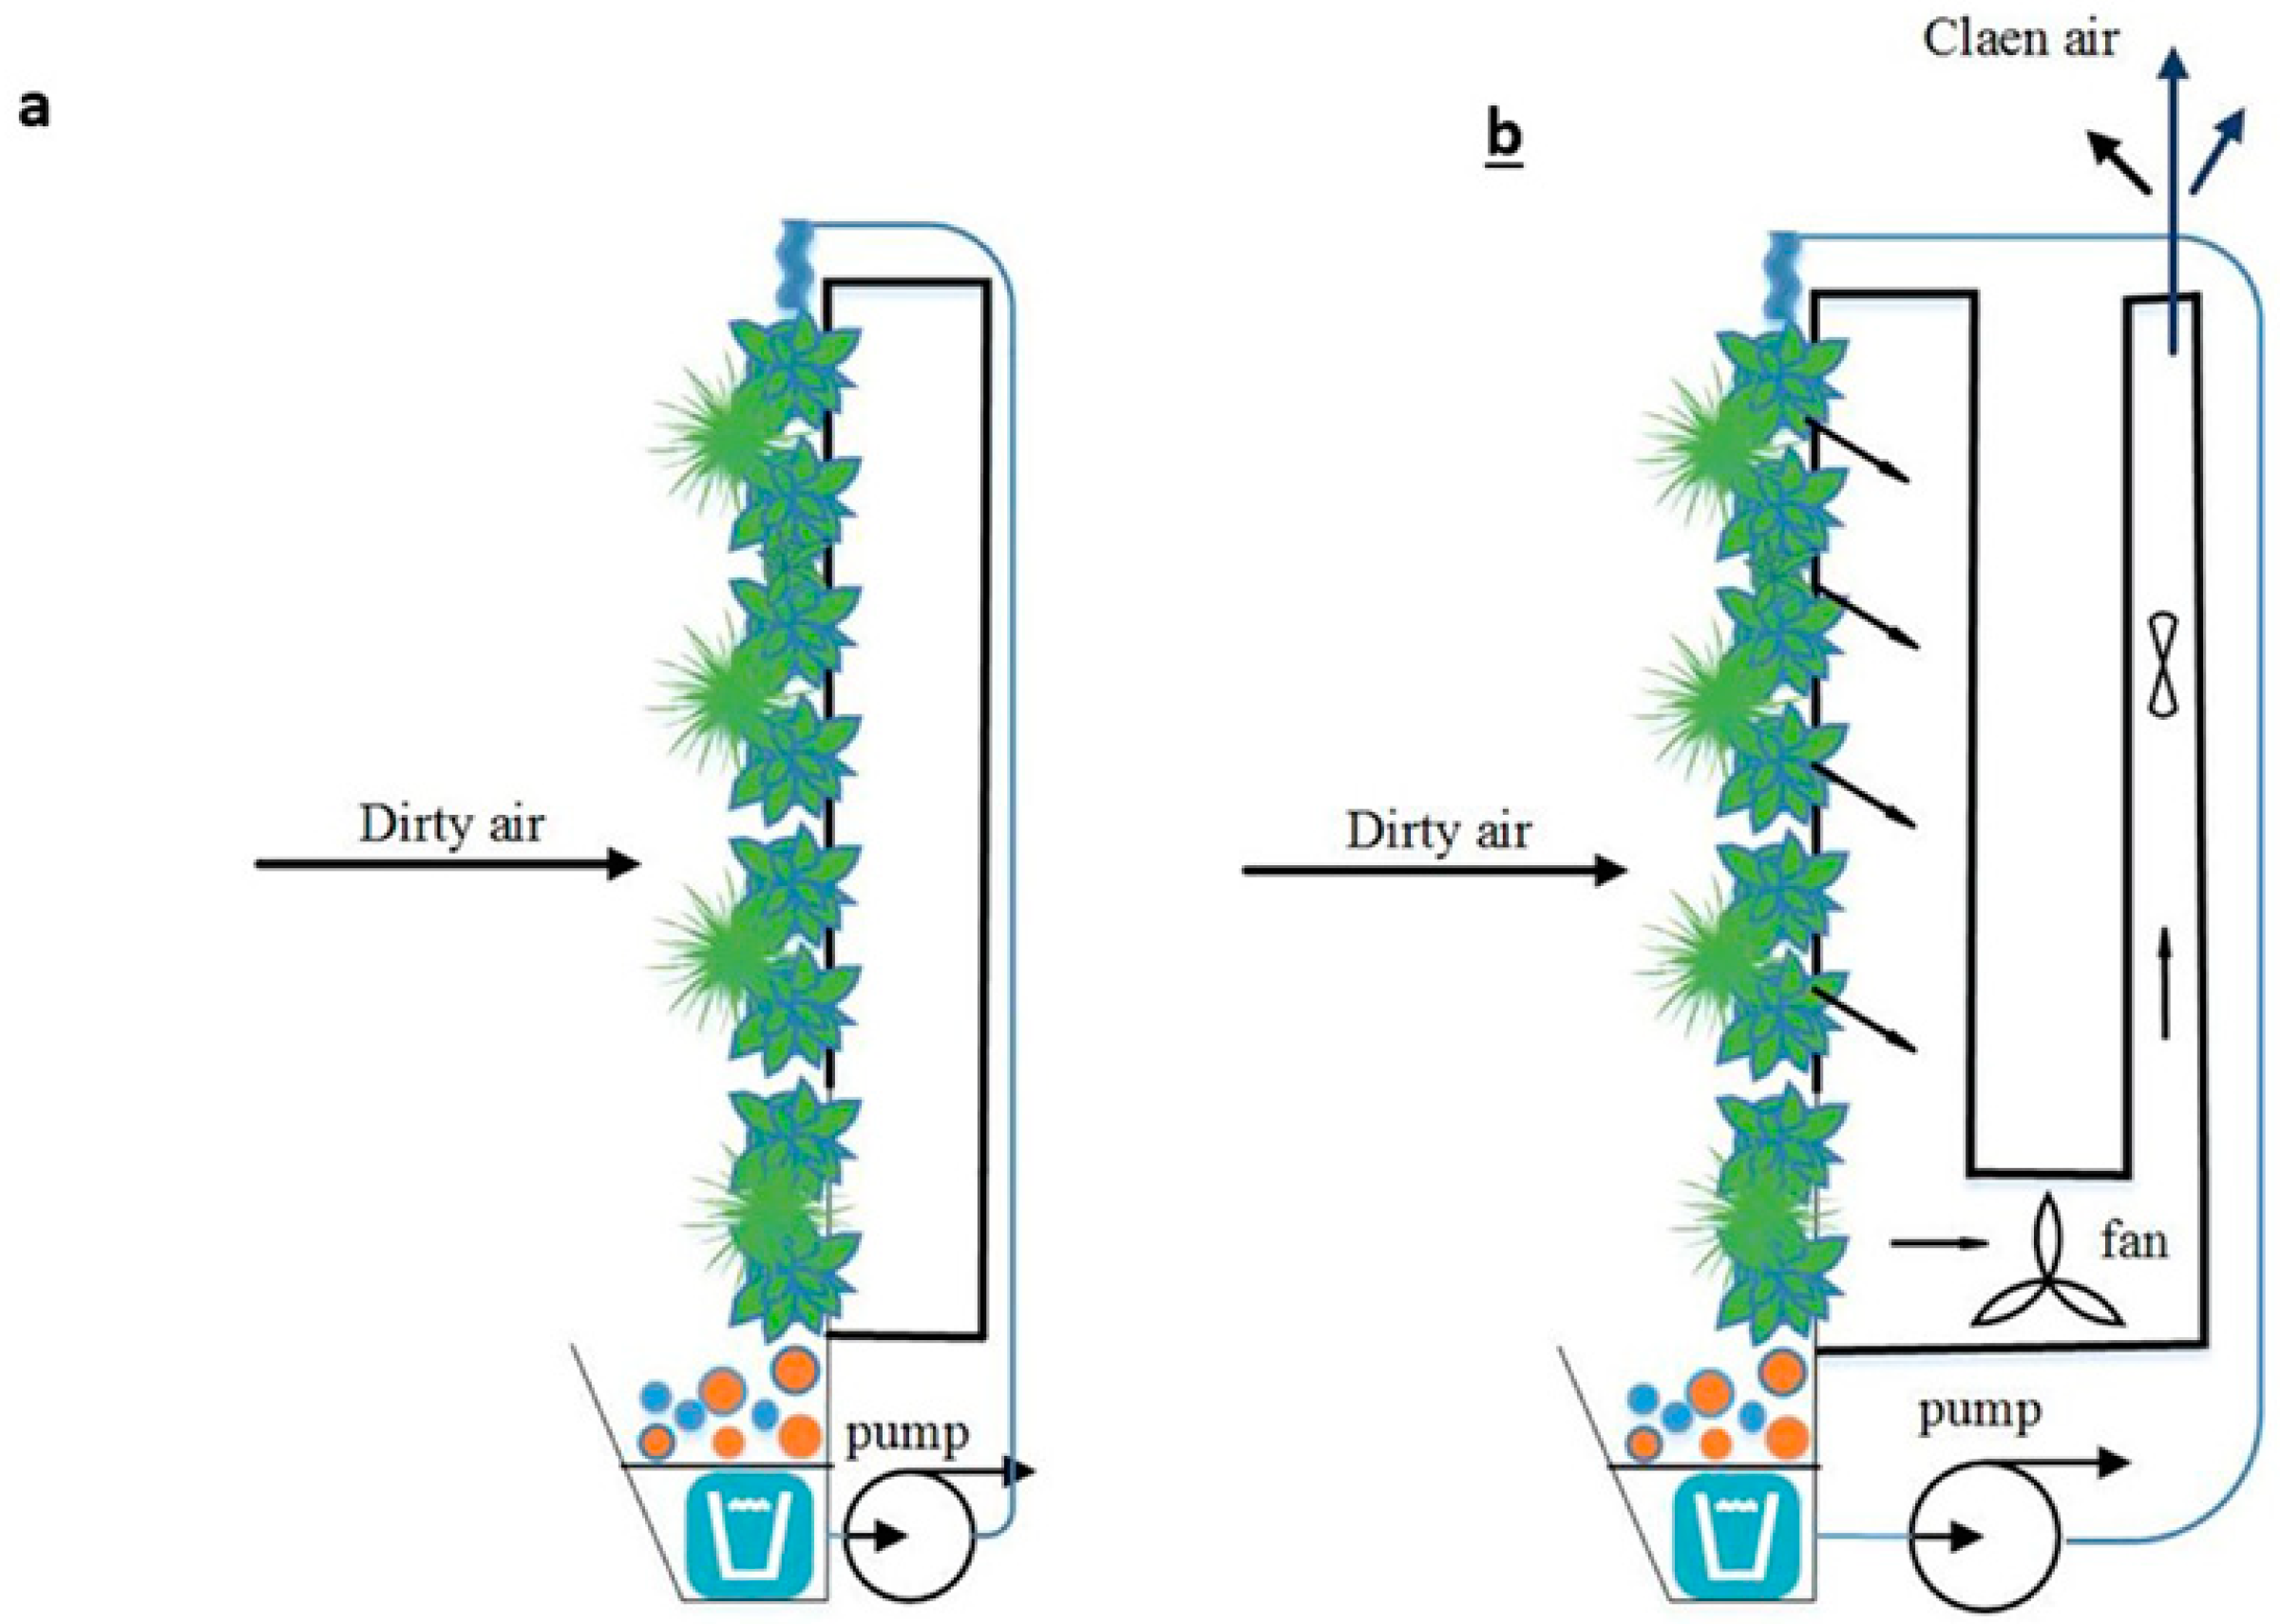
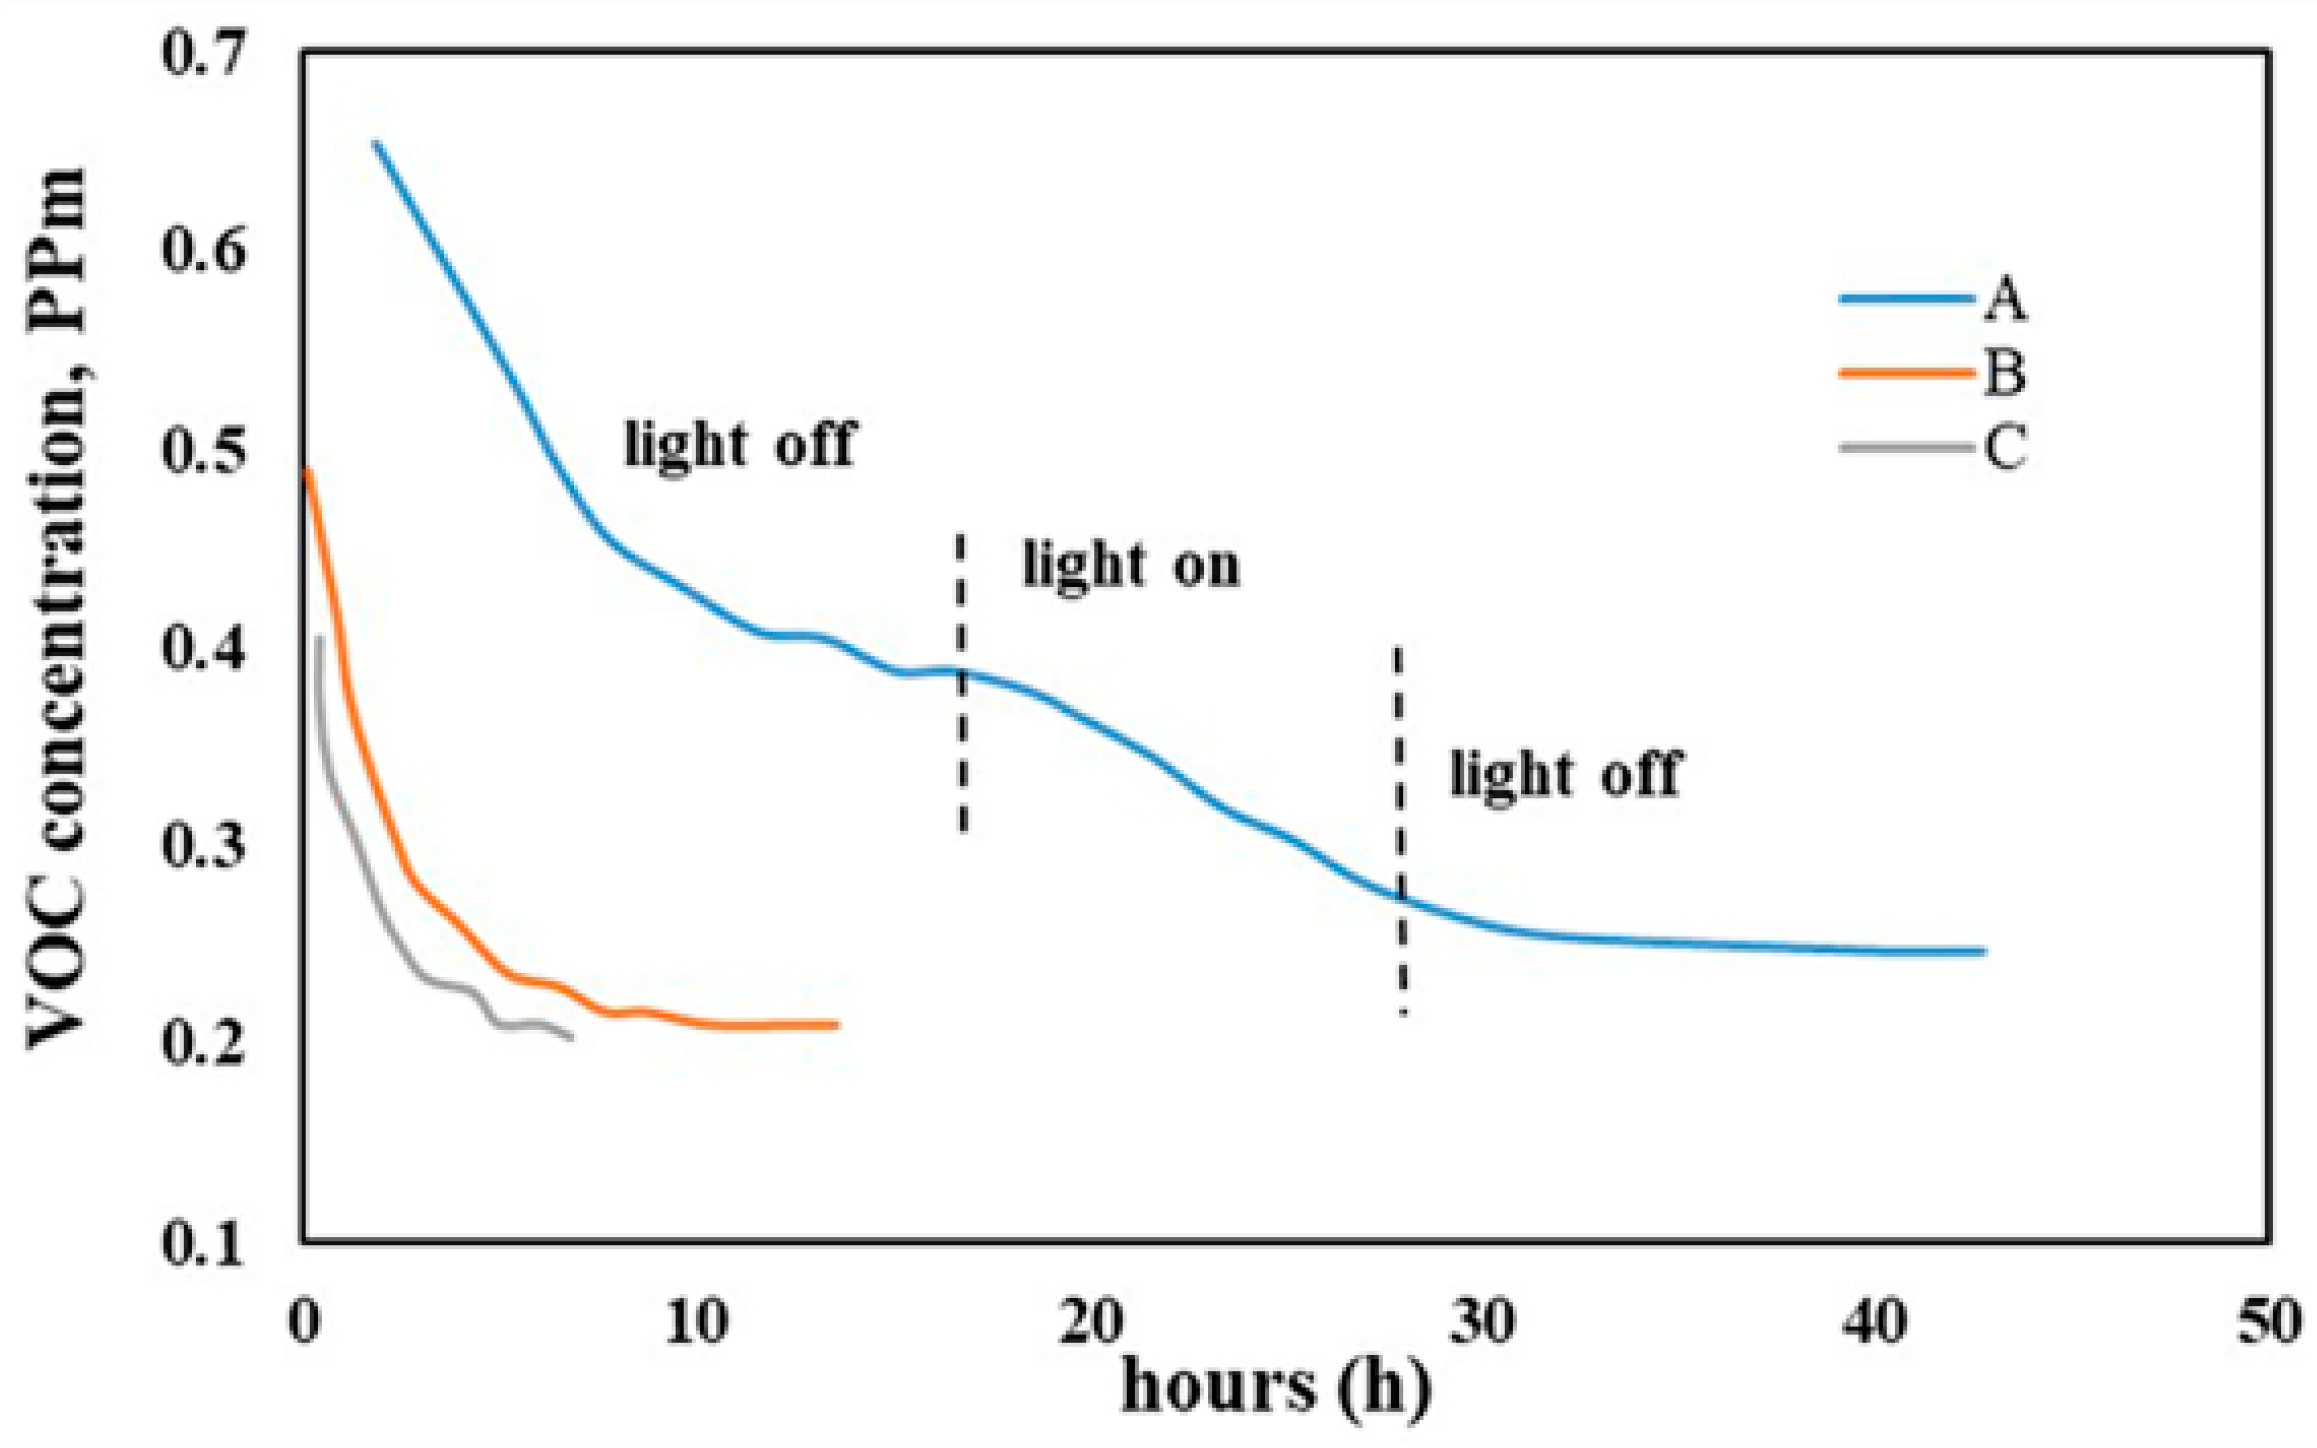
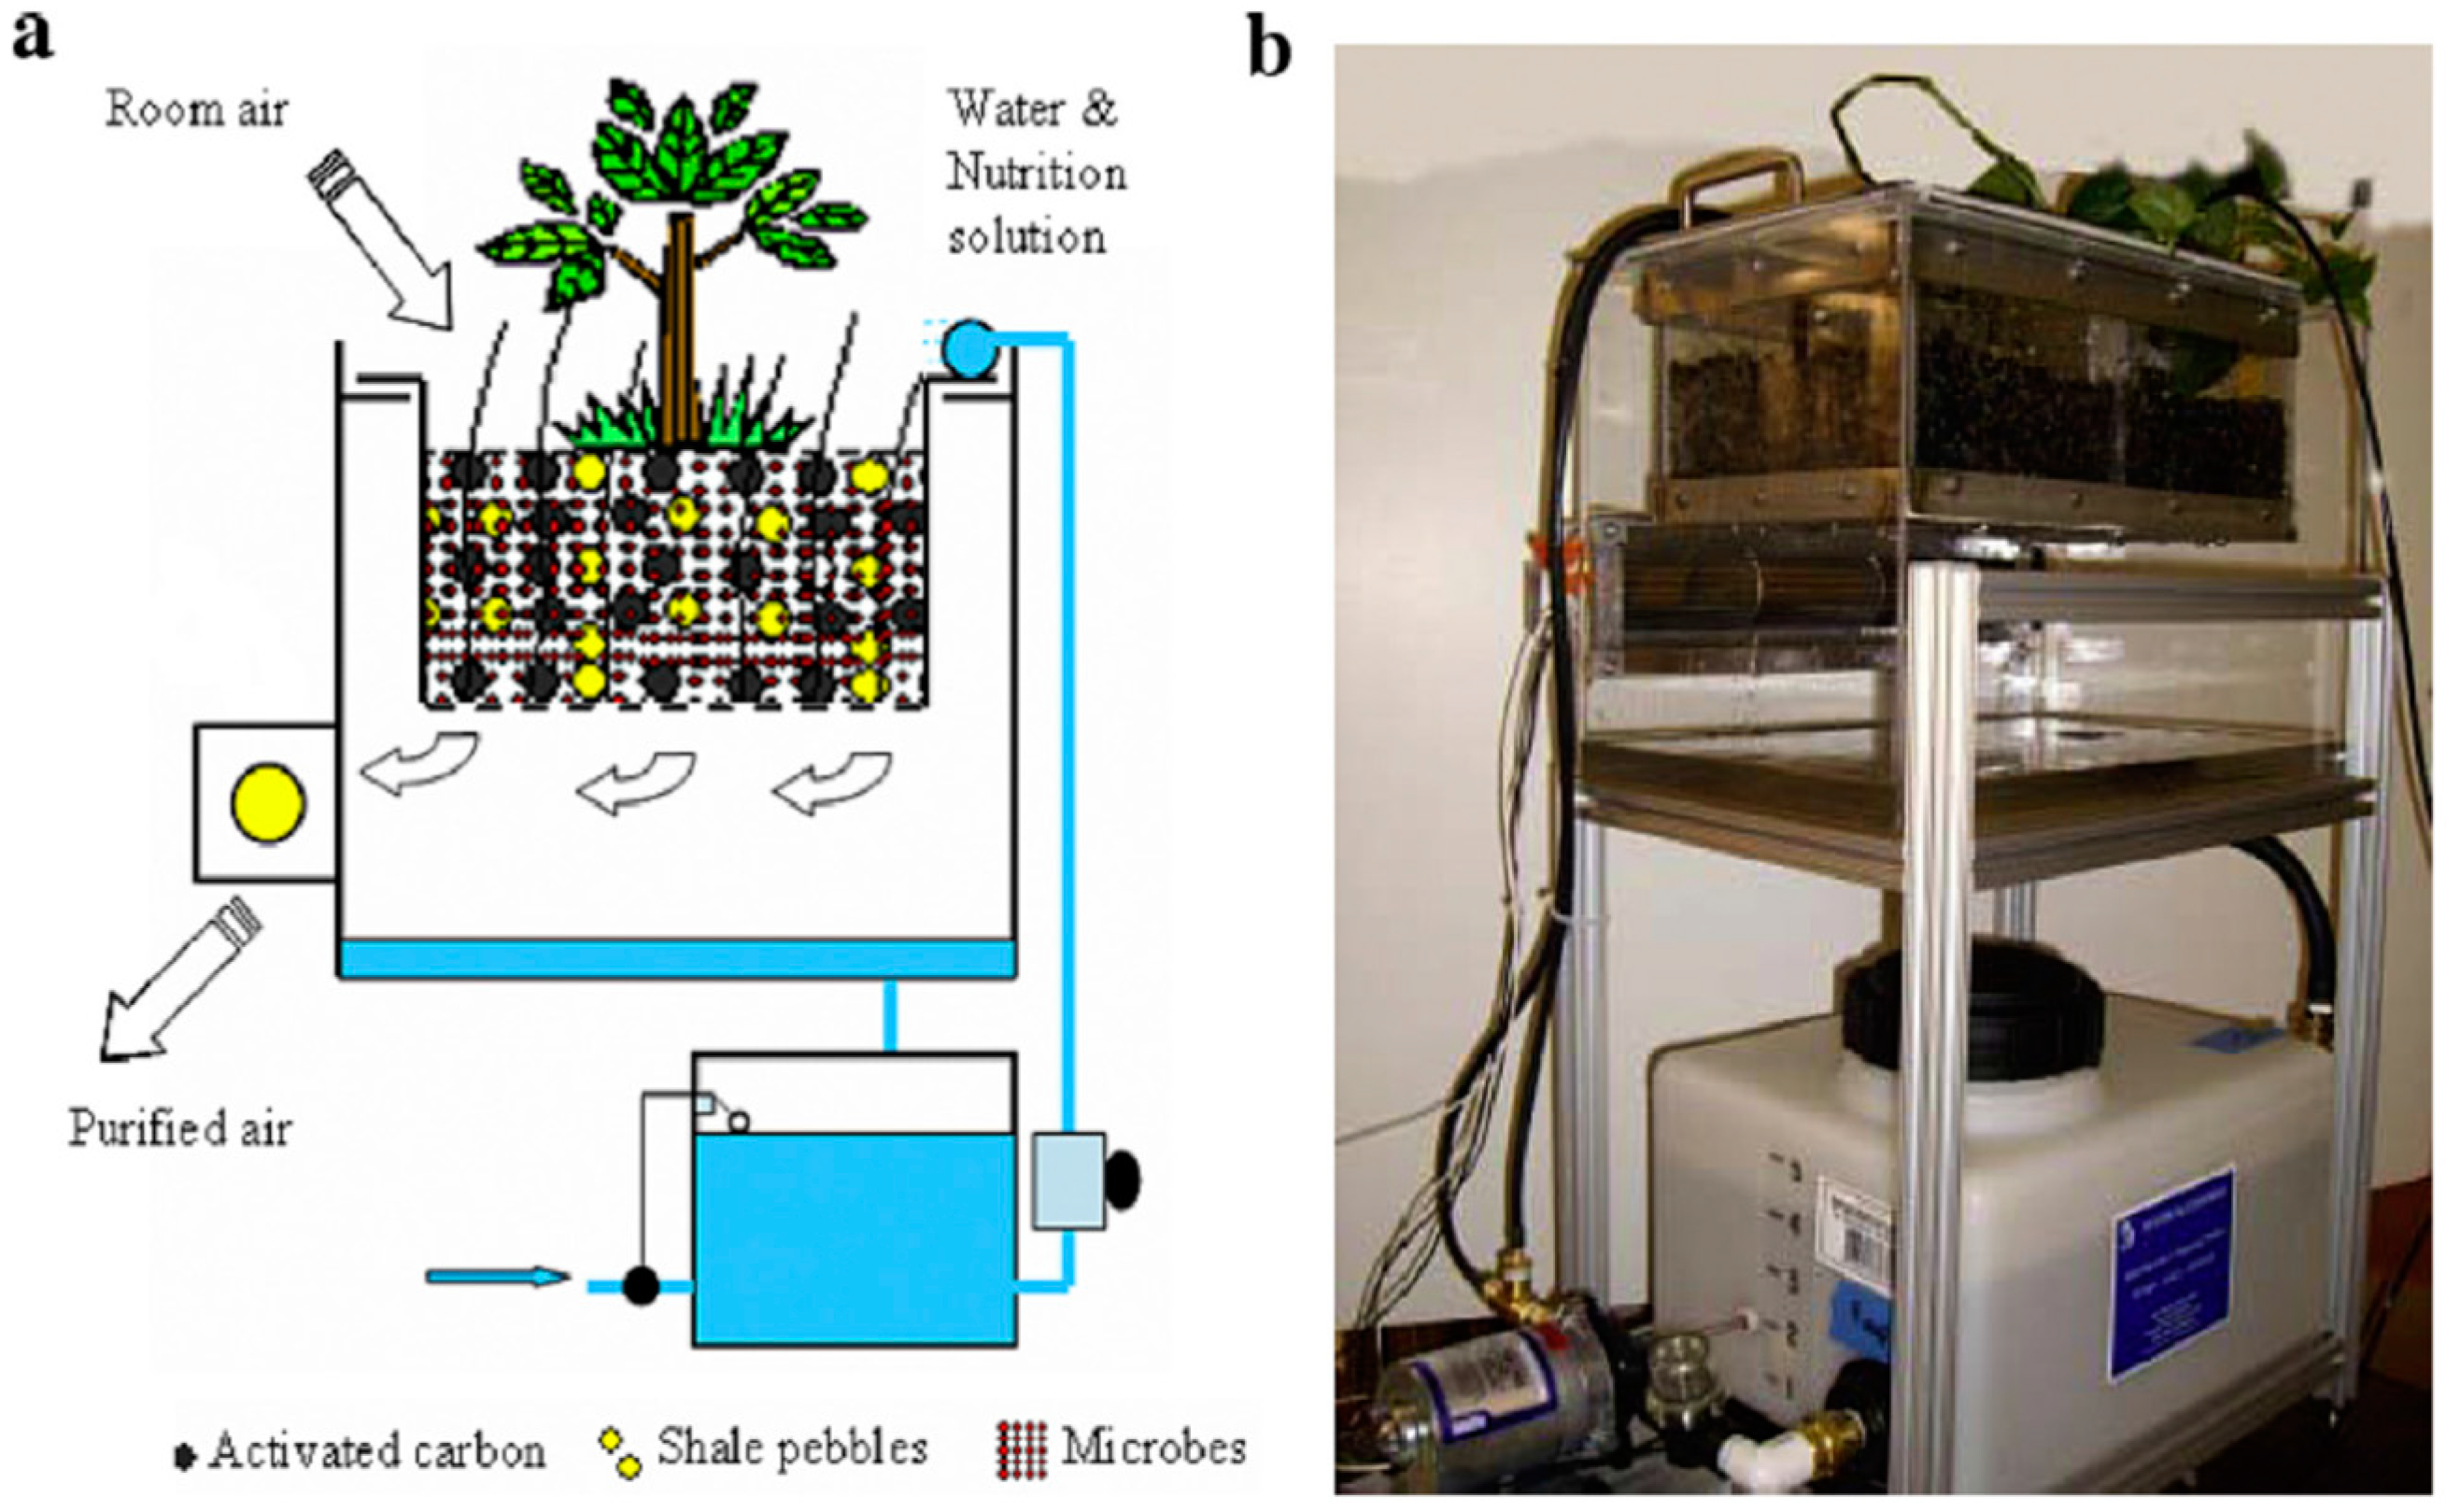
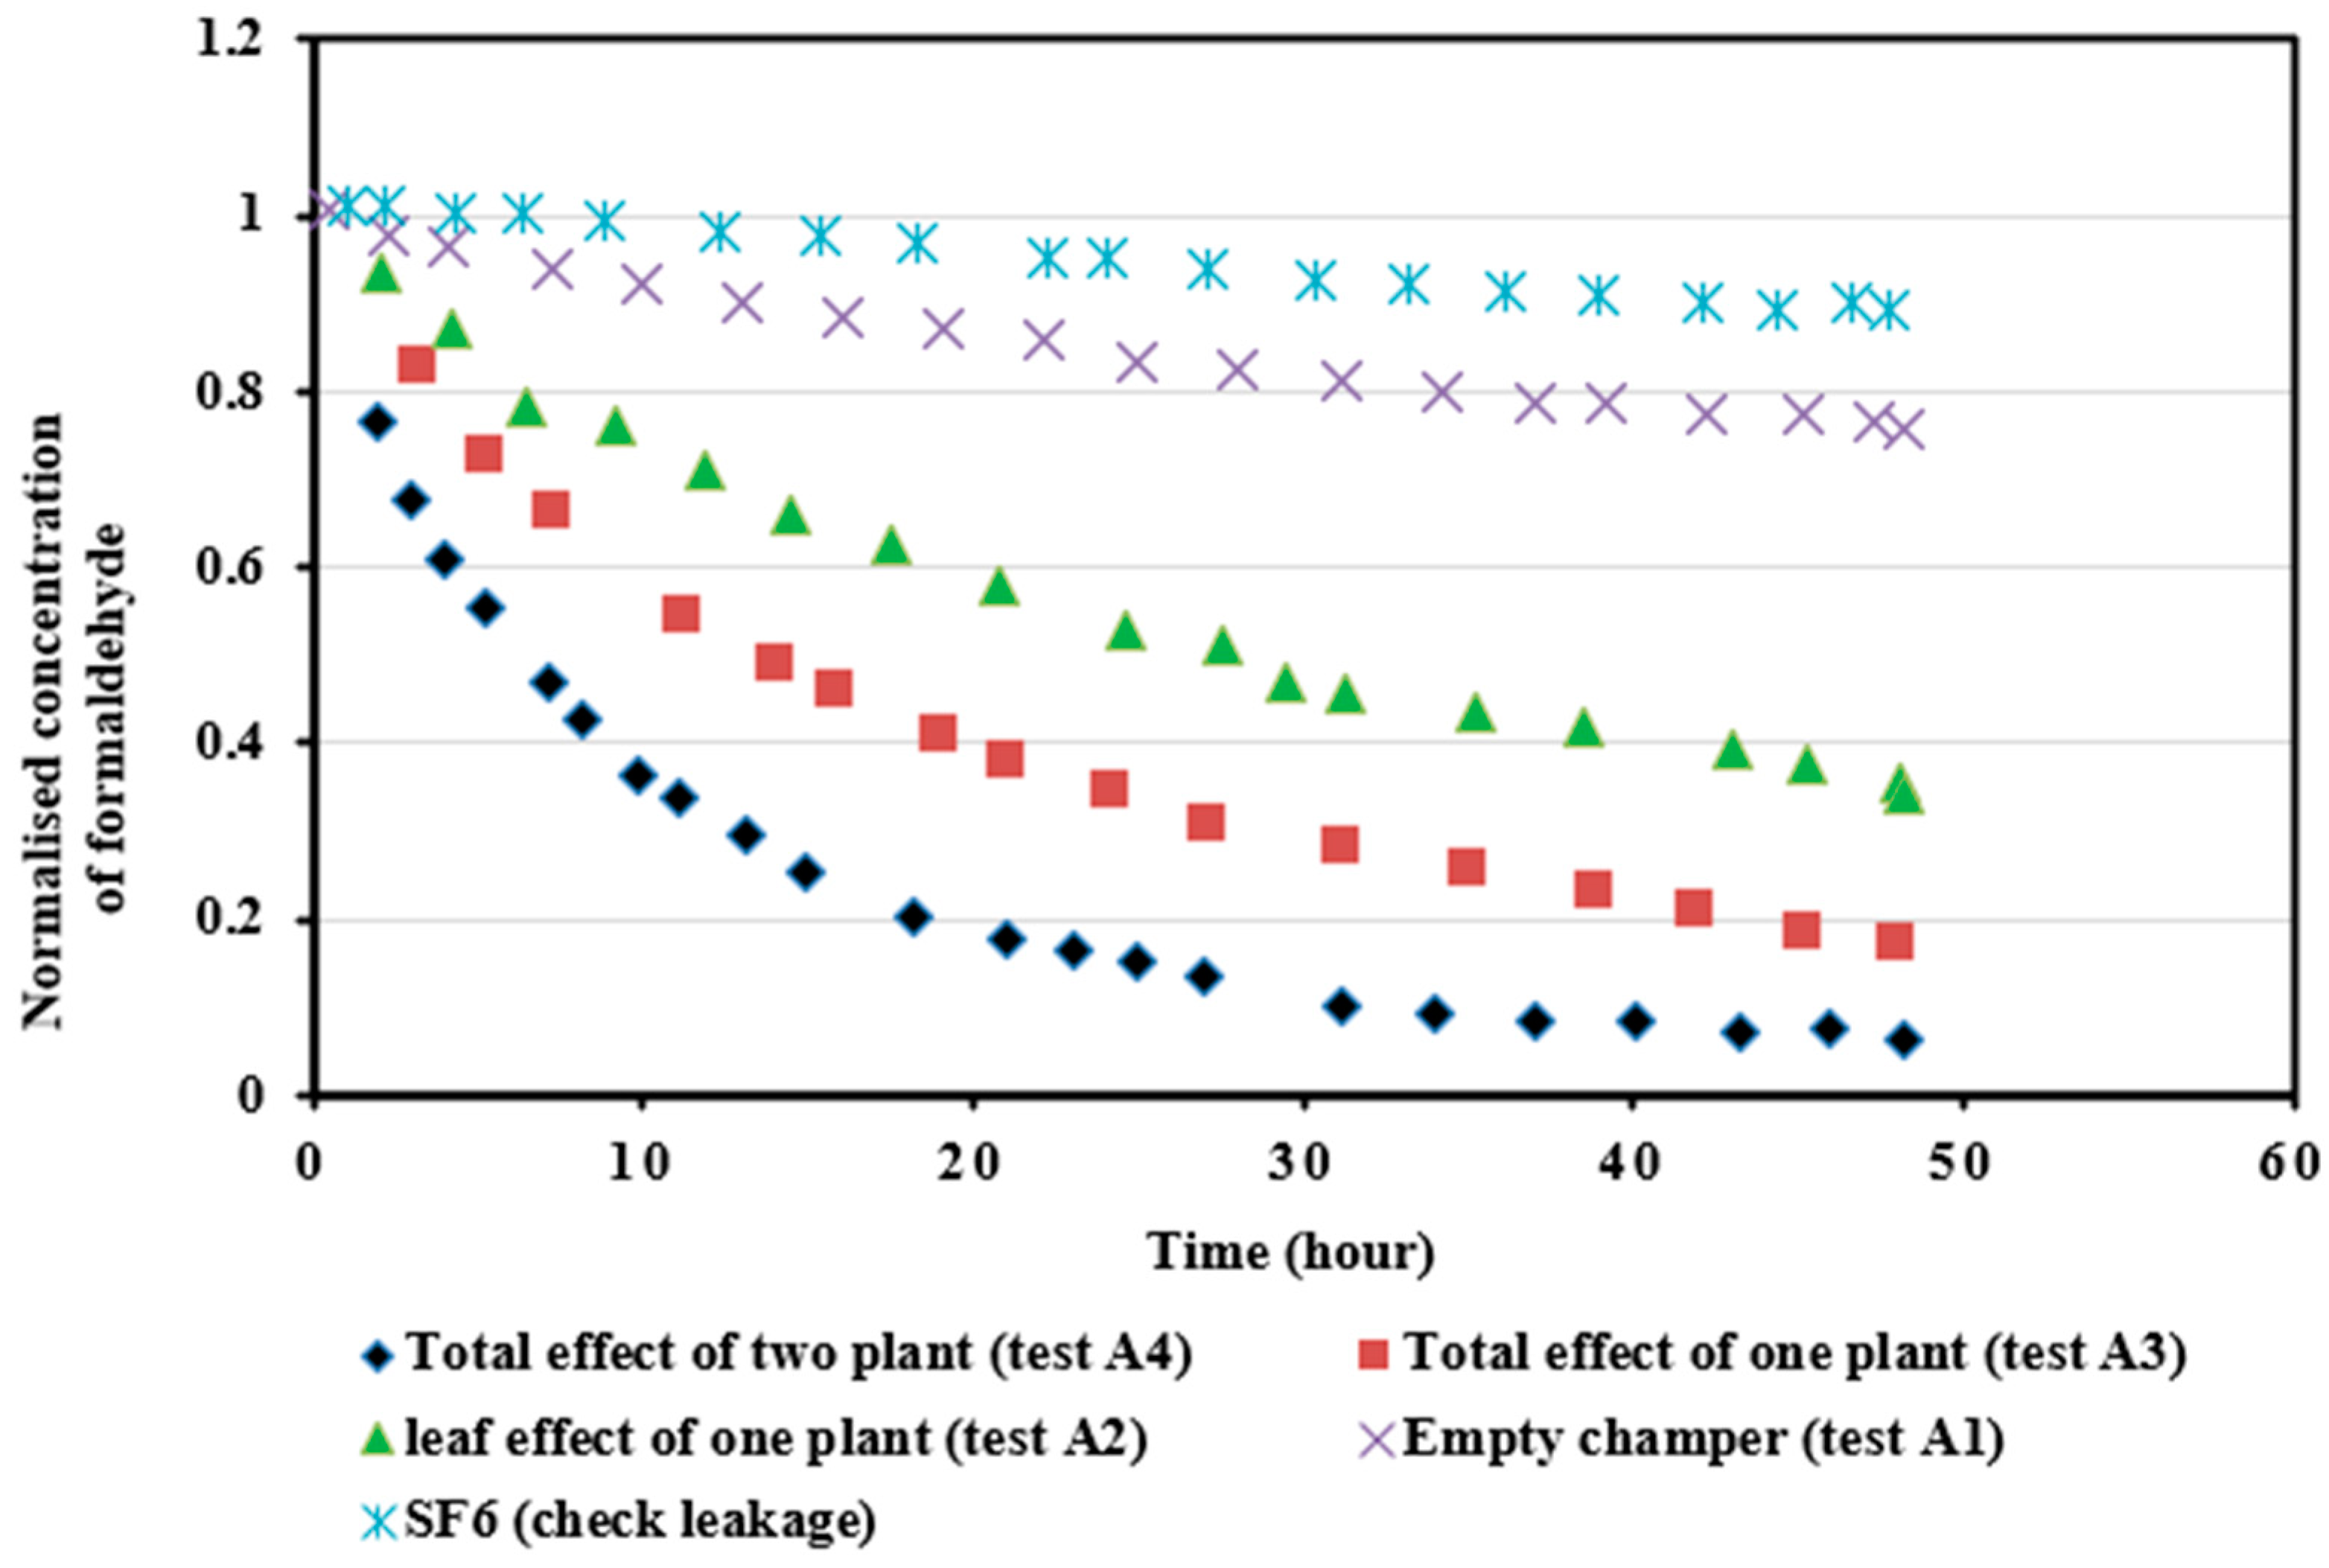
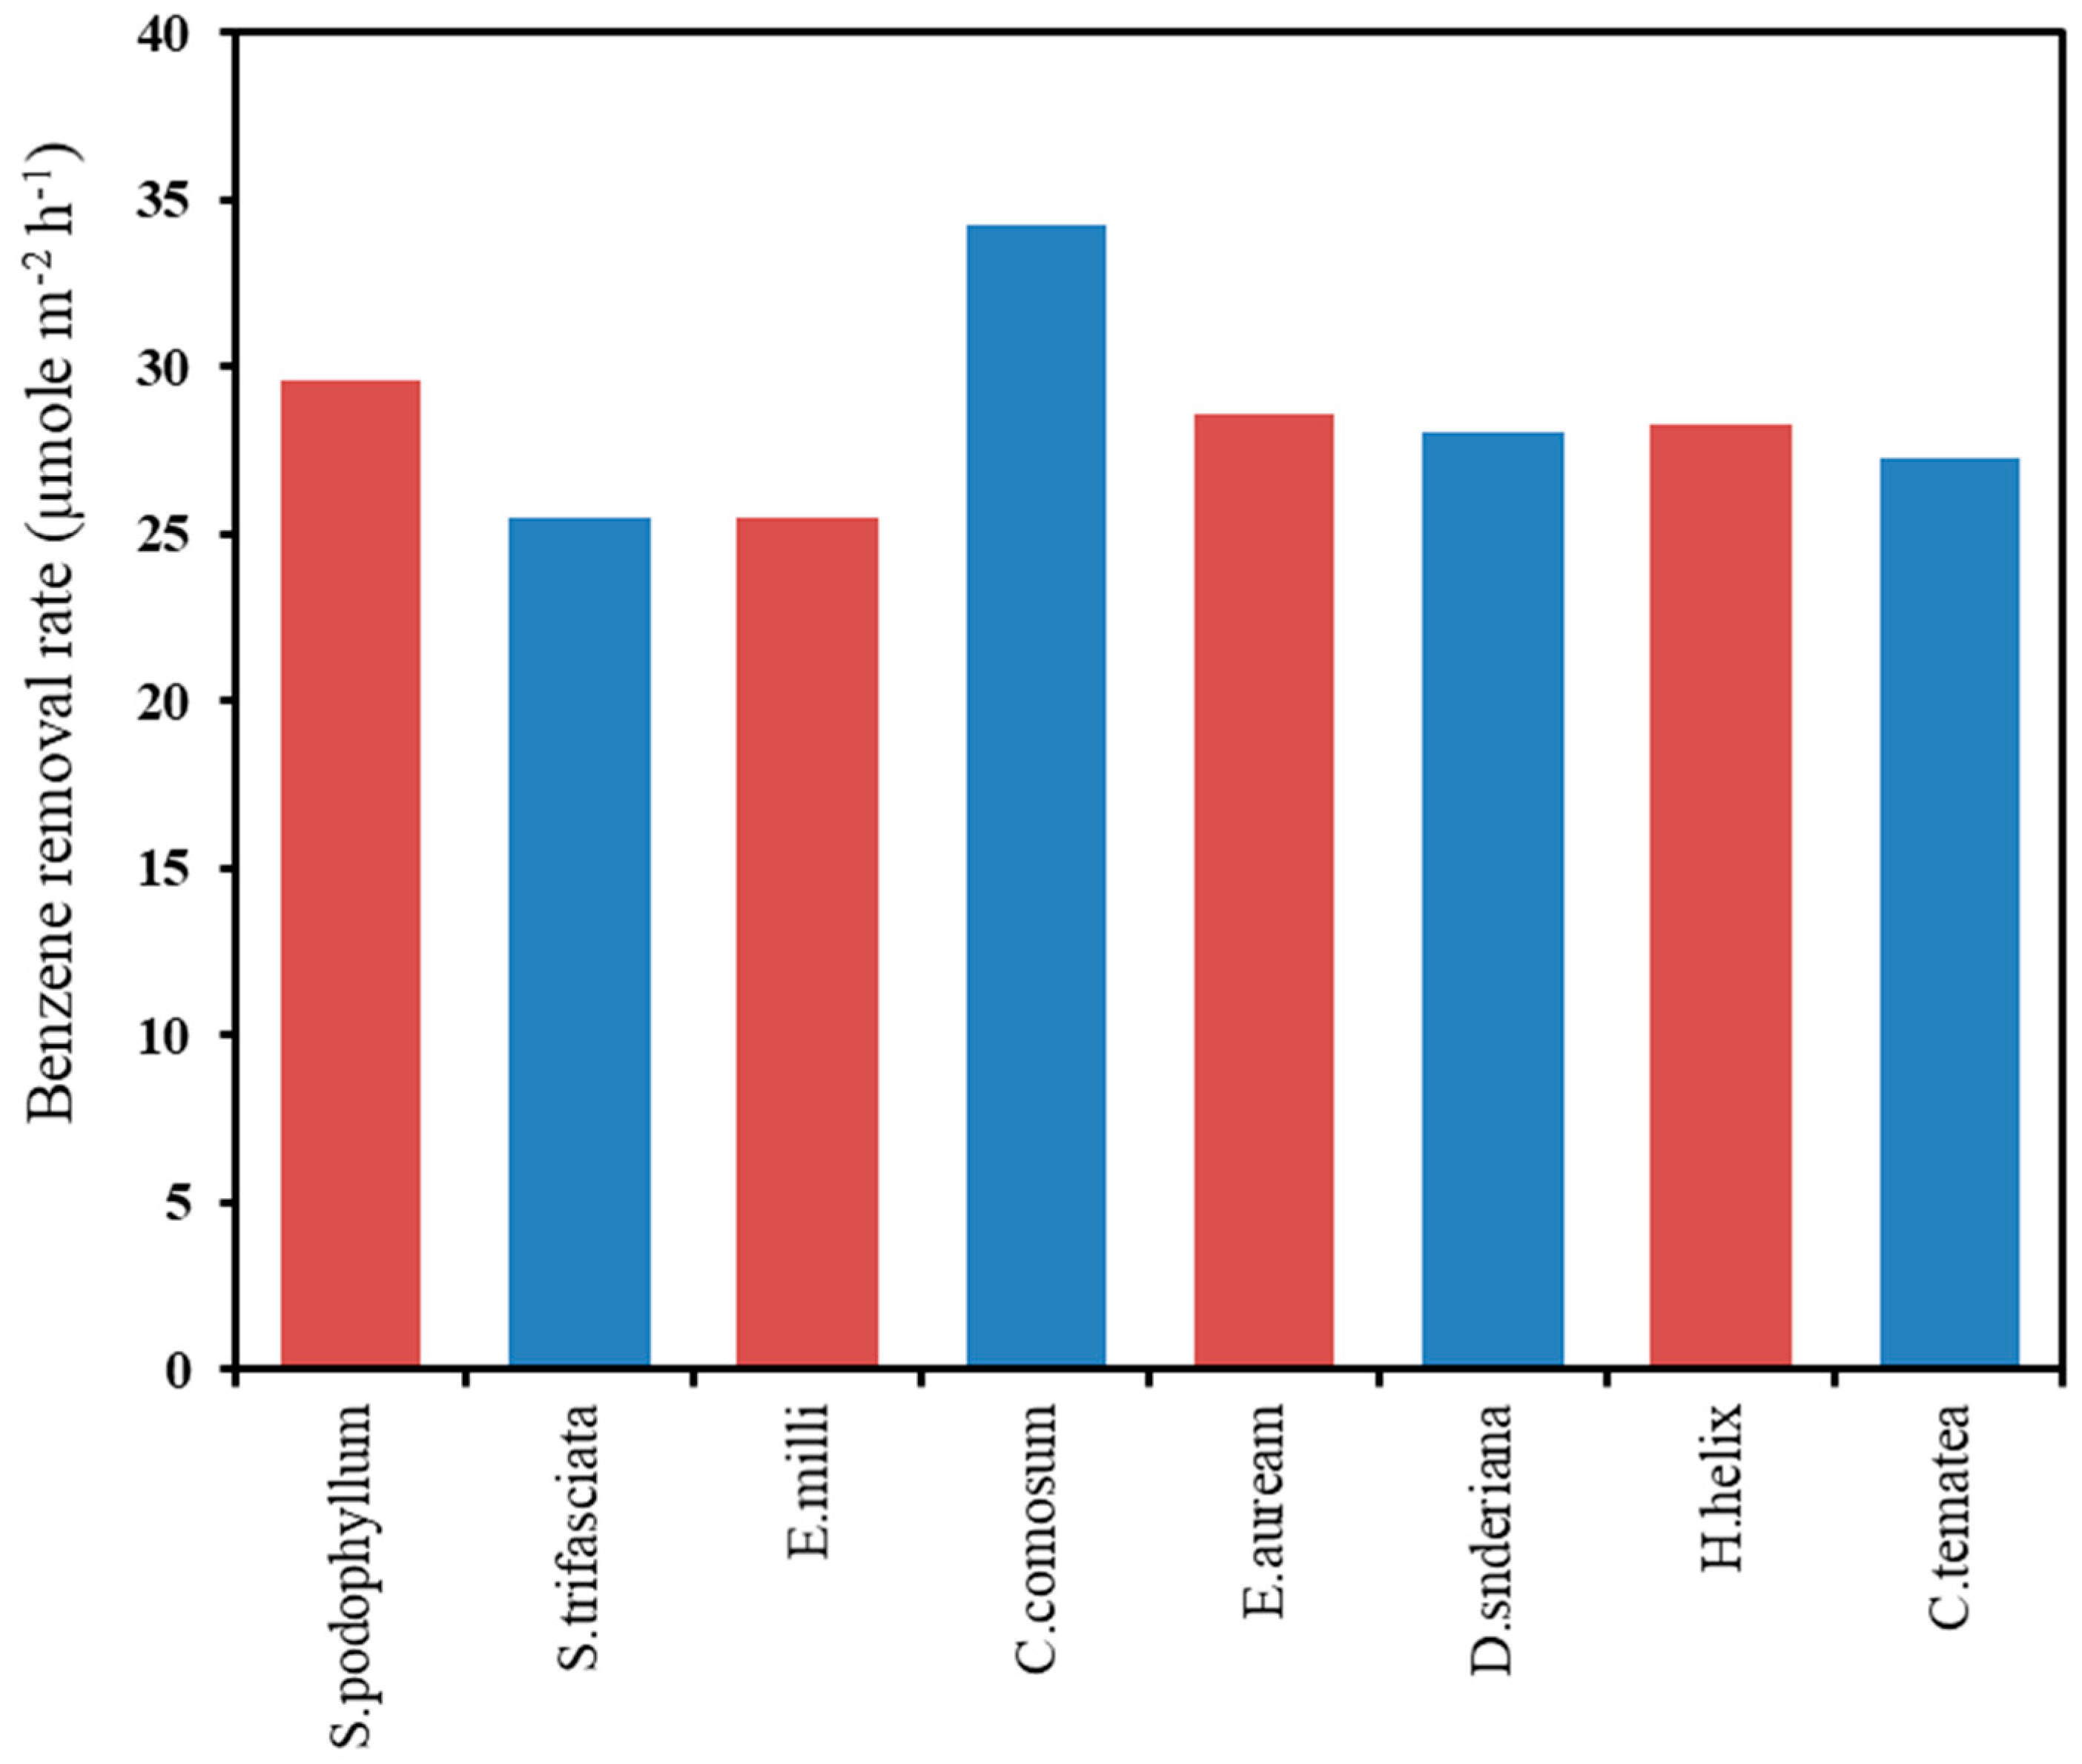
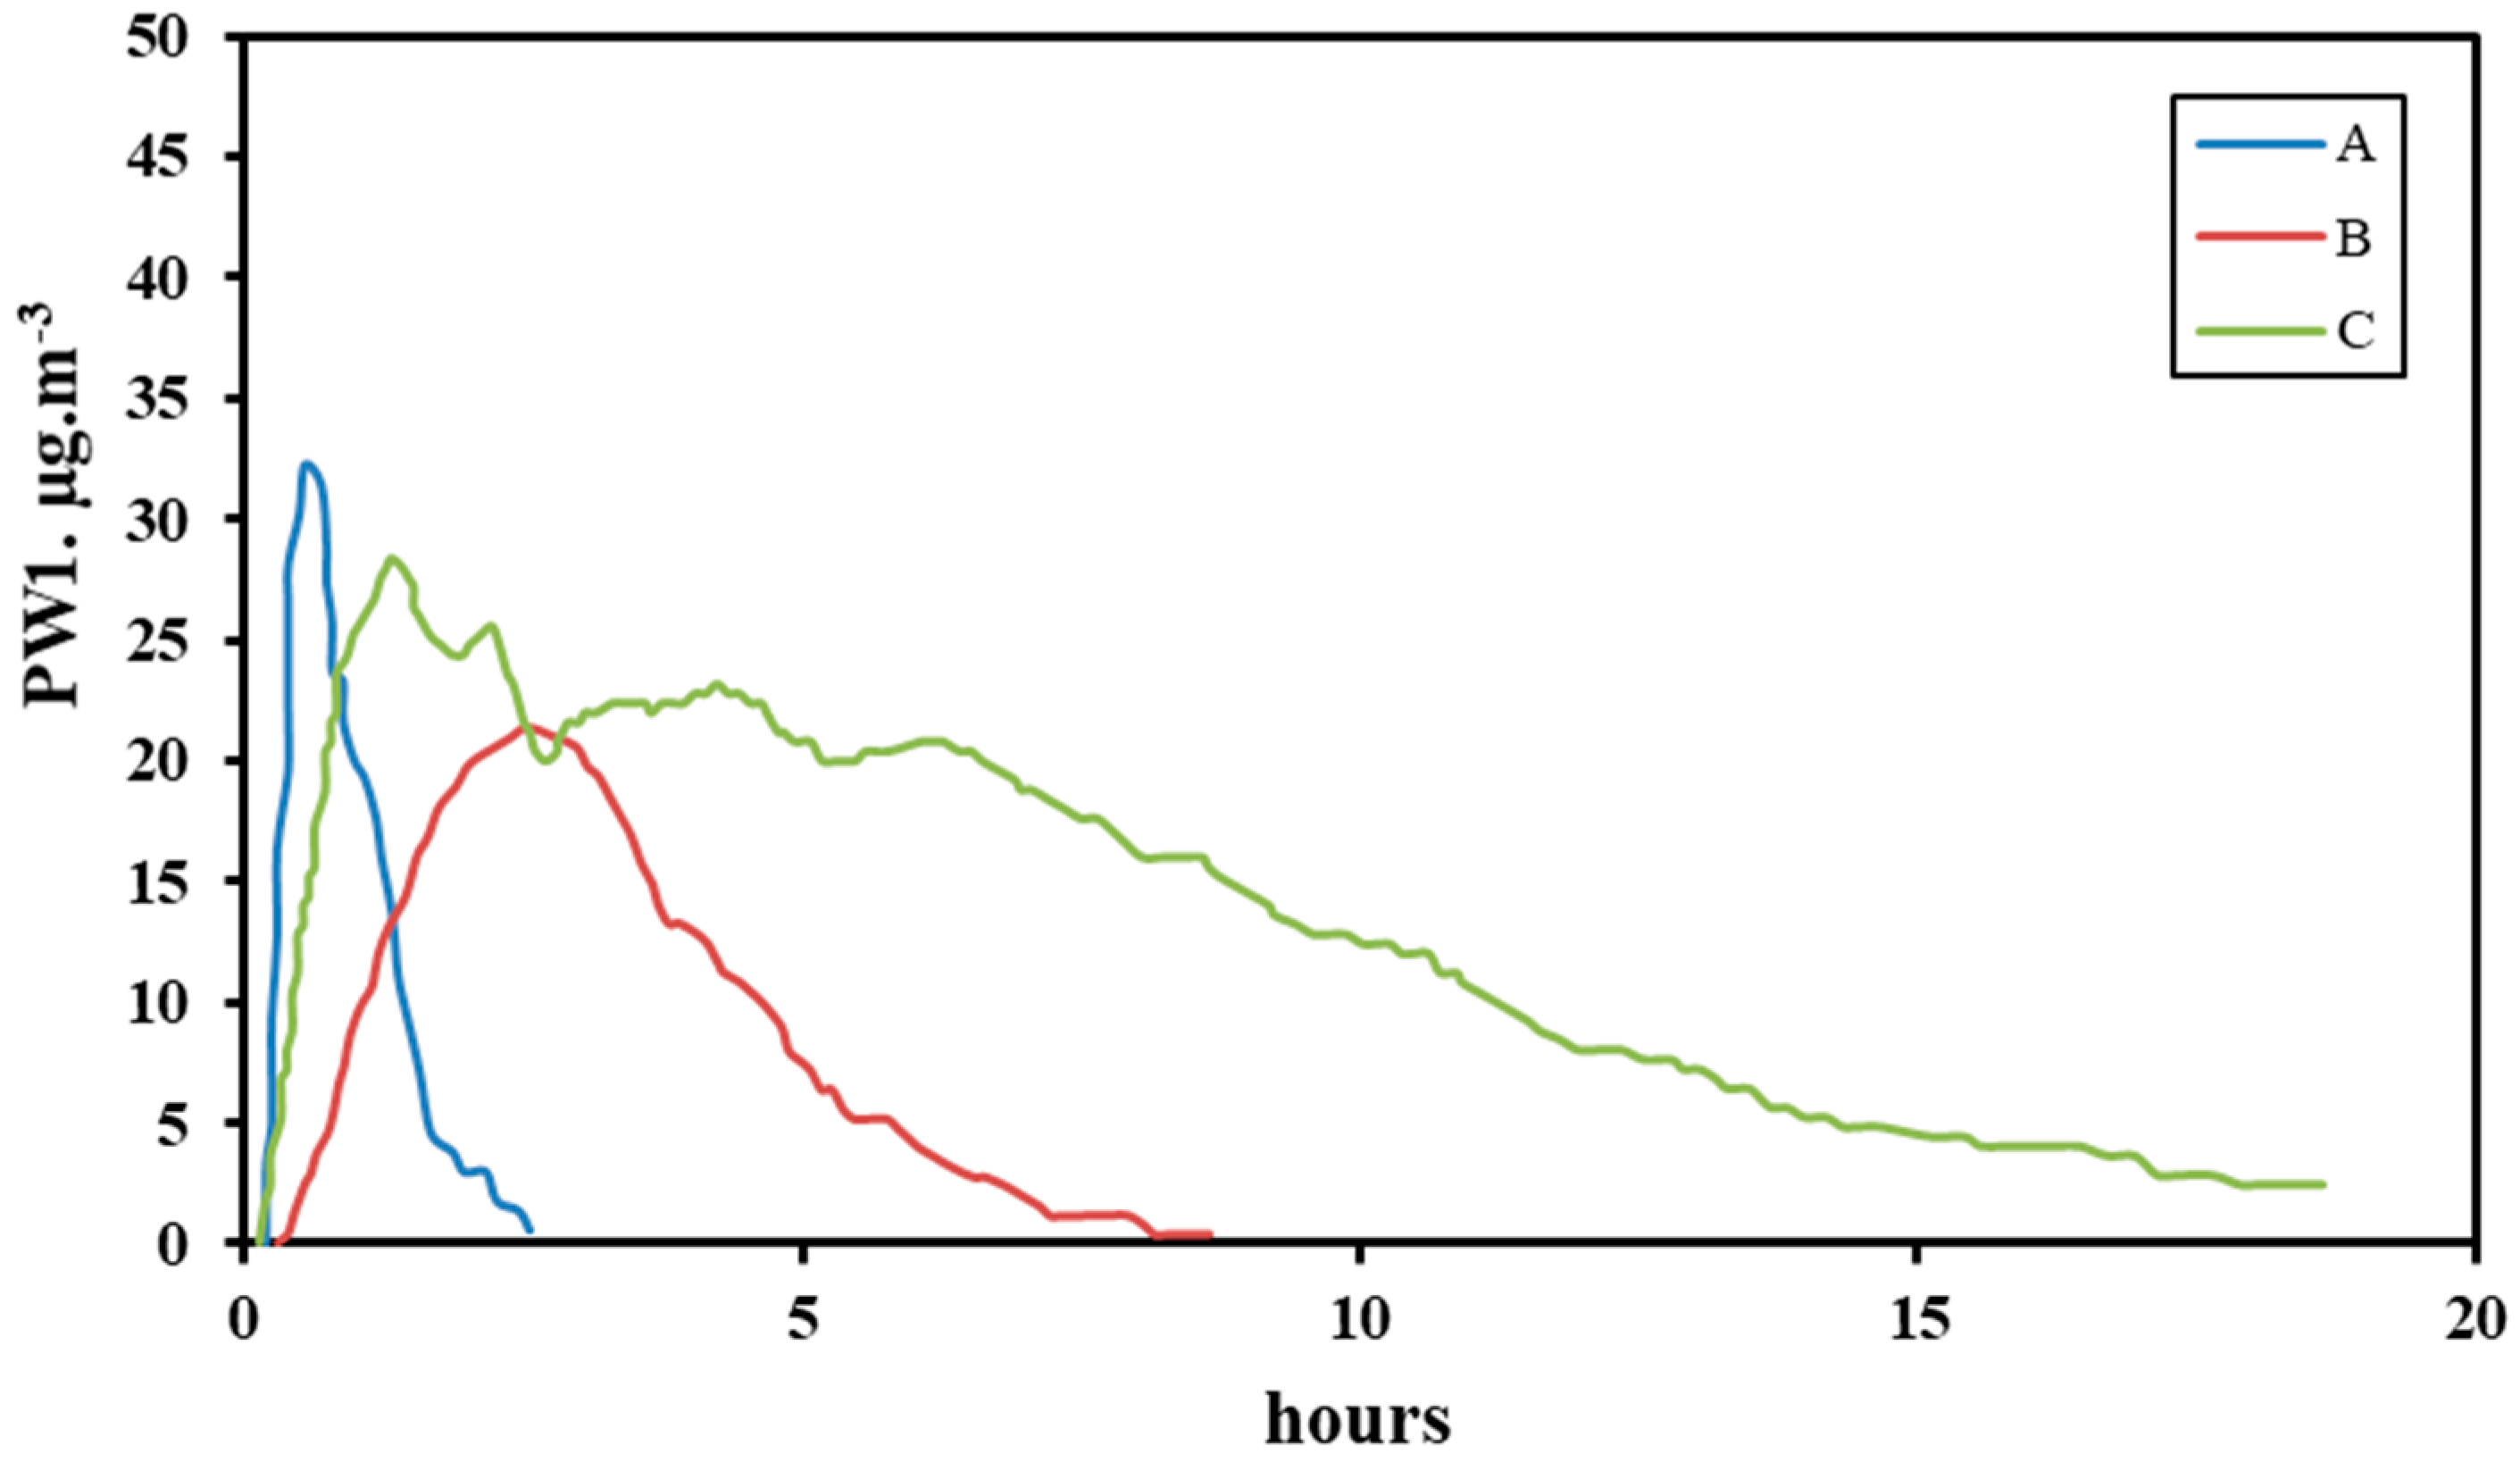
Table 1.
World Health Organization (WHO) classification of volatile organic compounds (VOCs) adapted from [63].
Table 1.
World Health Organization (WHO) classification of volatile organic compounds (VOCs) adapted from [63].
| Category Description | Acronym | Boiling Point Range, °C |
|---|---|---|
| Very volatile (gaseous) organic compounds | VVOCs | <0 to 50 |
| Volatile organic compounds | VOCs | 50 to 240 |
| Semi-volatile organic compounds | SVOCs | 240 to 380 |
| Organic compounds associated with particulate matter: Particle-bound organic compounds | POCs | >380 |
Table 2.
Common indoor sources of volatile organic compounds adapted from the WHO [64].
Table 2.
Common indoor sources of volatile organic compounds adapted from the WHO [64].
| Class | Name | Maximum Exposure Guidelines | |
|---|---|---|---|
| Organic pollutant | Carbon monoxide | 100 mg/m3 | 15 min |
| 60 mg/m3 | 30 min | ||
| 30 mg/m3 | 1 h | ||
| 10 mg/m3 | 8 h | ||
| Organic pollutant | Formaldehyde | 0.1 mg/m3 | 30 min |
| Organic pollutant | Tetrichloroethylene (TCE) | 0.25 mg/m3 | Annual |
| Organic pollutant | Tetrachloroethylene (PCE) | 100 ppm | 3 h |
| Organic pollutant | Toluene | 0.26 mg/m3 | 1 week |
| Inorganic pollutant | Asbestos | 500 F*/m3 b | -- |
| Radioactive pollutant | Radon | >1 Becquerel/m3 c | -- |
| Classical pollutant | Nitrogen dioxide | 200 μg/m3 | 1 h |
| 40 μg/m3 | Annual | ||
| 53 ppb a | Annual | ||
| Ozone | 120 μg/m3 | 8 h | |
| 0.08 ppm a | 1 h | ||
Table 3.
Research on indoor air cleaning using potted-plants organized based on pollutant to remove.
Table 3.
Research on indoor air cleaning using potted-plants organized based on pollutant to remove.
| Pollutant | Potted Plant Species (Remedy) | Results | Ref. |
|---|---|---|---|
| O3 | Peace Lily (Spathiphyllum), Ficus species (Ficus Decora Burgundy), Calathia (Calathia Species), Dieffenbachia (Dieffenbachia Species), Golden Pothos (Epipremnum aureum) | The Golden Pothos had the highest ozone deposition velocity values among plants, and the lowest value was for Peace Lily | [160] |
| Toluene and xylene | Schefflera actinophylla and Ficus benghalensis) | Removal of toluene and xylene was 13.3 and 7.0 μg·m−3·m−2 leaf area over a 24-h period in S. actinophylla and was 13.0 and 7.3 μg·m−3·m−2 leaf area in F. benghalensis. It also showed that the root zone has a vital role in toluene and xylene removal. | [148] |
| Toluene | Hedera helix | The removal rate is 66.5 μg/m2/h for toluene that is effective to remove it. | [161] |
| Benzene | Syngonium podophyllum, Sansevieria trifasciata, Euphorbia milii, Chlorophytum comosum, Epipremnum aureum, Dracaena sanderiana, Hedera helix, Clitoria ternatea | C. comosum was the highest efficient plant for removing benzene during the 96 h. | [8] |
| Trichloroethylene, tetrachloroethylene 1,2-dichloroethane benzene, toluene m, p-xylene | ficus; golden pothos; spider fern; Christmas cactus | Leaf concentrations change with air concentrations, the speed of air. It shows the potential of leaves for removing VOCs in indoor air. | [23] |
| PM | Spider plants (Chlorophytum comosum L.) | The result show accumulation of PM at a high level on surface of leaf | [126] |
| Toluene ethylbenzene | Aloe vera, Sansevieria masoniana, Sansevieria trifasciata, Sansevieria hyacinthoides, Sansevieria ehrenbergii, Kalanchoe blossfeldiana, Dracaenaderemensis, Codiaeum variegatum, Chlorophytum comosum, Dracaena sanderiana, Cordyline fruticosa, Aglaonema commutatum | S. trifasciata had the highest value for removing toluene, C. comosum. for removal of ethylbenzene, S. trifasciata and S. hyacinthoides had a high value in the absorption of toluene and ethylbenzene. | [54] |
| Benzene Trichloroethylne Formaldehyde | Chamaedorea seifritzii, Aglaonema modestum, Hedera helix, Ficus benjamina, Gerbera jamesonii, Dracaena deremensis, Dracaena marginata, Dracaena massangeana, Sansevieria laurentii, Spathiphyllum, Chrysanthemum morifolium, Dracaena deremensis | These plants require low light and low metabolic rates. These plants are a suitable selection to decrease sick building syndrome containing many new, energy-efficient buildings. The plant root-soil zone showed high efficiency for removal of VOCs | [136] |
| Formaldehyde | Golden Pothos | Dynamic airflow through the root bed and microbes were essential for removing high efficiency; moisture of bed root has a vital role in removing VOCs. | [133] |
| Benzenen-hexane | Janet Craig S. Sweet Chico | The highest value for removing TVOCs (75%) by potted-plants is when indoor average TVOC concentrations are higher than 100 ppb. | [153] |
| Benzene | Indoor ornamental plants representing 73 species and cultivars (35 families and 60 genera) | Thirteen species removed between 0.1–9.99% of benzene in contaminated air, 17 species removed 10–20%, and 17 species removed 20–40%. Three species removed 60–80% of benzene in the experimental air. | [142] |
| Benzene | Spathiphyllum, Howea forsteriana, Dracaena marginata, Epipremnum aureum, Spathiphyllum, | These potted-plants decrease VOCs, even if the level of VOCs has very low. | [149] |
| Schefflera, Dracaena | |||
| Toluene toxicity, 14C-toluene uptake | Soybean (Glycine max) | 14C concentrations in Leaf tissue increased during the light phases and decreased during 12-hr dark phases. | [151] |
| Benzene CO2, CO | Zamioculcas, Aglaonema Dracaena | CO2 concentration increases 10% in offices in the air-conditioned building. The CO level reduces with or without air-conditioning. Higher value removing of benzene appearance by these plants. | [150] |
| CO2, acetone methyl acetate Formaldehyde PM | Green wall | The active green wall has high efficiency to increase indoor air quality by absorbing VOC and PM but has not been highly effective for carbon dioxide adsorption. The green wall increases the relative humidity, which is a suitable selection to use in a dry environment. | [137] |
| CO2 | Aglaonema commutatum Schott, Aspidistra elatior Blume, Castanospermum australe A.CunnexHoo., Chamaedorea elegans Wild., Dracaena deremensis Engl., Dypsis lutescens, Beentje and J.Dransf., Ficus benjamina L. Howea forsteriana Becc. | These plants can be used in high-intensity light, but if the light intensity is higher than the optimal value, but will become photoinhibited, and possibly be etched off chlorophyll | [15] |
| CO2 | Peace lily, weeping fig, areca palm | The rate of photosynthesis change with the variation of CO2 concentration in light indoor. The leaf area is effective to decrease CO2. for 3 plants, with the area of the leaf up to 15,000 cm2, the CO2 concentration decreases (just leaf area is effective in the reduction of CO2. | [162] |
| CO2 | Sweet Chico, Hahnii, Chamaedorea elegans, Dracaena marginata, Florida Beauty, Lemon Lime, Janet Craig, Ctenanthe, oppenheimiana, Ficus repens, Hedera helix, Epipremnum, aureus, Philodendron, scandens, Dizygotheca, elegantissima | Woody plants species accumulate dry mass (and carbon) better than smaller, herbaceous species. | [163] |
Table 4.
Research on indoor air cleaning organized based on other effects of a green wall.
| Other Effects | Green Wall | Results | Ref. |
|---|---|---|---|
| Alcohols, CO, O3, CO2, NO2, VOC | – | The performances and limitations of electronic gas sensors to investigate an indoor air quality event were evaluated. | [152] |
| PM2.5, black carbon, ultrafine particles, sulfur, total volatile organic compounds (VOCs), formaldehyde | – | Households (with green wall and without the green wall) were compared. | [170] |
| Simulation-Based Analysis of the Energy Conservation Effect of Green Wall. | H. helix | Green wall induced loss and gains energy in winter and summer | [171] |
| Effects of vegetation on indoor thermal comfort; simulation. | Hedera helix | Improved consumption energy and decreased temperature up to 4.8 °C. | [96] |
| The effect of an indoor living wall system on humidity, mold spores, and CO2 concentration. | – | Indoor living wall caused a higher comfort level in the winter months. In summer, the humidity was also higher, ehile the temperature was similar. The concentration of CO2 decrease by 3.49% | [167] |
| Thermal regulation impact | Hedera helix | Decreasing temperature by 6.1 °C, 4.0 °C for sunny and cloudy days, respectively | [94] |
| The incident acoustic absorption coefficient | Nephrolepis Exaltata (Boston Fern) and Helxine soleirolii (Baby Tears) | The combination of Fern and substrate absorption coefficient reached a value of 0.75 at 300 Hz, then decreased at 700 Hz, after it has steadily increased up 0.9 at 1600 Hz. The absorption coefficient of the combination of Baby Tears and soil increased less steeply than the other one, reaching 0.95 at 1600 Hz. | [168] |
| Cooling effect | Kudzu (Pueraria lobata) | The average transpiration cooling effect calculated from the indoor wall surface temperatures was 0.23 °C, although the average shading cooling effect was 8.55 °C under global solar radiation on a vertical south surface between 400 and 600 Wm−2. Also, those calculated from room temperatures under the same environmental conditions were 0.15 and 4.00 °C, respectively. | [172] |
| CO2, acetone methyl acetate Formaldehyde and PM | Green wall | The active green wall had high efficiency to increase indoor air quality, such as absorbing VOC and PM. But it has not been highly effective for carbon dioxide adsorption. The green wall increased the relative humidity, which is a suitable selection to use in a dry environment. | [137] |
| CO2 removal | Chlorophytum comosum and Epipremnum aureum | Both of the plants were effective in CO2 removal at densities higher than 50 μmol m−2 s−1. when the intensity of the light increased, the green wall was capable of significant quantifiable reductions in high CO2 concentrations within a sealed room environment. | [173] |
Publisher’s Note: MDPI stays neutral with regard to jurisdictional claims in published maps and institutional affiliations. |
© 2021 by the authors. Licensee MDPI, Basel, Switzerland. This article is an open access article distributed under the terms and conditions of the Creative Commons Attribution (CC BY) license (https://creativecommons.org/licenses/by/4.0/).
Share and Cite
MDPI and ACS Style
Bandehali, S.; Miri, T.; Onyeaka, H.; Kumar, P. Current State of Indoor Air Phytoremediation Using Potted Plants and Green Walls. Atmosphere 2021, 12, 473. https://0-doi-org.brum.beds.ac.uk/10.3390/atmos12040473
AMA Style
Bandehali S, Miri T, Onyeaka H, Kumar P. Current State of Indoor Air Phytoremediation Using Potted Plants and Green Walls. Atmosphere. 2021; 12(4):473. https://0-doi-org.brum.beds.ac.uk/10.3390/atmos12040473
Chicago/Turabian StyleBandehali, Samaneh, Taghi Miri, Helen Onyeaka, and Prashant Kumar. 2021. "Current State of Indoor Air Phytoremediation Using Potted Plants and Green Walls" Atmosphere 12, no. 4: 473. https://0-doi-org.brum.beds.ac.uk/10.3390/atmos12040473
Note that from the first issue of 2016, this journal uses article numbers instead of page numbers. See further details here.