
The Signal to Noise Ratio and the Completeness Magnitude: The Effect of the COVID-19 Lockdown


1
Dipartmento di Matematica e Fisica, Università della Campania ‘Luigi Vanvitelli’, 81100 Caserta, Italy
2
Istituto Nazionale di Geofisica e Vulcanologia—Sezione di Napoli, Osservatorio Vesuviano, 80124 Napoli, Italy
*
Author to whom correspondence should be addressed.
Atmosphere 2021, 12(5), 525; https://0-doi-org.brum.beds.ac.uk/10.3390/atmos12050525
Submission received: 17 March 2021
/
Revised: 14 April 2021
/
Accepted: 19 April 2021
/
Published: 21 April 2021
(This article belongs to the Special Issue Modeling Multiscale Dynamics by Statistical Mechanics in Heliophysics and Geophysics)
Abstract
:We analyse the earthquakes catalogues for Italy, South California, and Greece across the COVID-19 lockdown period for each country. The results for Italy and Greece show that, even if the reduction of the signal to noise ratio has improved the earthquake detection capability, the completeness magnitude remains substantially unchanged, making the improved detection capability ineffective from the statistical point of view. A slight reduction (0.2) of the completeness magnitude is observed for South California, likely related to the relatively higher number of seismic stations located close to urban areas. Our findings suggest that—given the present configuration of the seismic network considered here—only an important decrease in the station spacing can produce a significant decrease of the completeness magnitude.
1. Introduction
The signal to noise (S/N) ratio is one of the most important parameters in the definition of seismic data quality. Indeed, a low S/N value hampers the detection of small magnitude events. In some cases, it reduces the capability of first arrival identification and magnitude estimation, possibly even hiding the earthquake signal. The seismic noise can be viewed as a superposition of natural and anthropogenic sources, and in some cases, it is possible to characterise the origin of these sources [1,2,3,4]. Generally, natural and anthropogenic noises have different frequency content. Indeed, the higher frequency noise represents the human-generated noise and is due to the presence of factories, domestic apparatus, vehicle traffic, etc. (see, among the others, McNamara and Buland [5]). By influencing the detectability of small earthquakes, the S/N ratio determines the completeness magnitude , i.e., the lowest magnitude at which all the earthquakes, occurring in a certain region and in a given time window, are detected [6]. This parameter is fundamental in the statistical assessment of the frequency–magnitude distribution of earthquakes, , commonly referred as the Gutenberg–Richter (GR) distribution. In the previous equation, N is the number of earthquakes with a magnitude larger or equal to m, b is a scaling parameter controlling the relative number of earthquakes of different magnitudes, and the constant a represents the overall seismicity rate, that is, the productivity of the considered seismogenic volume. The scaling parameter b is the slope of the line and can only be determined in the range , with being the maximum magnitude detected in the area. The GR parameters are, in general, the basis of the seismic hazard studies (e.g., Wiemer et al. [7]) and of the earthquake forecast models (e.g., Wiemer and Schorlemmer [8]). Moreover, a correct estimate of a and b is crucial to better understand the physics of the earth’s crust (e.g., Mignan [9]), and their variations provide information on the changes of the differential stress within the considered volume [10].
After the emergency of the COVID-19, many governments worldwide have adopted some restrictions that, in most cases, caused the reduction of anthropogenic noise. In principle, this reduction implies the increase in the detection capability of smaller events [11,12,13,14,15,16] and, in turn, a net decrease of would be expected. However, to our knowledge, the greater part of papers focused on the noise analysis and on the improvement of earthquakes detectability. This allowed for a short period to detect earthquakes that perhaps revealed areas of previously unknown micro-seismicity (e.g., Salvage and Eaton [17]) and above all demonstrated that seismic signals can be used to analyse human activity, as shown by Xiao et al. [11], Lecocq et al. [13], Piccinini et al. [18], but none focused on improving the completeness magnitude . Moreover, this relation between and the reduction of the S/N ratio is not direct and should be verified by investigating the effect of the influence of the increased detection capability on the case-by-case.
In the following, we show that, in spite of the increased detectability of small earthquakes associated with the COVID-19 lockdown in several countries, the value of the completeness magnitude may not change significantly. As a consequence the increased number of small events for , it is substantially ineffective from a statistical point of view. Moreover, our results provide guidelines for the definition of the strategies for improvement of the earthquake detection capability of any seismic network.
2. Data and Methods
Here we analyse the earthquake catalogues for three different areas, namely Italy, South California, and Greece. In these countries, the government adopted a strict lockdown with a total ban on all non-essential movements. Wherever it has been adopted, this measure caused a net reduction of the seismic noise (e.g., Xiao et al. [11], Yabe et al. [14], Roy et al. [16]) including the countries considered here [13,18]. Thus, for each one of the three countries we consider the earthquakes occurred in a time period across the adoption of the lockdown decree.
The institutions providing the catalogues and the web sites from where the data can be donwloaded are:
- Istituto Nazionale di Geofisica e Vulcanologia terremoti.ingv.it/search (accessed on 20 April 2021)
- Southern California Earthquake Data Center scedc.caltech.edu/data/alt-2011-dd-hauksson-yang-shearer.html (accessed on 20 April 2021)
- University of Athens geophysics.geol.uoa.gr/stations/gmapv3db/index.php?lang=en (accessed on 20 April 2021)
In order to investigate the occurrence of possible changes, for each catalogue we select two distinct time periods: one from the start date of the lockdown decree in the area (Table 1) to the end of April 2020 or to the beginning of May 2020, whereas, for the other one, we select an equal number of days before the lockdown, to be used as reference. For each country, the number of events in each time interval (Table 1) is large enough to ensure reliable statistical analyses.
We estimate the completeness magnitude using two different methods: the one introduced by Godano [19] and the goodness of the fit method [20]. For each area, the two methods provide the same value. The b value is estimated via the maximum likelihood method [21], and its standard deviation is estimated using the method of Shi and Bolt [22].
The estimation uncertainty corresponds to the magnitude estimation error: namely 0.05. Indeed, both the used methods are based on the best fit of other parameters for different values of . More precisely, the goodness of the fit method estimates the b value fitting the GR distribution for different values of choosing its correct value when the assumes the minimum value. Conversely the method introduced by Godano [19] estimates the slope of the harmonic average versus a magnitude threshold.
3. Results and Discussion
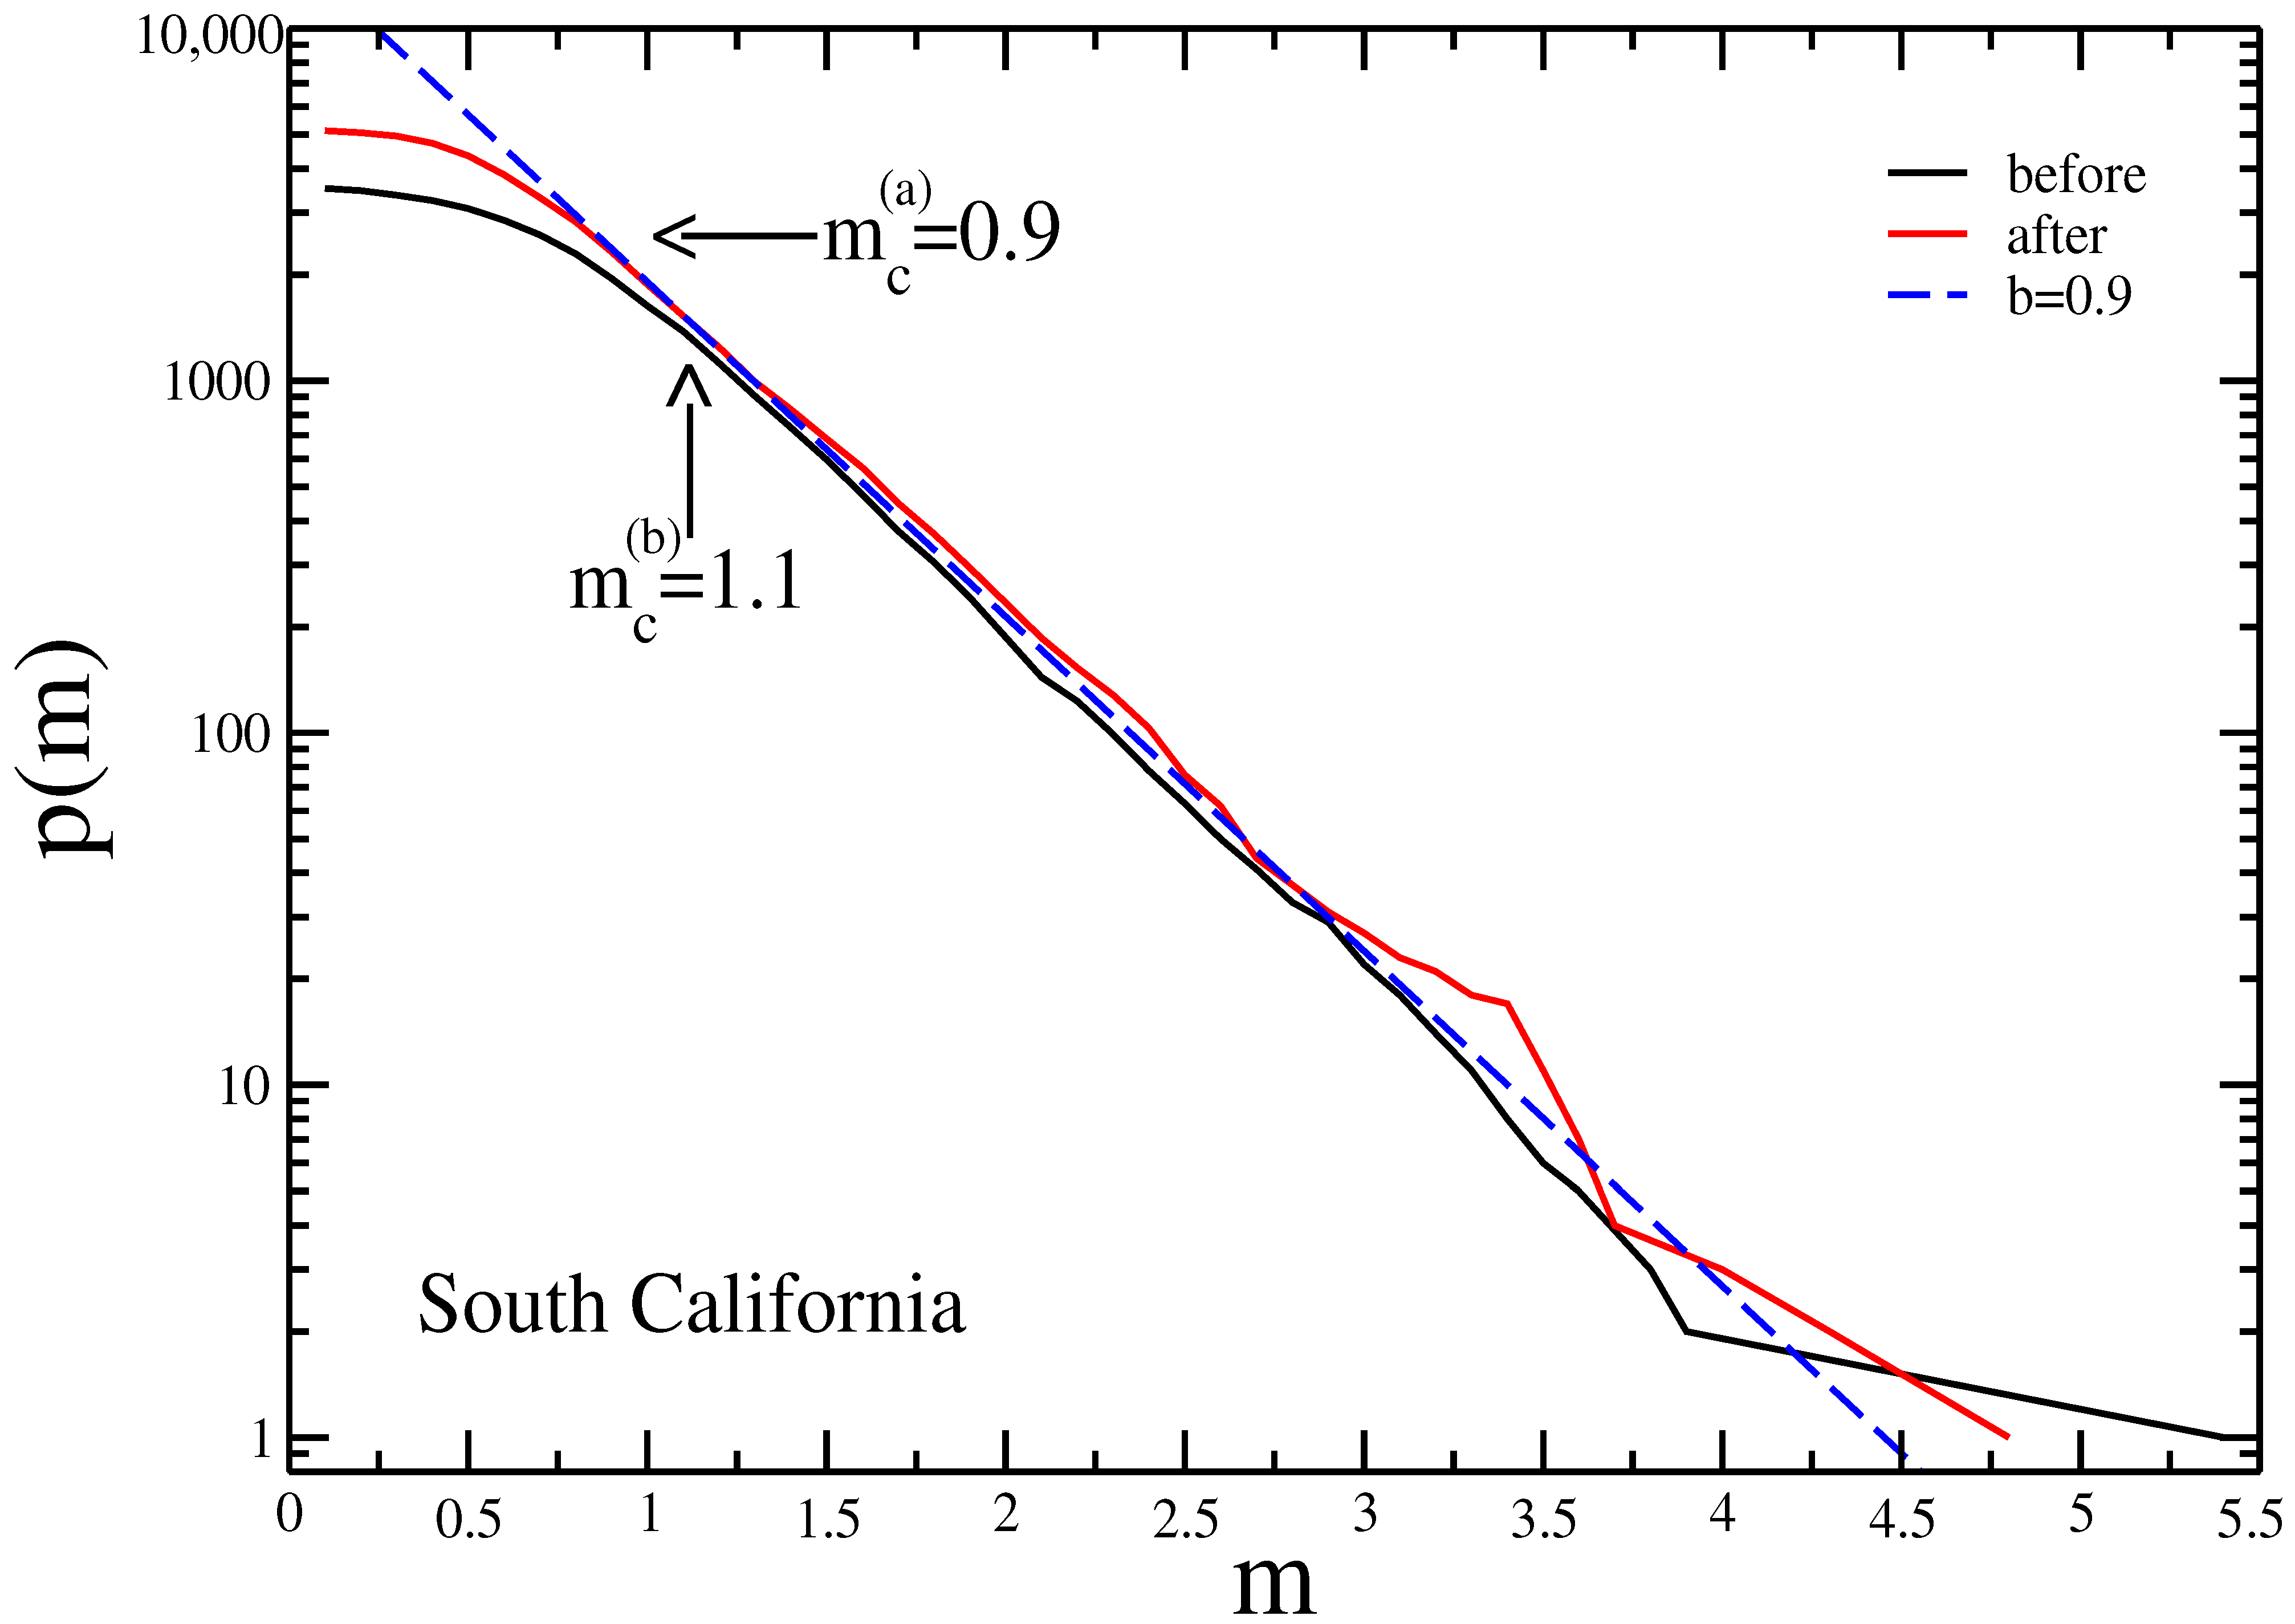
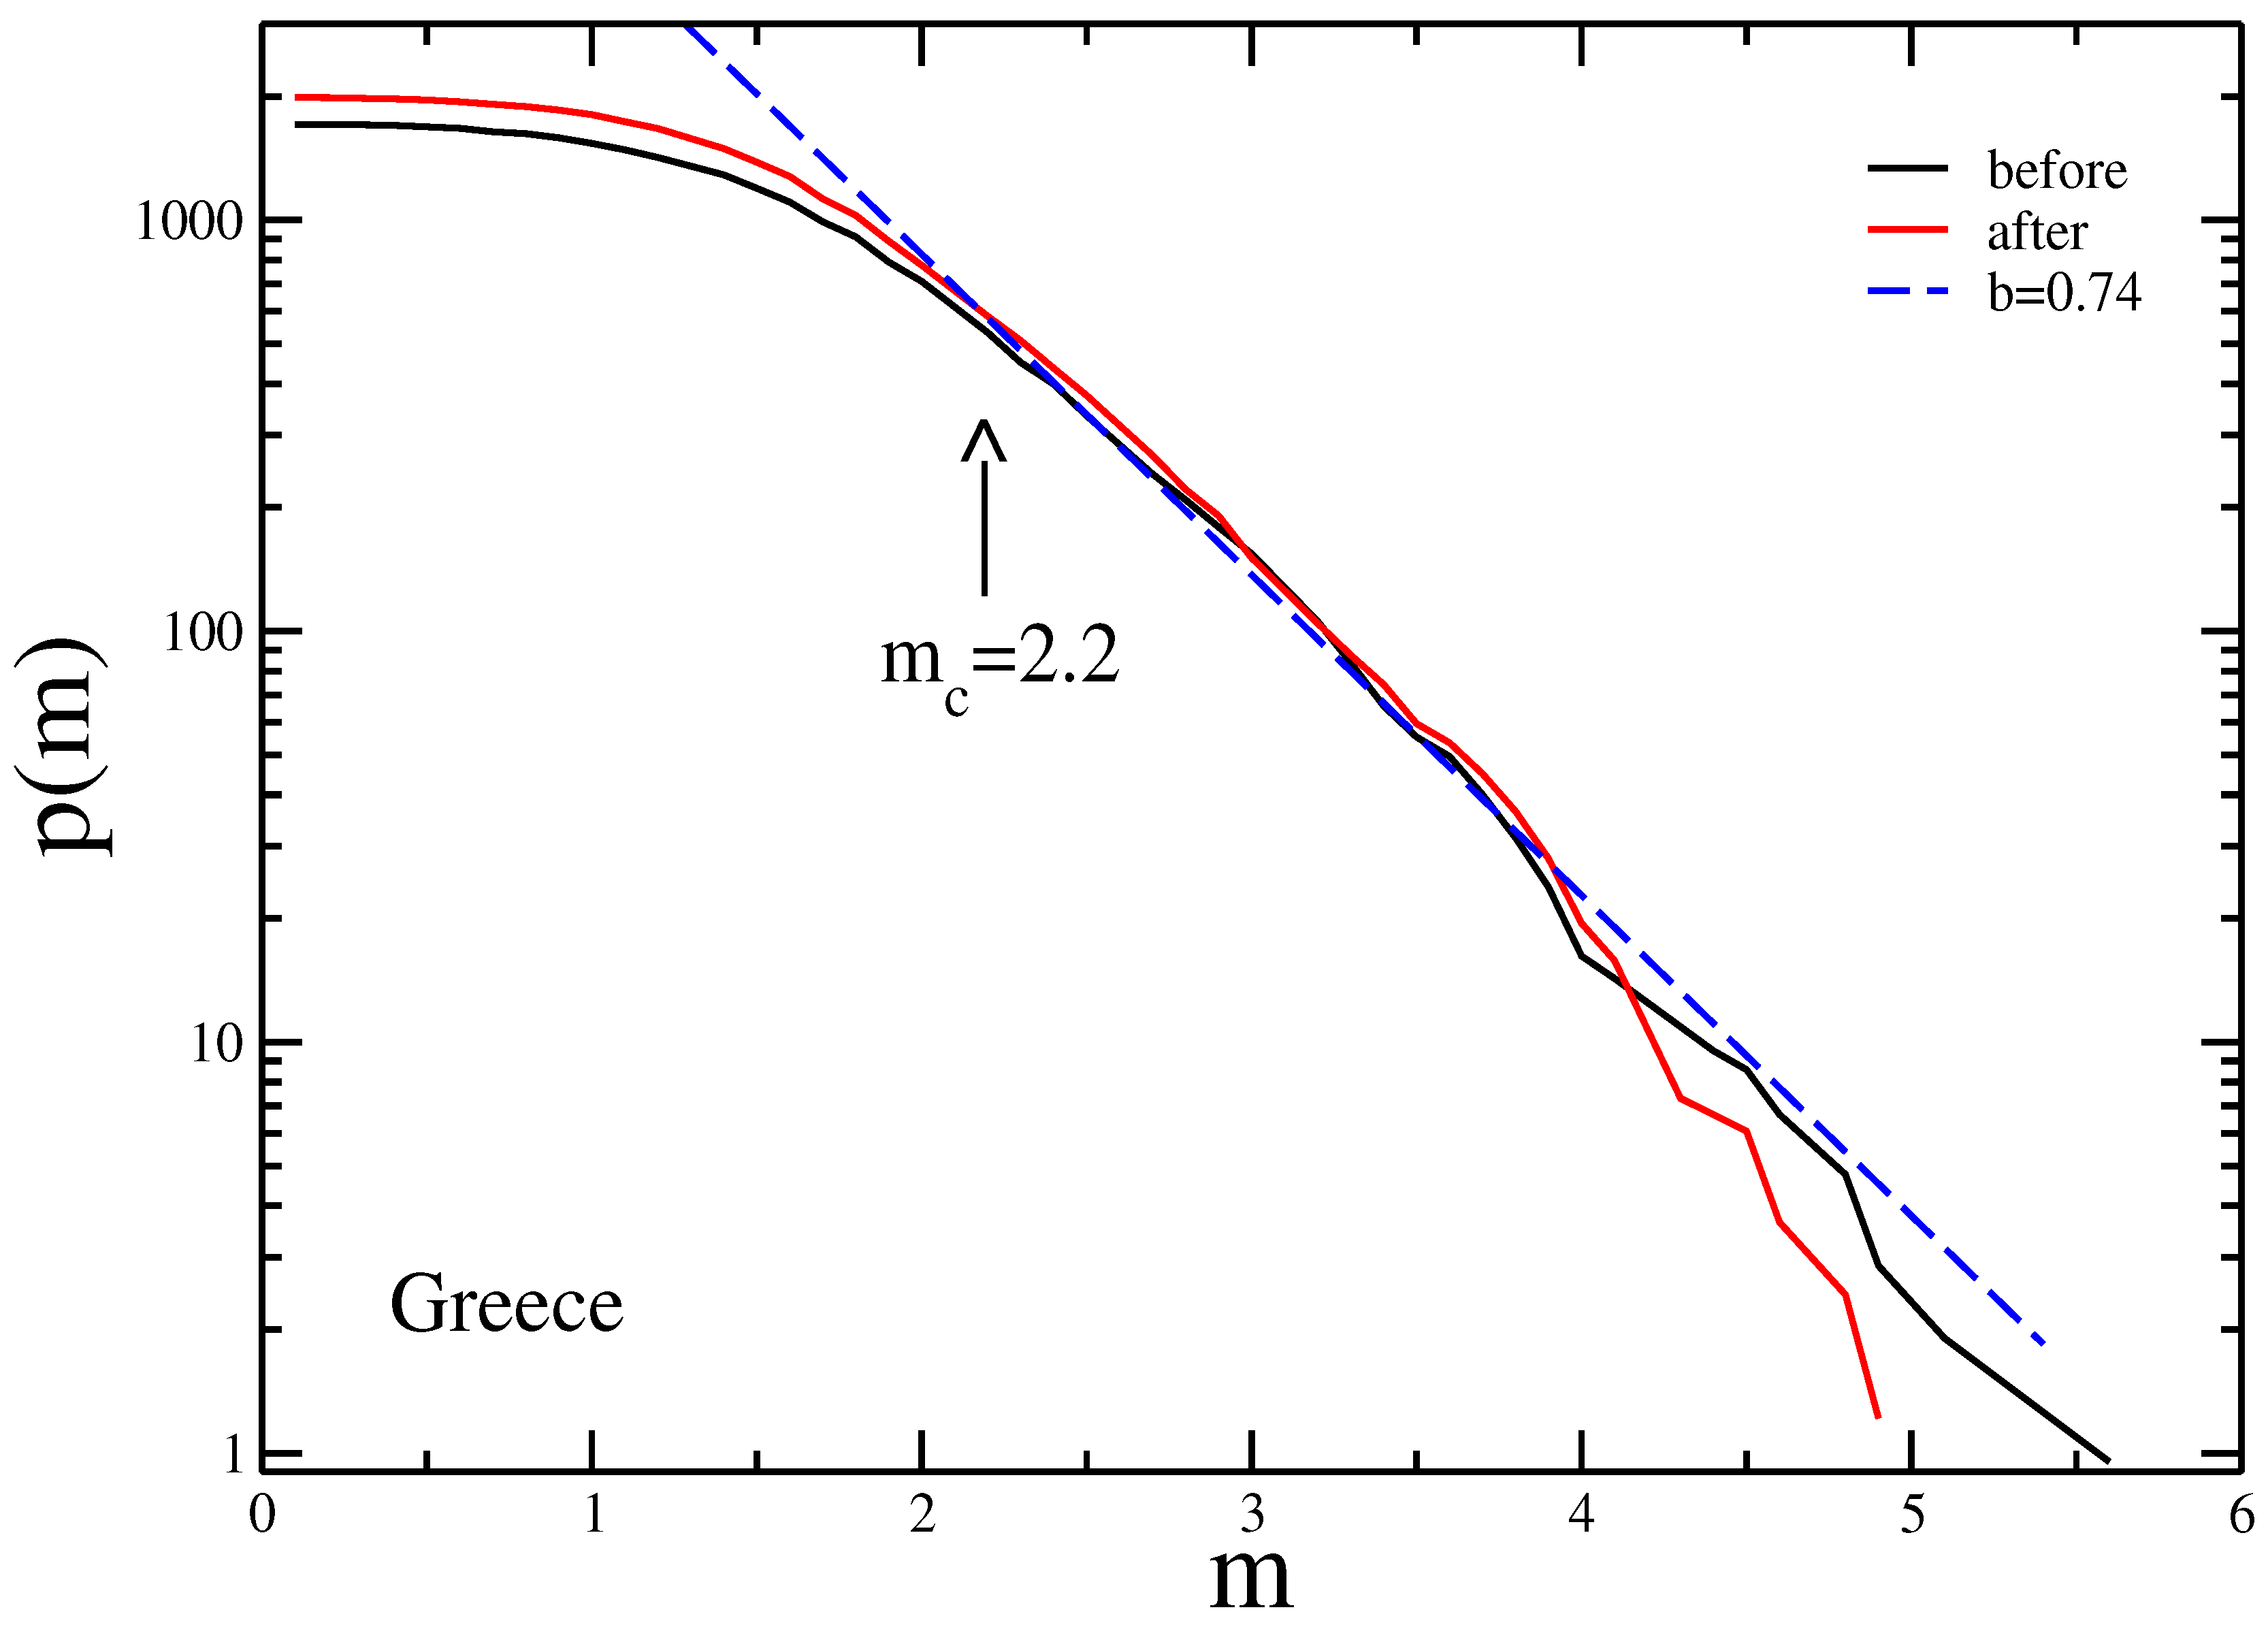
The values of the estimated parameters are presented in Table 2. The values of , b and , for Italy and Greece, substantially do not change during the lockdown periods with respect to the preceding period. Whereas South California and b values decrease of 0.2 and 0.3, respectively.
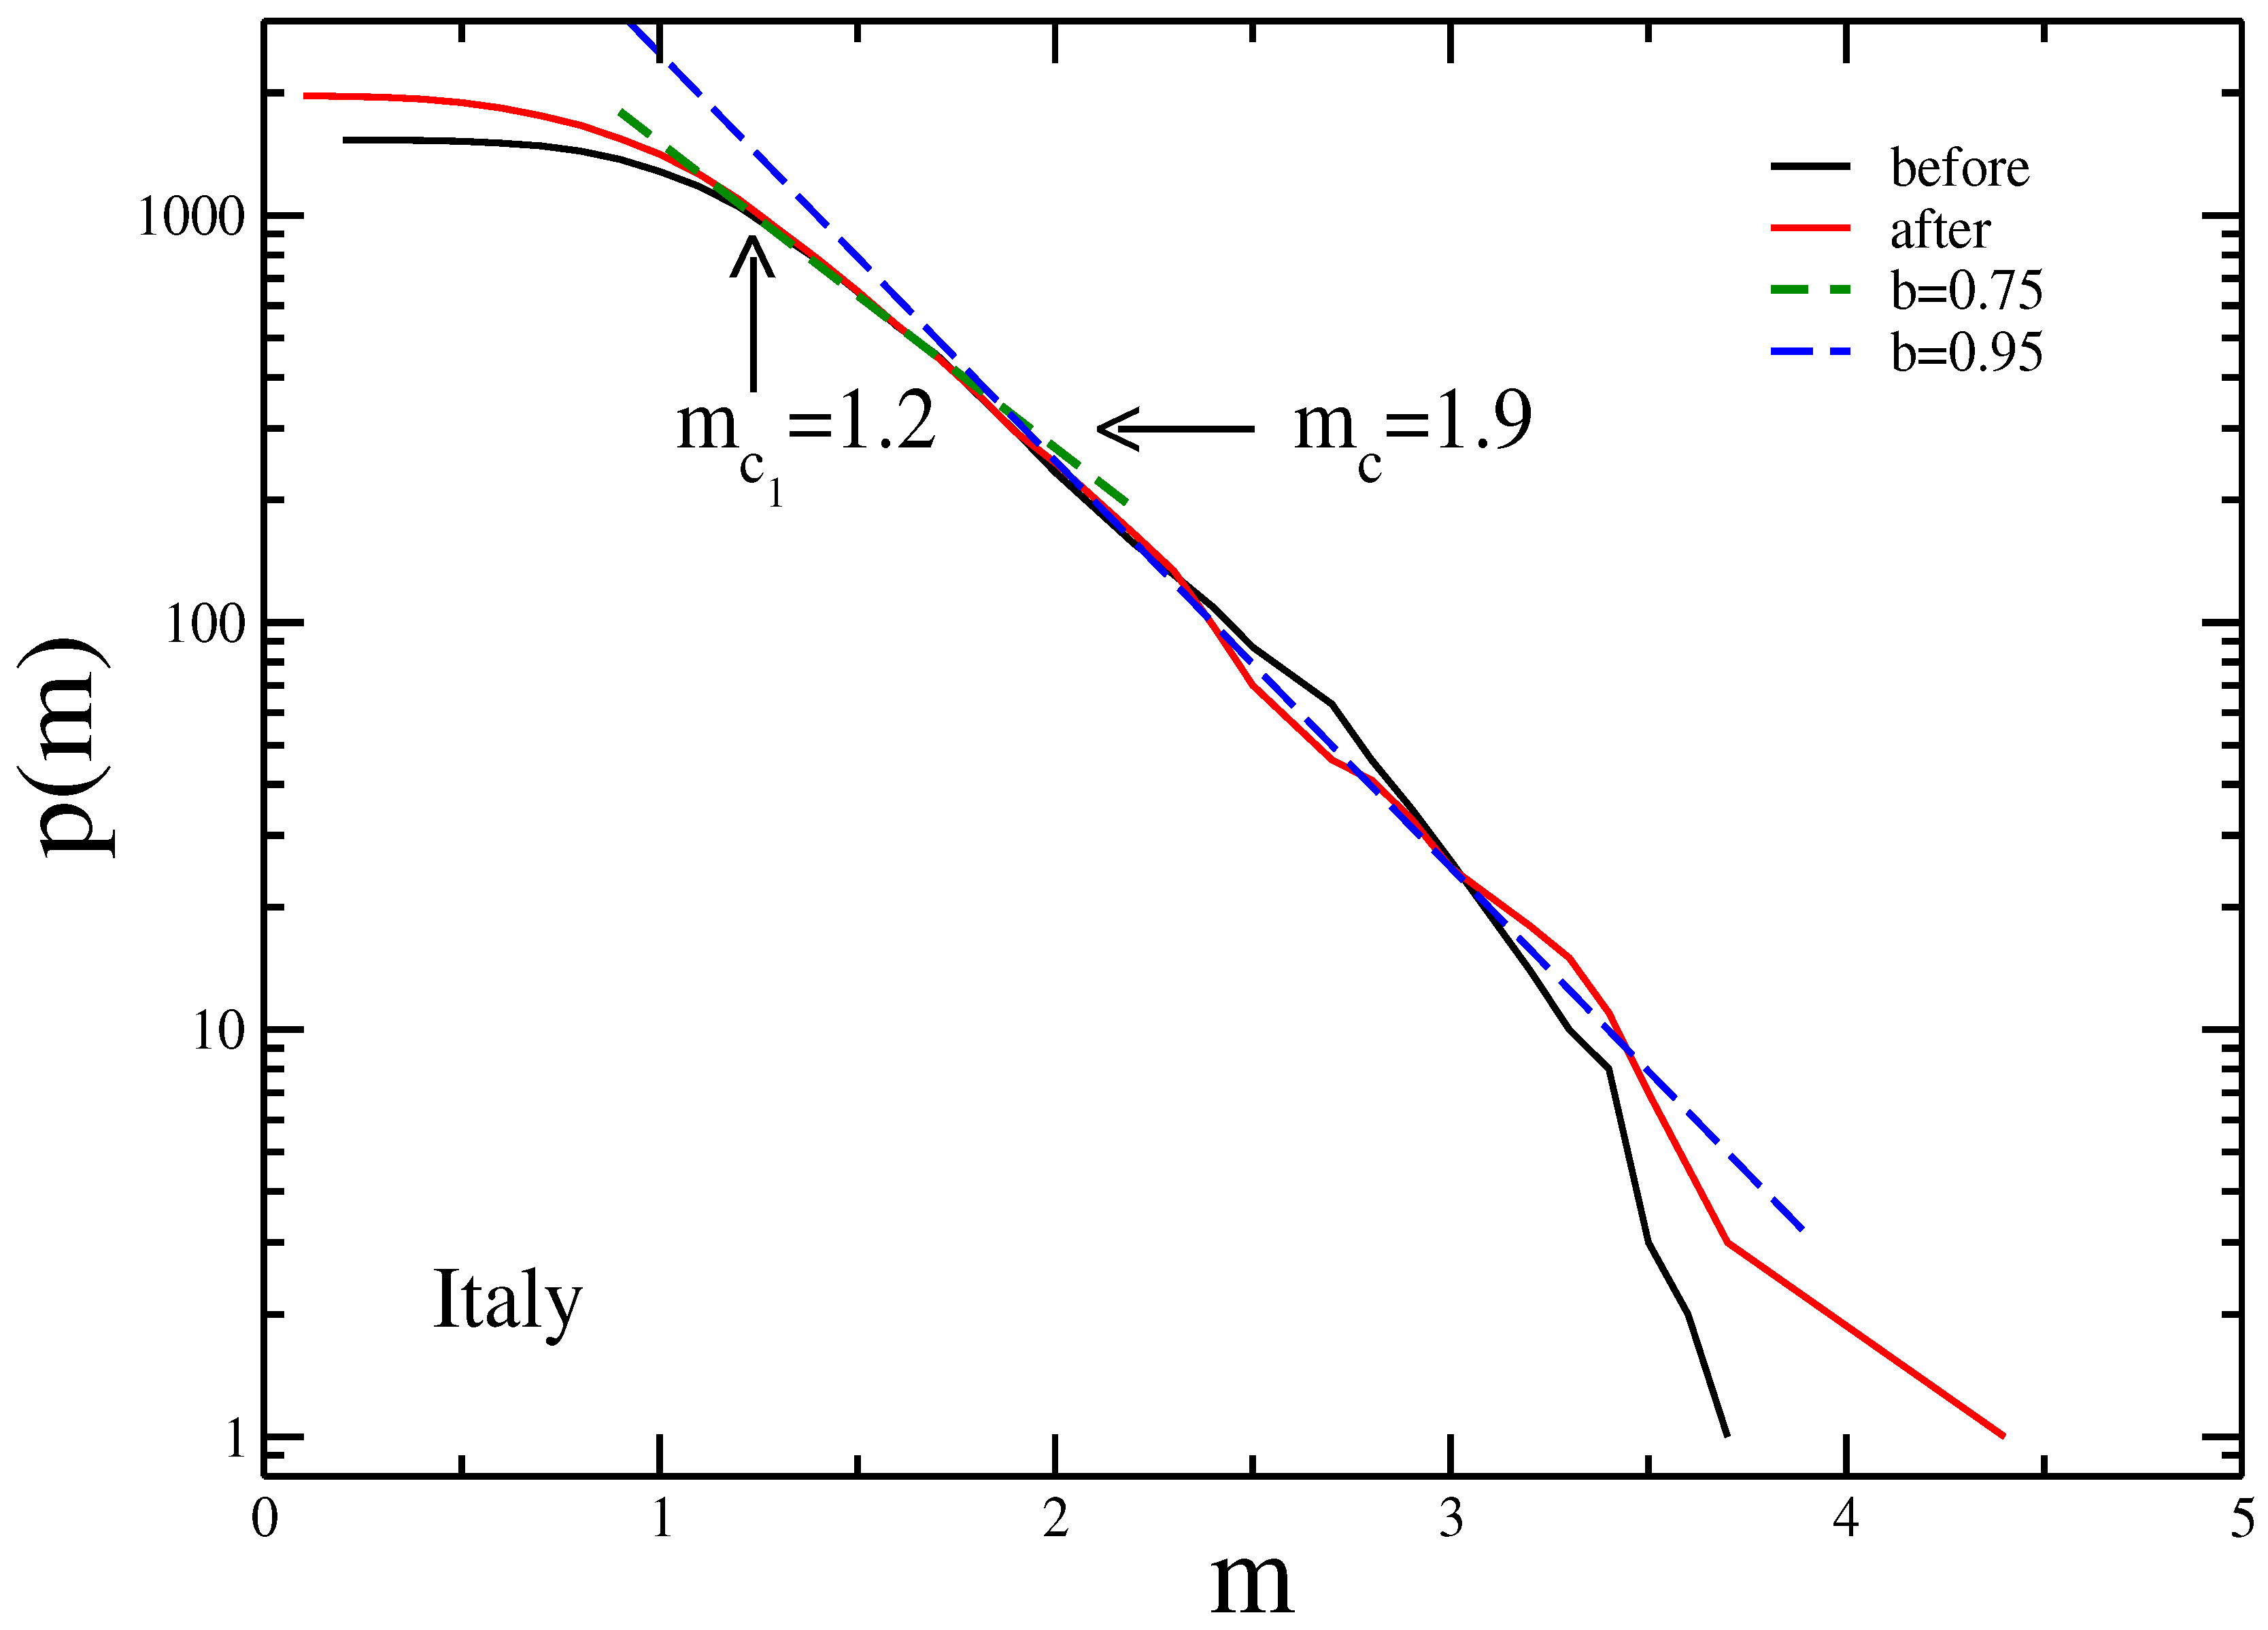
Figure 1, Figure 2 and Figure 3 show the GR distribution for each area here analysed. The blue dashed lines represent the best fit of the GR distribution obtained via the maximum likelihood method for , whereas the arrows indicate the estimated values. In all cases the fitted parameters represent a very good model of the experimental distribution revealing the robustness of our results.
Notice that for the Italian catalogue there exists a breaking point, at for both the curves, in the exponential trend of the distribution, marking two different scaling intervals. Indeed, it is possible to model the GR distribution using two different b values: 0.75 in the range , and 0.95 for . In the following, we assume for the value 1.9 and for b the value 0.95. This should guarantee the best selection of the complete portion of the catalogue.
As expected, Figure 1, Figure 2 and Figure 3 show that the relative number of events increases only in the range for each area here analysed. Nevertheless, the increased number of events is not sufficient to observe a reductions of the value, with the exception of South California. Indeed, in this case, the completeness magnitude decreases of 0.2, which is larger than the magnitude estimation error for this catalogue.
The obtained results are a clear indication that in the cases of Italy and Greece, the station sites of the seismic network, prevalently located far from the urban centres, are not strongly influenced by the anthropogenic noise. Thus, for these countries, the detection capability of the national seismic network appears to be affected mainly by the station spacing, rather than the S/N ratio.
Finally, we would like to remark that a smaller value implies the recording of a larger number of events (as an example, the decrease of 0.2 observed for South California resulted in about doubling the number of recorded earthquakes in the catalogue, as confirmed in Table 1), which allows a better estimation of the b value with a consequent improvement of the hazard assessment, and a considerable higher possibility of mapping the active seismic structures.
4. Conclusions
We have estimated the Gutenberg–Richter distribution parameters, namely the b value and the completeness magnitude , for the earthquake catalogues of Italy, South California, and Greece, during two consecutive periods: one starting from the beginning of the lockdown connected with the COVID-19 emergency, and the other right before the lockdown, encompassing an equal temporal length. The relatively high seismicity level of the three considered areas ensured a robust statistical analysis.
The increased signal to noise ratio allowed for the recording of a greater number of earthquakes with magnitude . However, this increase did not correspond to a decrease of , at least for Italy and Greece. Our observation for these two countries could be the result of the selection of the station sites—mostly well outside of the urban areas—which are not strongly affected by the anthropogenic noise even in normal periods. The larger relative increase in the number of events with for South California—resulting in a slight decrease of the completeness magnitude—could result from the relatively higher number of seismic stations located close to the urban areas, with respect to the other two regions considered. This result has strong implications for the seismic hazard assessment. Indeed, a smaller allows a better estimation of the b value, a crucial parameter in the hazard assessment, and could make the observation of foreshocks easier. The direct consequence of our result is that the detection capability of the seismic network in Italy and Greece could only be improved by incrementing the number of the seismic stations, thus significantly reducing their average spacing.
Author Contributions
All the authors contributed at the same level. All authors have read and agreed to the published version of the manuscript.
Funding
This research was partially supported by the MIUR project PRIN 2017 WZFT2p.
Institutional Review Board Statement
Not applicable.
Informed Consent Statement
Not applicable.
Data Availability Statement
Not applicable.
Conflicts of Interest
The authors declare no conflict of interest.
References
- Marzorati, S.; Bindi, D. Ambient noise levels in north central Italy. Geochem. Geophys. Geosyst. 2006, 7. [Google Scholar] [CrossRef]
- Marzorati, S.; Bindi, D. Characteristics of Ambient Noise Cross Correlations in Northern Italy within the Frequency Range of 0.1–0.6 Hz. Bull. Seismol. Soc. Am. 2008, 98, 1389–1398. [Google Scholar] [CrossRef]
- Li, H.; Bernardi, F.; Michelini, A. Surface wave dispersion measurements from ambient seismic noise analysis in Italy. Geophys. J. Int. 2010, 180, 1242–1252. [Google Scholar] [CrossRef] [Green Version]
- Vassallo, M.; Festa, G.; Bobbio, A. Seismic Ambient Noise Analysis in Southern Italy. Bull. Seismol. Soc. Am. 2012, 102, 574–586. [Google Scholar] [CrossRef]
- McNamara, D.E.; Buland, R.P. Ambient Noise Levels in the Continental United States. Bull. Seismol. Soc. Am. 2004, 94, 1517–1527. [Google Scholar] [CrossRef]
- Rydelek, P.A.; Sacks, I.S. Testing the completeness of earth- quake catalogs and the hypothesis of self-similarity. Nature 1989, 337, 251–253. [Google Scholar] [CrossRef]
- Wiemer, S.; Giardini, D.; Fäh, D.; Deichmann, N.; Sellami, S. Probabilistic seismic hazard assessment of Switzerland: Best estimates and uncertainties. J. Seismol. 2009, 13, 449–478. [Google Scholar] [CrossRef] [Green Version]
- Wiemer, S.; Schorlemmer, D. ALM: An Asperity-based Likelihood Model for California. Seismol. Res. Lett. 2007, 78, 134–140. [Google Scholar] [CrossRef]
- Mignan, A. Retrospective on the Accelerating Seismic Release (ASR) hypothesis: Controversy and new horizons. Tectonophysics 2011, 505, 1–16. [Google Scholar] [CrossRef]
- Scholz, C. The frequency-magnitude relation of microfracturing in rock and its relation to earthquakes. Bull. Seism. Soc. Am. 1968, 58, 399–415. [Google Scholar]
- Xiao, H.; Eilon, Z.C.; Ji, C.; Tanimoto, T. COVID-19 Societal Response Captured by Seismic Noise in China and Italy. Seismol. Res. Lett. 2020, 91, 2757–2768. [Google Scholar] [CrossRef]
- Marzorati, S. Riduzione dei Livelli di Rumore Sismico Ambientale Nelle Città Italiane e Stima Dell’Effetto Sulla Capacità di Rilevamento Della Rete Sismica Nazionale a Seguito Delle Misure Restrittive COVID-19 del Febbraio-Marzo 2020; Open File Report; Istituto Nazionale di Geofisica e Vulcanologia—Osservatorio Nazionale Terremoti: Rome, Italy, 2020. [Google Scholar]
- Lecocq, T.; Hicks, S.P.; Van Noten, K.; van Wijk, K.; Koelemeijer, P.; De Plaen, R.S.M.; Massin, F.; Hillers, G.; Anthony, R.E.; Apoloner, M.T.; et al. Global quieting of high-frequency seismic noise due to COVID-19 pandemic lockdown measures. Science 2020, 369, 1338–1343. [Google Scholar] [CrossRef]
- Yabe, S.; Imanishi, K.; Nishida, K. Two-step seismic noise reduction caused by COVID-19 induced reduction in social activity in metropolitan Tokyo, Japan. Earth Planets Space 2020, 72, 1880–5981. [Google Scholar] [CrossRef]
- Mavroulis, S.; Mavrouli, M.; Lekkas, E. Geological and hydrometeorological hazards and related disasters amid COVID-19 pandemic in Greece: Post-disaster trends and factors affecting the COVID-19 evolution in affected areas. Saf. Sci. 2021, 138, 105236. [Google Scholar] [CrossRef]
- Roy, K.S.; Sharma, J.; Kumar, S.; Kumar, M.R. Effect of coronavirus lockdowns on the ambient seismic noise levels in Gujarat, northwest India. Sci. Rep. 2021, 11, 7148. [Google Scholar] [CrossRef] [PubMed]
- Salvage, R.O.; Eaton, D.W. Unprecedented quiescence in resource development area allows detection of long-lived latent seismicity. Solid Earth 2021, 12, 765–783. [Google Scholar] [CrossRef]
- Piccinini, D.; Giunchi, C.; Olivieri, M.; Frattini, F.; Di Giovanni, M.; Prodi, G.; Chiarabba, C. COVID-19 lockdown and its latency in Northern Italy: Seismic evidence and socio-economic interpretation. Sci. Rep. 2020, 10, 16487. [Google Scholar] [CrossRef] [PubMed]
- Godano, C. A new method for the estimation of the completeness magnitude. Phys. Earth Planet. Inter. 2017, 263, 7–11. [Google Scholar] [CrossRef]
- Wiemer, S.; Wyss, M. Minimum Magnitude of Completeness in Earthquake Catalogs: Examples from Alaska, the Western United States, and Japan. Bull. Seismol. Soc. Am. 2000, 90, 859–869. [Google Scholar] [CrossRef]
- Aki, K. Maximum likelihood estimate of b in the formula logN = a − bM and its confidence limits. Bull. Earthq. Res. Inst. Univ. Tokyo 1965, 43, 237–239. [Google Scholar]
- Shi, Y.; Bolt, B.A. The standard error of the magnitude-frequency b value. Bull. Seismol. Soc. Am. 1982, 72, 1677–1687. Available online: http://xxx.lanl.gov/abs/http://www.bssaonline.org/content/72/5/1677.full.pdf+html (accessed on 20 April 2021).
Figure 1.
The Gutenberg–Richter distribution for the Italian catalogue. The blue dashed line represents the fit for . The green dashed line represents the fit in the interval (see text for details).
Figure 1.
The Gutenberg–Richter distribution for the Italian catalogue. The blue dashed line represents the fit for . The green dashed line represents the fit in the interval (see text for details).

Figure 2.
The Gutenberg–Richter distribution for the South California catalogue. The dashed line represents the fit for .
Figure 2.
The Gutenberg–Richter distribution for the South California catalogue. The dashed line represents the fit for .

Figure 3.
The Gutenberg–Richter distribution for the Greece catalogue. The dashed line represents the fit for .
Figure 3.
The Gutenberg–Richter distribution for the Greece catalogue. The dashed line represents the fit for .


Table 1.
The time interval and the number of events before and after the lockdown date for each area here analysed. All the periods refers to 2020.
Table 1.
The time interval and the number of events before and after the lockdown date for each area here analysed. All the periods refers to 2020.
| Area | Before | After | ||
|---|---|---|---|---|
| Analysed Period | Analysed Period | |||
| Italy | 25 January–9 March | 1533 | 10 March–22 April | 1967 |
| South California | 2 February–18 March | 3622 | 19 March–27 April | 5254 |
| Greece | 10 February–21 March | 1636 | 22 March–2 May | 1796 |
Table 2.
The values of , b and before and after the lockdown dates for each area here investigated.
| Area | Before | After | ||||
|---|---|---|---|---|---|---|
| Italy | 1.9 | 0.95 | 4.9 | 1.9 | 0.95 | 5 |
| South California | 1.1 | 0.91 | 2 | 0.9 | 0.88 | 1.6 |
| Greece | 2.2 | 0.73 | 2.8 | 2.2 | 0.74 | 2.9 |
Publisher’s Note: MDPI stays neutral with regard to jurisdictional claims in published maps and institutional affiliations. |
© 2021 by the authors. Licensee MDPI, Basel, Switzerland. This article is an open access article distributed under the terms and conditions of the Creative Commons Attribution (CC BY) license (https://creativecommons.org/licenses/by/4.0/).
Share and Cite
MDPI and ACS Style
Godano, C.; Convertito, V.; Pino, N.A. The Signal to Noise Ratio and the Completeness Magnitude: The Effect of the COVID-19 Lockdown. Atmosphere 2021, 12, 525. https://0-doi-org.brum.beds.ac.uk/10.3390/atmos12050525
AMA Style
Godano C, Convertito V, Pino NA. The Signal to Noise Ratio and the Completeness Magnitude: The Effect of the COVID-19 Lockdown. Atmosphere. 2021; 12(5):525. https://0-doi-org.brum.beds.ac.uk/10.3390/atmos12050525
Chicago/Turabian StyleGodano, Cataldo, Vincenzo Convertito, and Nicola Alessandro Pino. 2021. "The Signal to Noise Ratio and the Completeness Magnitude: The Effect of the COVID-19 Lockdown" Atmosphere 12, no. 5: 525. https://0-doi-org.brum.beds.ac.uk/10.3390/atmos12050525
Note that from the first issue of 2016, this journal uses article numbers instead of page numbers. See further details here.