
Climatological Increased Precipitation from July to August in the Western North Pacific Region Simulated by CMIP6 Models


International Center for Climate and Environment Sciences, Institute of Atmospheric Physics, Chinese Academy of Sciences, Beijing 100029, China
*
Author to whom correspondence should be addressed.
Atmosphere 2021, 12(6), 664; https://0-doi-org.brum.beds.ac.uk/10.3390/atmos12060664
Submission received: 30 April 2021
/
Revised: 13 May 2021
/
Accepted: 17 May 2021
/
Published: 22 May 2021
(This article belongs to the Special Issue Asian Summer Monsoon Variability, Teleconnections and Projections)
Abstract
:In this study, the climatological precipitation increase from July to August over the western North Pacific (WNP) region was investigated through observations and simulations in the Coupled Model Intercomparison Project Phase 6 (CMIP6), atmospheric model simulations and historical experiments. Firstly, observational analysis showed that the precipitation increase is associated with a decrease in the local sea surface temperature (SST), indicating that the precipitation increase is not driven by the change in SST. In addition, the pattern of precipitation increase is similar to the vertical motion change at 500-hPa, suggesting that the precipitation increase is related to the circulation change. Moisture budget analysis further confirmed this relation. In addition to the observational analysis, the outputs from 26 CMIP6 models were further evaluated. Compared with atmospheric model simulations, air–sea coupled models largely improve the simulation of the climatological precipitation increase from July to August. Furthermore, model simulations confirmed that the bias in the precipitation increase is intimately associated with the circulation change bias. Thus, two factors are responsible for the bias of the precipitation increase from July to August in climate models: air–sea coupling processes and the performance in vertical motion change.
1. Introduction
The tropical western Pacific is the region with the highest sea surface temperature around the globe and is denoted as the western Pacific warm pool. The western North Pacific (WNP) summer monsoon (WNPSM) is an important component of the broad Asian summer monsoon. The WNPSM is regarded as an oceanic monsoon and is driven primarily by meridional gradients of sea surface temperature (SST) [1,2,3,4]. In boreal summer, the intensity and location of the convection activities above the warm pool and WNP regions can largely impact the summer climate in East Asia through the so-called Pacific–Japan teleconnection pattern [5,6,7]. The summer mean climate variability has been extensively investigated in previous studies. For example, the interannual variability of the WNP and East Asian summer climate is largely modulated by the El Niño–Southern Oscillation (ENSO) [8], especially during El Niño decaying summers, through a huge anomalous anticyclone over the Philippine Sea. The anticyclone, formed from the El Niño’s developing autumn, can maintain through the El Niño’s mature winter to the subsequent summer. The mechanisms of formation and maintenance of this anomalous anticyclone have been extensively studied [9,10,11,12,13,14].
Although most previous studies considered the summer mean climate in the WNP and East Asia regions as a whole, only a few previous studies have investigated its sub-seasonal variability. The WNPSM also has pronounced sub-seasonal variability and should not be neglected. For instance, climatologically, from June to July, after the South China Sea monsoon outbreaks, warm pool convection intensifies and expands northward. The ridge line of the western Pacific subtropical high (WPSH) is located between 20 and 25° N, and the Mei-Yu season begins. In the late summer in East Asia (from July to August), the warm pool convection strengthens and moves north-eastward suddenly, with the outbreak of the western North Pacific monsoon terminating the Mei-Yu season from the Yangtze River Valley to Japan [15,16]. Although the Mei-Yu season usually occurs from June to July, the changes in circulation and precipitation from July to August can have a very large impact on human lives [17,18]. For example, in July 1998, shortly after the Mei-Yu front moved to northern China, it moved back to the middle and lower basins for a second time and caused continuous, strong precipitation [19,20]. Moreover, the modes of the WPSH also differ between early and late summer [21]. From July to August, the anomalous WPSH and its associated precipitation show more notable interannual variabilities [22], with a more significant effect on local climate anomalies. For example, in the late summer of 2013, the WPSH occurred further north than its normal location, causing an anomalous strong heat wave in the Yangtze River Valley. The influence of ENSO on the East Asian climate and WPSH also evolves across the season of the monsoon circulation [23]. A recent study investigated the interannual variation in the zonal displacement of the WPSH from early to late summer [24]. All these studies demonstrate that the sub-seasonal variation in the atmospheric variables (e.g., precipitation) and circulation (e.g., WPSH) in the WNP and East Asia from July to August should be considered and investigated.
Climate models are essential tools for the climate research community. The performance of different phases of the Coupled Model Intercomparison Project (CMIP) in the simulation of the summer climate and associated circulation in the WNP and East Asia has been extensively and systematically evaluated in previous studies [25,26,27,28]. For the sub-seasonal scale, previous studies have shown that the month-to-month northward shifts of the WPSH can be reasonably reproduced, while it is a great challenge for large amounts of CMIP Phase 5 (CMIP5) models to simulate the zonal shifts of the WPSH from early to late summer [29]. Moreover, compared with atmospheric models driven by the prescribed sea surface temperature (SST, the so-called Atmospheric Model Intercomparison Project (AMIP) type simulation), air–sea coupled climate models have shown better performances in reproducing the sub-seasonal variation in WPSH and associated precipitation [30]. Although these preliminary conclusions can be drawn concerning the sub-seasonal scale, the sub-seasonal variation in the WPSH and associated precipitation in the WNP and East Asia are relatively lower than the summer mean and deserve further research. Thus, in this study, experiments involving multiple CMIP Phase 6 (CMIP6) models, including AMIP simulations and historical simulations, were adopted to investigate the performance of CMIP6 models in reproducing the climatological sub-seasonal variation in the precipitation and associated circulation in the WNP and East Asian regions.
2. Experiments, Data and Methods
AMIP-type simulations and historical simulations involving 26 CMIP6 models are adopted in this study. These models are selected so that all necessary variables (precipitation and vertical velocity at 500-hPa), in both AMIP and historical simulations, would be available for analysis in this study. Detailed information on these models is provided in Table 1 and Table 2. The model data come from AMIP (historical) experiments, involving 26 CMIP6 GCMs of the recent period 1979–2014 (1850–2014). Basic information on the models and experiments is given in Table 1. Further details can be found in [31,32] and are available online at https://www.wcrp-climate.org/wgcm-cmip (accessed on 20 October 2020).
The following monthly observational and reanalysis datasets are adopted in this study. The precipitation dataset we used is a widely-used dataset, the Global Precipitation Climatology Project (GPCP) 2.5° precipitation version 2.3 [33]. Multiple variables are used, including the horizontal and vertical velocity, specific humidity, and surface fluxes (longwave/short wave radiation, sensible and latent heat fluxes). In this study, we use the National Centers for Environmental Prediction (NCEP)–Department of Energy (DOE) Reanalysis 2, which is an improved version of the NCEP Reanalysis 1 model, with fixed errors and updated parameterizations of physical processes [34]. The monthly global 2° × 2° Extended Reconstructed Sea Surface Temperature (ERSST) version 5 SST dataset is also adopted [35]. Data concerning the common period 1979–2014 covered by both observational datasets and model simulations are extracted from all datasets. For evaporation fields, there are no direct outputs from NCPE-DOE, so we calculate the evaporation field using the latent heat flux [36]. The relation between the latent heat flux (LH) and surface evaporation (E) can be written as:
where is the latent heat of the vaporization of water.
Moisture budget analysis is adopted in this study to examine the reason for the climatological precipitation increase from July to August in the WNP region. The formula is adopted from previous studies [36,37] and is briefly described here:
where and denote the precipitation, evaporation, specific humidity, vertical velocity, and horizontal wind, respectively; res is the residual. The angle brackets stand for vertical integration. The overbar denotes for the climatology in July, and a prime denotes the change from July to August.
The evaluation of the model performance in the focused region is based on the method shown in [25,38,39,40]:
where R is the pattern correlation between the observation and model simulation, SDR is the ratio of spatial standard deviation (SDR) of the model against observation. R quantifies the similarity of the distribution of a spatial pattern to the observations, while SDR quantifies the amplitude of a spatial pattern to the observations. Under this definition, for any given variance, the skill score should increase monotonically with increasing correlation, and for any given correlation, the skill score should increase as the modeled variance approaches the observed variance. Under this definition, skill decreases toward zero as the correlation becomes more and more negative, or as the SDR approaches either zero or infinity. Skill increases toward one as the correlation becomes more and more positive, or as the model variance approaches the observed variance. This evaluation method is thought to be reasonable and is adopted here due to the fact that both the magnitude and spatial distribution of the simulation are considered.
3. Results
3.1. Observation
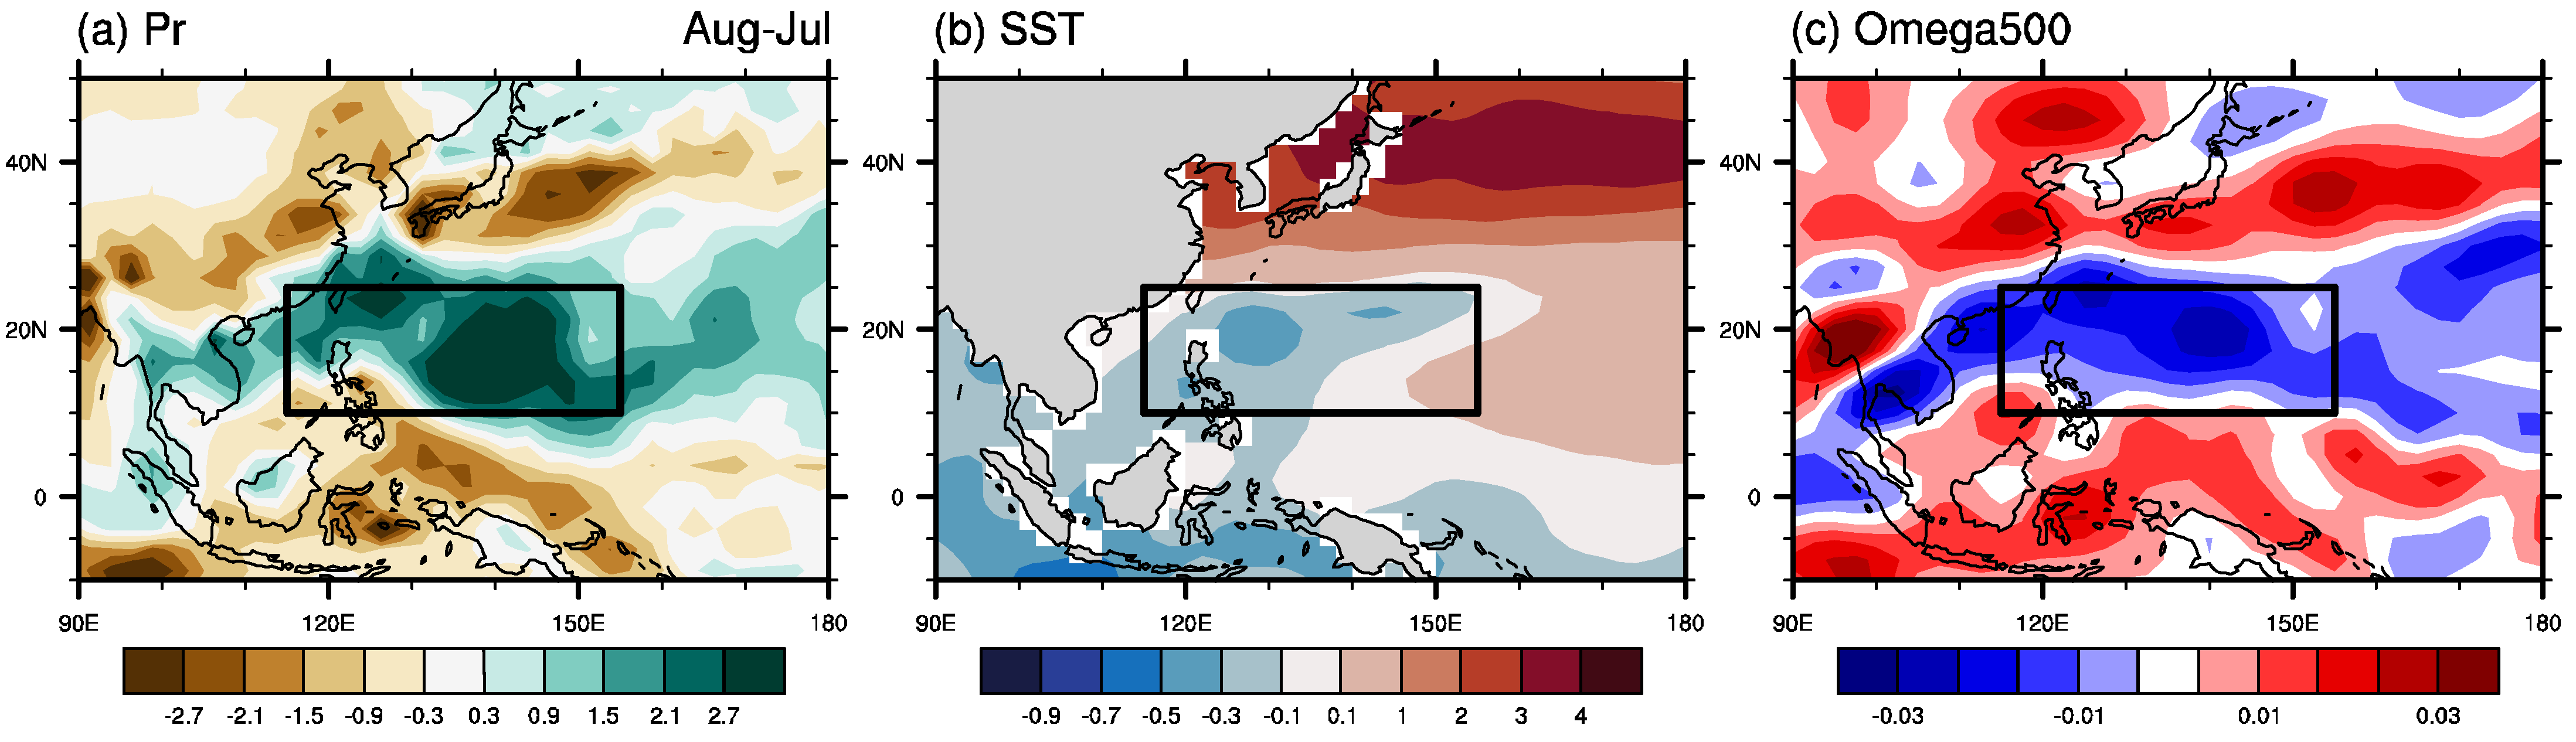
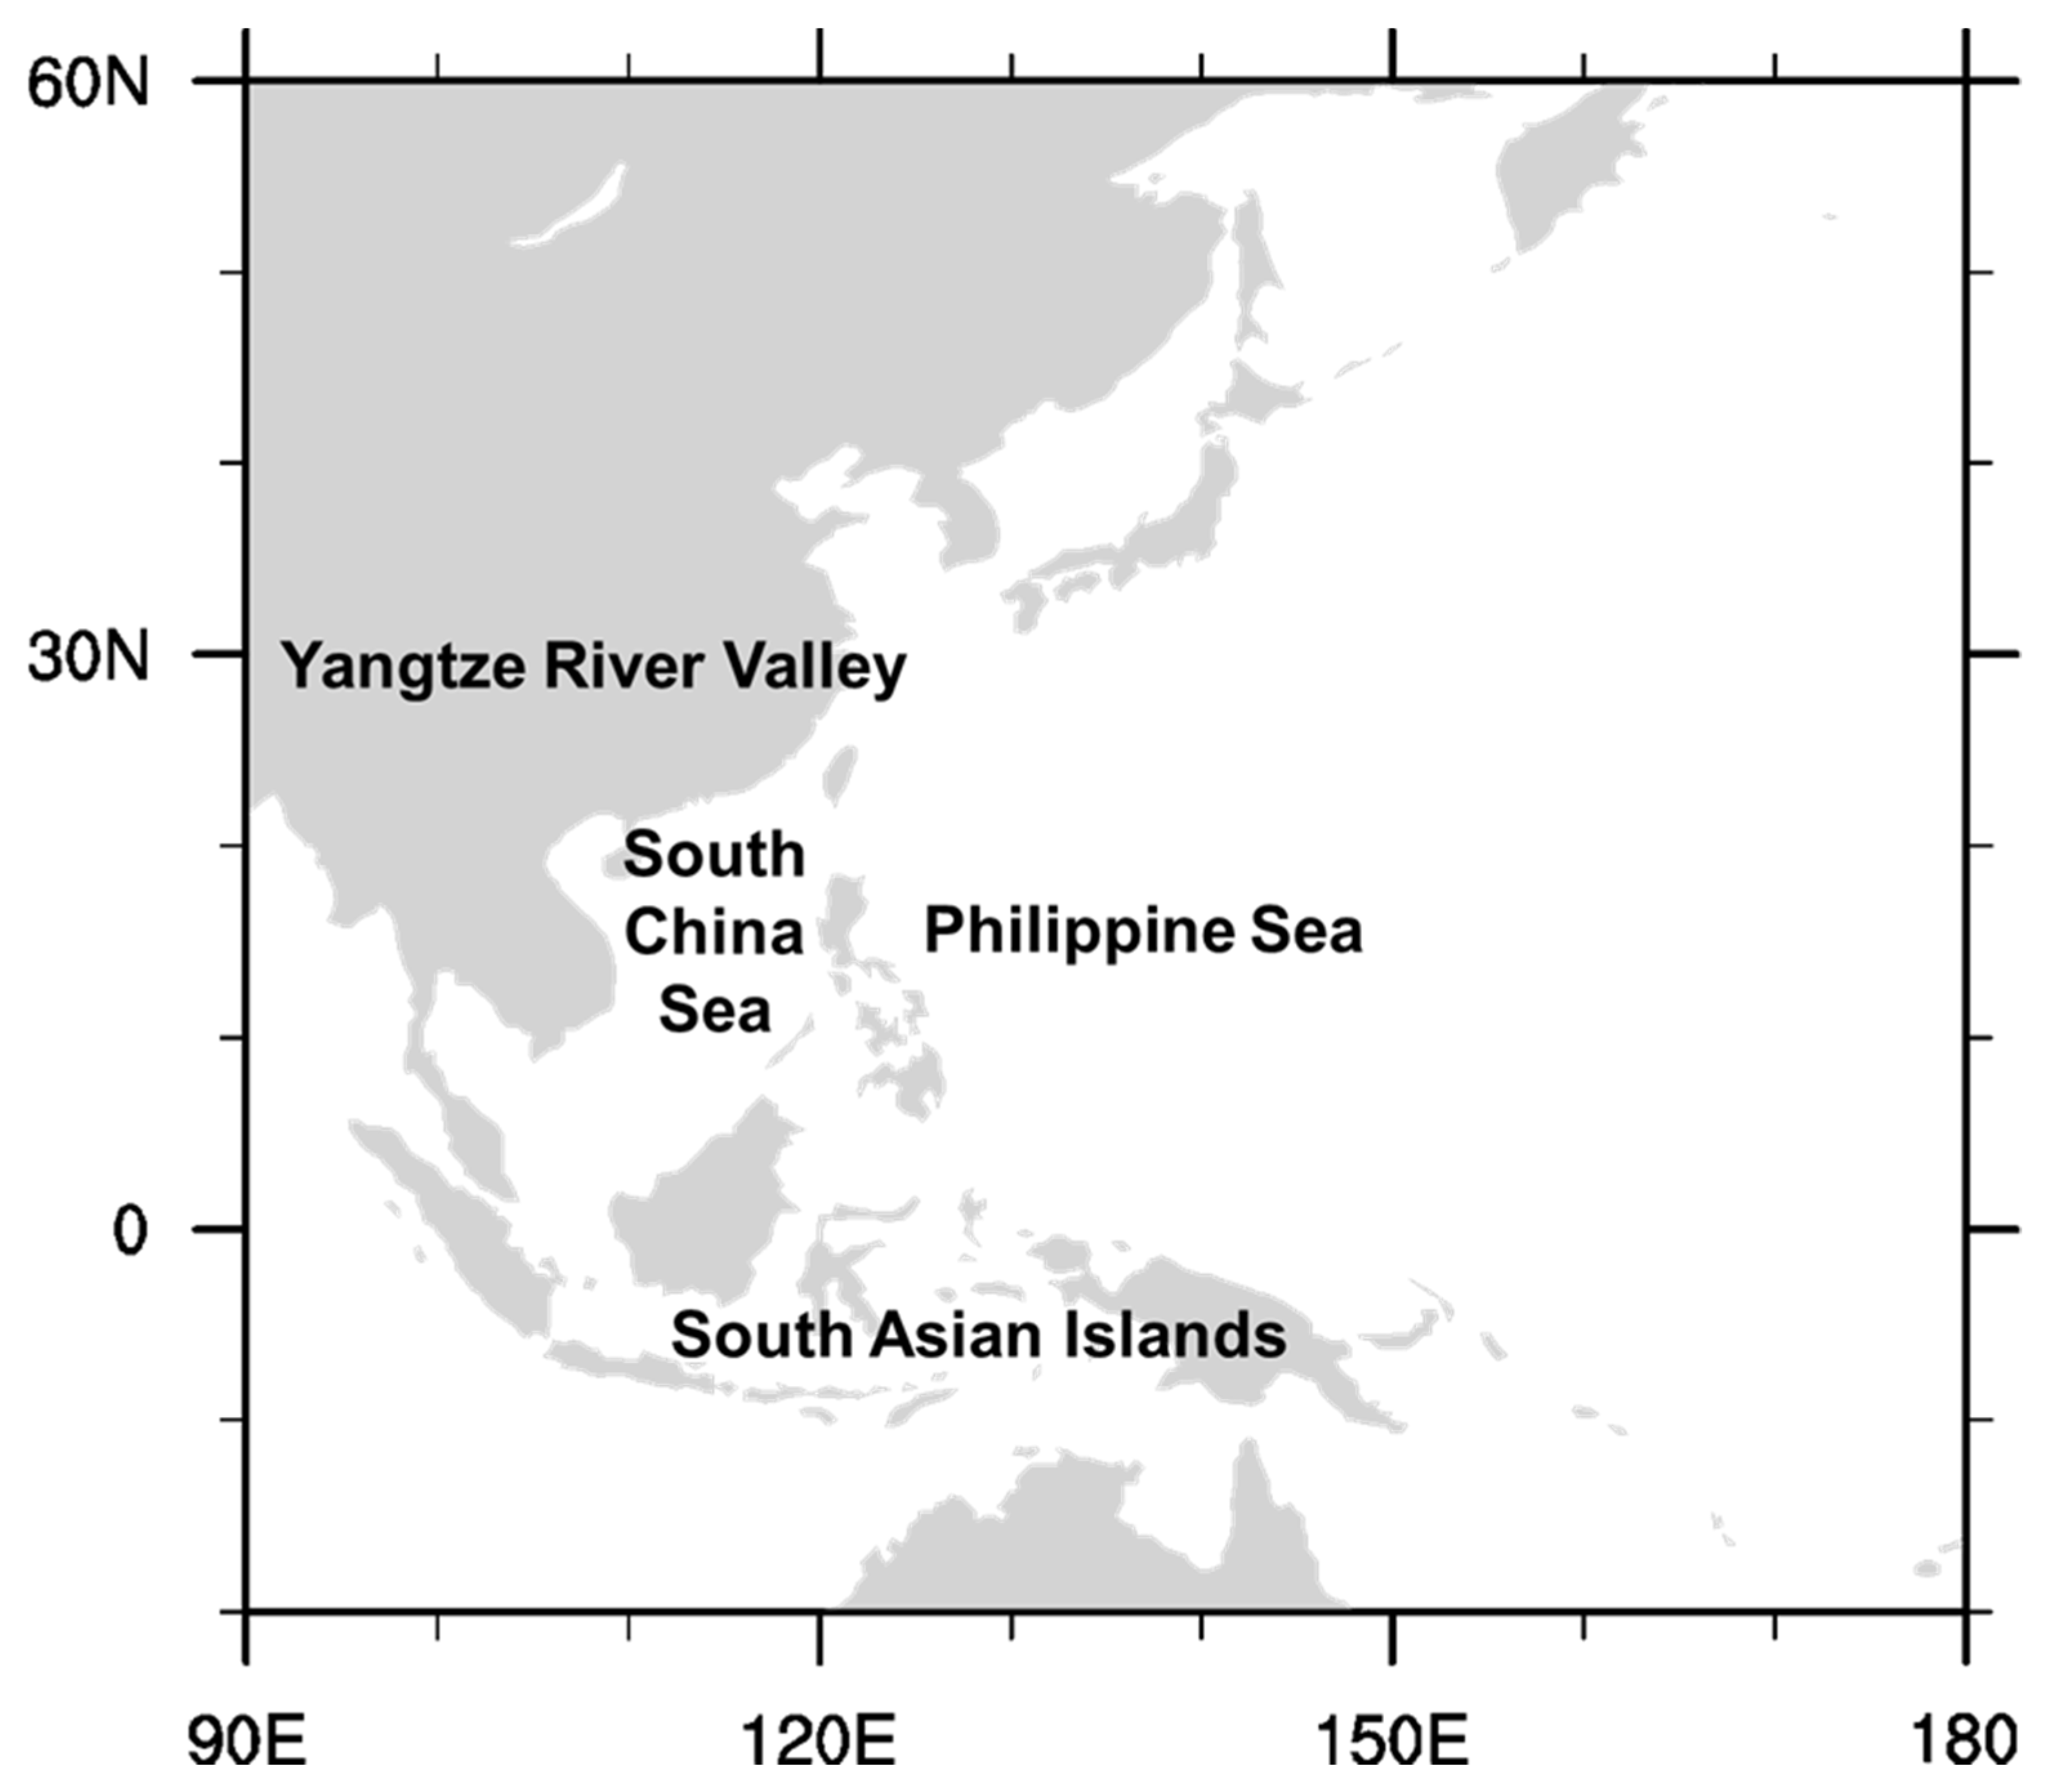
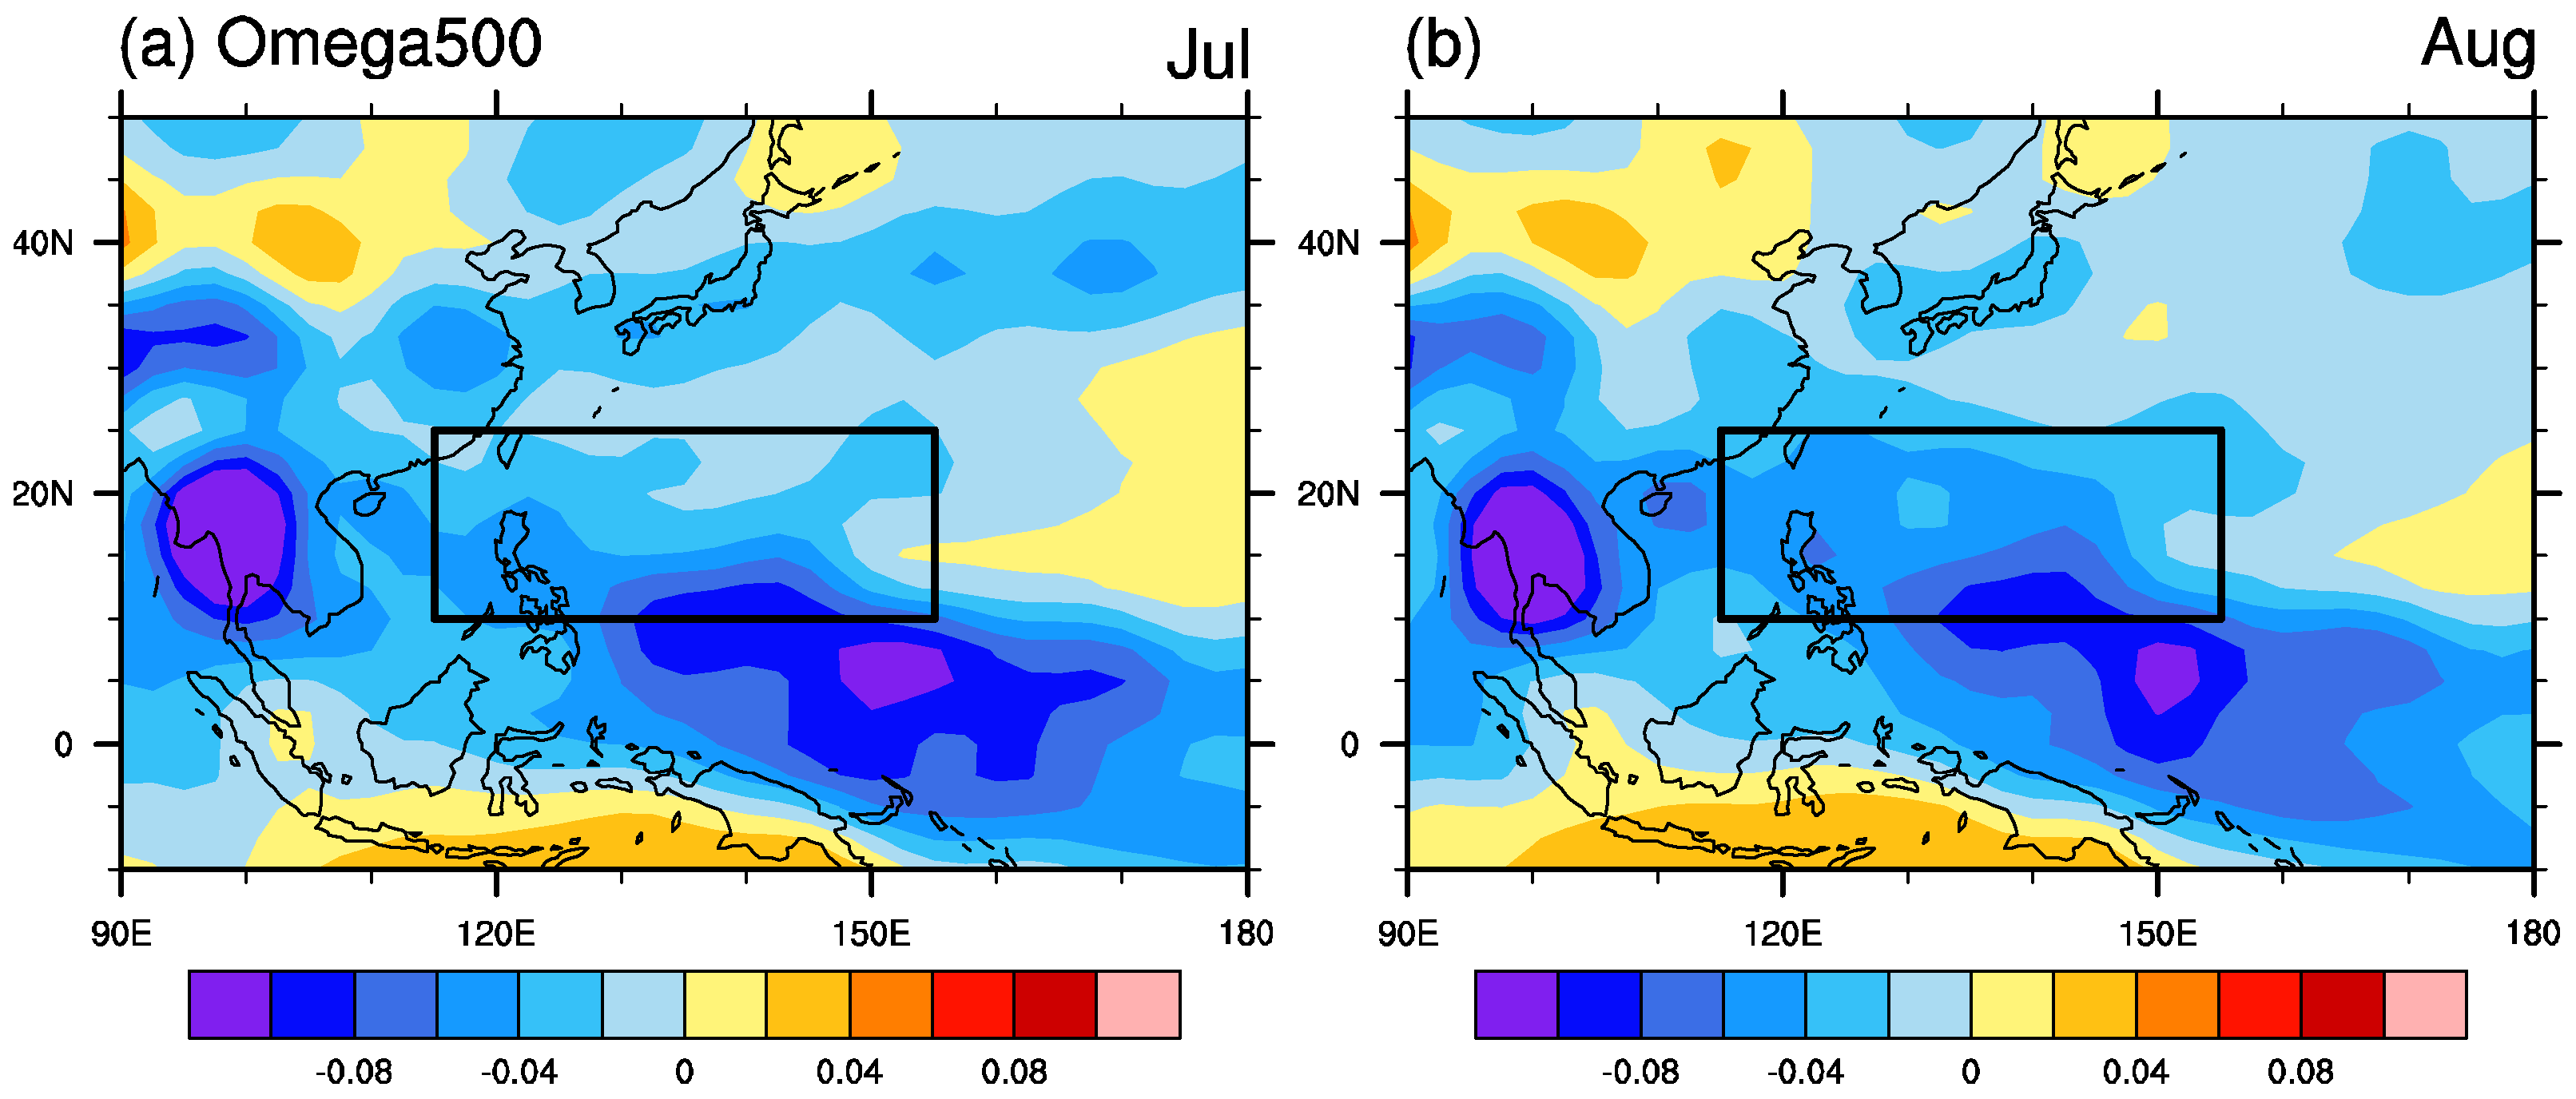
Figure 1a shows the observed difference in precipitation between August and July in the western North Pacific region. An increased precipitation center exists from the northern part of the South China Sea to the Philippine Sea. To the north and south of this increased precipitation center, there are two east-west-oriented negative precipitation centers in the Yangtze River Valley, along the way to Japan and the southeast Asian Islands. The geography mentioned here are shown in Figure 2. This precipitation change from July to August is intimately associated with the change in vertical motion. As shown in Figure 1c, the increased precipitation is almost located in the regions where upward motion strengthens from July to August. Meanwhile, the decreased precipitation belts are associated with the downward motion strengthening from July to August. The climatological vertical motion in July and August is upward motion over the broad region in the western North Pacific (Figure 3), indicating that in boreal summer the convection activity dominates this region, which can further impact the East Asia climate. Although the maximum convection activity and associated upward motion in the middle layer are located over the tropical region, the center of the precipitation increase from July to August is located to the north of the maximum convection center, which is the region focused on in the following analysis.
The climatological precipitation change from June to July and from July to August, along with the simulation performances in the uncoupled Atmospheric General Circulation Model (AGCM) and coupled CMIP5 models, have been examined in a previous study [30]. The author found that from June to July, the local SST increases, thus in AGCMs the positive precipitation center can be reproduced very well. However, from July to August, as shown in Figure 1b, the local SST decreases. It is argued that, for this reason, AGCMs cannot capture the increasing precipitation center from July to August well. Compared with AGCMs, coupled models can largely improve the increasing precipitation simulation. This sub-seasonal configuration between precipitation change and SST change is essential in order to understand the air–sea coupling process in the western North Pacific region.
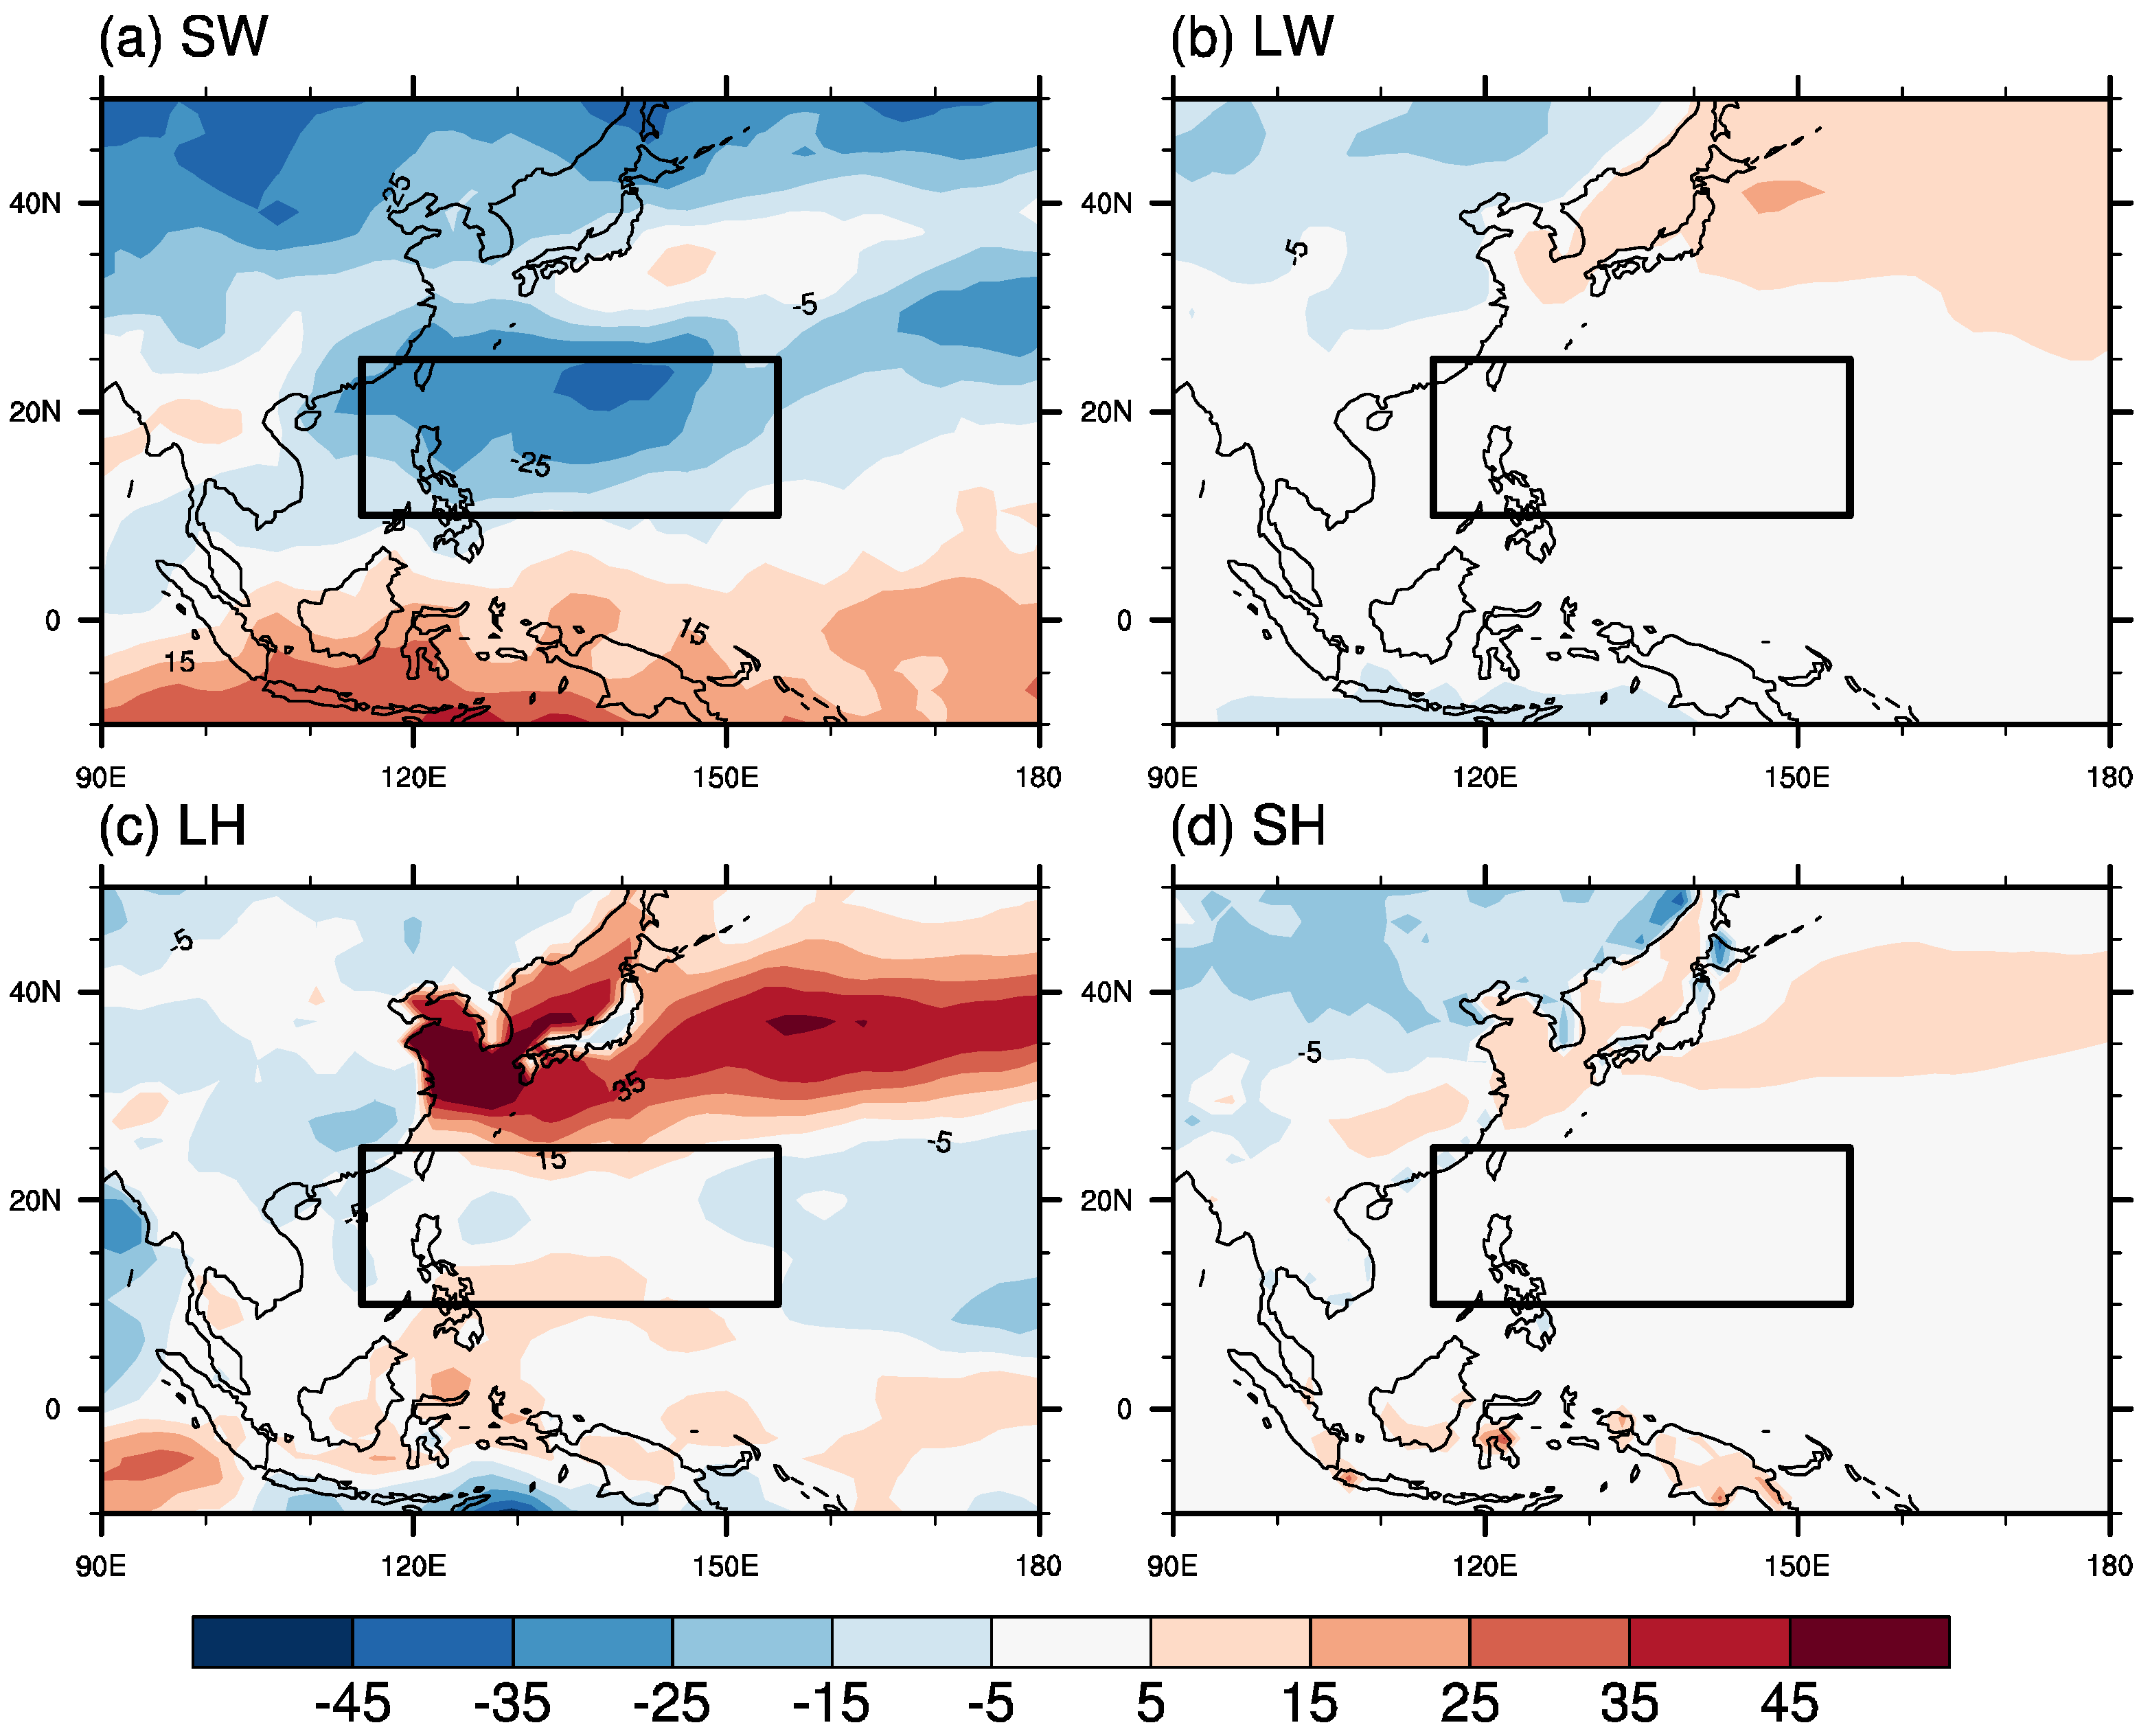
Figure 4 shows the climatological flux change in the air–sea interface from July to August, including shortwave, longwave, latent heat, and sensible heat. The most prominent change from July to August is a downward shortwave decrease, which results from the increasing precipitation and associated convection activity. Thus, it is the precipitation increase that causes SST cooling, which can further confirm the failure of AGCMs in reproducing the precipitation change from July to August.
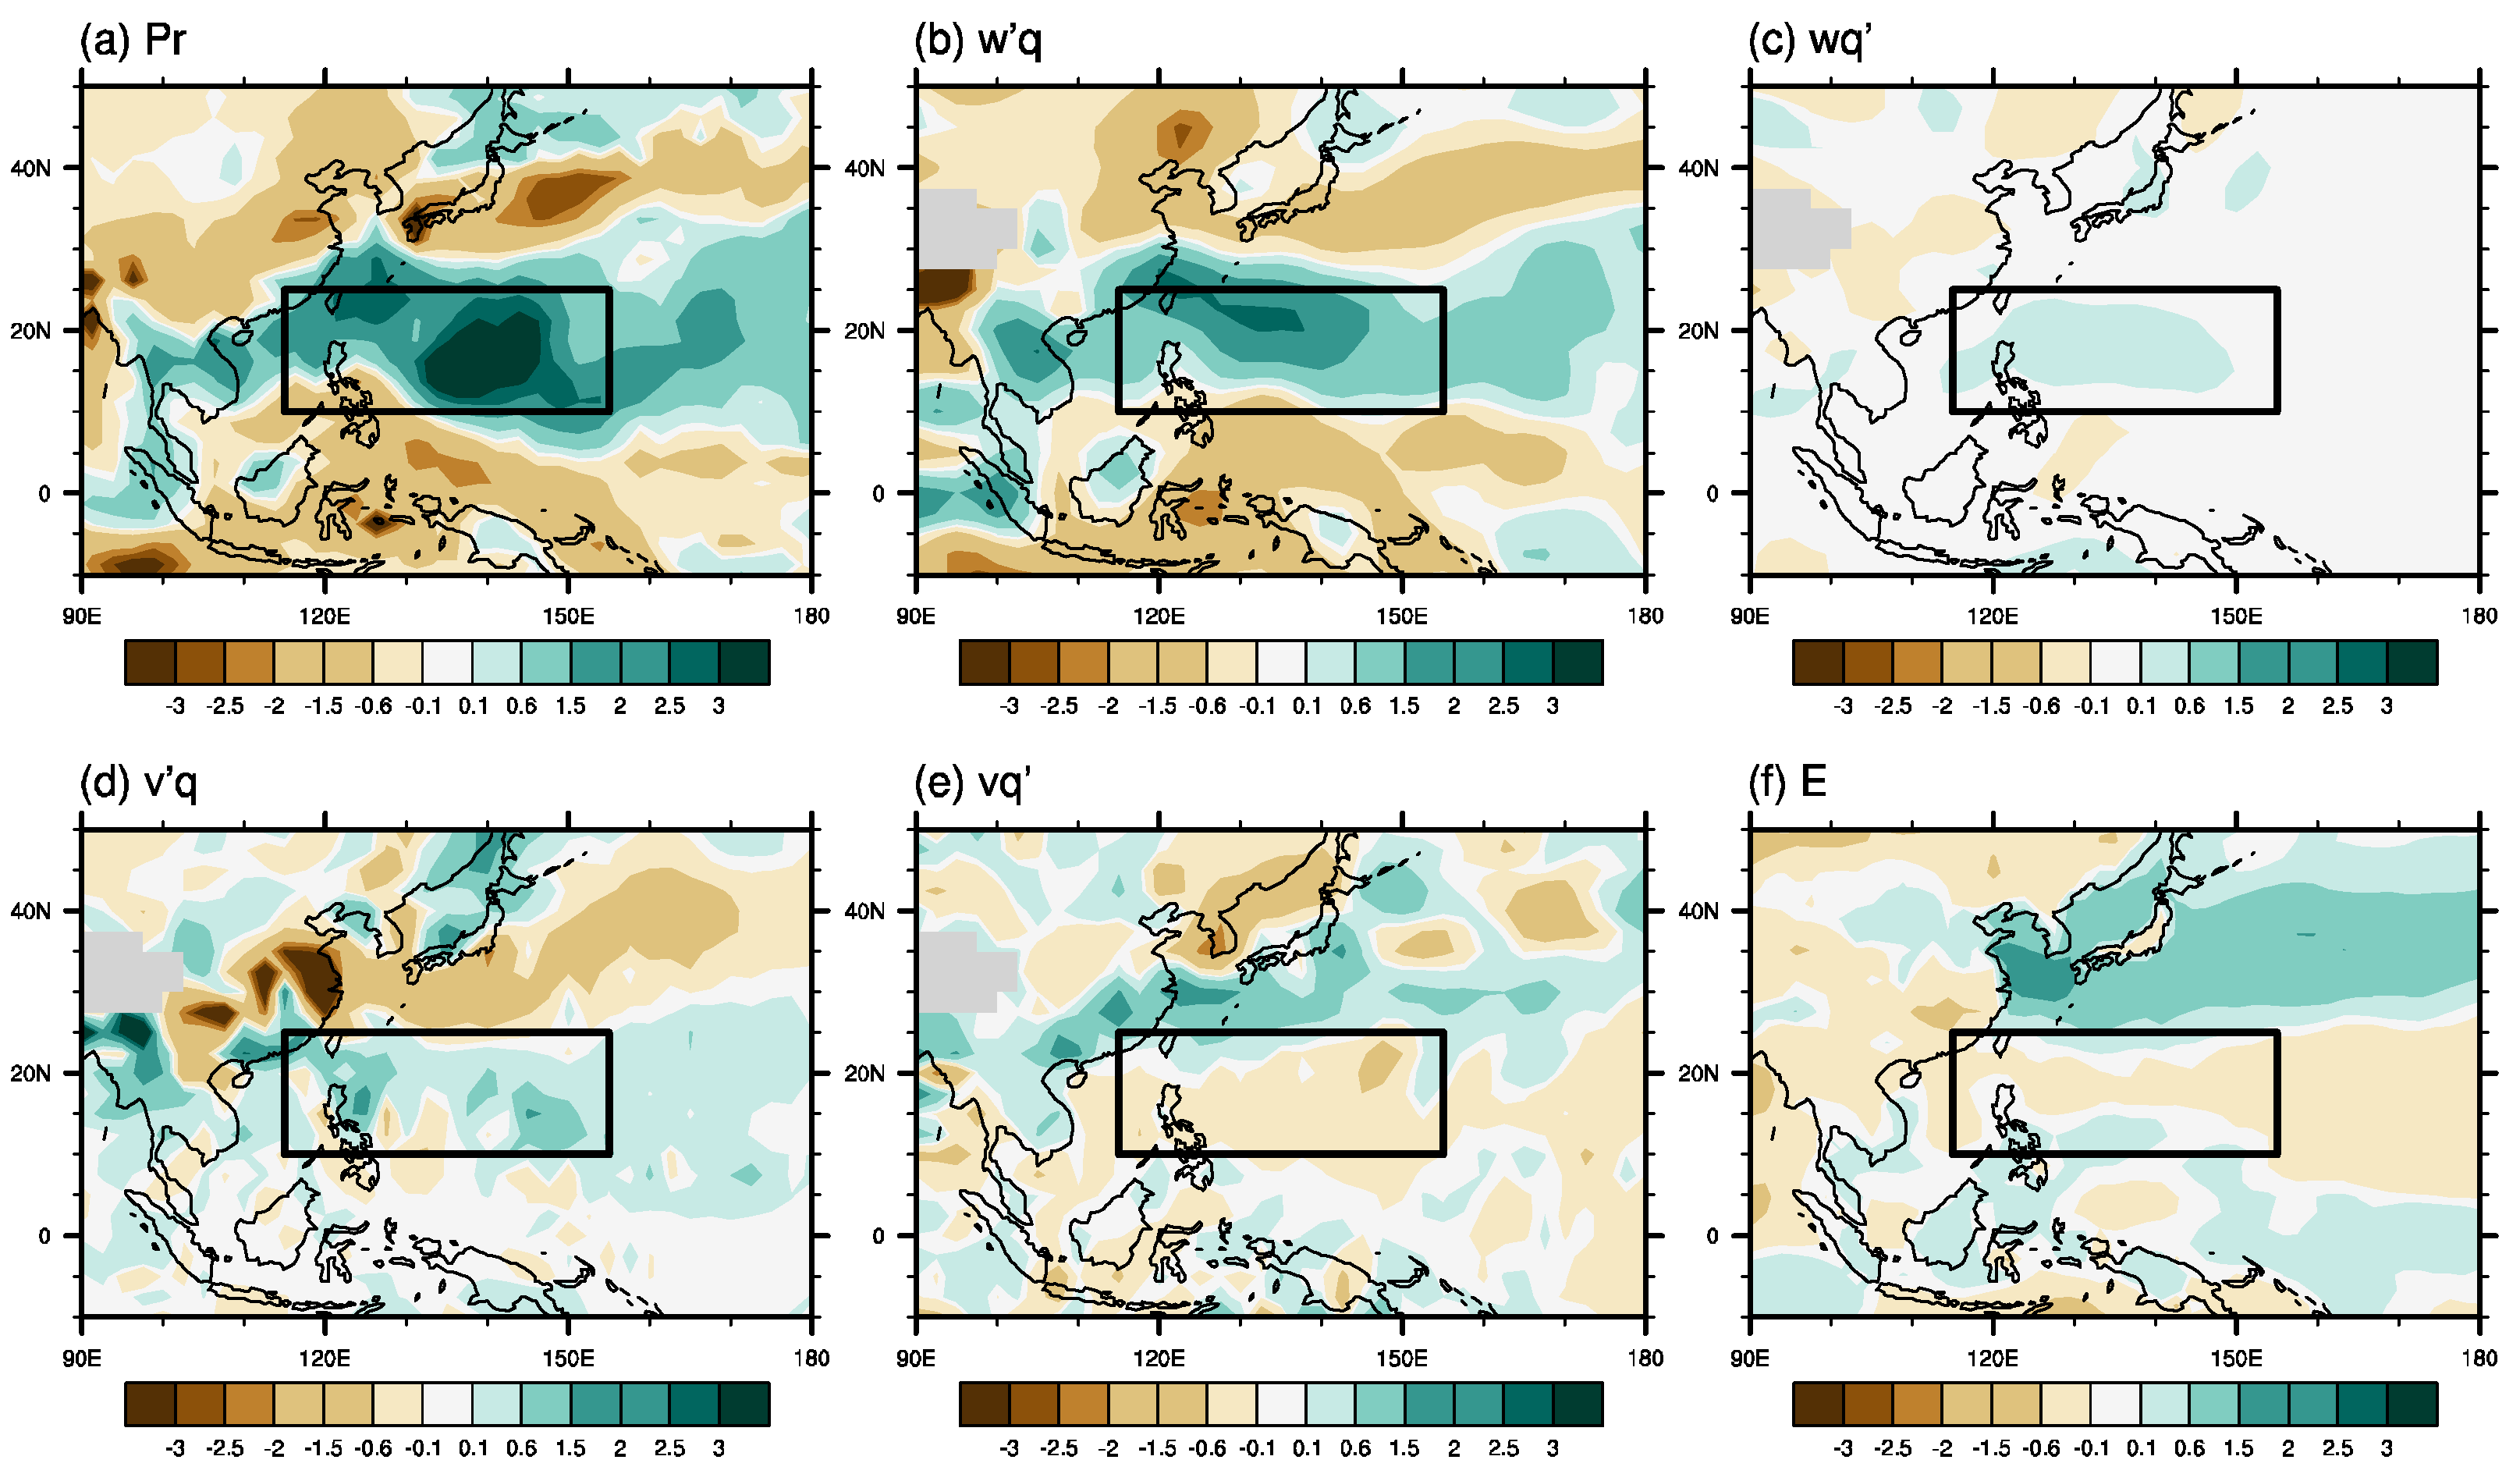
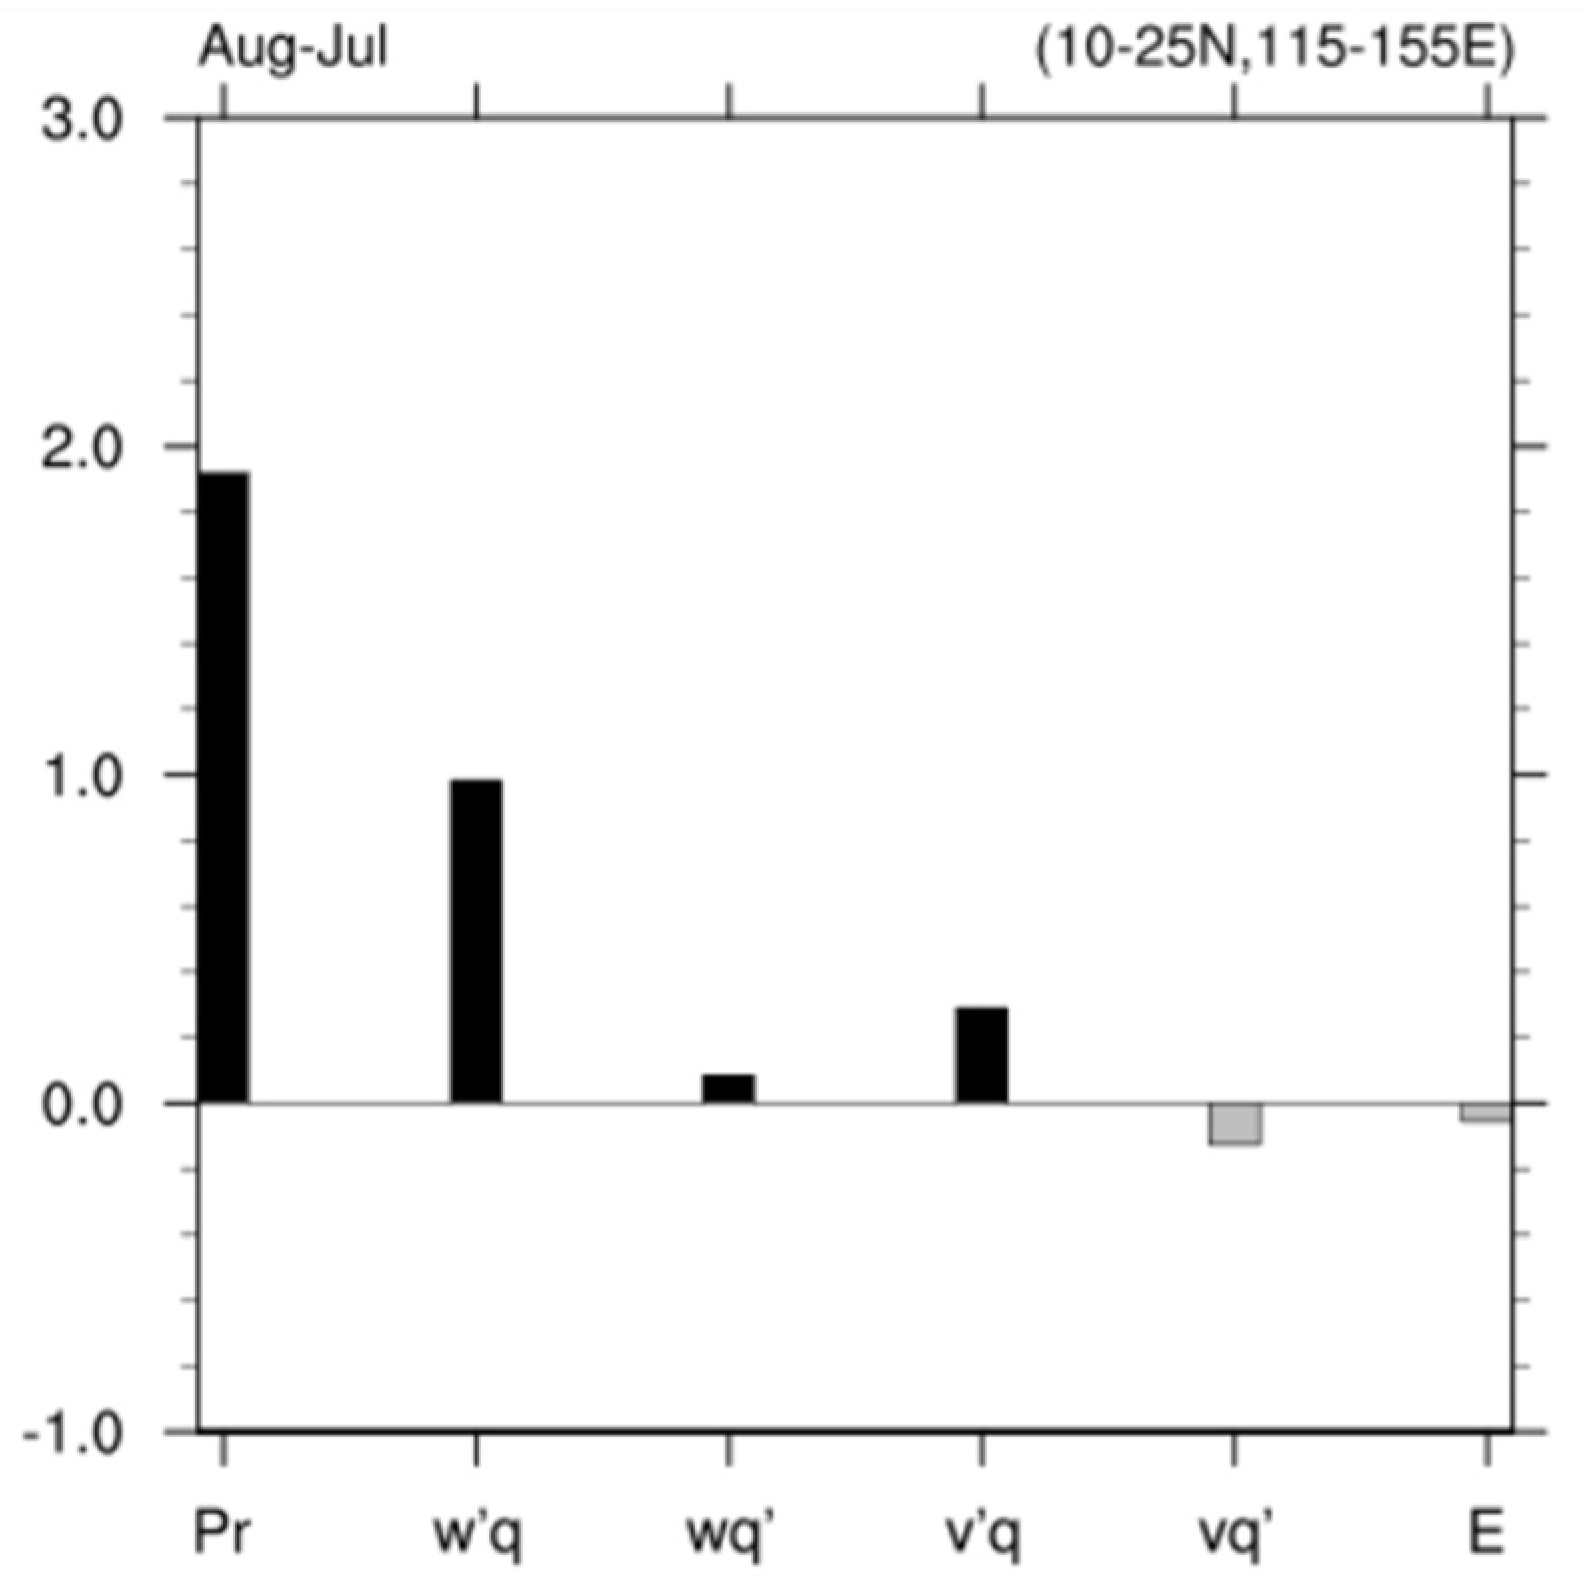
To further understand the cause of the precipitation increases from July to August in the western North Pacific region, a water vapor budget analysis was conducted, as in many previous studies [36,37]. Figure 5 shows the spatial pattern of each item in the water vapor budget equation, including vertical transport by the anomalous vertical motion, horizontal transport, and evaporation. It is obvious that the precipitation increase is mainly induced by the vertical motion change from July to August. The spatial pattern of the precipitation change, and the first term are similar. The regional averaged contribution from each term in the water vapor budget equation is shown in Figure 6. The first term contributes more than 50% of the precipitation increase in the region. The second largest contribution term is the horizontal change term. Comparatively, other terms make negligible contributions to the precipitation change from July to August in the western North Pacific region.
3.2. CMIP6 Simulations
In the previous subsection, the observational precipitation increase from July to August in the western North Pacific was examined. The water vapor budget analysis confirmed that the precipitation increase can be mainly attributed to the vertical motion change from July to August. In a previous study [30], CMIP5 AMIP simulations were examined and the results show that they cannot reasonably reproduce the precipitation increase from July to August, which is associated with the local SST change, as discussed in the previous subsection. The eastward retreat of the WPSH cannot be reproduced by AMIP experiments [29]. Taking air–sea interaction into consideration, coupled models can improve the increased precipitation simulations [30]. However, coupled models still have considerable bias. The magnitude of the precipitation increase in the ensemble mean of the coupled models has been largely underestimated. According to the results discussed in Section 3.1, the precipitation increase is primarily caused by the vertical motion change. Thus, we want to know whether the coupled models bias is associated with the simulated vertical motion bias. In this subsection, we will first evaluate the AMIP and historical simulations from the CMIP6 models in the simulation of the precipitation increase from July to August in the western North Pacific region, and then show the relationship between precipitation simulation and vertical motion simulation. The correlation coefficient, SDR, and skills for precipitation and vertical velocity at 500 hPa are shown in Table 3 and Table 4.
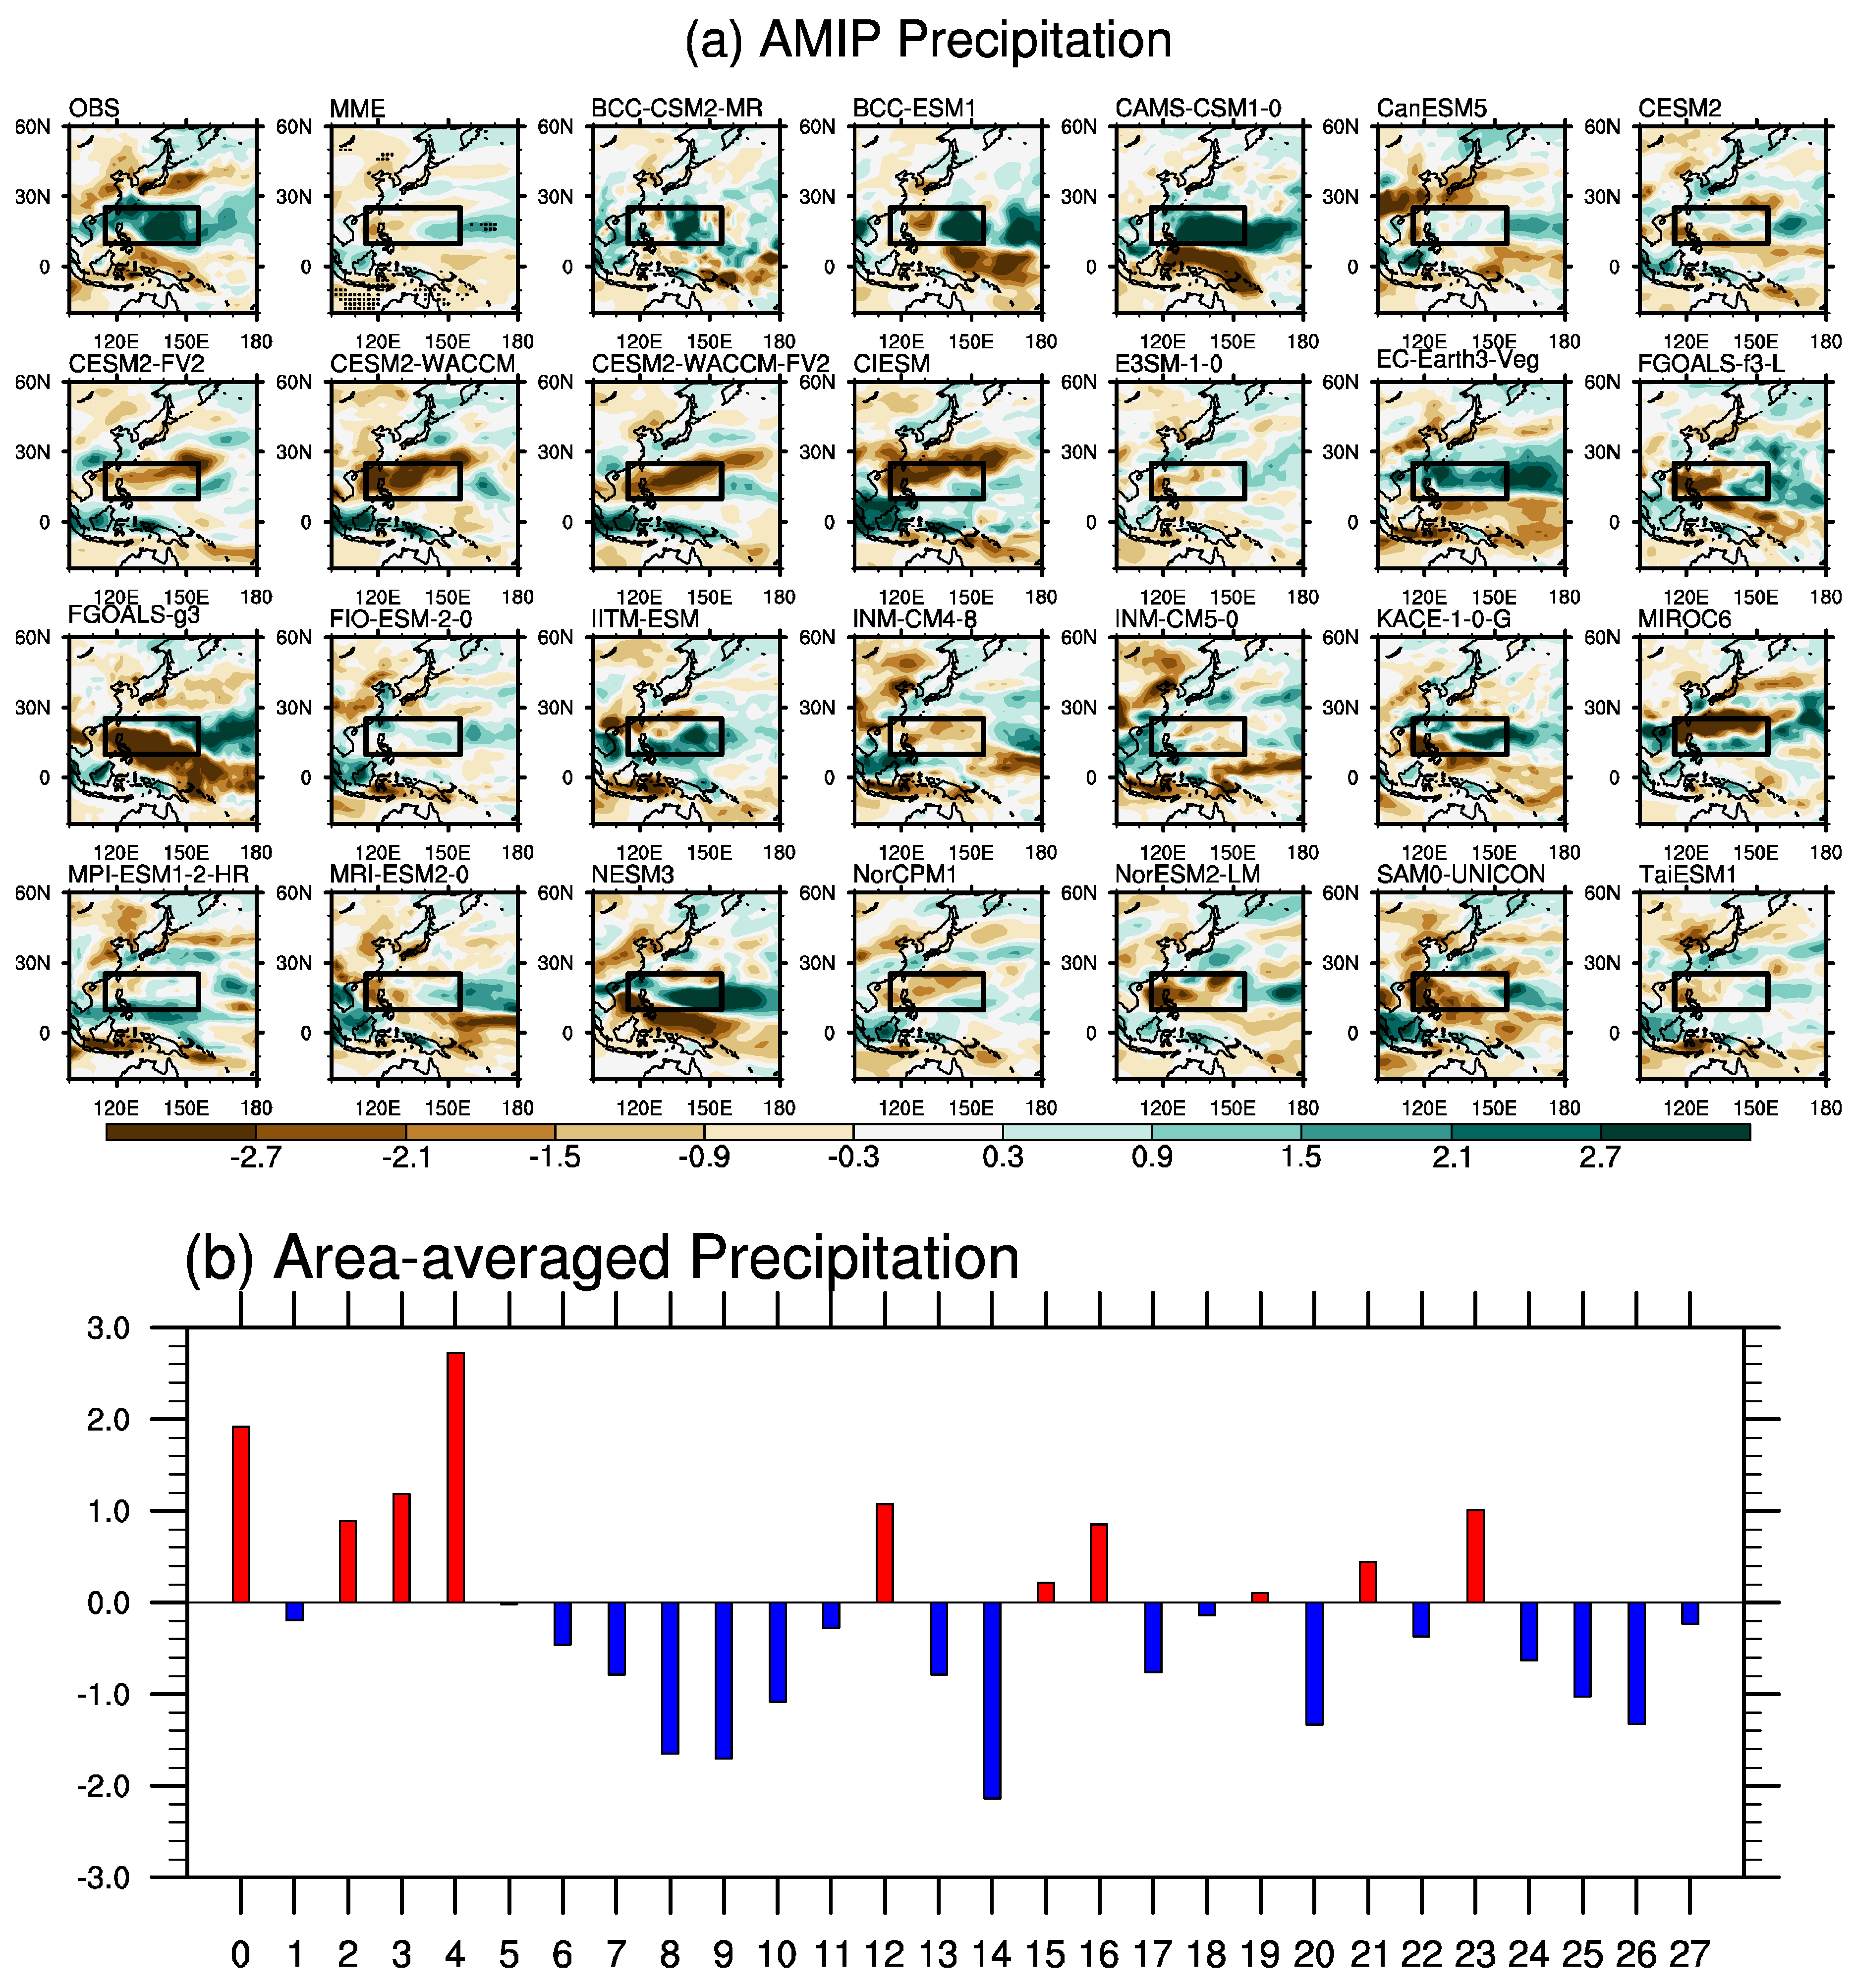
Figure 7 shows the climatological precipitation difference from July to August in AMIP models. Since CMIP models show a large uncertainty in reproducing the East Asian summer precipitation [41,42], a model consistent test was used in this study to investigate whether different models show a similar performance. When 80% of the CMIP6 models agree with the MME results, we consider the model performance to be consistent [41,42]. In Figure 7a, it is evident that the MME cannot capture the observed precipitation increase from July to August without 80% of the CMIP6 models agreeing with the MME result. Only nine models can reproduce the observed precipitation change in the focus region (Figure 7b). This is related to the fact that the local SST decreases from July to August. In AMIP experiments, air–sea interaction is absent, and the precipitation responds passively to the prescribed SST change. Thus, driven by the decrease in SST, the local precipitation is suppressed. However, the performances of the models are not consistent in simulating the precipitation difference without 80% of the CMIP6 models agreeing with the MME result in the regions discussed. It is interesting that some models can still reproduce the precipitation increase in AMIP experiments (e.g., CAMS-CSM1-0 and EC-Earth3-Ve), indicating that the precipitation increase may be induced by other mechanisms besides the local SST change.
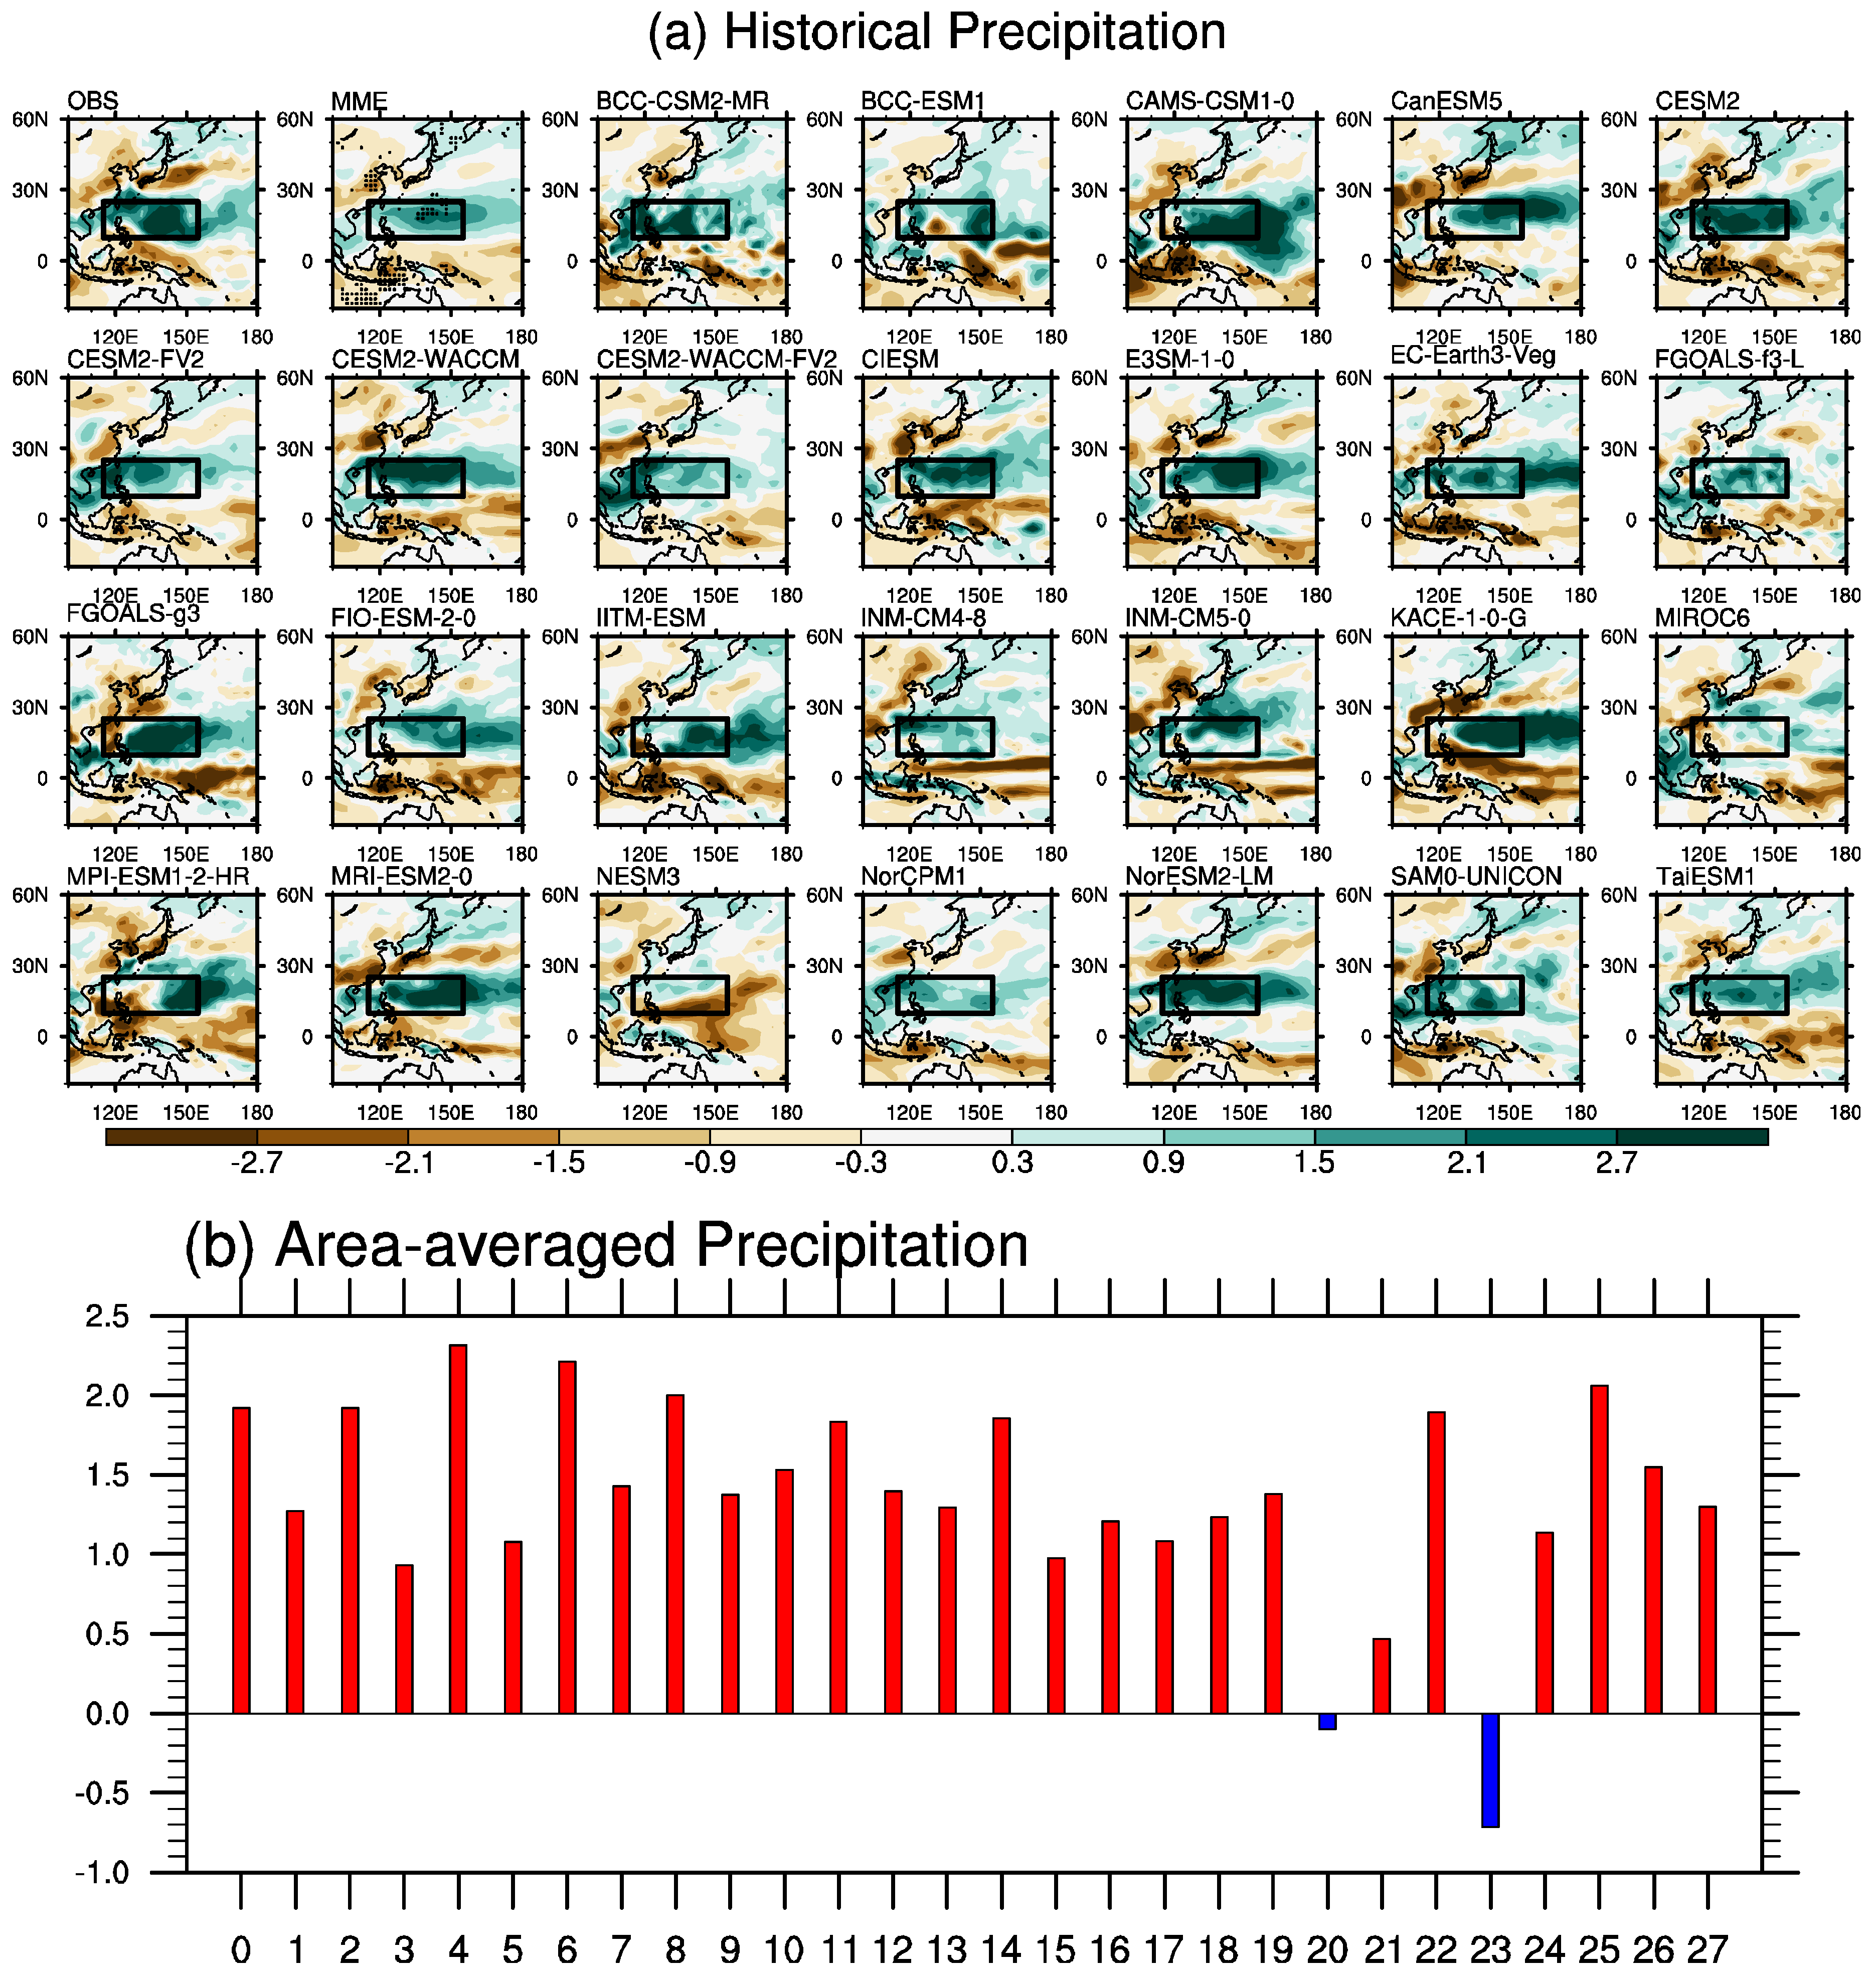
Compared with the AMIP experiments, historical experiments can largely improve the precipitation increase simulation from July to August (Figure 8); 80% of the different models agree with the MME. Most models can capture the precipitation increase in the focus region in the western North Pacific. The MME shows a notable increase in precipitation, although the magnitude is still underestimated compared with that found in the observation. The improvements from AMIP can be clearly seen in the skill score. The AMIP MME skill score is only 0.34, which is improved to 0.72 in historical experiments (Table 3).
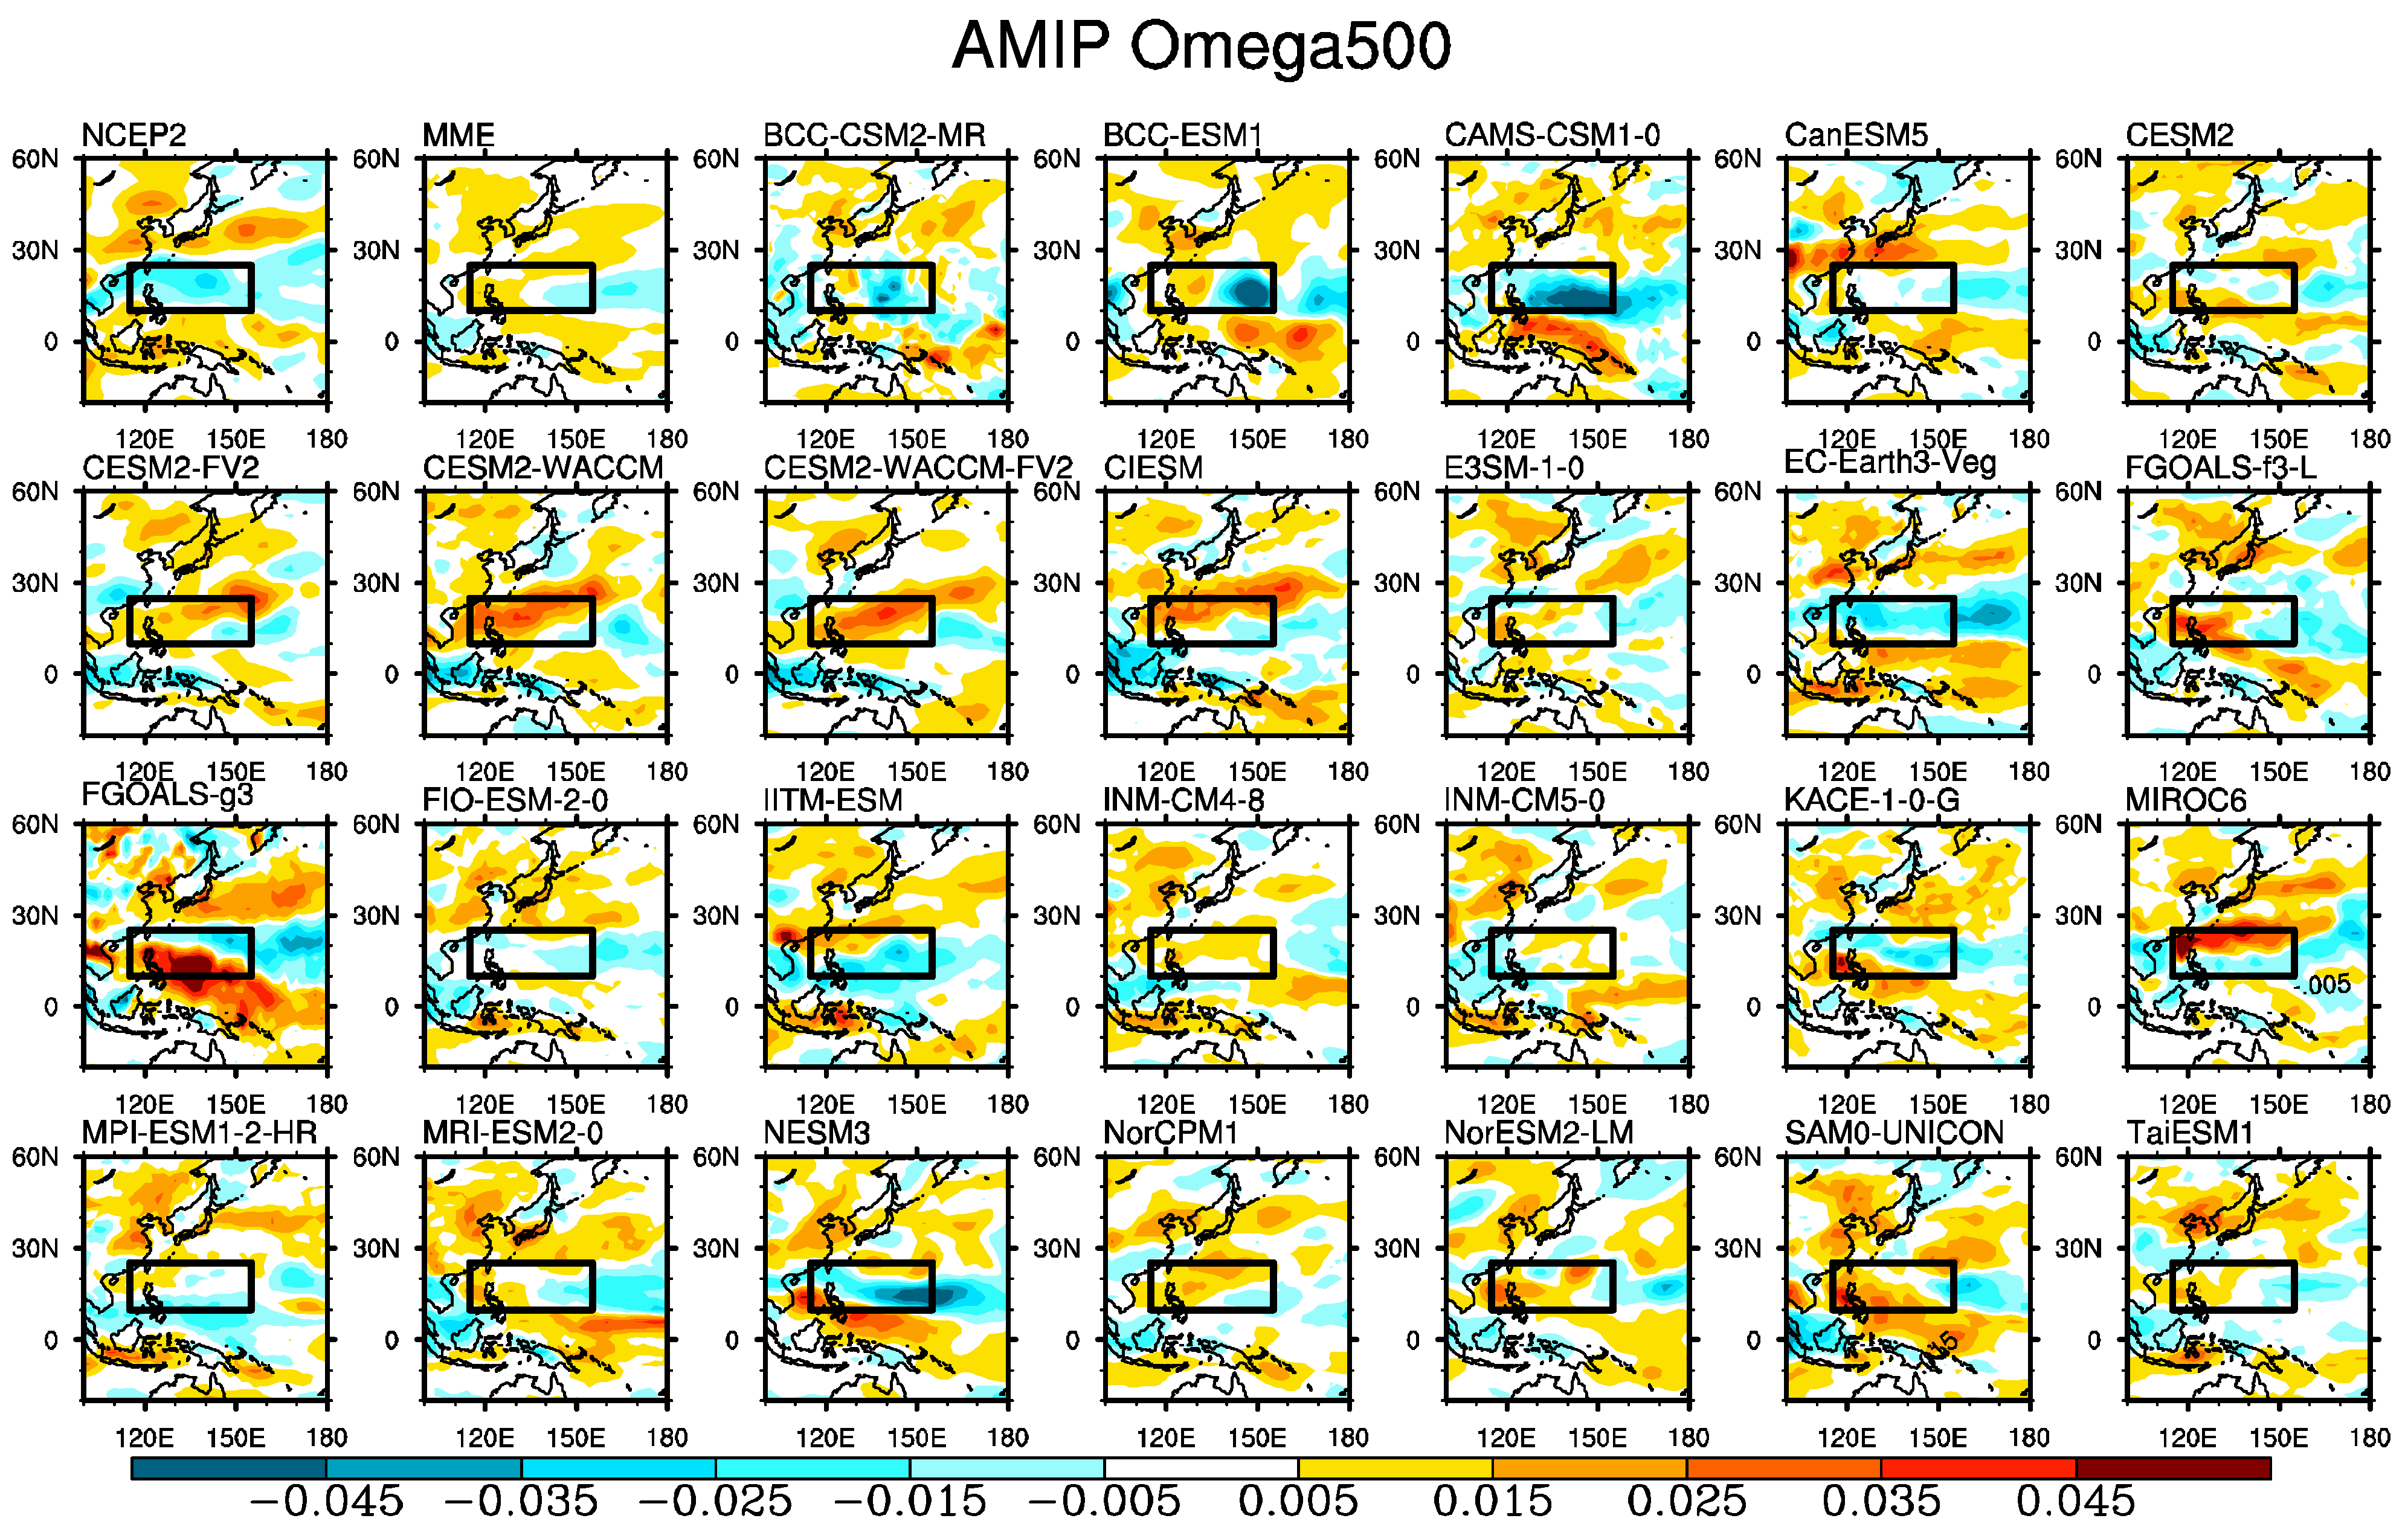
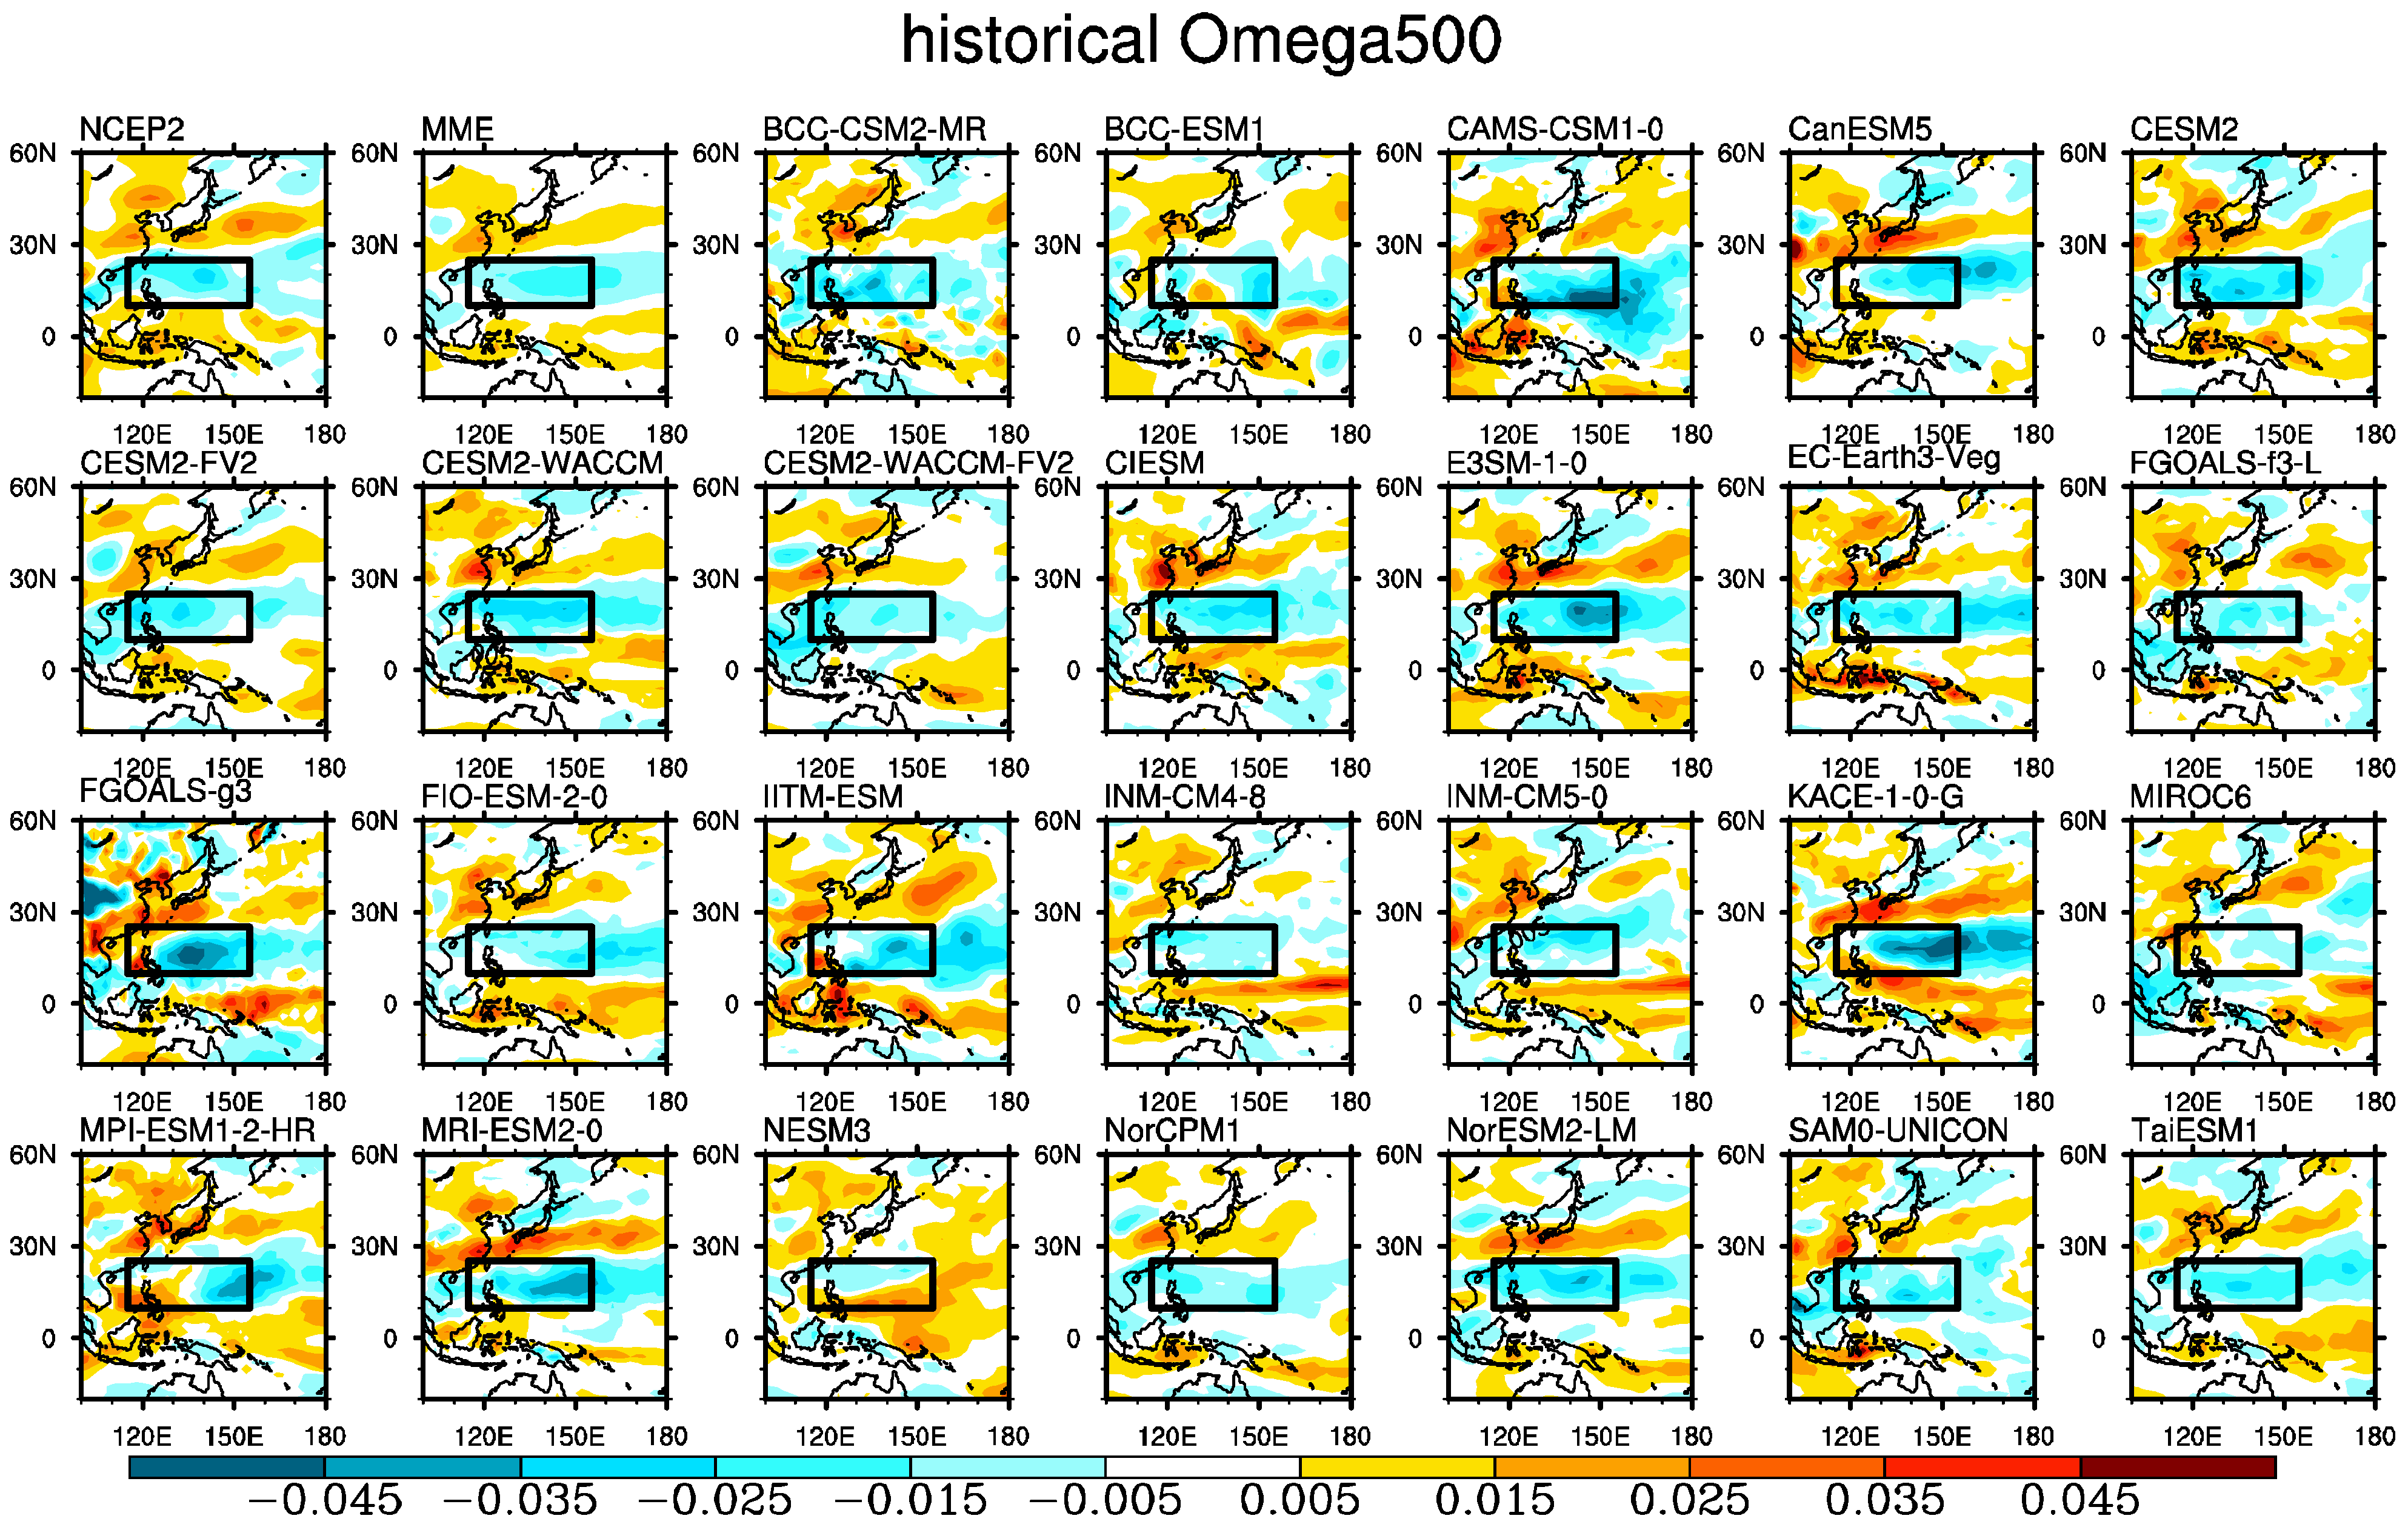
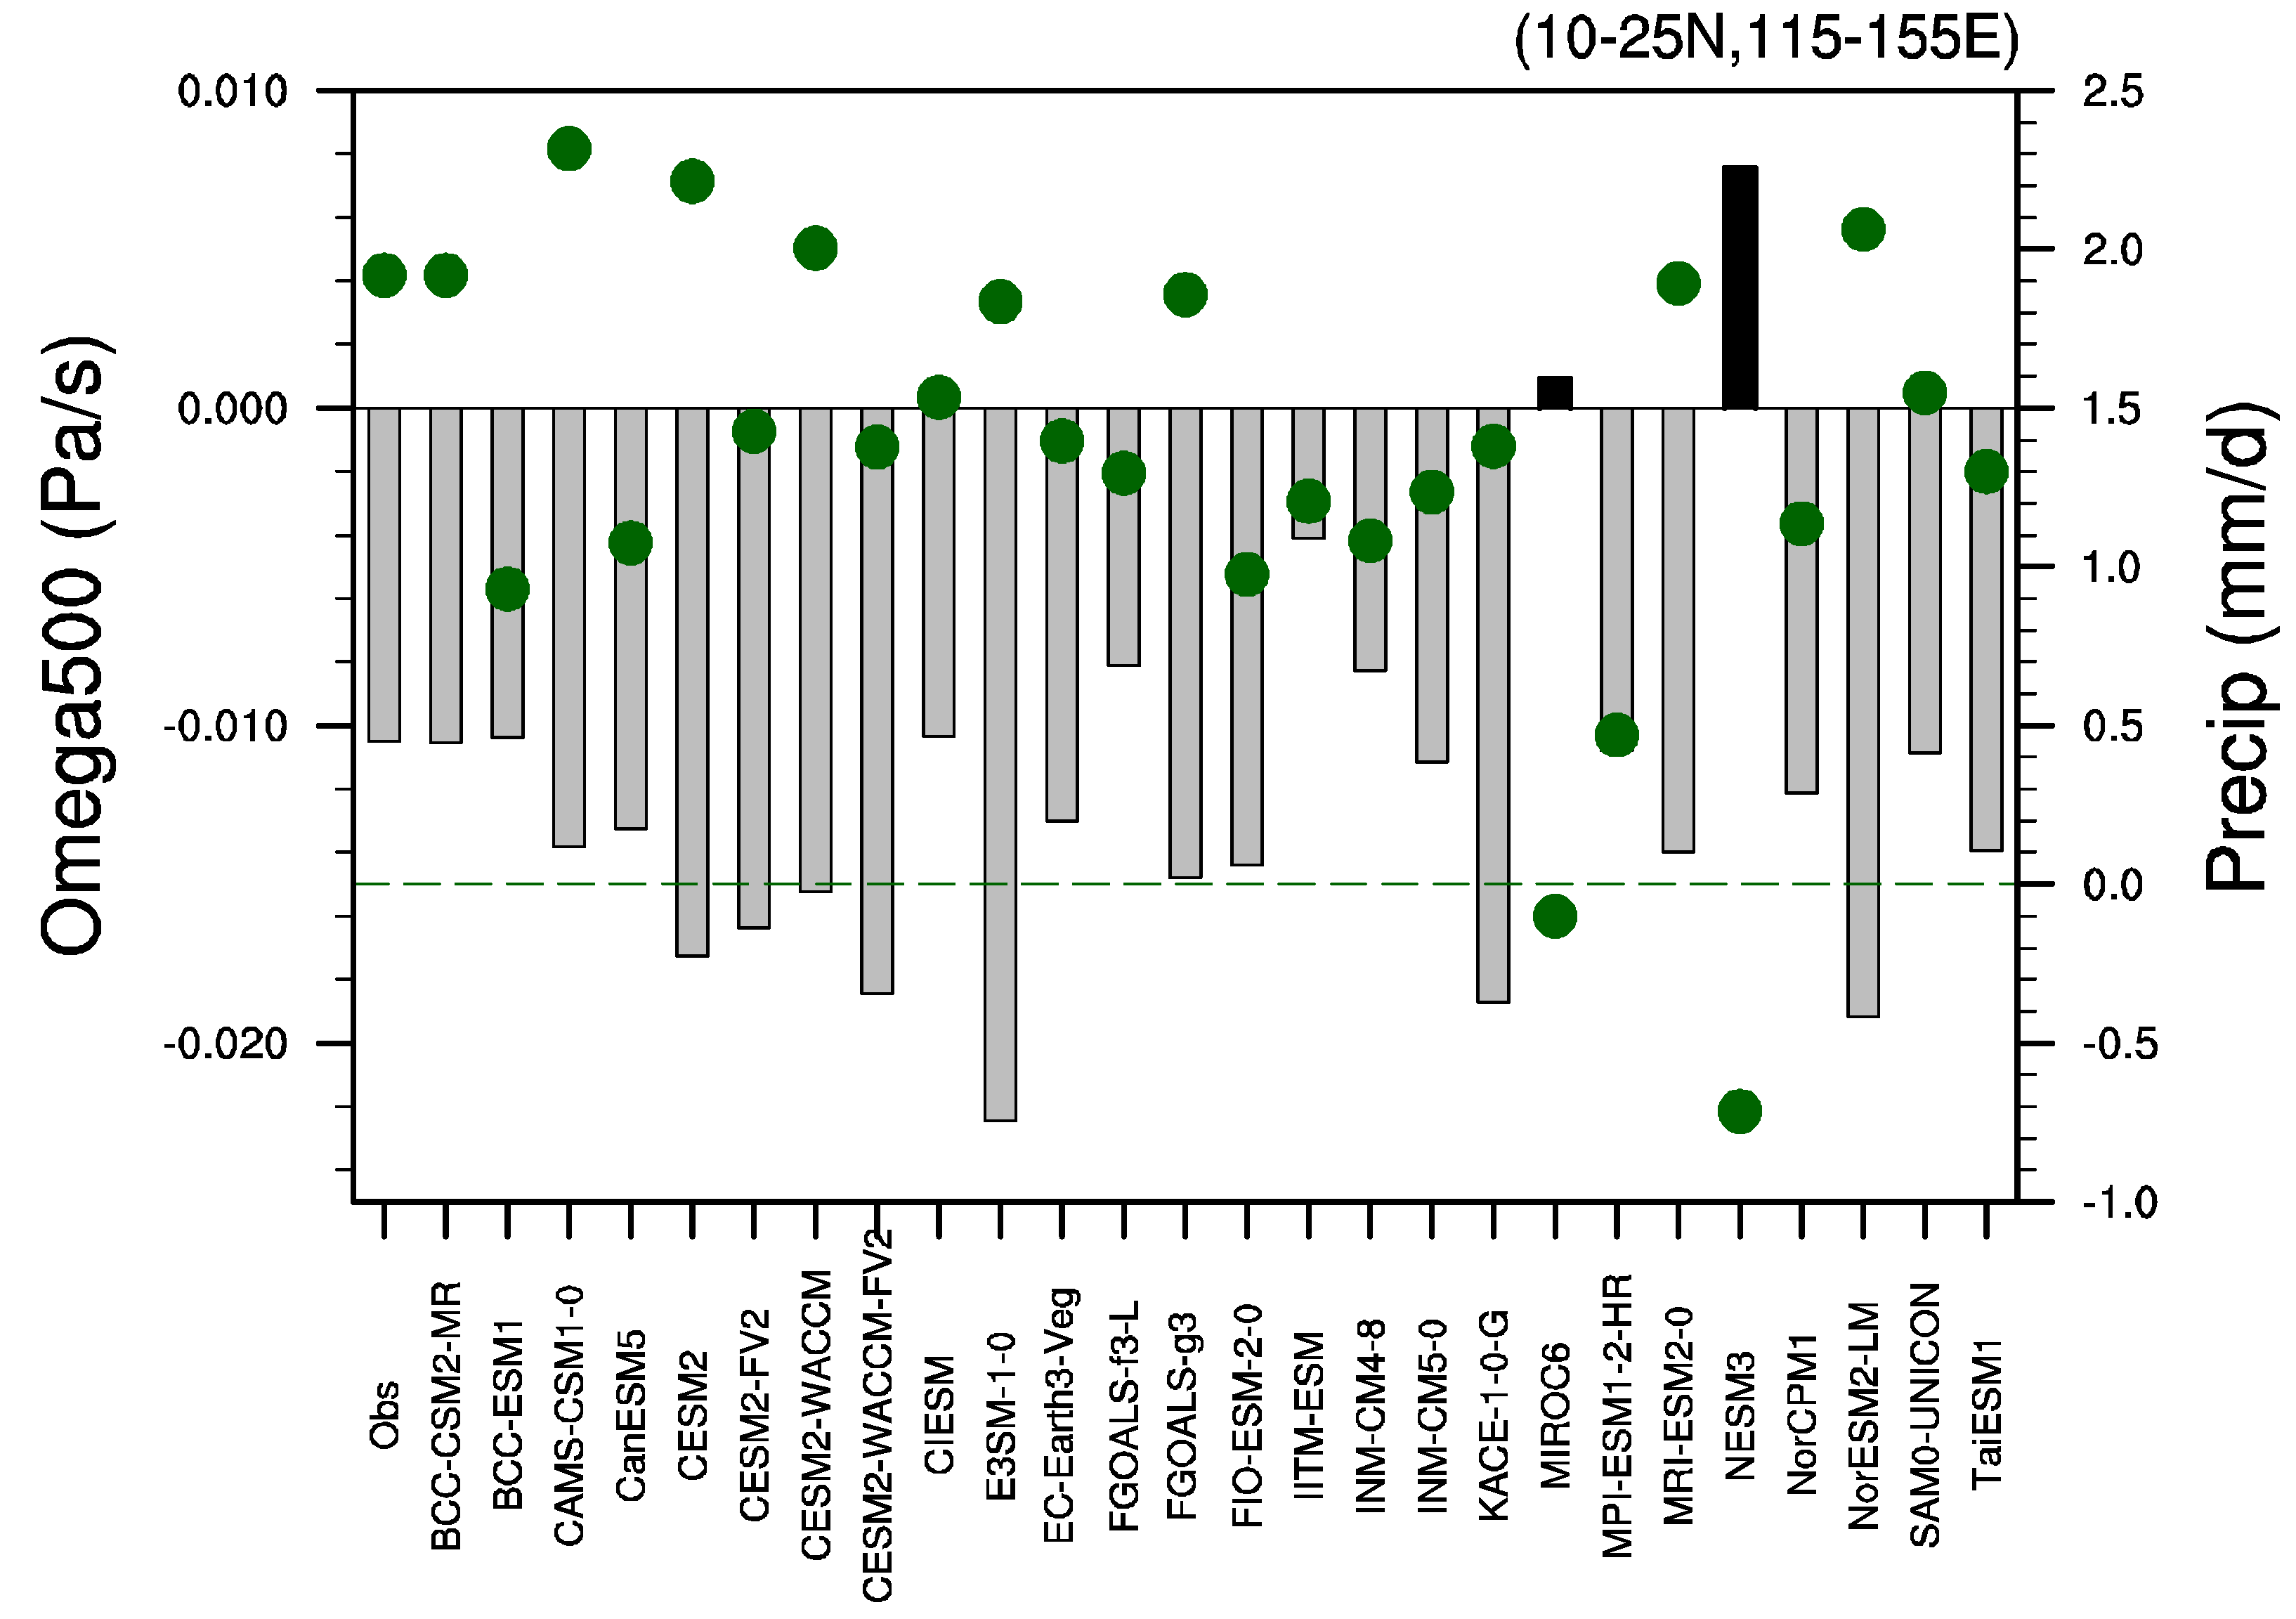
From the observational analysis in the previous subsection, we found the climatological precipitation increase from July to August in the western North Pacific is intimately associated with the dynamical item in vertical motion change. Thus, we further explored the simulated 500-hPa vertical velocity change in both AMIP and historical experiments (Figure 9 and Figure 10). The pattern of vertical motion change can well match the precipitation change in the observations and simulations of individual models. The observed upward motion strengthening in the focus region is largely underestimated in the AMIP MME but improved in historical simulations. Figure 11 shows the regional average (in the focus black box region) change in vertical motion at 500-hPa and the precipitation from July to August. From the observation, it is evident that the precipitation increase from July to August is associated with the strengthening of the local upward motion. In the multi-model simulations, the precipitation change is intimately related to the vertical motion change, with an inter-model correlation coefficient of −0.7. This implies that the model with a better performance in the simulation of the vertical motion strengthening tends to reproduce the precipitation increase better. However, there is still uncertainty concerning this relationship. For example, there are several models that can reproduce the strengthening in upward motion, but that fail to reproduce the local precipitation increase (e.g., CanESM5, FIO-ESM-2-0, and NorCPM1). Thus, there are other factors that can induce the precipitation change bias in addition to the vertical motion change, which deserves further research.
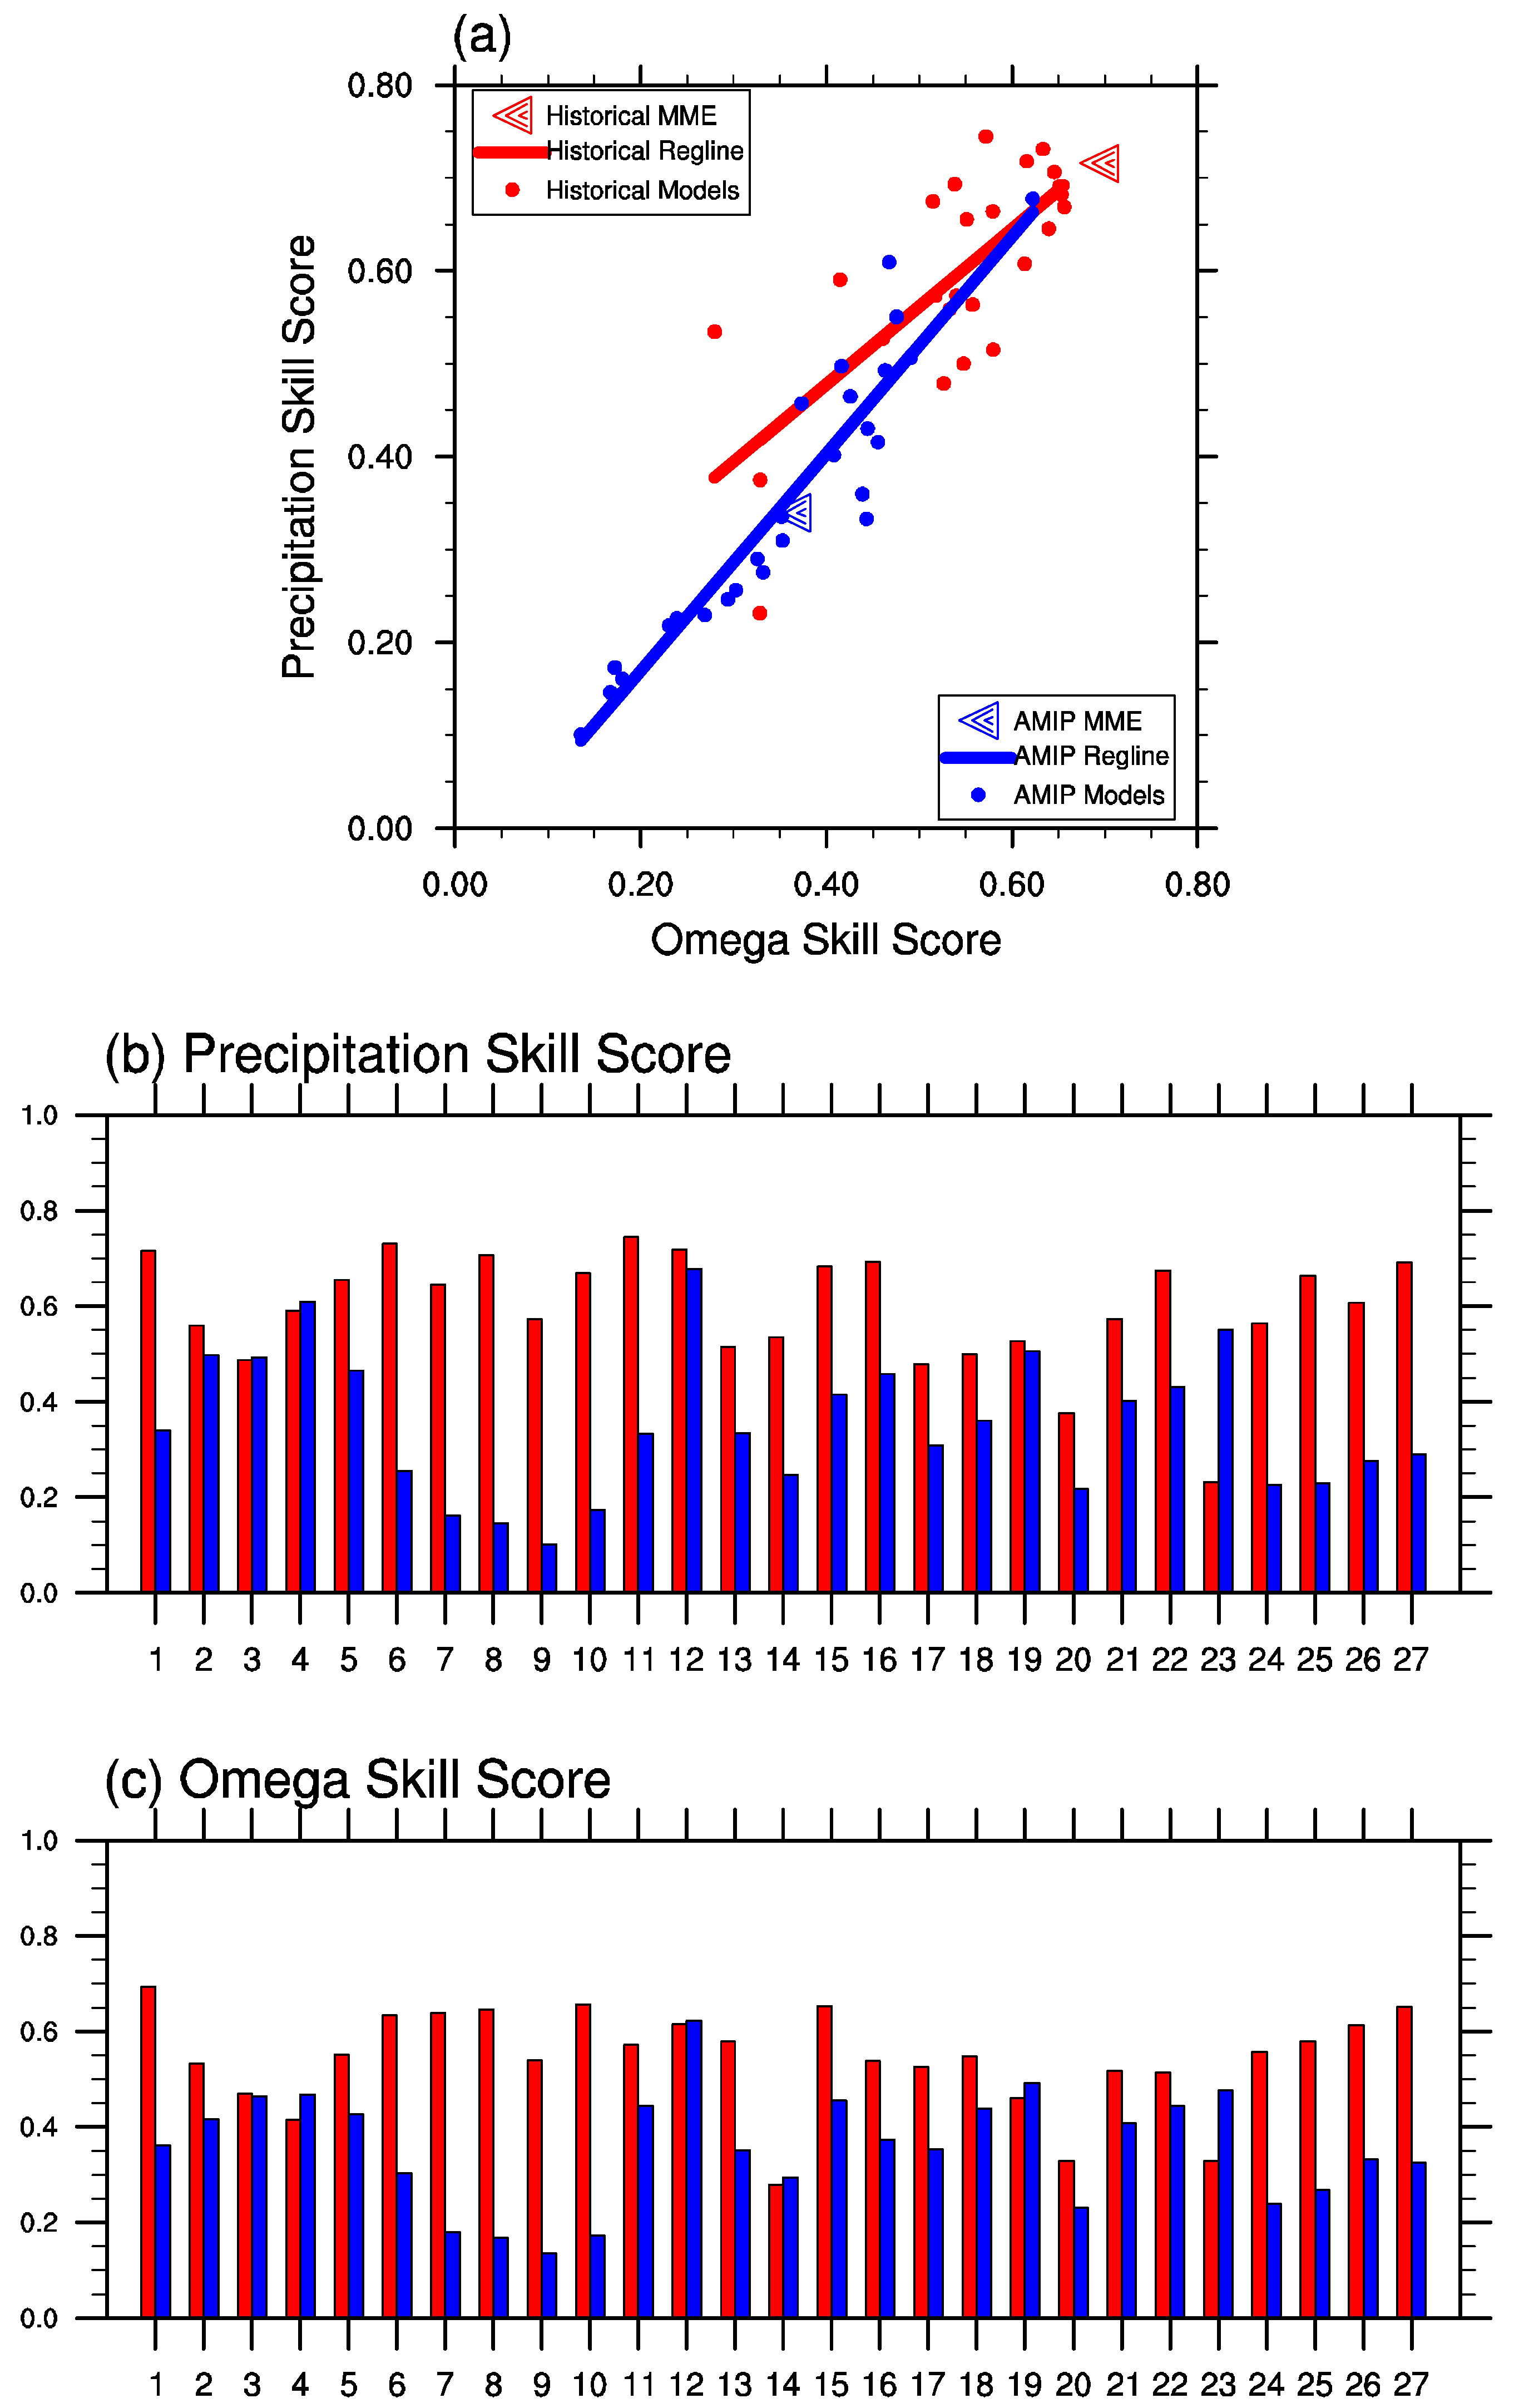
The relationship between the precipitation simulation and vertical motion simulation can also been seen in the skill scores, as shown in Figure 12. Figure 12 also shows a comparison between the AMIP and historical simulations. It is evident that the historical simulations improve compared with the AMIP simulations, for both precipitation and vertical motion change, with 0.36 for the AMIP MME and 0.69 for the historical MME in the simulation of climatological vertical motion change. Figure 12a shows that the precipitation simulation and vertical motion simulation are almost linearly correlated, indicating that a better performance in the simulation of vertical motion may lead to a better simulation of the precipitation increase from July to August. Thus, this further indicates that the precipitation change is due to the local circulation change, as revealed by the water vapor budget analysis (Figure 5 and Figure 6).
4. Conclusions
In this study, the climatological precipitation increase from July to August over the western North Pacific region simulated by CMIP6 AMIP and historical experiments was investigated. Firstly, observational analysis showed that the precipitation increase is associated with the local SST decrease from July to August. In addition, the pattern of precipitation increase is similar to the vertical motion change at 500-hPa, indicating that the precipitation increase is related to the circulation change. Then, a moisture budget analysis was conducted, further confirming that the precipitation increase is mainly induced by the vertical motion strengthening in the WNP region, while other items make secondary contributions. After observational analysis, experiments from both AMIP and historical simulations with 26 CMIP6 models were evaluated. The CMIP6 model simulations confirmed the CMIP5 models results, finding that coupled models can improve the simulation of the climatological precipitation increase from July to August in the WNP region. The reason for this improvement is that the precipitation increase is associated with local SST decreases in the observation. Thus, driven by the observed SST decrease, the precipitation decreases concurrently, opposite to the observed precipitation increase. Taking air–sea coupling into consideration, in historical experiments this observed precipitation increase can be reasonably reproduced. In addition to the air–sea coupling, this study further investigates the impact of circulation change on the precipitation increase. In the simulation, the precipitation change is significantly correlated to the 500-hPa vertical motion change, with an inter-model correlation coefficient of −0.7. Models with a better performance in the simulation of vertical motion change from July to August tend to have a better performance in the simulation of the precipitation increase. Thus, the conclusions of this study claim that two factors are responsible for the bias of the precipitation increase from July to August in climate models: air–sea coupling processes and the performance in vertical motion change simulation.
Author Contributions
Conceptualization, X.D.; methodology, X.D.; software, X.D. and R.L.; writing—original draft preparation, X.D.; writing—review and editing, X.D. and R.L. Both authors have read and agreed to the published version of the manuscript.
Funding
This research was funded by the Strategic Priority Research Program of the Chinese Academy of Sciences (grant number XDA19030403), the National Natural Science Foundation of China (grant numbers 41706028, 41606027 and 41861144015), the Beijing Natural Science Foundation (8204064), and the Special Program for Forecasters of China Meteorological Administration (CMAYBY2020-004).
Institutional Review Board Statement
Not applicable.
Informed Consent Statement
Not applicable.
Data Availability Statement
Data sharing not applicable.
Acknowledgments
Thank Chao He for helpful discussions.
Conflicts of Interest
The authors declare no conflict of interest.
References
- Murakami, T.; Matsumoto, J. Summer Monsoon over the Asian Continent and Western North Pacific. J. Meteorol. Soc. Jpn. 1994, 72, 719–745. [Google Scholar] [CrossRef] [Green Version]
- Tanaka, M. Interannual and interdecadal variations of the western North Pacific monsoon and the East Asian Baiu rainfall and their relationship to ENSO cycles. J. Meteor. Soc. Jpn. 1997, 75, 1109–1123. [Google Scholar] [CrossRef] [Green Version]
- Wang, B.; Lin, H. Rainy season of the Asian-Pacific summer monsoon. J. Clim. 2002, 15, 386–398. [Google Scholar] [CrossRef] [Green Version]
- Zou, L.; Zhou, T. Can a Regional Ocean–Atmosphere Coupled Model Improve the Simulation of the Interannual Variability of the Western North Pacific Summer Monsoon? J. Clim. 2013, 26, 2353–2367. [Google Scholar] [CrossRef]
- Lu, R. Interannual Variability of the Summertime North Pacific Subtropical High and its Relation to Atmospheric Convection over the Warm Pool. J. Meteorol. Soc. Jpn. 2001, 79, 771–783. [Google Scholar] [CrossRef] [Green Version]
- Huang, R.; Sun, F. Impacts of the Tropical Western Pacific on the East Asian Summer Monsoon. J. Meteorol. Soc. Jpn. 1992, 70, 243–256. [Google Scholar] [CrossRef] [Green Version]
- Nitta, T. Convective Activities in the Tropical Western Pacific and Their Impact on the Northern Hemisphere Summer Circulation. J. Meteorol. Soc. Jpn. 1987, 65, 373–390. [Google Scholar] [CrossRef] [Green Version]
- Chou, C.; Tu, J.-Y.; Yu, J.-Y. Interannual Variability of the Western North Pacific Summer Monsoon: Differences between ENSO and Non-ENSO Years. J. Clim. 2003, 16, 2275–2287. [Google Scholar] [CrossRef] [Green Version]
- Wang, B.; Wu, R.; Fu, X. Pacific–East Asian Teleconnection: How Does ENSO Affect East Asian Climate? J. Climate 2000, 13, 1517–1536. [Google Scholar] [CrossRef]
- Wang, B.; Wu, R.; Li, T. Atmosphere–Warm Ocean Interaction and Its Impacts on Asian–Australian Monsoon Variation. J. Clim. 2003, 16, 1195–1211. [Google Scholar] [CrossRef]
- Chen, J.-M.; Li, T.; Shih, C.-F. Fall Persistence Barrier of Sea Surface Temperature in the South China Sea Associated with ENSO. J. Clim. 2007, 20, 158–172. [Google Scholar] [CrossRef]
- Yang, J.; Liu, Q.; Xie, S.-P.; Liu, Z.; Wu, L. Impact of the Indian Ocean SST basin mode on the Asian summer monsoon. Geophys. Res. Lett. 2007, 34. [Google Scholar] [CrossRef] [Green Version]
- Xie, S.-P.; Hu, K.; Hafner, J.; Tokinaga, H.; Du, Y.; Huang, G.; Sampe, T. Indian Ocean Capacitor Effect on Indo–Western Pacific Climate during the Summer following El Niño. J. Clim. 2009, 22, 730–747. [Google Scholar] [CrossRef]
- Wu, B.; Li, T.; Zhou, T. Relative Contributions of the Indian Ocean and Local SST Anomalies to the Maintenance of the Western North Pacific Anomalous Anticyclone during the El Niño Decaying Summer. J. Clim. 2010, 23, 2974–2986. [Google Scholar] [CrossRef] [Green Version]
- Ueda, H.; Yasunari, T.; Kawamura, R. Abrupt Seasonal Change of Large-Scale Convective Activity over the Western Pacific in the Northern Summer. J. Meteorol. Soc. Jpn. 1995, 73, 795–809. [Google Scholar] [CrossRef] [Green Version]
- Suzuki, S.-I.; Hoskins, B. The Large-Scale Circulation Change at the End of the Baiu Season in Japan as Seen in ERA40 Data. J. Meteorol. Soc. Jpn. 2009, 87, 83–99. [Google Scholar] [CrossRef] [Green Version]
- Ding, Y.; Liu, Y.; Shi, X.; Li, Q.; Li, Q.; Liu, Y. Multi-year simulations and experimental seasonal predictions for rainy seasons in China by using a nested regional climate model (RegCM_NCC) Part II: The experimental seasonal prediction. Adv. Atmos. Sci. 2006, 23, 487–503. [Google Scholar] [CrossRef]
- Yihui, D.; Chan, J.C.L. The East Asian summer monsoon: An overview. Theor. Appl. Clim. 2005, 89, 117–142. [Google Scholar] [CrossRef]
- Yuan, Y.; Gao, H.; Li, W.; Liu, Y.; Chen, L.; Zhou, B.; Ding, Y. The 2016 summer floods in China and associated physical mechanisms: A comparison with 1998. J. Meteorol. Res. 2017, 31, 261–277. [Google Scholar] [CrossRef]
- Ye, Q.; Glantz, M.H. The 1998 Yangtze floods: The use of short-term forecasts in the context of seasonal to interannual water resource management. Mitig. Adapt. Strateg. Glob. Chang. 2005, 10, 159–182. [Google Scholar] [CrossRef]
- Dong, X.; Lin, R.; Fan, F. Comparison of the two modes of the Western Pacific subtropical high between early and late summer. Atmos. Sci. Lett. 2017, 18, 153–160. [Google Scholar] [CrossRef] [Green Version]
- Kawatani, K.N.Y.; Tokioka, T. The North Pacific subtropical high characterized separately for June, July and August: Zonal displacement associated with submonthly variability. J. Meteorol. Soc. Jpn. 2008, 86, 505–530. [Google Scholar] [CrossRef] [Green Version]
- Xue, F.; Dong, X.; Fan, F. Anomalous western Pacific subtropical high during El Niño developing summer in comparison with decaying summer. Adv. Atmos. Sci. 2018, 35, 360–367. [Google Scholar] [CrossRef]
- Dong, X.; He, C. Zonal displacement of the Western North Pacific subtropical high from early to late summer. Int. J. Clim. 2020, 40, 5029–5041. [Google Scholar] [CrossRef]
- Song, F.; Zhou, T. Interannual Variability of East Asian Summer Monsoon Simulated by CMIP3 and CMIP5 AGCMs: Skill Dependence on Indian Ocean–Western Pacific Anticyclone Teleconnection. J. Clim. 2014, 27, 1679–1697. [Google Scholar] [CrossRef]
- Jiang, D.; Hu, D.; Tian, Z.; Lang, X. Differences between CMIP6 and CMIP5 Models in Simulating Climate over China and the East Asian Monsoon. Adv. Atmospheric Sci. 2020, 37, 1–17. [Google Scholar] [CrossRef]
- Sperber, K.R.; Annamalai, H.; Kang, I.S.; Kitoh, A.; Moise, A.; Turner, A.; Wang, B.; Zhou, T. The Asian summer monsoon: An intercomparison of CMIP5 vs. CMIP3 simulations of the late 20th century. Clim. Dyn. 2012, 41, 2711–2744. [Google Scholar] [CrossRef]
- Inoue, T.; Ueda, H. Evaluation for the Seasonal Evolution of the Summer Monsoon over the Asian and Western North Pacific Sector in the WCRP CMIP3 Multi-model Experiments. J. Meteorol. Soc. Jpn. 2009, 87, 539–560. [Google Scholar] [CrossRef] [Green Version]
- Dong, X.; Fan, F.-X.; Lin, R.-P.; Jin, J.-B.; Lian, R.-X. Simulation of the western North Pacific subtropical high in El Niño decaying summers by CMIP5 AGCMs. Atmos. Ocean. Sci. Lett. 2017, 10, 146–155. [Google Scholar] [CrossRef] [Green Version]
- Lin, R.; Dong, X.; Fan, F. Can coupled models perform better in the simulation of sub-seasonal evolution of the western North Pacific subtropical high than atmospheric models in boreal summer? Atmos. Sci. Lett. 2018, 19, e862. [Google Scholar] [CrossRef] [Green Version]
- Taylor, K.E.; Stouffer, R.J.; Meehl, G.A. An Overview of CMIP5 and the Experiment Design. Bull. Am. Meteorol. Soc. 2012, 93, 485–498. [Google Scholar] [CrossRef] [Green Version]
- Eyring, V.; Bony, S.; Meehl, G.A.; Senior, C.A.; Stevens, B.; Stouffer, R.J.; Taylor, K.E. Overview of the Coupled Model Intercomparison Project Phase 6 (CMIP6) experimental design and organization. Geosci. Model Dev. 2016, 9, 1937–1958. [Google Scholar] [CrossRef] [Green Version]
- Adler, R.F.; Huffman, G.J.; Chang, A.; Ferraro, R.; Xie, P.-P.; Janowiak, J.; Rudolf, B.; Schneider, U.; Curtis, S.; Bolvin, D.; et al. The Version-2 Global Precipitation Climatology Project (GPCP) Monthly Precipitation Analysis (1979–Present). J. Hydrometeorol. 2003, 4, 1147–1167. [Google Scholar] [CrossRef]
- Kanamitsu, M.; Ebisuzaki, W.; Woollen, J.; Yang, S.-K.; Hnilo, J.J.; Fiorino, M.; Potter, G.L. NCEP–DOE AMIP-II Reanalysis (R-2). Bull. Am. Meteorol. Soc. 2002, 83, 1631–1644. [Google Scholar] [CrossRef]
- Huang, B.; Thorne, P.W.; Banzon, V.F.; Boyer, T.; Chepurin, G.; Lawrimore, J.H.; Menne, M.J.; Smith, T.M.; Vose, R.S.; Zhang, H.-M. Extended Reconstructed Sea Surface Temperature, Version 5 (ERSSTv5): Upgrades, Validations, and Intercomparisons. J. Clim. 2017, 30, 8179–8205. [Google Scholar] [CrossRef]
- Lin, R.; Zhou, T.; Qian, Y. Evaluation of Global Monsoon Precipitation Changes based on Five Reanalysis Datasets. J. Clim. 2014, 27, 1271–1289. [Google Scholar] [CrossRef]
- He, C.; Li, T.; Zhou, W. Drier North American Monsoon in Contrast to Asian–African Monsoon under Global Warming. J. Clim. 2020, 33, 9801–9816. [Google Scholar] [CrossRef]
- Taylor, K.E. Summarizing multiple aspects of model performance in a single diagram. J. Geophys. Res. Atmos. 2001, 106, 7183–7192. [Google Scholar] [CrossRef]
- Hirota, N.; Takayabu, Y.N.; Watanabe, M.; Kimoto, M. Precipitation Reproducibility over Tropical Oceans and Its Relationship to the Double ITCZ Problem in CMIP3 and MIROC5 Climate Models. J. Clim. 2011, 24, 4859–4873. [Google Scholar] [CrossRef]
- Chen, L.; Yu, Y.; Sun, D.-Z. Cloud and Water Vapor Feedbacks to the El Niño Warming: Are They Still Biased in CMIP5 Models? J. Clim. 2013, 26, 4947–4961. [Google Scholar] [CrossRef]
- Lin, R.; Zhu, J.; Zheng, F. The Application of the SVD Method to Reduce Coupled Model Biases in Seasonal Predictions of Rainfall. J. Geophys. Res. Atmos. 2019, 124, 11837–11849. [Google Scholar] [CrossRef]
- Zhang, M.; Mariotti, A.; Lin, Z.; Ramasmamy, V.; Lamarque, J.; Xie, Z.; Zhu, J. Coordination to understand and reduce global model biases by U.S. and Chinese Institutions. Bull. Am. Meteorol. Soc. 2018, 99, ES109–ES113. [Google Scholar] [CrossRef] [Green Version]
Figure 1.
Climatological (a) precipitation change (units: mm/d), (b) sea surface temperature (SST) change (units: °C) and (c) vertical velocity at 500-hPa change (Units: Pa/s) from July to August in the western North Pacific region. The change means the difference between August and July. The black box denotes the region mainly focused in this study (10–25° N, 115–155° E).

Figure 2.
Geography mentioned in the study.

Figure 3.
Climatology of the vertical velocity at 500-hPa in (a) July and (b) August (units: Pa/s). The black box denotes the region mainly focused on in this study (10–25° N, 115–155° E).
Figure 3.
Climatology of the vertical velocity at 500-hPa in (a) July and (b) August (units: Pa/s). The black box denotes the region mainly focused on in this study (10–25° N, 115–155° E).

Figure 4.
Climatological surface flux change in (a) shortwave, (b) longwave, (c) latent, and (d) sensible heat from July to August (units: W/m2). The change means the difference between August and July. The black box denotes the region mainly focused on in this study (10–25° N, 115–155° E).
Figure 4.
Climatological surface flux change in (a) shortwave, (b) longwave, (c) latent, and (d) sensible heat from July to August (units: W/m2). The change means the difference between August and July. The black box denotes the region mainly focused on in this study (10–25° N, 115–155° E).

Figure 5.
The moisture budget for the precipitation change from July to August (units: mm/d). (a) Climatological precipitation change from July to August; (b) , (c) (d) , (e) , (f) evaporation change. The black box denotes the region mainly focused on in this study (10–25° N, 115–155° E). The change means the difference between August and July.

Figure 6.
Regional averaged moisture budget in the focus region (10–25° N, 115–155° E).

Figure 7.
(a) Climatological precipitation change in observation, multi-model ensemble (MME) of AMIP simulations, and AMIP simulations from each model (units: mm/d). Black dots in MME denote the regions where 80% of the CMIP6 model results agree with the ensemble mean results. (b) The area-averaged precipitation change over the main focus region in this study (10–25° N, 115–155° E). The change means the difference between August and July.

Figure 8.
The same as in Figure 7, but for historical experiments.
Figure 8.
The same as in Figure 7, but for historical experiments.

Figure 9.
The same as Figure 7, but for the vertical velocity at 500-hPa (units: Pa/s).
Figure 9.
The same as Figure 7, but for the vertical velocity at 500-hPa (units: Pa/s).

Figure 10.
The same as Figure 8, but for the vertical velocity at 500-hPa (units: Pa/s).
Figure 10.
The same as Figure 8, but for the vertical velocity at 500-hPa (units: Pa/s).

Figure 11.
Regional averaged (10–25° N, 115–155° E) climatological precipitation change (green dots, Units: mm/d) versus 500-hPa vertical velocity change (bars, units: Pa/s) from July to August in the observation and historical simulations for each model. The change means the difference between August and July.

Figure 12.
(a) Scatterplot of the skill score of the climatological 500-hPa vertical velocity change vs. precipitation change in the AMIP (blue) and historical (red) experiments. The skill scores for precipitation and 500-hPa vertical velocity in MME (labeled 1) and each model are shown in (b,c), respectively. The change means the difference between August and July.


Table 1.
Information on the CMIP6 models used in this study.
| Model ID | Institute | Atmospheric Resolution | Integration Period | ||
|---|---|---|---|---|---|
| AMIP | Historical | ||||
| 2 | BCC-CSM2-MR | Beijing Climate Center, China | 320 × 160 | 1979–2014 | 1850–2014 |
| 3 | BCC-ESM1 | 128 × 64 | |||
| 4 | CAMS-CSM1-0 | Chinese Academy of Meteorological Sciences, China | 320 × 160 | ||
| 5 | CanESM5 | Canadian Centre for Climate Modelling and Analysis, Environment and Climate Change Canada | 128 × 64 | ||
| 6 | CESM2 | National Center for Atmospheric Research, Climate and Global Dynamics Laboratory, USA | 288 × 192 | ||
| 7 | CESM2-FV2 | 144 × 96 | |||
| 8 | CESM2-WACCM | 288 × 192 | |||
| 9 | CESM2-WACCM-FV2 | 144 × 96 | |||
| 10 | CIESM | Department of Earth System Science, Tsinghua University, China | 288 × 192 | ||
| 11 | E3SM-1-0 | LLNL; ANL; BNL; LANL; LBNL; ORNL; PNNL; SNL; USA | 360 × 180 | ||
| 12 | EC-Earth3-Veg | EC-Earth-Consortium | 512 × 256 | ||
| 13 | FGOALS-f3-L | Chinese Academy of Sciences, China | 288 × 180 | ||
| 14 | FGOALS-g3 | 180 × 80 | |||
| 15 | FIO-ESM-2-0 | First Institute of Oceanography, State Oceanic Administration, Qingdao National Laboratory for Marine Science and Technology, China | 288 × 192 | ||
| 16 | IITM-ESM | Indian Institute of Tropical Meteorology, India | 192 × 94 | ||
| 17 | INM-CM4-8 | Institute for Numerical Mathematics, Russian Academy of Science, Russia | 180 × 120 | ||
| 18 | INM-CM5-0 | 180 × 120 | |||
| 19 | KACE-1-0-G | National Institute of Meteorological Sciences/Korea Meteorological Administration, Climate Research Division, Republic of Korea | 192 × 144 | ||
| 20 | MIROC6 | JAMSTEC, AORI, NIES, and R-CCS, Japan | 256 × 128 | ||
| 21 | MPI-ESM1-2-HR | Max Planck Institute for Meteorology, Germany | 384 × 192 | ||
| 22 | MRI-ESM2-0 | Meteorological Research Institute, Tsukuba, Japan | 320 × 160 | ||
| 23 | NESM3 | Nanjing University of Information Science and Technology, China | 192 × 96 | ||
| 24 | NorCPM1 | NorESM Climate modeling Consortium consisting of CICERO, MET-Norway, NERSC, NILU, UiB and UNI, Norway | 144 × 96 | ||
| 25 | NorESM2-LM | ||||
| 26 | SAM0-UNICON | Seoul National University, Republic of Korea | 288 × 192 | ||
| 27 | TaiESM1 | Research Center for Environmental Changes, Academia Sinica, Nankang, Taiwan | 288 × 192 | ||
Table 2.
Abbreviations for some institutes mentioned in Table 1.
Table 2.
Abbreviations for some institutes mentioned in Table 1.
| Abbreviations | Full Names |
|---|---|
| LLNL | Lawrence Livermore National Laboratory |
| ANL | Argonne National Laboratory |
| BNL | Brookhaven National Laboratory |
| LANL | Los Alamos National Laboratory |
| LBNL | Lawrence Berkeley National Laboratory |
| ORNL | Oak Ridge National Laboratory |
| PNNL | Pacific Northwest National Laboratory |
| SNL | Sandia National Laboratories |
| JAMSTEC | Japan Agency for Marine-Earth Science and Technology |
| AORI | Atmosphere and Ocean Research Institute, the University of Tokyo |
| NIES | National Institute for Environmental Studies |
| R-CCS | RIKEN Center for Computational Science |
| CICERO | Center for International Climate and Environmental Research |
| MET | Norwegian Meteorological Institute |
| NERSC | Nansen Environmental and Remote Sensing Center |
| NILU | Norwegian Institute for Air Research |
| UiB | University of Bergen |
| UiO | University of Oslo |
| UNI | Uni Research |
Table 3.
Correlation coefficient, SDR and skills for precipitation.
| Models | Correlation | SDR | Skill | |||
|---|---|---|---|---|---|---|
| AMIP | Historical | AMIP | Historical | AMIP | Historical | |
| MME | 0.40 | 0.80 | 0.54 | 0.70 | 0.34 | 0.72 |
| BCC-CSM2-MR | 0.42 | 0.50 | 0.92 | 1.09 | 0.50 | 0.56 |
| BCC-ESM1 | 0.45 | 0.40 | 1.30 | 0.96 | 0.49 | 0.49 |
| CAMS-CSM1-0 | 0.68 | 0.63 | 1.46 | 1.41 | 0.61 | 0.59 |
| CanESM5 | 0.37 | 0.63 | 0.94 | 1.10 | 0.46 | 0.66 |
| CESM2 | 0.05 | 0.72 | 0.75 | 1.13 | 0.26 | 0.73 |
| CESM2-FV2 | −0.17 | 0.63 | 0.78 | 0.83 | 0.16 | 0.65 |
| CESM2-WACCM | −0.24 | 0.68 | 0.99 | 1.04 | 0.15 | 0.71 |
| CESM2-WACCM-FV2 | −0.36 | 0.54 | 0.94 | 0.85 | 0.10 | 0.57 |
| CIESM | −0.16 | 0.64 | 1.16 | 1.07 | 0.17 | 0.67 |
| E3SM-1-0 | 0.32 | 0.73 | 0.59 | 1.09 | 0.33 | 0.74 |
| EC-Earth3-Veg | 0.66 | 0.70 | 1.13 | 1.09 | 0.68 | 0.72 |
| FGOALS-f3-L | 0.16 | 0.47 | 0.97 | 0.81 | 0.34 | 0.51 |
| FGOALS-g3 | 0.07 | 0.50 | 1.48 | 1.26 | 0.25 | 0.53 |
| FIO-ESM-2-0 | 0.34 | 0.65 | 0.75 | 0.96 | 0.42 | 0.68 |
| IITM-ESM | 0.35 | 0.67 | 0.95 | 1.11 | 0.46 | 0.69 |
| INM-CM4-8 | 0.11 | 0.39 | 0.98 | 1.09 | 0.31 | 0.48 |
| INM-CM5-0 | 0.20 | 0.44 | 1.03 | 1.19 | 0.36 | 0.50 |
| KACE-1-0-G | 0.43 | 0.56 | 0.95 | 1.48 | 0.51 | 0.53 |
| MIROC6 | −0.04 | 0.23 | 1.25 | 0.93 | 0.22 | 0.37 |
| MPI-ESM1-2-HR | 0.27 | 0.54 | 0.91 | 1.19 | 0.40 | 0.57 |
| MRI-ESM2-0 | 0.31 | 0.65 | 0.94 | 1.13 | 0.43 | 0.67 |
| NESM3 | 0.55 | −0.01 | 1.34 | 0.77 | 0.55 | 0.23 |
| NorCPM1 | 0.01 | 0.58 | 0.71 | 0.72 | 0.23 | 0.56 |
| NorESM2-LM | −0.03 | 0.63 | 0.84 | 1.04 | 0.23 | 0.66 |
| SAM0-UNICON | 0.05 | 0.56 | 1.06 | 0.97 | 0.28 | 0.61 |
| TaiESM1 | 0.12 | 0.67 | 0.75 | 0.91 | 0.29 | 0.69 |
Table 4.
Correlation coefficient, SDR and skills for vertical velocity at 500-hPa.
| Models | Correlation | SDR | Skill | |||
|---|---|---|---|---|---|---|
| AMIP | Historical | AMIP | Historical | AMIP | Historical | |
| MME | 0.38 | 0.73 | 0.59 | 0.77 | 0.36 | 0.69 |
| BCC-CSM2-MR | 0.29 | 0.47 | 1.03 | 1.14 | 0.42 | 0.53 |
| BCC-ESM1 | 0.40 | 0.37 | 1.27 | 1.00 | 0.46 | 0.47 |
| CAMS-CSM1-0 | 0.47 | 0.43 | 1.46 | 1.60 | 0.47 | 0.41 |
| CanESM5 | 0.31 | 0.54 | 1.06 | 1.30 | 0.43 | 0.55 |
| CESM2 | 0.11 | 0.61 | 0.88 | 1.18 | 0.30 | 0.63 |
| CESM2-FV2 | −0.15 | 0.60 | 0.93 | 0.97 | 0.18 | 0.64 |
| CESM2-WACCM | −0.18 | 0.62 | 1.10 | 1.14 | 0.17 | 0.65 |
| CESM2-WACCM-FV2 | −0.26 | 0.47 | 1.06 | 0.98 | 0.14 | 0.54 |
| CIESM | −0.15 | 0.64 | 1.21 | 1.16 | 0.17 | 0.66 |
| E3SM-1-0 | 0.36 | 0.60 | 0.82 | 1.41 | 0.44 | 0.57 |
| EC-Earth3-Veg | 0.65 | 0.61 | 1.34 | 1.25 | 0.62 | 0.62 |
| FGOALS-f3-L | 0.19 | 0.52 | 1.08 | 0.96 | 0.35 | 0.58 |
| FGOALS-g3 | 0.28 | 0.26 | 1.80 | 1.85 | 0.29 | 0.28 |
| FIO-ESM-2-0 | 0.37 | 0.62 | 0.84 | 1.04 | 0.46 | 0.65 |
| IITM-ESM | 0.23 | 0.57 | 1.15 | 1.45 | 0.37 | 0.54 |
| INM-CM4-8 | 0.20 | 0.45 | 0.85 | 0.94 | 0.35 | 0.53 |
| INM-CM5-0 | 0.33 | 0.49 | 0.94 | 1.12 | 0.44 | 0.55 |
| KACE-1-0-G | 0.40 | 0.52 | 1.00 | 1.63 | 0.49 | 0.46 |
| MIROC6 | −0.02 | 0.16 | 1.23 | 1.13 | 0.23 | 0.33 |
| MPI-ESM1-2-HR | 0.28 | 0.48 | 0.98 | 1.26 | 0.41 | 0.52 |
| MRI-ESM2-0 | 0.34 | 0.49 | 1.12 | 1.33 | 0.44 | 0.51 |
| NESM3 | 0.44 | 0.16 | 1.33 | 0.87 | 0.48 | 0.33 |
| NorCPM1 | 0.01 | 0.51 | 0.77 | 0.84 | 0.24 | 0.56 |
| NorESM2-LM | 0.04 | 0.54 | 0.93 | 1.14 | 0.27 | 0.58 |
| SAM0-UNICON | 0.18 | 0.58 | 1.23 | 1.11 | 0.33 | 0.61 |
| TaiESM1 | 0.15 | 0.61 | 0.89 | 1.02 | 0.33 | 0.65 |
Publisher’s Note: MDPI stays neutral with regard to jurisdictional claims in published maps and institutional affiliations. |
© 2021 by the authors. Licensee MDPI, Basel, Switzerland. This article is an open access article distributed under the terms and conditions of the Creative Commons Attribution (CC BY) license (https://creativecommons.org/licenses/by/4.0/).
Share and Cite
MDPI and ACS Style
Dong, X.; Lin, R. Climatological Increased Precipitation from July to August in the Western North Pacific Region Simulated by CMIP6 Models. Atmosphere 2021, 12, 664. https://0-doi-org.brum.beds.ac.uk/10.3390/atmos12060664
AMA Style
Dong X, Lin R. Climatological Increased Precipitation from July to August in the Western North Pacific Region Simulated by CMIP6 Models. Atmosphere. 2021; 12(6):664. https://0-doi-org.brum.beds.ac.uk/10.3390/atmos12060664
Chicago/Turabian StyleDong, Xiao, and Renping Lin. 2021. "Climatological Increased Precipitation from July to August in the Western North Pacific Region Simulated by CMIP6 Models" Atmosphere 12, no. 6: 664. https://0-doi-org.brum.beds.ac.uk/10.3390/atmos12060664
Note that from the first issue of 2016, this journal uses article numbers instead of page numbers. See further details here.