
Analysis of Telematics Data of Combine Harvesters and Evaluation of Potential to Reduce Environmental Pollution


Institute of Agricultural Engineering and Safety, Agriculture Academy, Vytautas Magnus University, LT-53362 Kaunas, Lithuania
*
Author to whom correspondence should be addressed.
Atmosphere 2021, 12(6), 674; https://0-doi-org.brum.beds.ac.uk/10.3390/atmos12060674
Submission received: 19 April 2021
/
Revised: 20 May 2021
/
Accepted: 22 May 2021
/
Published: 25 May 2021
(This article belongs to the Special Issue Agricultural Pollutants in the Atmosphere)
Abstract
:The combine harvester (CH) is one of the most important machines with the most powerful engine used in the agricultural sector. It consumes significant amounts of diesel fuel and harms ambient air by releasing emissions. This study examines the telematics data of CHs (models with axial threshing apparatus) collected between 2017 and 2020. The time spent in various operating modes of CH, the fuel consumption, and the negative impact on the ambient air (expressed in global warming potential–(GWP)) were calculated. Field tests using the same CH model were also performed to confirm the collected telematics data’s values. Possibilities to minimize fuel consumption and air pollution by selecting the correct use of technological operations are evaluated. Telematics data analysis results showed that the CH spends ~18% and ~13% of the time in the idle and transport modes, respectively. It was also found that ~12% of diesel fuel was consumed outside the direct harvesting mode, amounting to 4.7 t year−1 of GWP per machine. Dual telematics/field studies showed that the optimal use of the CH in idle and transport modes could reduce the amount of pollutants released into the environment in terms of GWP by 1.3 t year−1 for one machine. Field tests have also shown that the GWP per ton of wheat harvest highly depended on the CH driving speed during harvesting. The optimum speed was determined as 4 km h−1, and the wheat grain and straw feed rate was determined as 24 kg s−1.
1. Introduction
According to the Fifth Assessment Report of the Intergovernmental Panel on Climate Change (IPCC), mitigation requires limiting the global average temperature increase to 2 °C compared to the pre-industrial period. In scenarios developed by the IPCC, excluding mitigation policies, temperatures could rise by 4.8 °C in 2100 [1]. Climate change poses a serious global threat that requires specific measures to address, especially from the main sources of greenhouse gas (GHG) emissions. Agricultural activities are widely recognized as a significant pollution source, especially in terms of GHG emissions, deteriorating water quality, water wastage, and biodiversity loss [2,3,4]. Air pollution also negatively affects human health. In 2013, the World Health Organization (WHO) classified air pollution as a carcinogen, and in Europe, air pollution is the most significant negative external factor for health [5]. According to the WHO and the Organization for Economic Co-operation and Development (OECD), premature mortality from air pollution in the European Union per 1,000,000 of the population in 2019 was 360 [6].
The transport sector (including agriculture) is one of the primary sources of GHG emissions. Internal combustion engines (ICEs) predominate in modern society, covering various applications and operations in different market niches (e.g., agriculture, transportation, and industry). Emissions and air pollution from agricultural machinery are rising and are of growing concern [7,8]. New strategies to reduce GHG emissions are being developed worldwide to combat their impact on air quality, human health, and climate change [9]. The effect of a combine harvester’s (CH) emissions on global warming potential (GWP) is primarily influenced by the direct use of diesel fuel and its conversion to CO2 in ICE. Other emissions, including but not limited to N2O and CH4, can be reduced using different engine technologies (diesel oxidation catalyst, diesel particulate filter, selective catalytic reduction, ammoniac oxidation catalyst, and diesel exhaust fluid) [10]. Moreover, a direct correlation exists between CO2 emissions and fuel consumption, so CO2 emissions can only be reduced if less fuel is used [11,12]. CO2 emissions can also be reduced by using fuel additives [13,14,15] or changing fuels [16,17]. As no other practical technologies exist currently to replace fossil fuels’ use, every effort must be made to increase the efficiency of agricultural machinery. This is noticeable when using the machine in idle and transport modes (especially in CH). Examples of reducing fuel consumption and CO2 emissions by increasing machine efficiency or better matching the engine operation to the work conditions are provided in the literature, for example on tractors [18] or woodchippers [19,20]. The idling mode of agricultural machinery is harmful to the environment and human health [21]. Machines powered by ICE (e.g., tractors, woodchippers) can run idle for 10–70% of their total life [21,22]. The idle mode is only necessary under certain conditions (such as attaching or changing implements); otherwise, it wastes fuel [21]. Several reasons exist why the machine stays idle for a long time; one such reason is the operator’s comfort and air conditioning in the machine’s cab [23]. The following engine improvement systems can be highlighted to reduce idle emissions: start–stop [24,25], speed reduction [19,20], and cylinder shut-off [26,27]. Another significant economic and environmental factor is the interaction between different agricultural machines [28]. For CH, the method of grain unloading and whether the CH makes unnecessarily long trips from one field to another should be considered. To reduce the use of the transport mode, it may be necessary to evaluate the possibility of transporting CH by auxiliary transport and better route planning in harvest fields [29]. Generally, performance data of agricultural machinery are often insufficiently analyzed or analyzed using unreliable data [30].
This study quantifies CHs’ impact on ambient air using diesel fuel, specifies how many technological operations contribute to GWP, substantiates the possibilities of reducing the use of diesel fuel, and determines which technological operations least affect the environment negatively when using a CH. We will justify the benefits of a dual telematics data analysis and field test method for comprehensive evaluation. We will also propose a continuous process model for achieving economic and environmental goals.
2. Data and Methods
2.1. Evaluation of Telematics Data
Telematics data collected by one of the world’s leading manufacturers of CH were analyzed. After connecting to the manufacturer’s system, a specific CH model’s data were filtered separately for 2017, 2018, 2019, and 2020. Five CHs of this model were analyzed (all telematics data for this model were found in the system using the available access level). This CH model has an axial threshing apparatus and one of the most powerful internal combustion engines on the market (>500 hp). Its impact on the environment through the use of diesel fuel is high and it is a suitable object for research. The above model data were downloaded to a personal computer in separate files for each machine for each year. To process the data statistically, all data were imported into a single database. The telematics system stores several indicators (~150 indicators in CH); only those necessary for our study were selected. Working hours and consumed diesel fuel were used in various operating modes. Table 1 shows the indicators used for the analysis.
The time spent in the idle engine state (TIdle) was calculated using Equation (1).
TIdle = T1 + T2
The time spent in the work mode (TWork) was calculated using Equation (2).
TWork = T3 + T4 + T5 + T6
The time spent in the transport mode (TTransport) was calculated using Equation (3).
TTransport = T7 + T8
Diesel fuel consumption in the idle mode (FIdle) was calculated using Equation (4)
FIdle = F1 + F2
Diesel fuel consumption in the work mode (FWork) was calculated using Equation (5).
FWork = F3 + F4 + F5 + F6
Diesel fuel consumption in the transport mode (FTransport) was calculated using Equation (6).
FTransport = F7 + F8
2.2. Test Field and CH Specifications
Field trials were conducted on 27 July 2019 on an agricultural company’s crop production land. Field coordinates were 54.8020, 22.9896 (54°48’07.2” N 22°59’22.6” E). The winter wheat variety Informer was used in the harvest tests. Five samples were collected randomly from five locations on a 0.25 m2 field location area to determine the weight of 1 m2 of the crop. The total weight of wheat grain and straw was 1952.4 ± 94.1 g m−2 (grain moisture: 20.2 ± 1.4%).
The wheat flow mass delivered to the CH was calculated using Equation (7)
where q denotes the wheat grain and straw mass fed to the CH (feed rate) in kg s−1, Vh denotes the CH speed during harvesting in m s−1, Hw denotes the CH header width in m, and Wm denotes the mass of the wheat in 1 m2. Table 2 provides the exact measurement specifications for the CH.
q = Vh × Hw × Wm,
During the field test, fuel consumption was recorded using data from the CH’s integrated on-board computer. For each technological operation or change in harvesting speed, 10 on-board computer readings were recorded at equal 10 s intervals. Fixed engine speeds (1200, 1690, and 2200 rpm−1) specific to this CH model were used to investigate the impact of technological operations on GWP.
2.3. Methodology of GWP Calculation
For calculating GHG and GWP, the fuel consumption data of the telematics database were converted from L year−1 and L h−1 to kg year−1 and kg h−1, respectively. A volume-to-mass conversion factor of 0.832 kg L−1 [31,32,33] of diesel fuel was used.
GHG emissions from the telematics data analysis were estimated using the methodology described in Chapter 1.A.4.c.ii of the EMEP/EEA’s Air Pollutant Emission Inventory Guidebook [34]:
where E pollutant denotes the emission of a specified GHG (CO2, N2O, and CH4), FC fuel type denotes the fuel consumption, and EF pollutant denotes the pollutant’s emission factor (g t−1 or kg t−1) of consumed diesel fuel (Table 3).
E pollutant = FC fuel type × EF pollutant,
The GHG impact on the GWP was estimated using Equation (9)
GWP = ECO2 + 25 × ECH4 + 298 × EN2O.
2.4. Statistical Analysis
The data were analyzed using Statistica 10.0 (TIBCO Software) statistical software with a significance level of 0.05 as the criterion.
3. Results and Discussion
Table 4 shows the results of the telematics data analysis of CHs operating from 2017–2020. The main parameters that reveal the structure CHs use and the ambient air impact using diesel fuel are presented.
By analyzing the telematics database data, we found that significant CH time is spent without direct work while harvesting. In 2017–2020, a CH spent an average time of 17.5% and 13.1% in idle and transport modes, respectively. Diesel fuel was used in these modes, respectively, with an impact of 3.7 and 7.9% on GWP. Notably, the CHs spent 30.6% of their time and consumed 11.6% of fuel when not harvesting, with an average GWP impact of 4.7 t year−1 per machine. Analyzing the result of the telematics database, we notice that different machines work different hours per year. The minimum fixed value was more than 2.5 times lower than the maximum. Separately, we would like to note that the percentage of working time devoted to indirect work also varied between individual machines. The lowest percentage recorded in the database for indirect work was 23.0% and the highest 41.1%, respectively. This suggests that there is scope for reducing the cost of indirect work. In terms of GWP per hour of individual machine (especially in harvesting mode), the confidence interval from the average is not large and amounts to ± 9.0 kg h−1 (variation coefficient 2.1%).
During this study, the structure of the idle mode was considered. From Table 5, the CH spent some time standing still with a full-grain tank (~1.7 h year−1). We can assume that this time should approach zero by better organizing the auxiliary transport’s work receiving the grain. The other time spent in idle mode should also approach zero. Based on informal conversations with CH operators, the machine’s engine is not switched off on hot summer days due to the air conditioner’s pleasant cabin temperature. Future engineers will tackle how to cool the air in the cabin without using a powerful and fuel-intensive diesel engine.
When thoroughly assessing the CH’s efficiency, from the viewpoint of economic and environmental benefits, it is better to unload the grain while the CH is harvesting [38,39]. In this process, the auxiliary transport approaches the threshing CH and receives the grain while moving together in parallel. This approach is directly related to the excellent cooperation of the whole team during the harvest. The harvested crop is unloaded more than 50% of the time when the CH is stationary (Table 5). Examining the data from the telematics database shows that the crop-unloading method is different for each machine. The “winner” unloads the harvested grain as much as 94.5% of the time while continuing to work. Meanwhile, the “loser” of the investigated database unloads grain as much as 87.5% of the time when standing. Thus, we can conclude that this aspect is not limited to insurmountable circumstances but depends on work organization and workers’ skills. Other authors agree that energy efficiency is vital for sustainable agriculture, as it saves money, conserves fossil fuels, and reduces air pollution [40].
The total time spent (45.1 h year−1) in the idle mode needs to be minimized, but it is difficult or impossible in real life. When the CH is stationary with the engine running, its fuel consumption and environmental impact depend on which process gears are switched on and at what speed the engine is running. Figure 1 shows the results of field tests in which technological parameters were changed and the effect on GWP was measured.
From the obtained results, the GWP is most affected by the engine speed. An increase in the engine speed from 1200–1690 min−1 significantly increases the GWP by more than two times. It should be emphasized that modern CHs can automatically minimize the engine speed if it is stationary. However, manual CHs, where the operator manually adjusts the parameters, are still operating and will work in the fields for a long time.
The field tests of the CH model resulted in a minimum GWP of 16.1 kg h−1 in the idle mode. Simultaneously, from the database analysis results, the average result of all machines of this model is 33.0 kg h−1. By estimating that one machine spends an average of 45.1 h year−1 in idle mode, we get a potential 762.2 kg year−1 GWP saving.
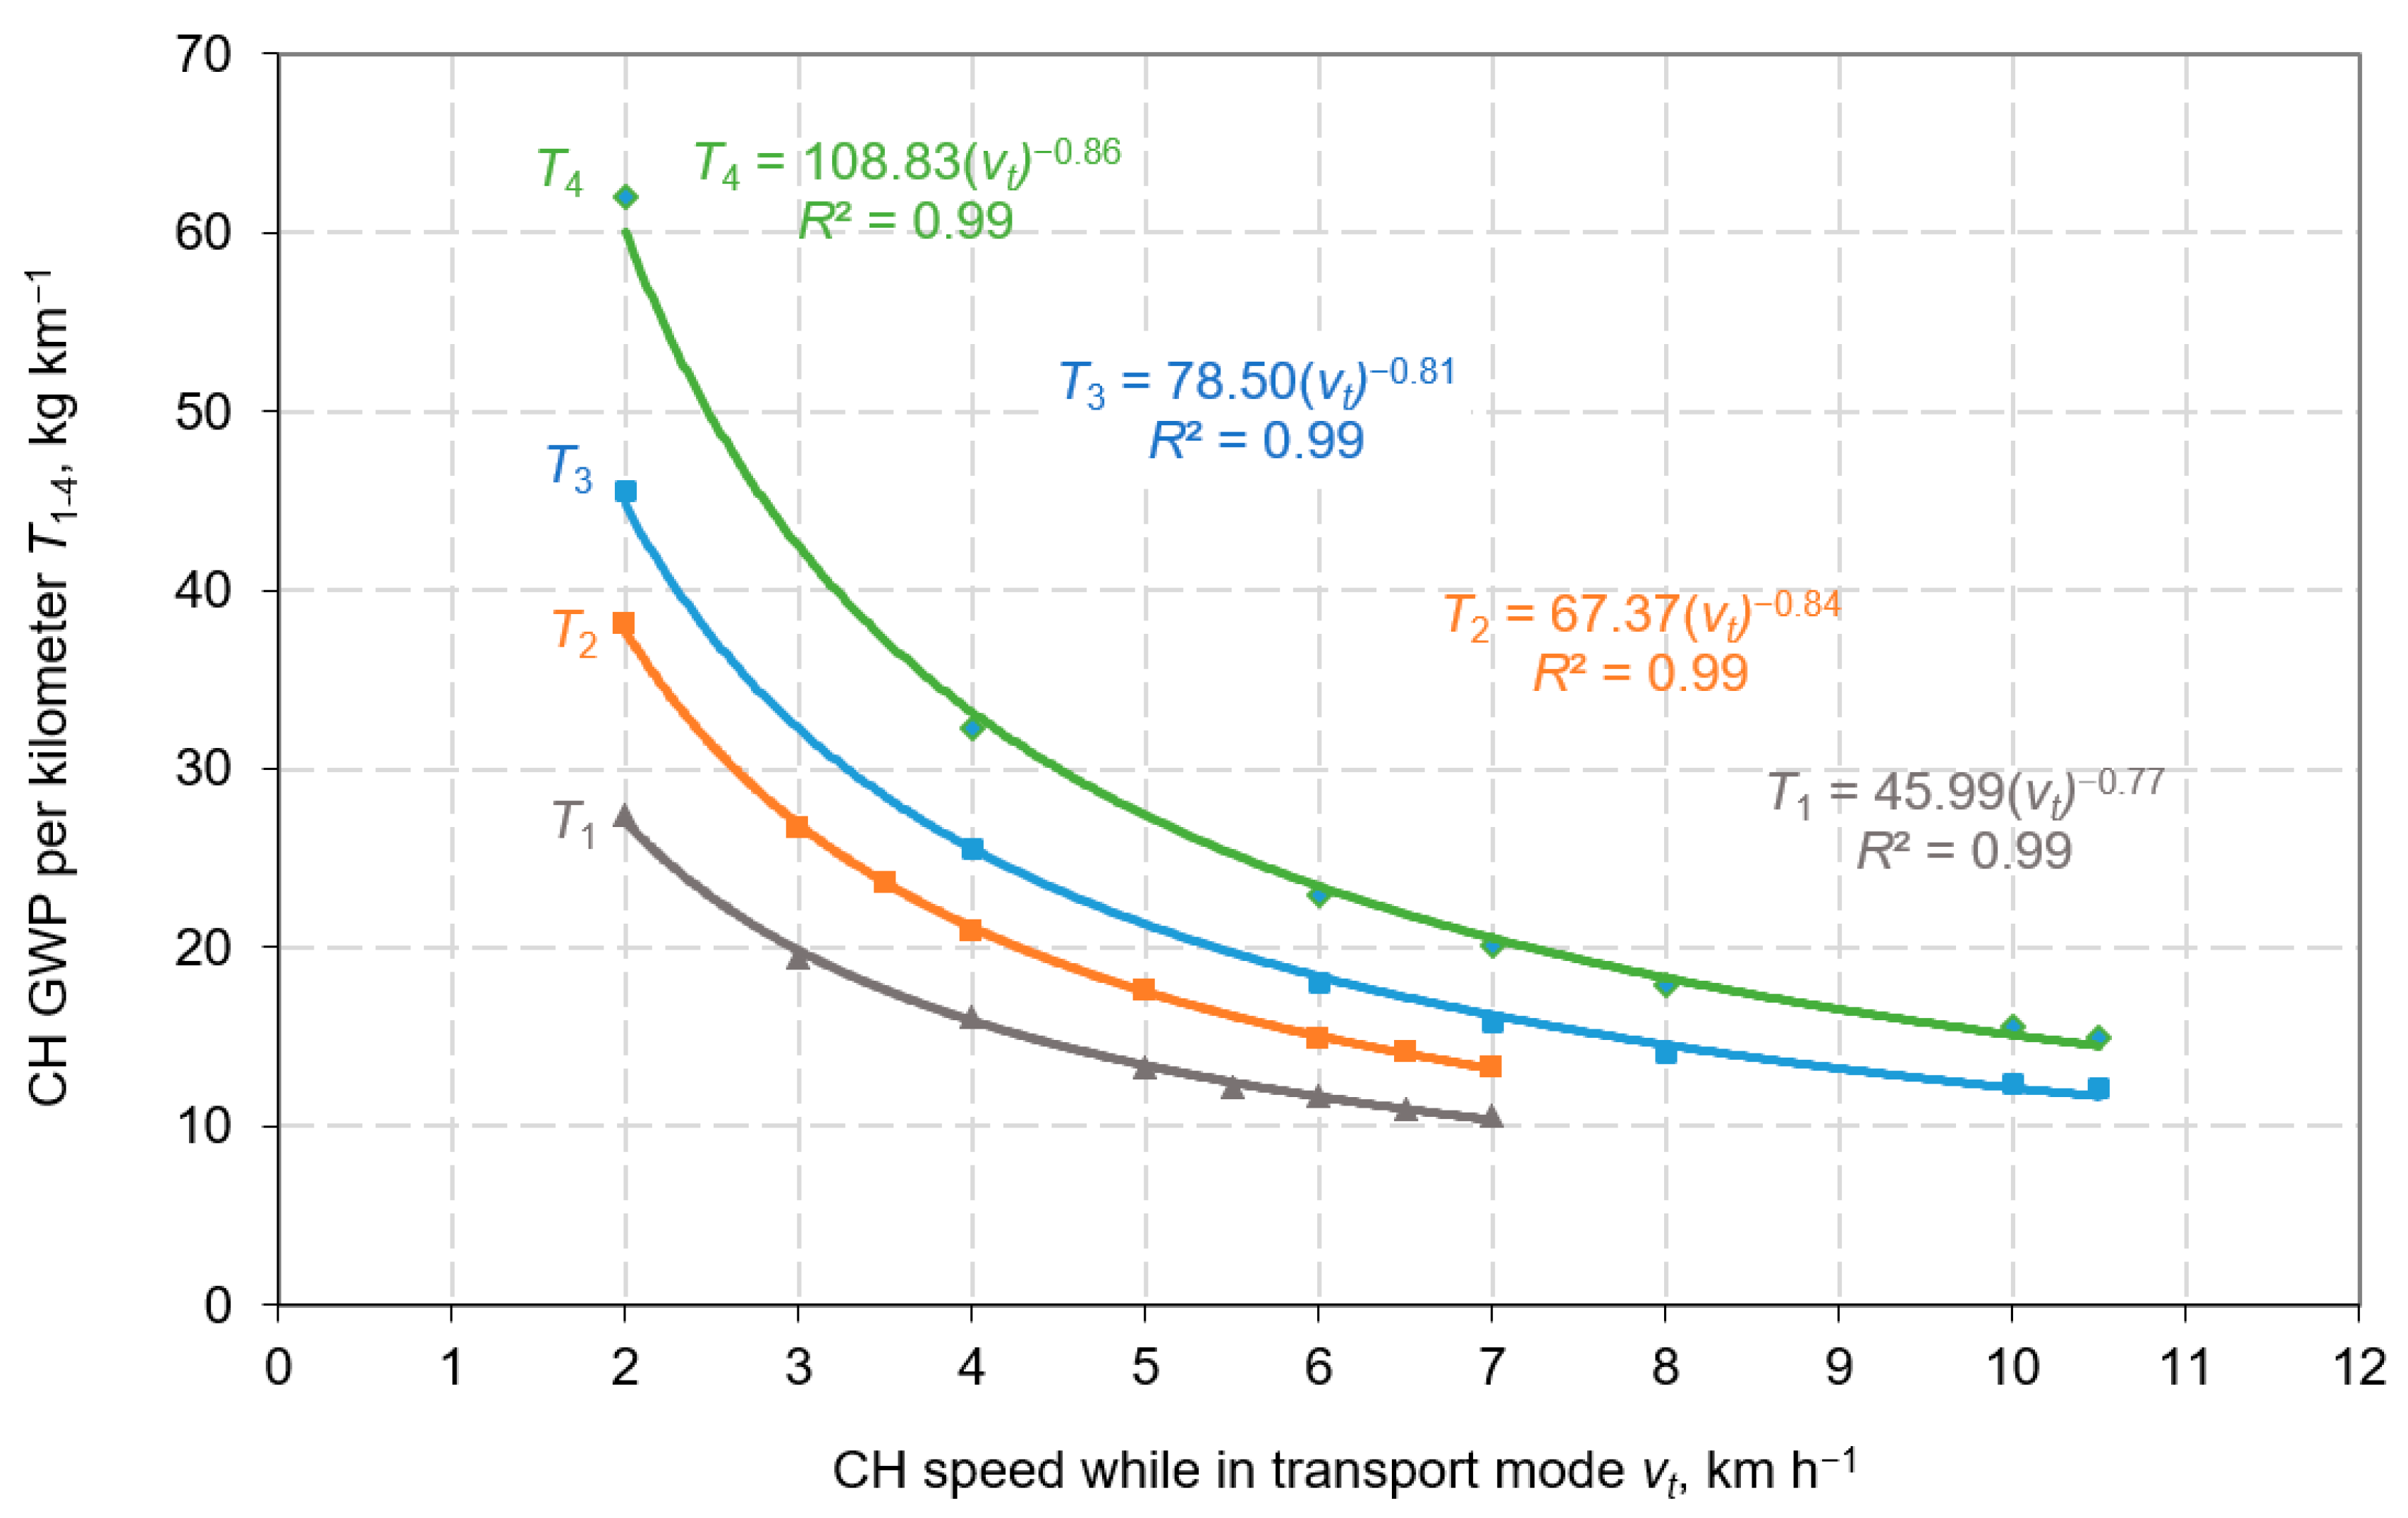
The transport mode has an equally important effect on the CH’s GWP. It is appropriate to determine its impact, not in absolute values, but in terms of one kilometer traveled. The results are shown in Figure 2.
Data from field tests have shown that driving and engine speeds have the most significant influence on GWP per kilometer traveled. The optimum driving speed is the maximum speed allowed at certain engine speeds. The lowest GWP per kilometer of this model CH was recorded at engine speeds of 1690 and 2200 min−1 at speeds of 7 and 10.5 km h−1, respectively.
When evaluating GWP in transport mode, we also estimated that non-switched technological operations have a significant impact. Adding the threshing, straw chopper, and cutter bar units together increase the GWP by ~25%, regardless of the engine speed (Figure 3).
The lowest GWP (74.1 kg h−1) was achieved in the field tests with all process gears turned off at a speed of 7 km h−1 and an engine speed of 1690 min−1. Simultaneously, examining the results of the telematics database shows that the average GWP recorded in the transport mode was 91.3 kg h−1 and, accordingly, 33.7 h year−1 was spent in such a regime. Ideally, it would be possible to drive the entire transport time at the optimum speed and parameters set during the field tests, potentially saving 579.6 kg year−1 GWP per machine. Other authors emphasized the importance of route planning when working with agricultural machinery, allowing for better resource use and greater efficiency [29].
As estimated from the telematics database, CHs have the largest amount of time (~69.4%) and the highest GWP (~88.4%) released into the environment during harvesting. Thus, research in this mode of operation must be comprehensive and all-encompassing. The driving speed influence during harvesting on hourly GWP was investigated in field tests (Figure 4). Notably, the driving speed at harvest is directly related to the flow of wheat supplied, which increases the engine load accordingly.
From the results, the average GWP when harvesting in the telematics system was 199.9 kg h−1, corresponding to that determined during the field tests at the harvesting speed of 3.3 km h−1. Even more important is to study the GWP per ton of wheat grain and straw processed (Figure 5).
As the CH’s driving speed increases during harvest, the feed rate of wheat increases while the GWP per ton of the processed wheat decreases. After reaching an optimum driving speed of 4 km h−1 for the CH and a supplied wheat flow of 24 kg s−1, the minimum GWP per ton was attained and exceeded afterward. At maximum speeds, a factor of grain damage and grain separation losses exist, which also needs to be considered. Other authors suggest estimating such losses because GWP per ton of wheat processed is only one factor [41,42].
After analyzing the telematics data and examining the potential savings of a particular CH to save diesel fuel while reducing the negative environmental impact, we can propose a process that would allow continuous improvement to achieve economic and environmental goals (Figure 6). The proposed process involves continuous testing of a specific machine in field tests to determine the maximum measures to reduce fuel consumption, make optimal use of the working time of expensive agricultural machinery, and reduce GWP. The analysis of historical telematics data exists (only the data of a specific machine can be analyzed, or the whole array of machines of the same model can be compared), which shows the real situation in time and fuel consumption. The data obtained during the field tests are compared with the recorded values in the telematics system, and possibilities for optimal work are analyzed. After the analysis, concrete measures are taken influencing economic and environmental factors, including but not limited to training of CH operators, machine adjustment, and better auxiliary transport organization.
Evaluating the results of the study, we see that to fully assess the potential for reducing diesel fuel use and simultaneously reducing ambient air pollution, the following additional studies can be performed in the future:
- The transport mode tests need to be extended to evaluate the CH’s travel in the field (low speed) and on public roads separately (high speed), and then establish separate recommendations for low and high speeds.
- To fully assess the impact of diesel fuel in the CH when harvesting winter wheat, it is necessary to evaluate the most suitable harvesting speed, wheat feed rate, grain damage, and grain separation losses [41,42,43]. Evaluating a minimum GWP per ton of the harvested wheat is not enough to assess the environmental impact and yield obtained.
- In order to establish general recommendations applicable to all CHs, analogous tests need to be performed on CHs with different engine powers. It would also be possible to compare the values obtained between different types of CHs (axial vs tangential threshing apparatus).
- An essential indicator of the CH’s efficiency is the technology of grain unloading from the grain tank [44,45]. The environmental impact during idle periods for a full and partially full grain tank and the unloading of grain while standing and harvesting should be investigated and assessed separately.
4. Conclusions
This study showed that a dual method of telematics data analysis and field testing is appropriate to identify the potential for CH sustainable use. The study proposed a process of continuous monitoring and self-regulation, allowing economic and environmental goals to be achieved. An analysis of the telematics database revealed that one-third of the CH’s time is spent not working directly but standing still with the engine running or driving from one field to another. Although the CH operates on average for a short time per year (~250 h year−1), it consumes a significant amount of diesel fuel with a GWP impact of >40 t year−1. Efforts should be made to minimize idle and transport modes, but when not possible, then the engine speed must be reduced, and unused technological gears must be switched off. An increase in engine speed from 1200–1690 min−1 resulted in a 2.2-fold increase in GWP in the idle mode. In the transport mode, the least negative impact on the environment per kilometer was obtained when driving at the maximum possible speed at certain engine speeds, and simultaneously, engaging in threshing, straw chopper, and cutter bar units increased GWP by ~25%. For the investigated CH, by selecting the optimal parameters in idle and transport modes, a lower GWP release into the environment of 1.3 t year−1 was possible. Besides, the minimum GWP per ton of wheat processed was obtained when the CH ran at a speed of 4 km h−1, supplying wheat at 24 kg s−1.
Author Contributions
D.S. (Dainius Savickas), D.S. (Dainius Steponavičius), R.D. Conceptualization, D.S. (Dainius Savickas), D.S. (Dainius Steponavičius), and R.D.; methodology, D.S. (Dainius Savickas) and D.S. (Dainius Steponavičius); software, D.S. (Dainius Savickas); validation, D.S. (Dainius Savickas) and D.S. (Dainius Steponavičius); formal analysis, D.S. (Dainius Savickas), D.S. (Dainius Steponavičius), and R.D.; investigation, D.S. (Dainius Savickas), D.S. (Dainius Steponavičius), and R.D.; resources, D.S. (Dainius Savickas) and D.S. (Dainius Steponavičius); data curation, D.S. (Dainius Savickas), D.S. (Dainius Steponavičius), and R.D.; writing—original draft preparation, D.S. (Dainius Savickas); writing—review and editing, D.S. (Dainius Savickas), D.S. (Dainius Steponavičius), and R.D.; visualization, D.S. (Dainius Savickas); supervision, D.S. (Dainius Steponavičius). All authors have read and agreed to the published version of the manuscript.
Funding
This research received no external funding.
Institutional Review Board Statement
Not applicable.
Informed Consent Statement
Not applicable.
Data Availability Statement
The data that support the findings of this study are available from the corresponding author, D. Savickas, upon reasonable request.
Acknowledgments
The authors would like to thank Enago (www.enago.com (accessed on 23 May 2021)) for the English language review.
Conflicts of Interest
The authors declare no conflict of interest.
References
- Ghiat, I.; Mahmood, F.; Govindan, R.; Al-Ansari, T. CO2 Utilisation in Agricultural Greenhouses: A Novel ‘Plant to Plant’ Approach Driven by Bioenergy with Carbon Capture Systems within the Energy, Water and Food Nexus. Energy Convers. Manag. 2021, 228, 113668. [Google Scholar] [CrossRef]
- Garnett, T. Where Are the Best Opportunities for Reducing Greenhouse Gas Emissions in the Food System (Including the Food Chain)? Food Policy 2011, 36, S23–S32. [Google Scholar] [CrossRef]
- Tang, Y.H.; Luan, X.B.; Sun, J.X.; Zhao, J.F.; Yin, Y.L.; Wang, Y.B.; Sun, S.K. Impact Assessment of Climate Change and Human Activities on GHG Emissions and Agricultural Water Use. Agric. For. Meteorol. 2021, 296, 108218. [Google Scholar] [CrossRef]
- Plath, E.; Rischen, T.; Mohr, T.; Fischer, K. Agriculture, Ecosystems and Environment Biodiversity in Agricultural Landscapes: Grassy Field Margins and Semi-Natural Fragments Both Foster Spider Diversity and Body Size. Agric. Ecosyst. Environ. 2021, 316, 107457. [Google Scholar] [CrossRef]
- de Nunzio, G.; Laraki, M.; Thibault, L. Road Traffic Dynamic Pollutant Emissions Estimation: From Macroscopic Road Information to Microscopic Environmental Impact. Atmosphere 2021, 12, 53. [Google Scholar] [CrossRef]
- OECD. Environment at a Glance 2020; OECD Publishing: Paris, France, 2020. [Google Scholar] [CrossRef]
- Hou, X.; Tian, J.; Song, C.; Wang, J.; Zhao, J.; Zhang, X. Emission Inventory Research of Typical Agricultural Machinery in Beijing, China. Atmos. Environ. 2019, 216, 116903. [Google Scholar] [CrossRef]
- Lovarelli, D.; Bacenetti, J. Exhaust Gases Emissions from Agricultural Tractors: State of the Art and Future Perspectives for Machinery Operators. Biosyst. Eng. 2019, 186, 204–213. [Google Scholar] [CrossRef]
- da Silveira, F.; Ruppenthal, J.E.; Lermen, F.H.; Machado, F.M.; Amaral, F.G. Technologies Used in Agricultural Machinery Engines That Contribute to the Reduction of Atmospheric Emissions: A Patent Analysis in Brazil. World Pat. Inf. 2021, 64, 102023. [Google Scholar] [CrossRef]
- Resitoglu, I.A.; Keskin, A.; Özarslan, H.; Bulut, H. Selective Catalytic Reduction of NOx Emissions by Hydrocarbons over Ag–Pt/Al2O3 Catalyst in Diesel Engine. Int. J. Environ. Sci. Technol. 2019, 16, 6959–6966. [Google Scholar] [CrossRef]
- Helmers, E.; Leitão, J.; Tietge, U.; Butler, T. CO2-Equivalent Emissions from European Passenger Vehicles in the Years 1995–2015 Based on Real-World Use: Assessing the Climate Benefit of the European “Diesel Boom”. Atmos. Environ. 2019, 198, 122–132. [Google Scholar] [CrossRef]
- Fontaras, G.; Zacharof, N.G.; Ciuffo, B. Fuel Consumption and CO2 Emissions from Passenger Cars in Europe–Laboratory versus Real-World Emissions. Prog. Energy Combust. Sci. 2017, 60, 97–131. [Google Scholar] [CrossRef]
- Rimkus, A.; Stravinskas, S.; Matijošius, J. Comparative Study on the Energetic and Ecologic Parameters of Dual Fuels (Diesel-NG and HVO-Biogas) and Conventional Diesel Fuel in a CI Engine. Appl. Sci. 2020, 10, 359. [Google Scholar] [CrossRef] [Green Version]
- Rimkus, A.; Matijošius, J.; Manoj Rayapureddy, S. Research of Energy and Ecological Indicators of a Compression Ignition Engine Fuelled with Diesel, Biodiesel (RME-Based) and Isopropanol Fuel Blends. Energies 2020, 13, 2398. [Google Scholar] [CrossRef]
- Mohamed, M.; Tan, C.-K.; Fouda, A.; Gad, M.S.; Abu-Elyazeed, O.; Hashem, A.-F. Diesel Engine Performance, Emissions and Combustion Characteristics of Biodiesel and Its Blends Derived from Catalytic Pyrolysis of Waste Cooking Oil. Energies 2020, 13, 5708. [Google Scholar] [CrossRef]
- Warguła, Ł.; Kukla, M.; Lijewski, P.; Dobrzyński, M.; Markiewicz, F. Impact of Compressed Natural Gas (CNG) Fuel Systems in Small Engine Wood Chippers on Exhaust Emissions and Fuel Consumption. Energies 2020, 13, 6709. [Google Scholar] [CrossRef]
- Warguła, Ł.; Kukla, M.; Lijewski, P.; Dobrzyński, M.; Markiewicz, F. Influence of the Use of Liquefied Petroleum Gas (LPG) Systems in Woodchippers Powered by Small Engines on Exhaust Emissions and Operating Costs. Energies 2020, 13, 5773. [Google Scholar] [CrossRef]
- Rymaniak, Ł.; Lijewski, P.; Kamińska, M.; Fuć, P.; Kurc, B.; Siedlecki, M.; Kalociński, T.; Jagielski, A. The Role of Real Power Output from Farm Tractor Engines in Determining Their Environmental Performance in Actual Operating Conditions. Comput. Electron. Agric. 2020, 173, 105405. [Google Scholar] [CrossRef]
- Warguła, Ł.; Krawiec, P.; Walus, K.J.; Kukla, M. Fuel Consumption Test Results for a Self-Adaptive, Maintenance-Freewood Chipper Drive Control System. Appl. Sci. 2020, 10, 2727. [Google Scholar] [CrossRef] [Green Version]
- Warguła, Ł.; Kukla, M.; Lijewski, P.; Dobrzynski, M.; Markiewicz, F. Influence of Innovative Woodchipper Speed Control Systems on Exhaust Gas Emissions and Fuel Consumption in Urban Areas. Energies 2020, 13, 3330. [Google Scholar] [CrossRef]
- Molari, G.; Mattetti, M.; Lenzini, N.; Fiorati, S. An Updated Methodology to Analyse the Idling of Agricultural Tractors. Biosyst. Eng. 2019, 187, 160–170. [Google Scholar] [CrossRef]
- Wargula, L.; Kukla, M.; Krawiec, P.; Wieczorek, B. Impact of Number of Operators and Distance to Branch Piles on Woodchipper Operation. Forests 2020, 11, 598. [Google Scholar] [CrossRef]
- Perozzi, D.; Mattetti, M.; Molari, G.; Sereni, E. Methodology to Analyse Farm Tractor Idling Time. Biosyst. Eng. 2016, 148, 81–89. [Google Scholar] [CrossRef]
- Lijewski, P.; Szymlet, N.; Fuć, P.; Domowicz, A.; Rymaniak, Ł. The Effect of Start-Stop Systems on Scooter Exhaust Emissions. Transp. Res. Part D: Transp. Environ. 2021, 91. [Google Scholar] [CrossRef]
- Mueller, N.; Strauss, S.; Tumback, S.; Goh, G.-C.; Christ, A. Next Generation Engine Start/Stop Systems: “Free-Wheeling”. Sae Int. J. Eng. 2011, 4, 874–887. [Google Scholar] [CrossRef]
- Gutarevych, Y.; Mateichyk, V.; Matijošius, J.; Rimkus, A.; Gritsuk, I.; Syrota, O.; Shuba, Y. Improving Fuel Economy of Spark Ignition Engines Applying the Combined Method of Power Regulation. Energies 2020, 13, 1076. [Google Scholar] [CrossRef] [Green Version]
- Vopa, J.; Fridrichov, K.; Dlugo, J. Overview of the Potential and Limitations of Cylinder Deactivation. Renew. Sustain. Energy Rev. 2021, 146. [Google Scholar] [CrossRef]
- Cao, R.; Li, S.; Ji, Y.; Zhang, Z.; Xu, H.; Zhang, M.; Li, M.; Li, H. Task Assignment of Multiple Agricultural Machinery Cooperation Based on Improved Ant Colony Algorithm. Comput. Electron. Agric. 2021, 182, 105993. [Google Scholar] [CrossRef]
- Rodias, E.; Berruto, R.; Busato, P.; Bochtis, D.; Sørensen, C.G.; Zhou, K. Energy Savings from Optimised In-Field Route Planning for Agricultural Machinery. Sustainability 2017, 9, 1956. [Google Scholar] [CrossRef] [Green Version]
- Mattetti, M.; Maraldi, M.; Lenzini, N.; Fiorati, S.; Sereni, E.; Molari, G. Outlining the Mission Profile of Agricultural Tractors through CAN-BUS Data Analytics. Comput. Electron. Agric. 2021, 184, 106078. [Google Scholar] [CrossRef]
- Chinnasamy, C.; Tamilselvam, P.; Ranjith, R. Influence of Aluminum Oxide Nanoparticle with Different Particle Sizes on the Working Attributes of Diesel Engine Fueled with Blends of Diesel and Waste Plastic Oil. Environ. Sci. Pollut. Res. 2019, 26, 29962–29977. [Google Scholar] [CrossRef]
- Savickas, D.; Steponavičius, D.; Kliopova, I.; Saldukaitė, L. Combine Harvester Fuel Consumption and Air Pollution Reduction. Water Air Soil Pollut. 2020, 231, 1–11. [Google Scholar] [CrossRef]
- Venkatesan, V.; Nallusamy, N.; Nagapandiselvi, P. Performance and Emission Analysis on the Effect of Exhaust Gas Recirculation in a Tractor Diesel Engine Using Pine Oil and Soapnut Oil Methyl Ester. Fuel 2021, 290, 120077. [Google Scholar] [CrossRef]
- EMEP/EEA Air Pollutant Emission Inventory Guidebook; European Environment Agency: Copenhagen, Denmark, 2019; Available online: https://www.eea.europa.eu/publications/emep-eea-guidebook-2019 (accessed on 23 May 2021).
- Huang, R.; Liu, J.; He, X.; Xie, D.; Ni, J.; Xu, C.; Zhang, Y.; Ci, E.; Wang, Z.; Gao, M. Reduced Mineral Fertilization Coupled with Straw Return in Field Mesocosm Vegetable Cultivation Helps to Coordinate Greenhouse Gas Emissions and Vegetable Production. J. Soils Sediments 2020, 20, 1834–1845. [Google Scholar] [CrossRef]
- Jia, Q.; Zhang, H.; Wang, J.; Xiao, X.; Chang, S.; Zhang, C.; Liu, Y.; Hou, F. Planting Practices and Mulching Materials Improve Maize Net Ecosystem C Budget, Global Warming Potential and Production in Semi-Arid Regions. Soil Tillage Res. 2021, 207, 104850. [Google Scholar] [CrossRef]
- Kaur-Sidhu, M.; Ravindra, K.; Mor, S.; John, S. Emission Factors and Global Warming Potential of Various Solid Biomass Fuel-Cook Stove Combinations. Atmos. Pollut. Res. 2020, 11, 252–260. [Google Scholar] [CrossRef]
- Delchev, N.; Trendafilov, K.; Tihanov, G.; Stoyanov, Y. Grain Combines Productivity According to Various Unloading Methods–in the Field and at the Edge of the Field. Agric. Sci. Technol. 2016, 8, 221–226. [Google Scholar] [CrossRef]
- Špokas, L.; Steponavičius, D.; Butkus, V. Reduction of Fuel Consumption of Two Rotors Axial Flow Combine Harvester. J. Food Agric. Environ. 2014, 12, 329–333. [Google Scholar]
- Khoshnevisan, B.; Rafiee, S.; Omid, M.; Mousazadeh, H. Reduction of CO2 Emission by Improving Energy Use Efficiency of Greenhouse Cucumber Production Using DEA Approach. Energy 2013, 55, 676–682. [Google Scholar] [CrossRef]
- Špokas, L.; Steponavičius, D.; Žebrauskas, G.; Čiplienė, A.; Bauša, L. Reduction in Adverse Environmental Impacts Associated with the Operation of Combine Harvesters during the Harvesting of Winter Oilseed Rape. J. Environ. Eng. Landsc. Manag. 2019, 27, 72–81. [Google Scholar] [CrossRef]
- Nik, M.A.E.; Khademolhosseini, N.; Abbaspour-Fard, M.H.; Mahdinia, A.; Alami-Saied, K. Optimum Utilisation of Low-Capacity Combine Harvesters in High-Yielding Wheat Farms Using Multi-Criteria Decision Making. Biosyst. Eng. 2009, 103, 382–388. [Google Scholar] [CrossRef]
- Mokhtor, S.A.; el Pebrian, D.; Johari, N.A.A. Actual Field Speed of Rice Combine Harvester and Its Influence on Grain Loss in Malaysian Paddy Field. J. Saudi Soc. Agric. Sci. 2020, 19, 422–425. [Google Scholar] [CrossRef]
- Tihanov, G. Examination of Impact of the Place for Unloading the Hopper of Grain Harvester Claas Lexion 780 onto Productivity at Harvesting Wheat and Sunflower. Appl. Res. Tech. Technol. Educ. 2020, 8. [Google Scholar] [CrossRef]
- Tihanov, G. A Study on the Hopper Unloading Duration of the Harvesting Machine at Different Technical Parameters. Agric. Sci. Technol. 2020, 12, 140–143. [Google Scholar] [CrossRef]
Figure 1.
Hourly GWP when the CH is stationary with the engine running (idle mode) by changing the engine crankshaft speed (n) and switching on different technological operations. Abbreviations: Eng–engine; Thr–threshing unit; Cho–straw chopper unit; Cut–cutter bar unit; Unl–grain unloading unit. The mean of each value was obtained by evaluating the values obtained from 10 replicates.

Figure 2.
Dependence of CH GWP on transportation speed (vt), n, and technological operations used. Stubble height of 15 cm and soil moisture of 16.2%. T1–all technological operations are switched off. n = 1690 min−1; T2–engaged technological operations: threshing unit, straw chopper unit, and cutter bar unit. n = 1690 min−1; T3–all technological operations are switched off. n = 2200 min−1; T4–engaged technological operations: threshing unit, straw chopper unit, and cutter bar unit. n = 2200 min−1. The mean of each value was obtained by evaluating the values obtained from 10 replicates.

Figure 3.
Hourly GWP when the CH is in the transport mode by changing n and switching on different technological operations. Abbreviations: Eng–engine; Thr–threshing unit; Cho–straw chopper unit; Cut–cutter bar unit. The mean of each value was obtained by evaluating the values obtained from 10 replicates.

Figure 4.
Hourly GWP when the CH is in the harvesting mode by changing Vh. The mean of each value was obtained by evaluating the values obtained from 10 replicates.
Figure 4.
Hourly GWP when the CH is in the harvesting mode by changing Vh. The mean of each value was obtained by evaluating the values obtained from 10 replicates.

Figure 5.
Relation between CH Vh and wheat feed rate (q) in the harvesting mode and the GWP per ton of wheat mass processed. n = 2200 min−1. H1–revolution of threshing-separation rotor (nt = 930 min−1), gap between threshing-separation rotor and crossbar of concave at the beginning of threshing apparatus (a = 10 mm). H2–nt = 930 min−1, a = 8 mm. The mean of each value was obtained by evaluating the values obtained from 10 replicates.

Figure 6.
Process of dual telematics/field test data analysis method for economic and environmental goals.
Figure 6.
Process of dual telematics/field test data analysis method for economic and environmental goals.


Table 1.
Telematics database indicators used in the study.
| Group of Indicators | Indicator | Indicator Name | Unit of Measurement |
|---|---|---|---|
| Time in different engine states | T1 | Idle with grain tank not full | h year−1 |
| T2 | Idle with grain tank full | ||
| T3 | Unloading not harvesting | ||
| T4 | Harvesting and unloading | ||
| T5 | Harvesting | ||
| T6 | Headland turn separator engaged | ||
| T7 | Transport below 16 km h−1 | ||
| T8 | Transport above 16 km h−1 | ||
| Consumed diesel fuel in different engine states | F1 | Idle with grain tank not full | L year−1 |
| F2 | Idle with grain tank full | ||
| F3 | Unloading not harvesting | ||
| F4 | Harvesting and unloading | ||
| F5 | Harvesting | ||
| F6 | Headland turn separator engaged | ||
| F7 | Transport below 16 km h−1 | ||
| F8 | Transport above 16 km h−1 |
Table 2.
Combine harvester characteristics.
| Indicator | Measurement Unit | Value |
|---|---|---|
| Year of manufacture | Year | 2017 |
| Engine emission level | - | Tier III B |
| Threshing-separation rotor length | m | 3.124 |
| Threshing-separation rotor diameter | m | 0.762 |
| Threshing area | m2 | 1.1 |
| Separation area | m2 | 1.54 |
| Grain tank capacity | l | 14,100 |
| Rated engine power ECE R120 | kW/hp | 405/543 |
| Engine operational hours during the 2019 field tests | h | 615 |
Table 3.
GHG emission factors for agricultural transportation using diesel fuel (Tier 2 emission factors for off-road agriculture machinery) [34].
Table 3.
GHG emission factors for agricultural transportation using diesel fuel (Tier 2 emission factors for off-road agriculture machinery) [34].
| GHG Emission Factors | ||
|---|---|---|
| CO2, kg t−1 | N2O, g t−1 | CH4, g t−1 |
| 3160 | 139 | 13 |
Table 4.
CH operating time, fuel consumption, and GWP in various engine modes.
| Machine Utilization, h year−1 | |||||
| Idle | Harvesting | Transport | Idle + Transport | Total | |
| 1 Avg. | 45.1 ± 10.2 | 179.0 ± 23.9 | 33.7 ± 7.4 | 78.9 ± 16.0 | 257.8 ± 35.9 |
| 2 Min. | 19.3 | 112.5 | 17.1 | 36.4 | 152.0 |
| 3 Max. | 95.2 | 248.6 | 70.7 | 165.9 | 403.5 |
| Fuel Consumption, L year−1 | |||||
| Idle | Harvesting | Transport | Idle + Transport | Total | |
| 1 Avg. | 567.7 ± 138.7 | 13,467.4 ± 1963.6 | 1200.8 ± 375.0 | 1768.5 ± 476.7 | 15,235.9 ± 2232.5 |
| 2 Min. | 203.1 | 7312.5 | 424.2 | 627.3 | 8645.6 |
| 3 Max. | 1147.4 | 19,728.9 | 3130.9 | 4278.3 | 22,387.2 |
| Fuel Consumption, L h−1 | |||||
| Idle | Harvesting | Transport | Idle + Transport | Total | |
| 1 Avg. | 12.4 ± 0.8 | 75.0 ± 3.4 | 34.3 ± 3.6 | 21.8 ± 2.1 | 59.1 ± 2.8 |
| 2 Min. | 9.6 | 63.7 | 24.1 | 16.7 | 49.6 |
| 3 Max. | 14.6 | 82.6 | 44.3 | 29.1 | 66.6 |
| GWP, kg year−1 | |||||
| Idle | Harvesting | Transport | Idle + Transport | Total | |
| 1 Avg. | 1512.2 ± 369.3 | 35,875.2 ± 5230.7 | 3198.7 ± 998.9 | 4710.9 ± 1269.9 | 40,586.1 ± 5947.1 |
| 2 Min. | 541.1 | 19,479.4 | 1130.1 | 1671.1 | 23,030.6 |
| 3 Max. | 3056.6 | 52,554.9 | 8340.1 | 11,396.7 | 59,636.2 |
| GWP, kg h−1 | |||||
| Idle | Harvesting | Transport | Idle + Transport | Total | |
| 1 Avg. | 33.0 ± 2.1 | 199.9 ± 9.0 | 91.3 ± 9.5 | 58.1 ± 5.5 | 157.3 ± 7.5 |
| 2 Min. | 25.6 | 169.7 | 64.2 | 44.6 | 132.0 |
| 3 Max. | 39.0 | 220.0 | 118.0 | 77.6 | 177.3 |
1 Arithmetic mean with confidence interval for 2017–2020. 2 The minimum value was found in the database after evaluating all values from 2017–2020. 3 The maximum value was found in the database after evaluating all values from 2017–2020.
Table 5.
Operating time of CH at idle and grain unloading.
| Idle with Grain Tank Not Full, h year−1 | Idle with Grain Tank Full, h year−1 | Unloading Not Harvesting, h year−1 | Harvesting and Unloading, h year−1 | |
|---|---|---|---|---|
| 1 Avg. | 43.4 ± 10.2 | 1.7 ± 0.9 | 7.4 ± 2.5 | 6.6 ± 1.9 |
| 2 Min. | 18.3 | 0.0 | 0.6 | 2.2 |
| 3 Max. | 95.2 | 5.0 | 17.5 | 10.4 |
1 Arithmetic mean with confidence interval for 2017–2020. 2 The minimum value was found in the database after evaluating all values from 2017–2020. 3 The maximum value was found in the database after evaluating all values from 2017–2020.
Publisher’s Note: MDPI stays neutral with regard to jurisdictional claims in published maps and institutional affiliations. |
© 2021 by the authors. Licensee MDPI, Basel, Switzerland. This article is an open access article distributed under the terms and conditions of the Creative Commons Attribution (CC BY) license (https://creativecommons.org/licenses/by/4.0/).
Share and Cite
MDPI and ACS Style
Savickas, D.; Steponavičius, D.; Domeika, R. Analysis of Telematics Data of Combine Harvesters and Evaluation of Potential to Reduce Environmental Pollution. Atmosphere 2021, 12, 674. https://0-doi-org.brum.beds.ac.uk/10.3390/atmos12060674
AMA Style
Savickas D, Steponavičius D, Domeika R. Analysis of Telematics Data of Combine Harvesters and Evaluation of Potential to Reduce Environmental Pollution. Atmosphere. 2021; 12(6):674. https://0-doi-org.brum.beds.ac.uk/10.3390/atmos12060674
Chicago/Turabian StyleSavickas, Dainius, Dainius Steponavičius, and Rolandas Domeika. 2021. "Analysis of Telematics Data of Combine Harvesters and Evaluation of Potential to Reduce Environmental Pollution" Atmosphere 12, no. 6: 674. https://0-doi-org.brum.beds.ac.uk/10.3390/atmos12060674
Note that from the first issue of 2016, this journal uses article numbers instead of page numbers. See further details here.