Article

Numerical Analysis of Smoke Spreading in a Medium-High Building under Different Ventilation Conditions

by
Zdzislaw Salamonowicz
1,
Malgorzata Majder-Lopatka
1,
Anna Dmochowska
1,
Aleksandra Piechota-Polanczyk
2 and
Andrzej Polanczyk
1,*
1
The Main School of Fire Service, Slowackiego 52/54 Street, 01-629 Warszawa, Poland
2
Department of Medical Biotechnology, Jagiellonian University, Gronostajowa 7 Street, 30-387 Krakow, Poland
*
Author to whom correspondence should be addressed.
Submission received: 17 March 2021 / Revised: 24 May 2021 / Accepted: 27 May 2021 / Published: 30 May 2021
(This article belongs to the Special Issue Air Quality in Poland)

Abstract

:
Smoke from fires in residential buildings represents the greatest threat to the life and health of inhabitants and firefighters at the scene of an accident. Therefore, the aim of this study was to reconstruct a numerical model for the estimation of smoke spread in a medium-high building under different ventilation conditions. Here, the three-dimensional geometry of a designated medium-high building was reconstructed and an exit door in the basement was specified as a smoke inlet; a window in the upper part was marked as outlet; and an entrance door, which allowed the outside air to enter the building after opening, was designated as an inlet door. The initial simulation, in which no air could enter the building, predicted the time taken for the staircase to become filled with smoke. In a second simulation, the entrance door was a fresh air inlet. The results showed that, for the analyzed building, rapid use of the mechanical ventilation can shorten the time of operations and improve their safety.

1. Introduction

The progress of building technology as well as architectural achievements allows high-rise buildings to be constructed [1]. However, the higher a building, the higher a risk of uncontrolled smoke distribution; furthermore, evacuation of occupants is more complicated and higher risk in taller buildings [2]. In the building fires, smoke is often the leading cause of fatalities [3]. Studying the evacuation of ultra-tall buildings is important to reduce deaths, injuries and property loss when emergency situations occur [4]. Therefore, researchers have examined the performance of different ventilation systems for high-rise buildings [5,6] and studied smoke temperature distribution within buildings [7]. Indeed, the relationship between fire size and the resultant distribution of smoke temperatures along ceilings and staircases is an important aspect that must be considered when designing high-rise buildings [8]. The subject of fire spread within buildings is a crucial topic, especially for complex building profiles [9]. Smoke can spread vertically to top floors through the stairwells or elevators [10]. Studies show that smoke from fire in residential buildings represents the greatest threat to the inhabitants’ life and health, as well as the firefighters at the scene of the accident [11,12]. Moreover, fire-associated heat release rates may influence decisions on the application of fire safety and protection systems included in building design and construction [13]. Combustion products from the fire may cause poisoning, which in extreme cases leads to death [11,14]. Statistics indicate that more than 40% of fatalities that occur on a fire site are the result of poisoning with carbon monoxide or hydrogen cyanide [15]. In addition to poisoning, smoke can significantly reduce visibility, which obscures exits and interferes with evacuation. [16]. Understanding smoke spread is necessary to determine evacuation times and assess potential life and health risks to building occupants during fires. Smoke is also a threat to firefighters carrying out rescue operations. Special clothing only partially protects against the effects of thermal impact, whilst the use of respiratory protection equipment protects against the harmful effects of combustion products. Moreover, when firefighters wearing special clothing are exposed to high temperatures, reaching several hundred degrees Celsius, they may experience heat stroke. For these reasons, it is extremely important to know the ways and directions of the movement of hot and harmful fire gases in closed spaces. Therefore, detection, human behavior, fire service intervention and operational issues of smoke and heat control systems are major aspects during building design [17].
There are different numerical models of fires, which are designed to illustrate and approximate the phenomena occurring in a fire [18]. These models are based on small-scale experiments. These types of tests aim to determine the processes taking place in the fire environment [19]. Calculations may be performed analytically, using physical equations or by implementation of those equations into dedicated software to receive many important parameters [20]. The computer programs currently applied are based on two types of models: zone (single or multi-zone) or more complex, i.e., field models requiring high computing power [21,22]. For zone models, room volume is divided into smaller areas with uniform conditions, where convection zones, flame zones or cold ceilings may be distinguished. The most common fire model for the field model uses the computational fluid dynamic method (CFD) [23]. In our study, we used the numerical model for the estimation of smoke spread in a medium-high building under variable ventilation conditions.
The paper is organized as follows: Section 2 describes the case study, was well as the materials and methods applied in the study; Section 3 presents the results of computer simulations; Section 4 discusses the results; and Section 5 provides the conclusions.

2. Materials and Methods
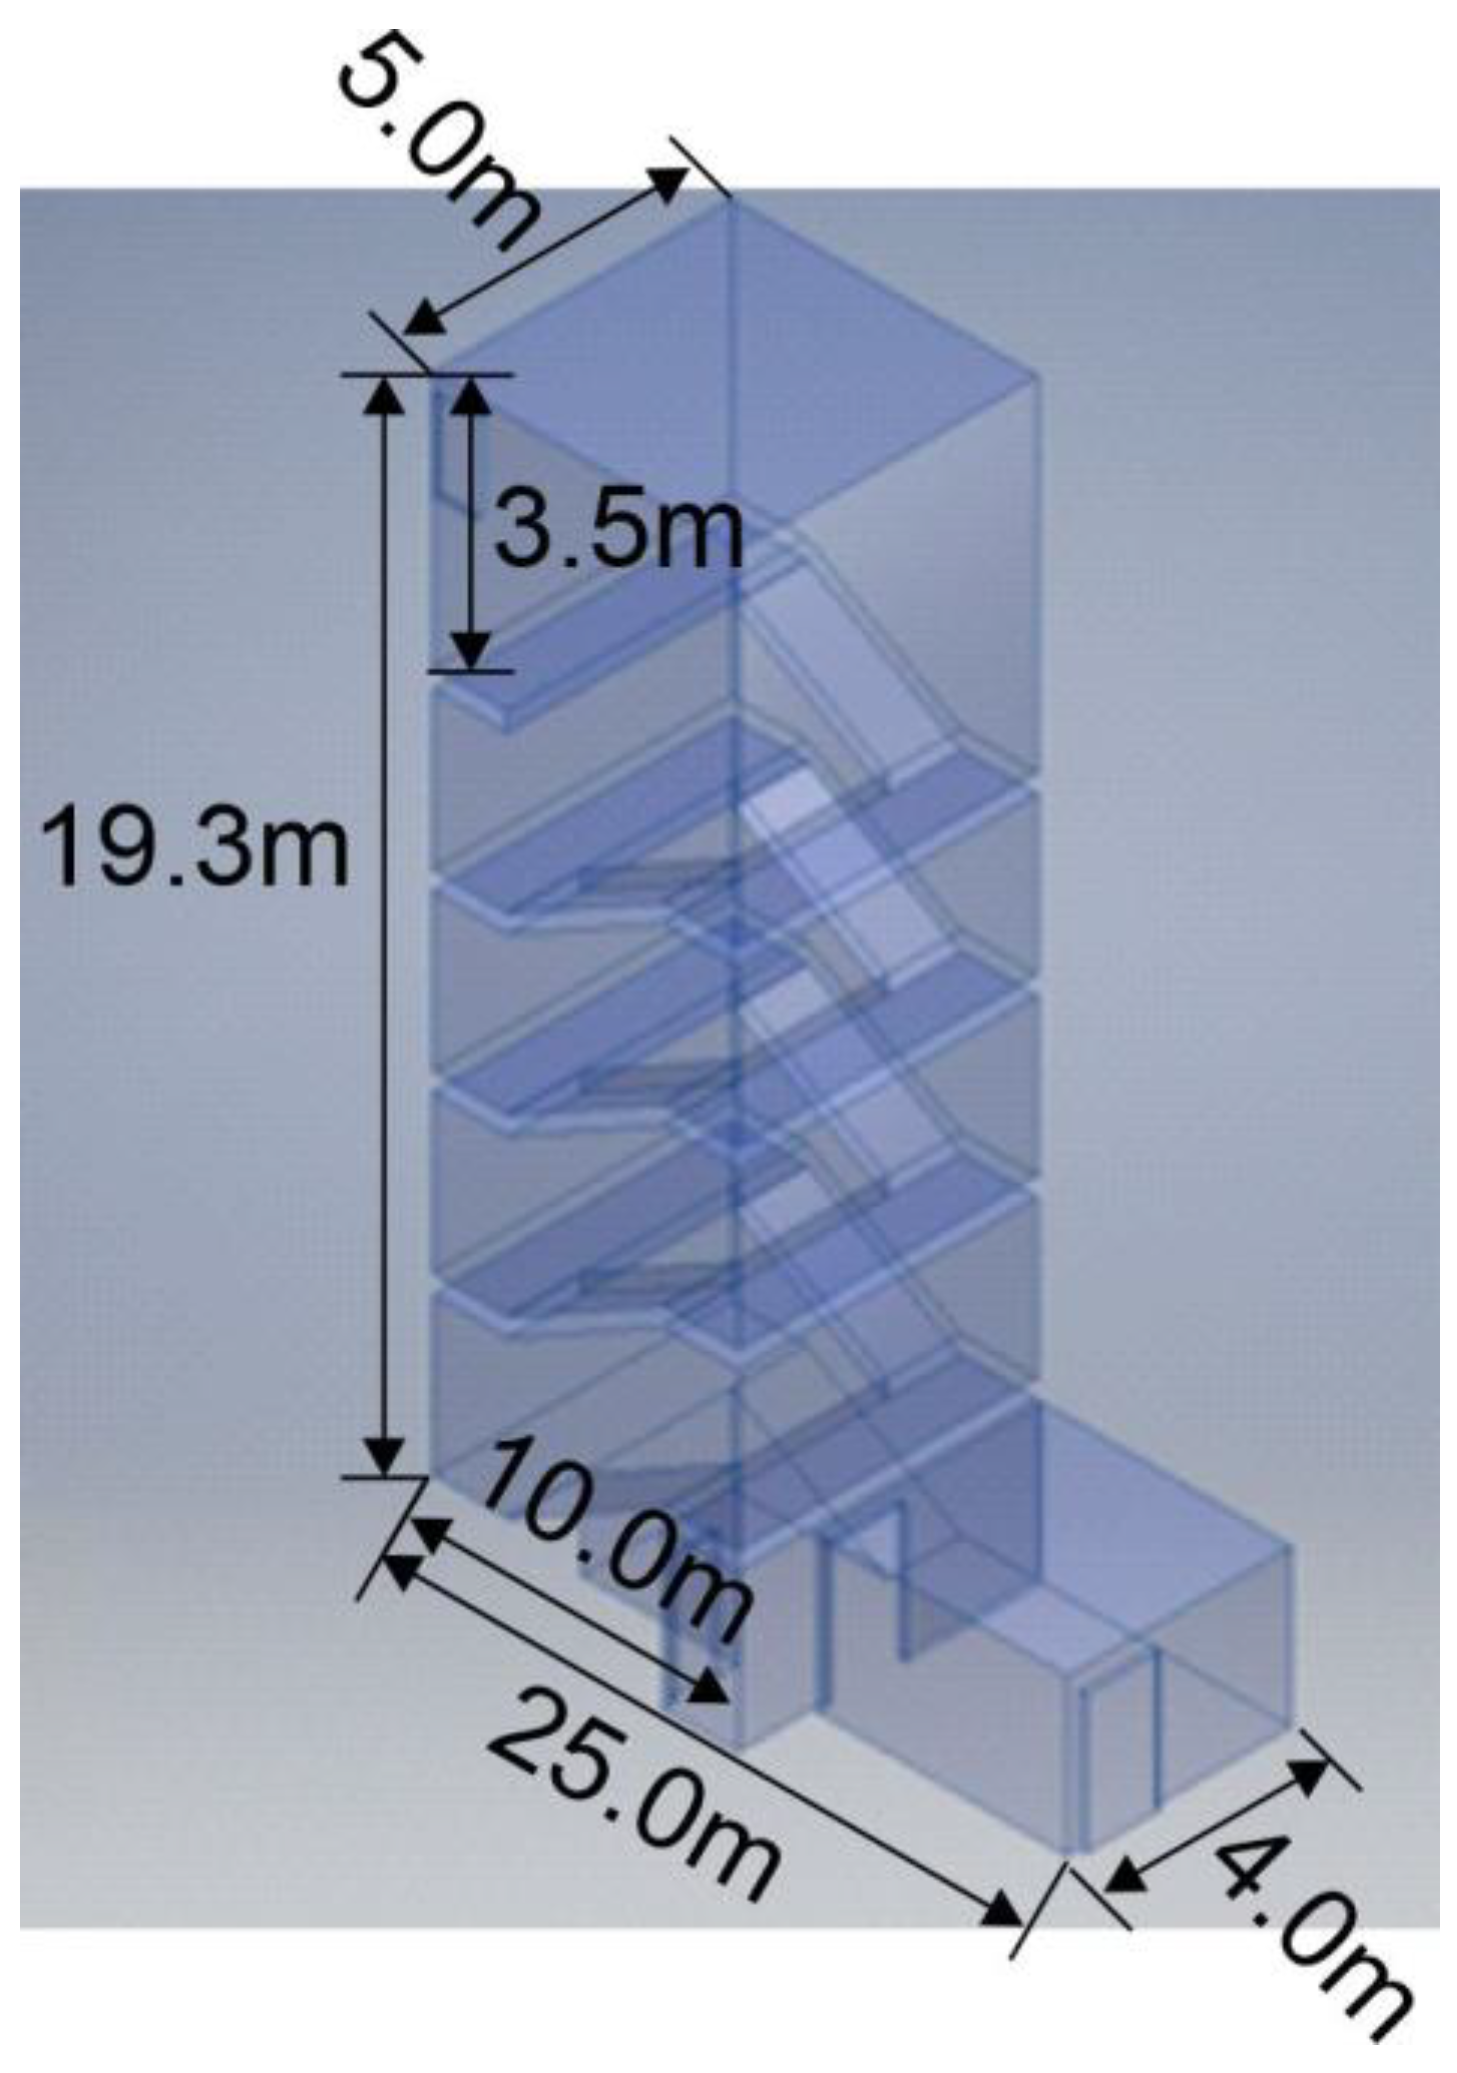
2.1. Case Study

In our study, we wanted to determine the direction of smoke flow in a designated medium-high building. The dimensions of the computational domain were chosen based on an actual collective residential building with the following features: 24 apartments were spread over 5 above-ground floors; utility rooms used by the residents were located on the underground floor; the staircase was a large space with two-speed stairs equipped with landings; and there was an open space between the flights of stairs, which extended from the ground floor level to the roof. This open space between the flights of stairs acted as a chimney and caused vertical air movements related to the difference in temperature inside and outside the building. In winter, the air flowing into the building through the entrance door heated up, rose, and left through openings in the upper part of the building. In summer, this situation changed as the temperature of air outside was higher than the temperature inside the building. Therefore, the air entered the building through the openings in the upper part, cooled down, moved down, and then exited through the open entrance door. During a fire, gases of significant temperature would have risen upward looking for an outlet to the outside in the ceiling area near the roof of the building. The underground level was separated from the staircase by a door made of medium density fiberboard, which was a barrier for smoke in the initial stage of a fire. Each apartment had a separate door with different tightness properties. There was only one entrance to the building, facing south. Behind the first door, there was a vestibule leading to the staircase. From the vestibule, it was possible to get to the storage room for bicycles and prams. On the top floor, there was one openable window (0.7 m × 1.4 m) that opened onto the roof. Apart from the entrance and the window in the upper part of the building, during normal use, there were no additional openings that could constitute an inlet/outlet for outside air. In the basement, some rooms had small windows about 2 m above the basement floor.
For the purpose of calculations, the following assumptions were made: (1) replacement of steps on the stairs with a sloping flat surface resembling a disability access ramp; (2) omission of barriers made of welded flat bars; (3) omission of doors and windows, leaving openings in their places for air and smoke inlet and outlet (Figure 1).

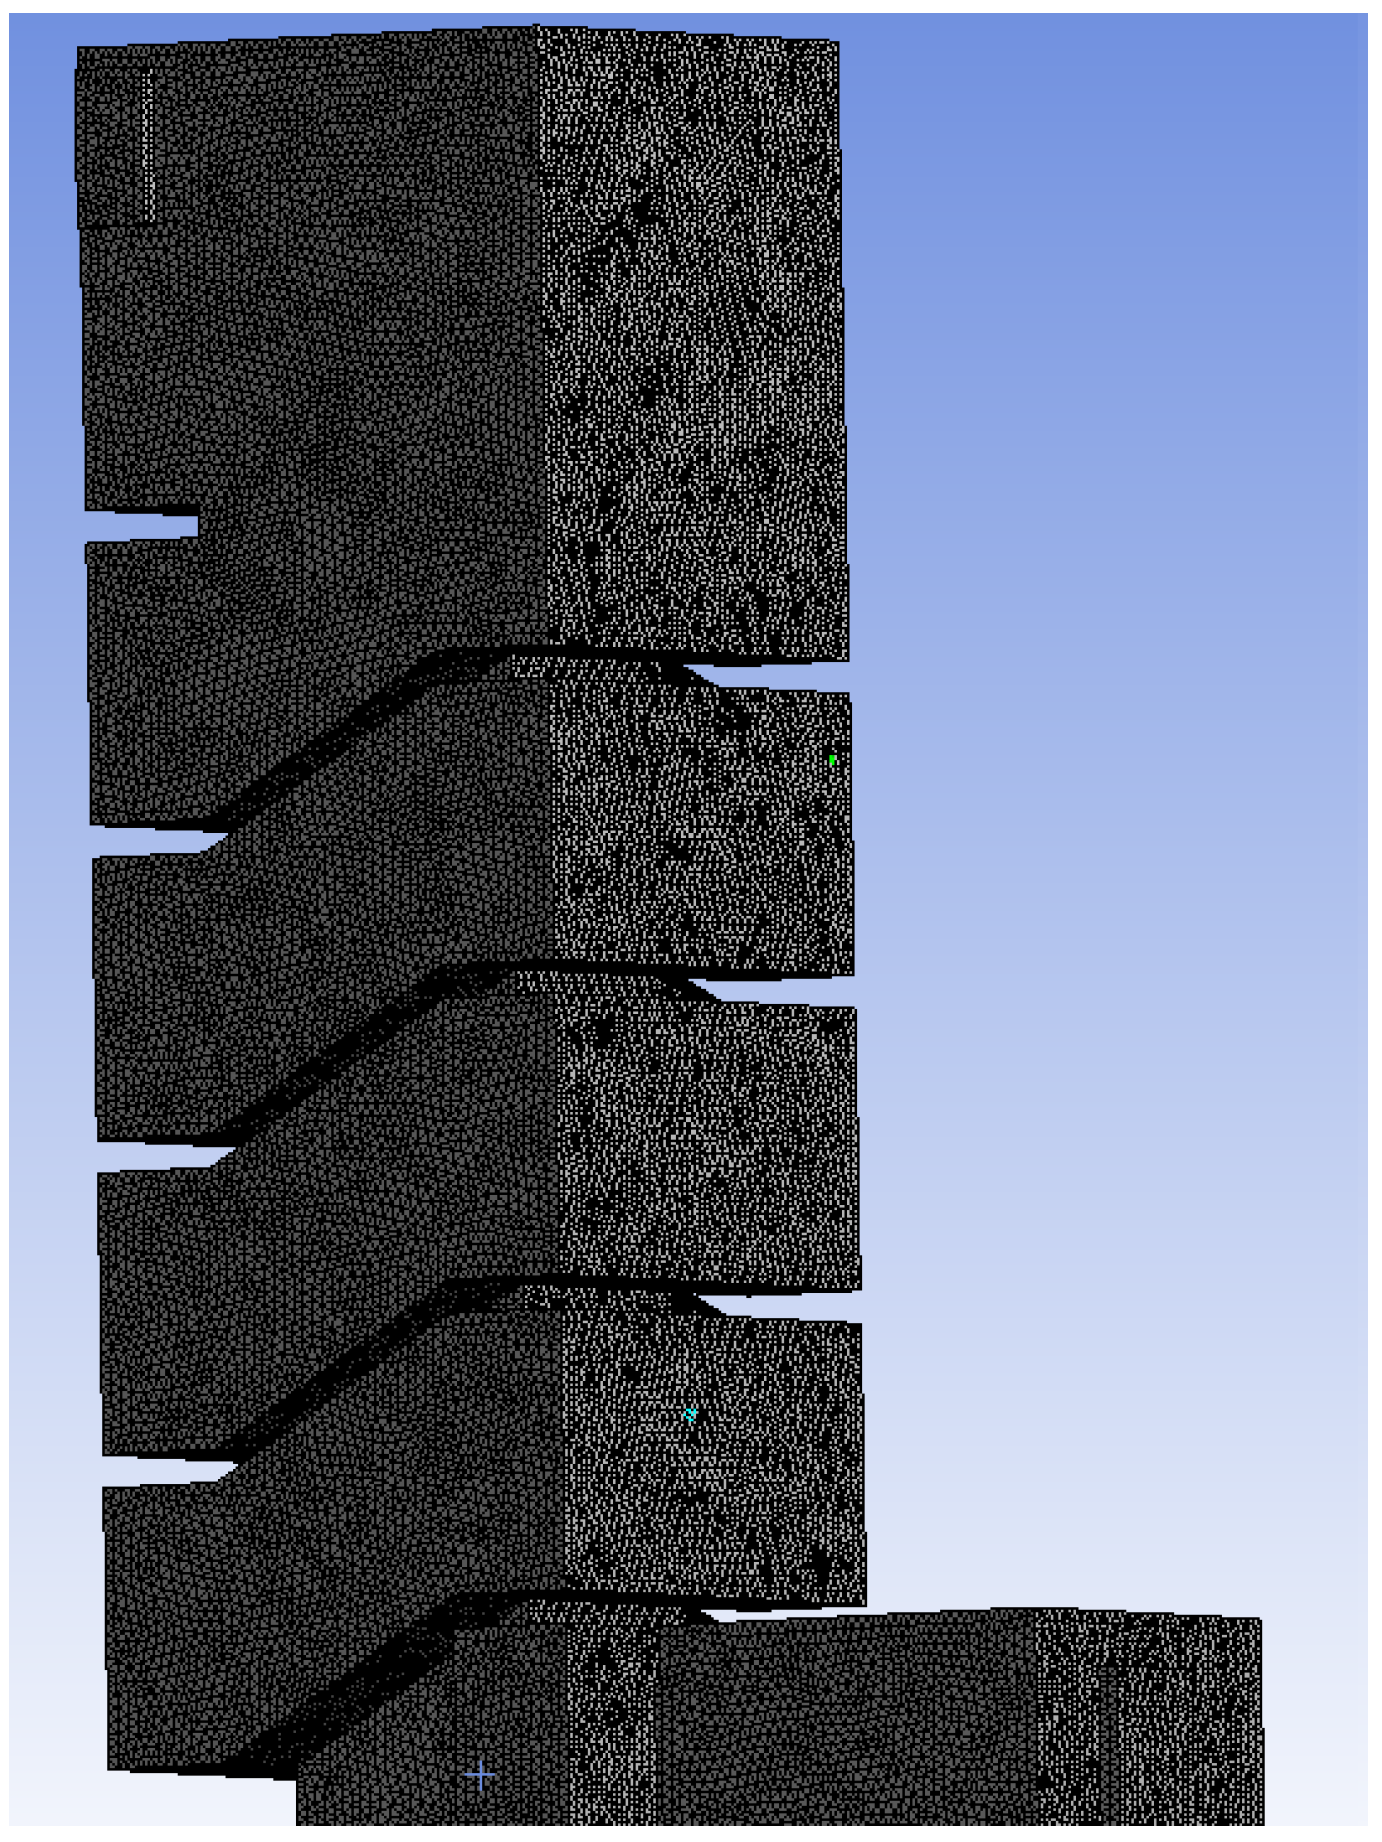
2.2. Numerical Description

In this section, the computational settings and parameters for the case study are outlined. Numerical analysis was performed with the use of Reynolds Averaged Navier-Stokes equations (Equations (1)–(3)) implemented in Ansys FLUENT software (ANSYS, Canonsburg, PA, USA) [24].
( v x t + v x v x x + v y v x y + v z v x z ) = ρ g x p x + x ( ( μ + μ t ) ( 2 v x x ) ) + y ( ( μ + μ t ) ( v z y + v y x ) ) + z ( ( μ + μ t ) ( v x z + v z x ) )
ρ ( v y t + v x v y x + v y v y y + v z v y z ) = ρ g y p y + x ( ( μ + μ t ) ( v y x + v x y ) ) + y ( ( μ + μ t ) ( 2 v y y ) ) + z ( ( μ + μ t ) ( v y z + v z y ) )
ρ ( v z t + v x v z x + v y v z y + v z v z z ) = ρ g z p z + x ( ( μ + μ t ) ( v z x + v x z ) ) + y ( ( μ + μ t ) ( v z y + v y z ) ) + z ( ( μ + μ t ) ( v z z ) )
where:
  • vx,vy,vz—velocity components for x, y, z directions, (m/s);
  • t—time (s);
  • g—acceleration in x, y, z direction, (m2/s);
  • µ—fluid viscosity, (Pa s);
  • ρ—fluid density, (kg/m3);
  • µt—turbulent viscosity, (Pa s).
In this work, the k–ε model was used to represent the effects of turbulence [25].
The mass conservation was described with the use of Equation (4).
ρ t + · ( ρ u ) = S m
Moreover, the heat flow in the system was modelled using the energy conservation and enthalpy equations (Equations (4) and (5)).
h = T 0 T C p d T
where:
  • ρ—fluid density, (kg/m3);
  • h—enthalpy, (J/mol);
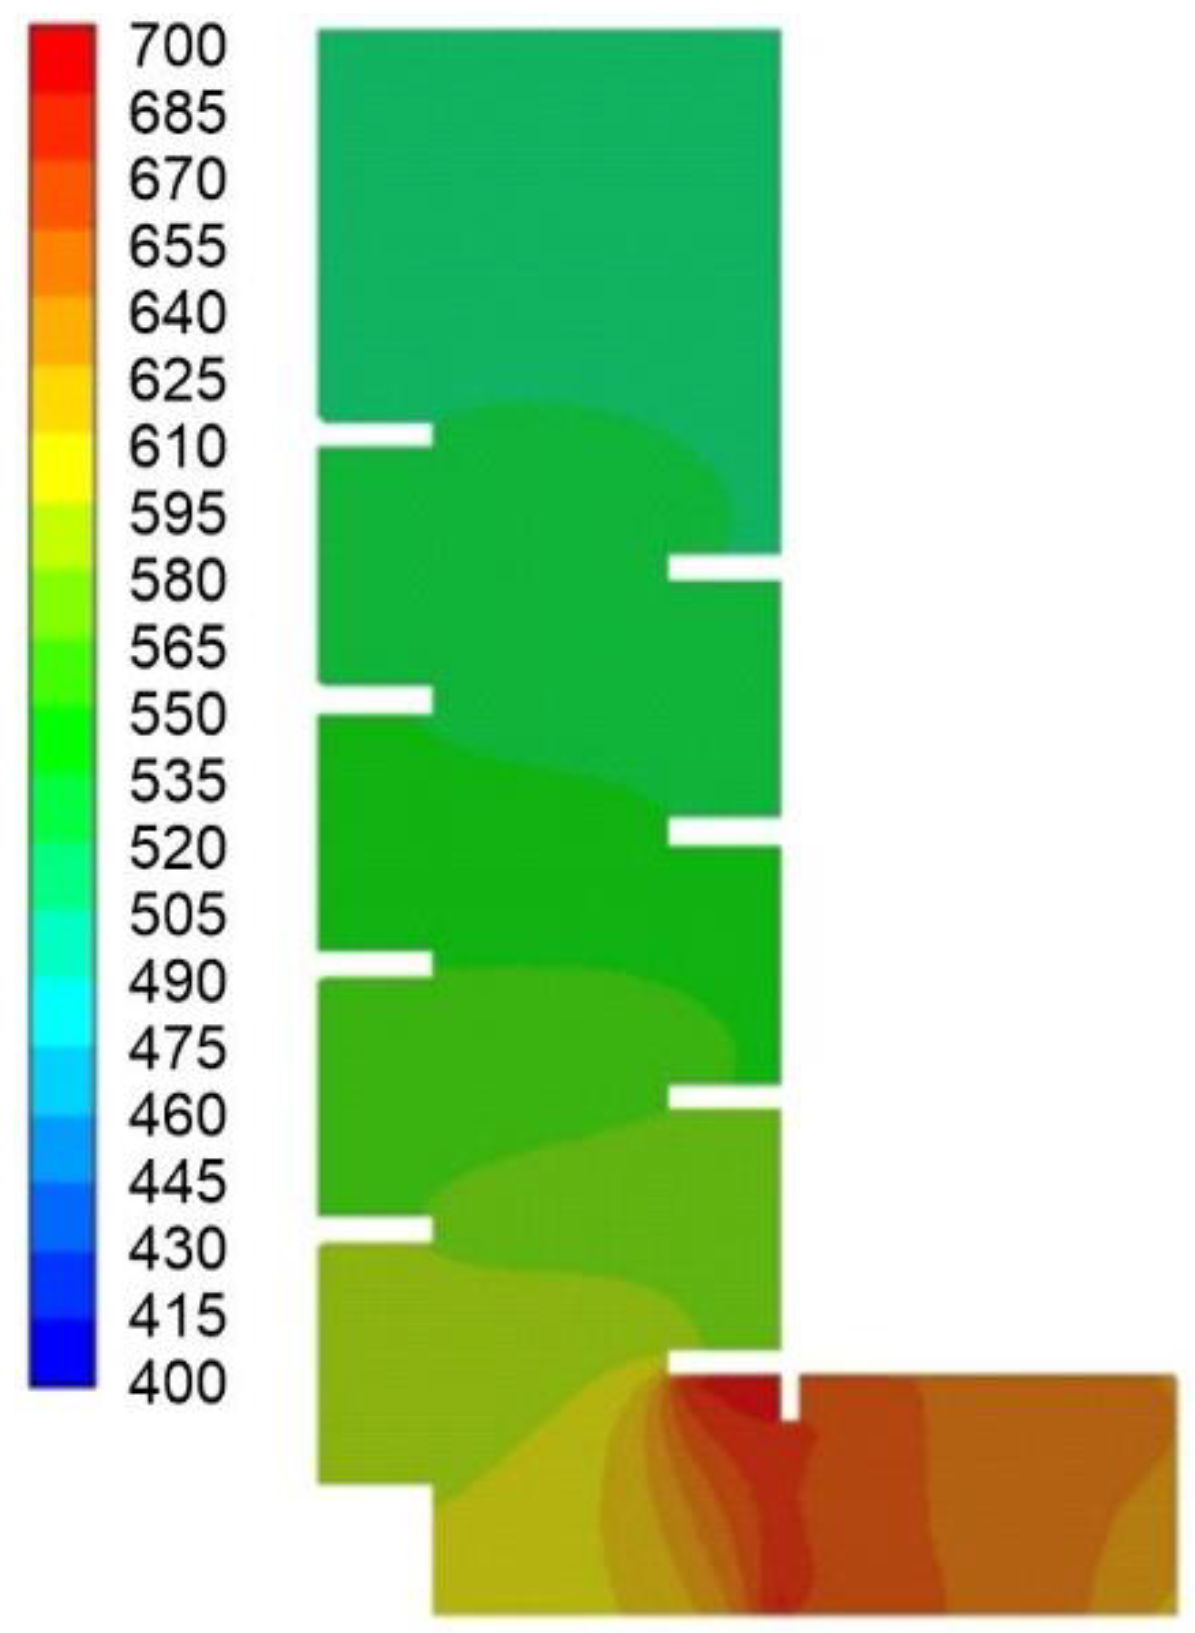
  • T—temperature, (K);
  • Cp—specific heat capacity, (J/mol K).
In the first step, with the use of Ansys SpaceClaim software (ANSYS, Canonsburg, PA USA), the three-dimensional domain was prepared (Figure 1). Next, using Ansys ICEM software (ANSYS, Canonsburg, PA, USA), a numerical grid was generated [26]. Initially, mesh independent testing was performed for different sized grid elements. The tested range of elements for the whole analyzed domain was equal to 25 cm–10 cm (with a slope equal to 5 cm), decreasing the size of elements to 5 cm around intensive flow. It was observed that for an element size of 20 cm and 25 cm, the model failed to converge on a solution. However, for the meshes composed of 10 cm and 15 cm elements, the CFD model simulations converged on a solution. Thus, to minimize the size of the numerical grid as well as minimize the time taken for calculations, the final mesh consisted of 1,083,464 tetrahedral elements with nodes located only at the element vertices (Figure 2). The size of the element was equal to 15 cm, while in the area where the greatest gradients of pressure, velocity and concentrations were expected, the mesh was densified so that the element size was equal to 5 cm.
The Ansys-FLUENT software (ANSYS, Canonsburg, PA, USA) was applied as a solver [27]. The SIMPLE algorithm was used for pressure velocity coupling. Moreover, pressure interpolation was second order and second-order discretization schemes were used for both the convection terms and the viscous terms of the governing equations. The following assumptions were made: (1) the fluid was a perfect gas; (2) the fluid was Newtonian; (3) heat was conducted according to Fourier’s law; and (4) gases diffused according to Fick’s laws. For the turbulence model, k-ε was selected with the Realizable submodel that allowed solving flow problems in which there are no large pressure gradients, and the direction of fluid flow does not constitute a very complicated path. Under such boundary conditions, the model achieved a high accuracy of calculations performed, i.e., the following convergence criteria were achieved: 10−3 for continuity, mass transport, the kinetic energy of turbulence and the dissipation of the kinetic energy of turbulence, and 10−6 for the conservation of energy. Moreover, a fixed discrete time step of 0.1 s was set.
For the reconstruction of the real walls’ conditions, concrete was applied as the construction material. For this purpose, it was created and given the following parameters: density 2400 (kg/m3), specific heat 1000 (J/kg∗K), and thermal conductivity 2 (W/m∗K). The wall thickness used in the simulation was equal to 30 cm.
The door that exited the basement was specified as “inlet smoke” and flow rate was equal to 50 m3/h. At this point, smoke entered the space of the staircase. The window in the upper part was marked as “outlet” and atmospheric pressure was assigned, and the entrance door which allowed the outside air to enter the building after opening was designated as “inlet door” and flow rate was equal to 90 m3/h.
In this paper, smoke distribution was presented as a carbon dioxide discharge at “inlet smoke” boundary conditions. The first phase of the fire was simulated assuming an initial carbon dioxide concentration of 15% and an initial gas temperature of 700 K.
Depending on the adopted assumptions, the following boundary conditions occurred in subsequent simulations:
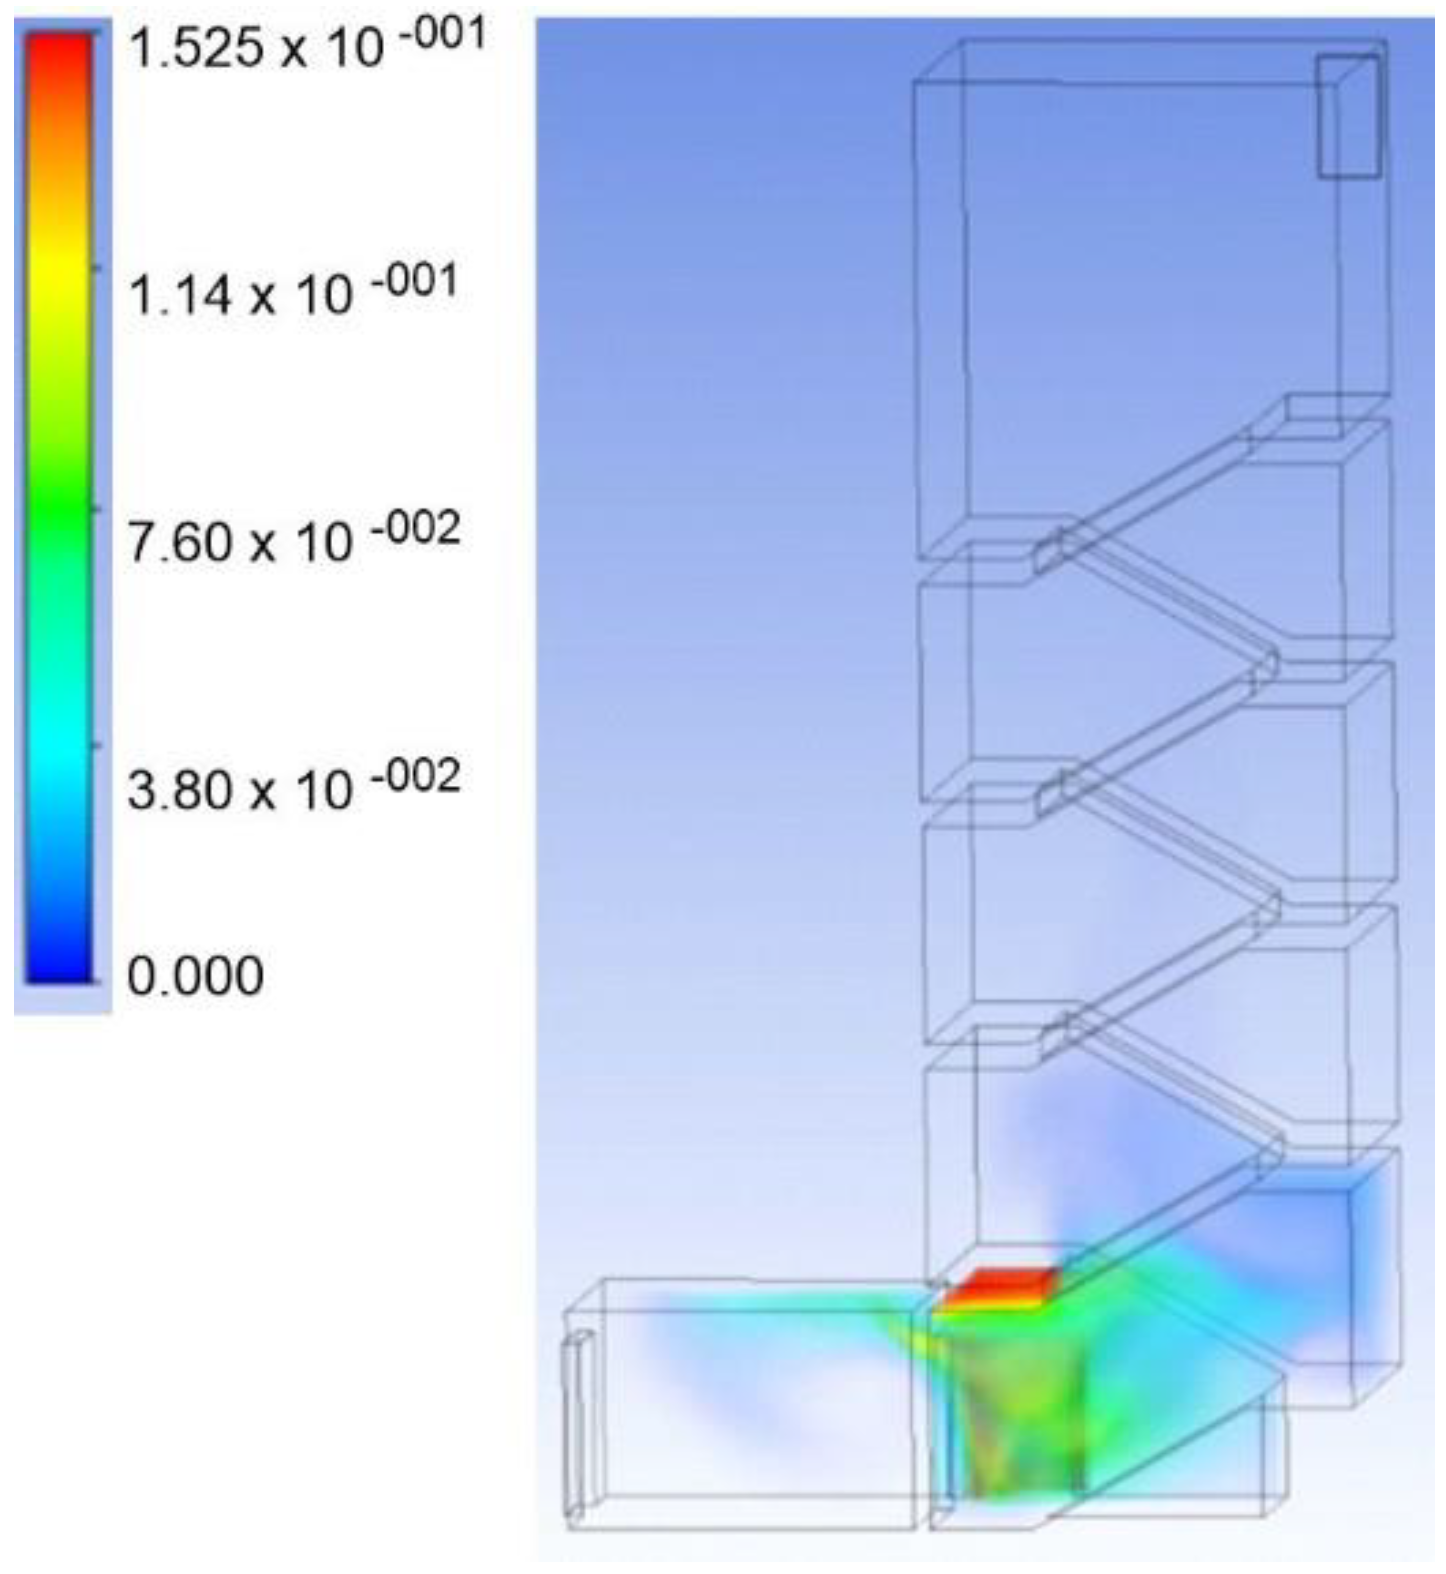
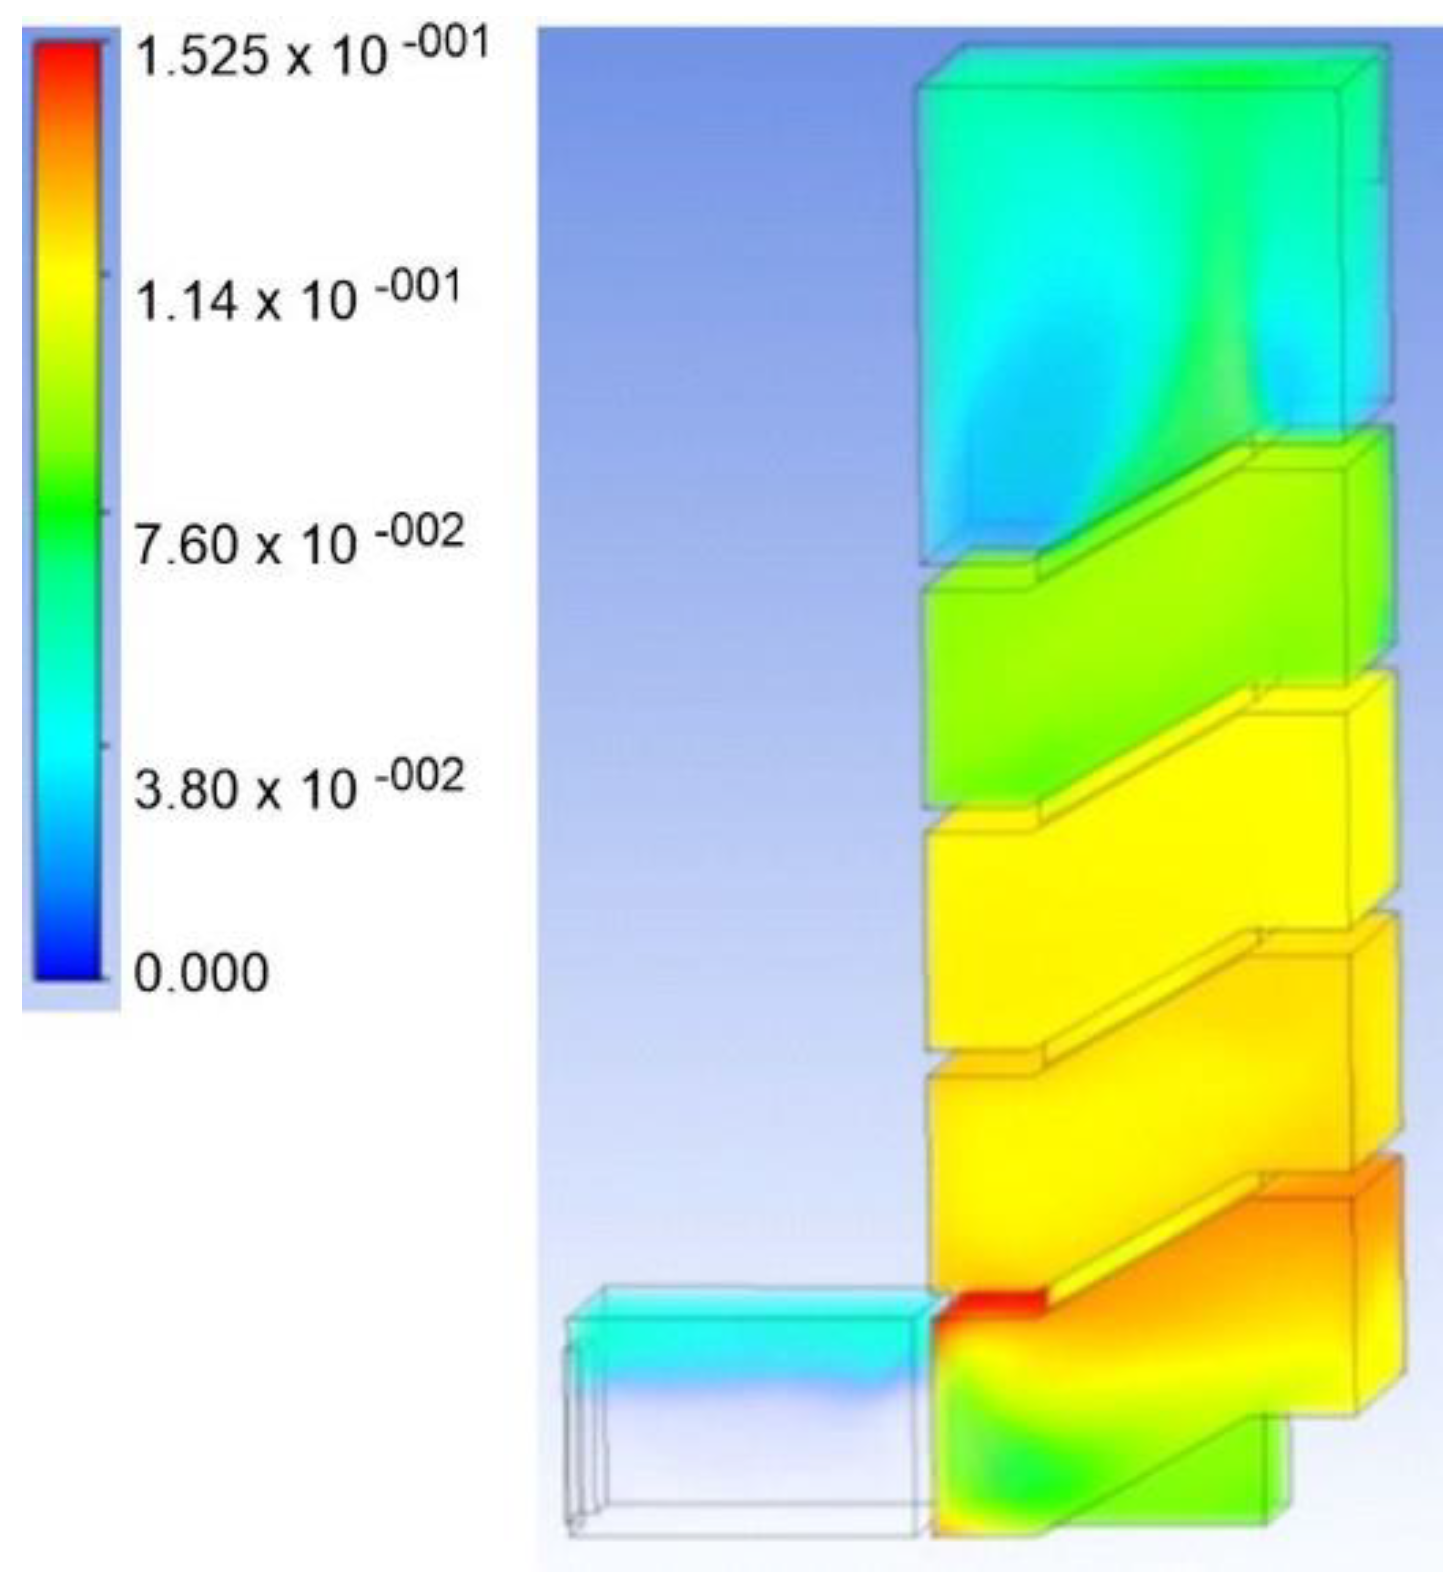
  • For the case illustrating smoke distribution in a closed building the simulation predicted the time taken for the carbon dioxide concentration at the celling of the stairwell to reach 15%. Here, we set “pressure outlet” as the entrance door to the building. Additionally, the time when the smoke neutral zone reached the door level was assumed as the total smoke time.
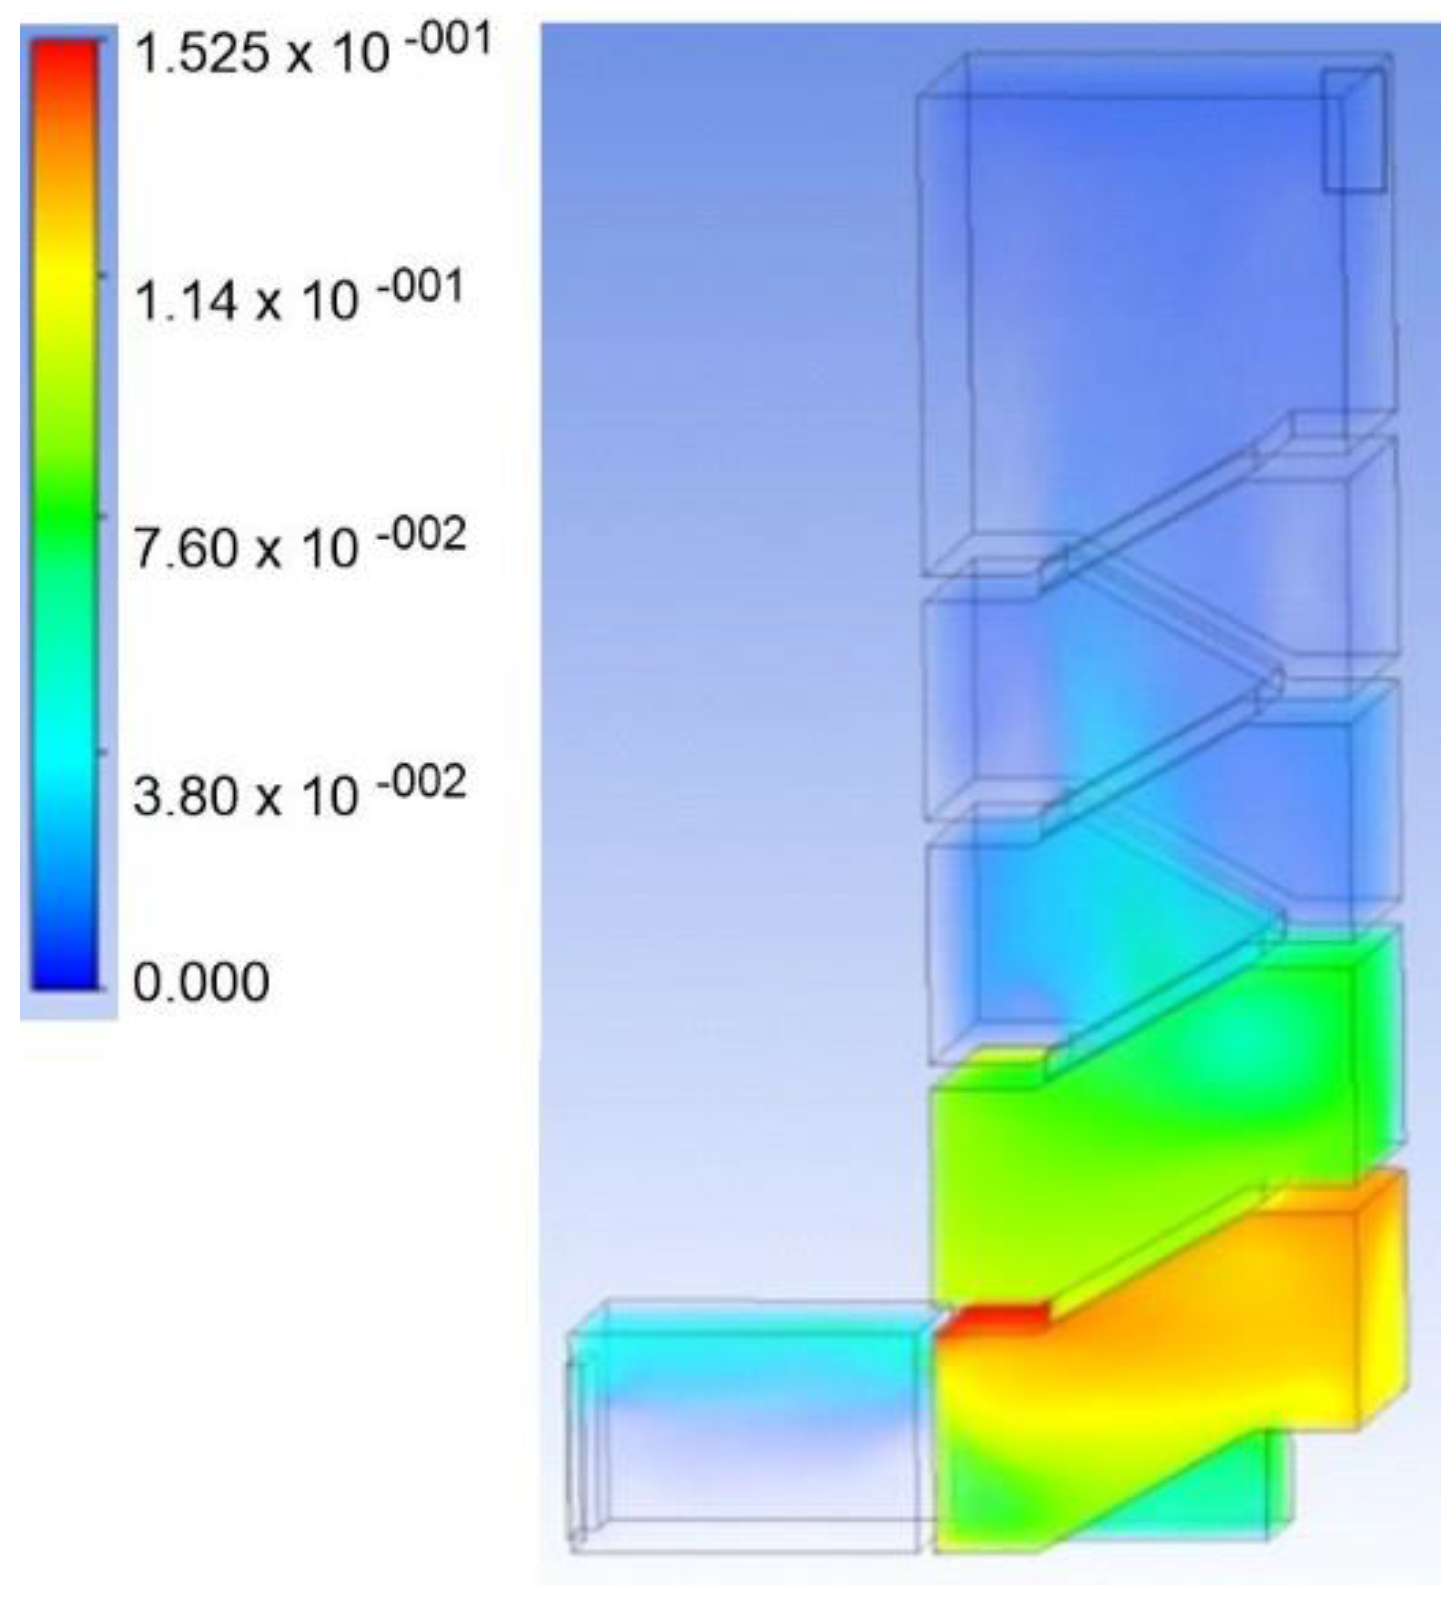
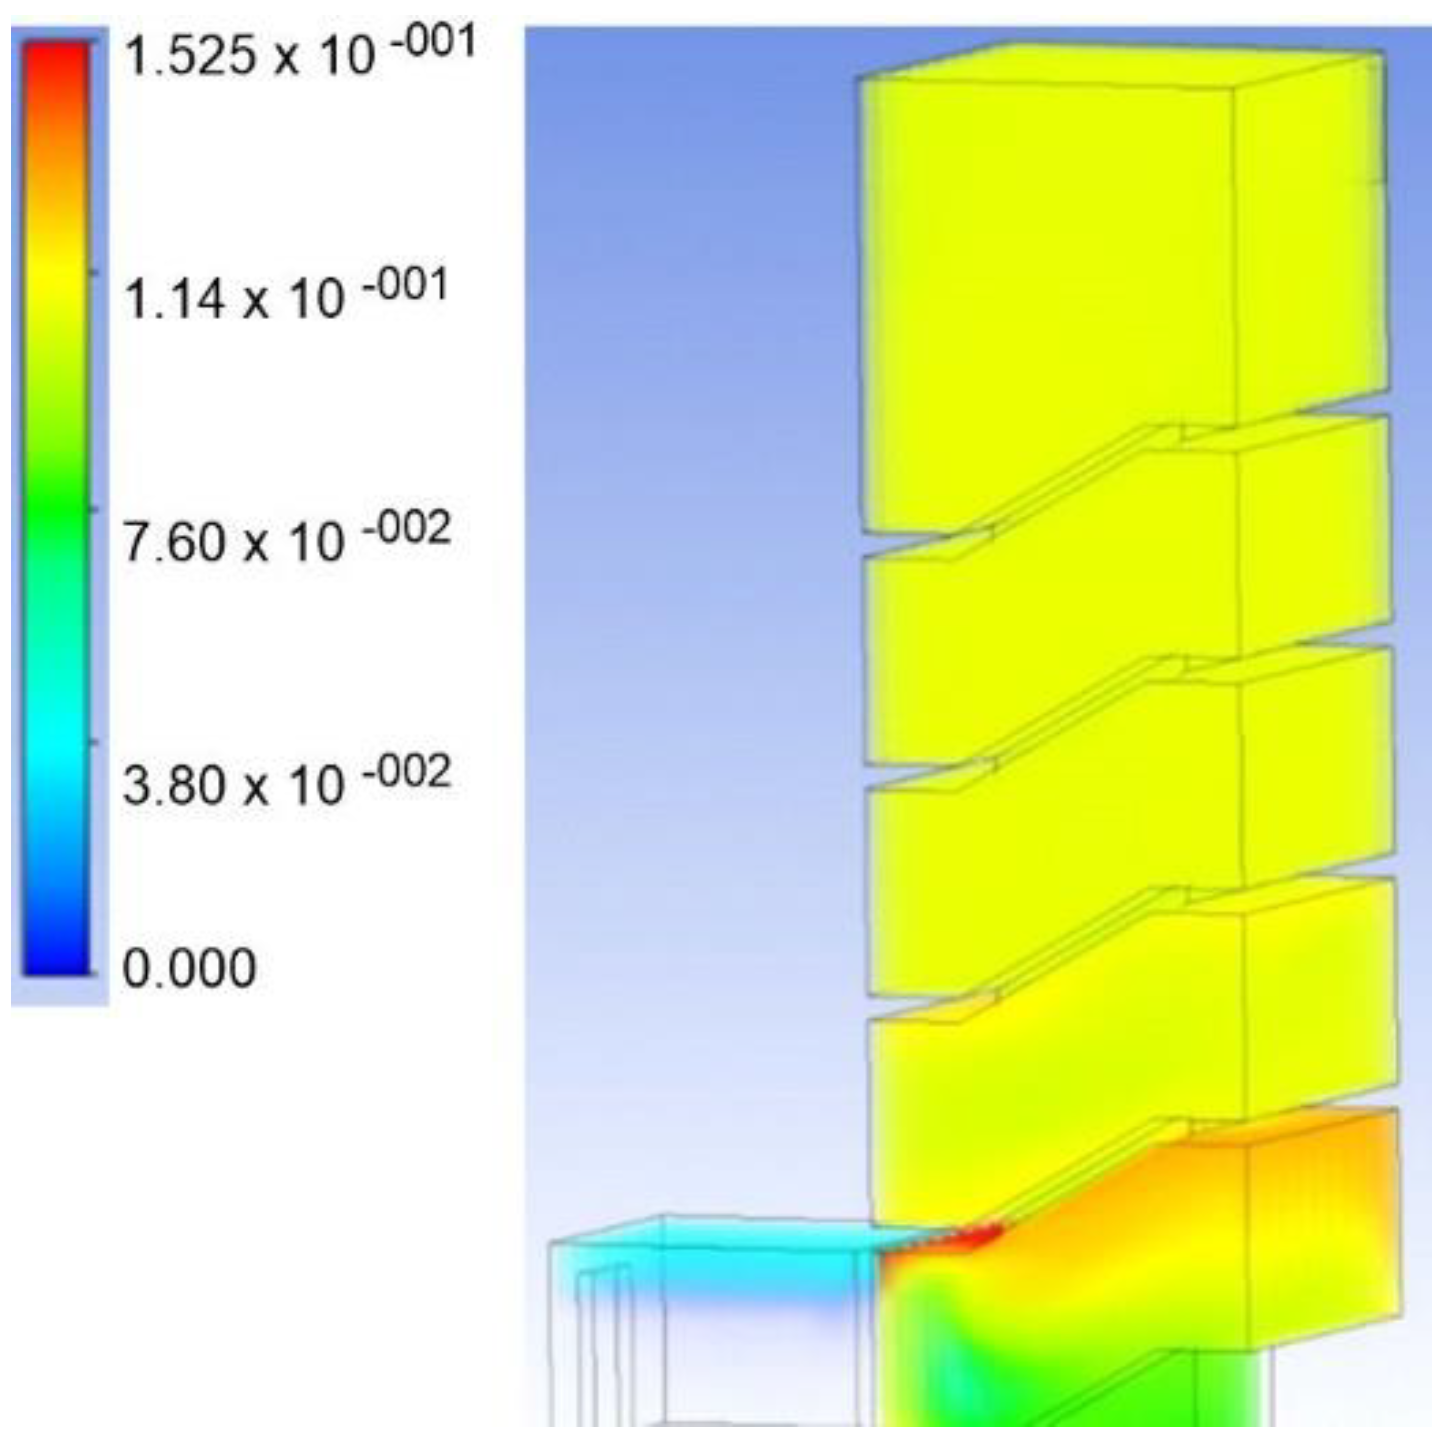
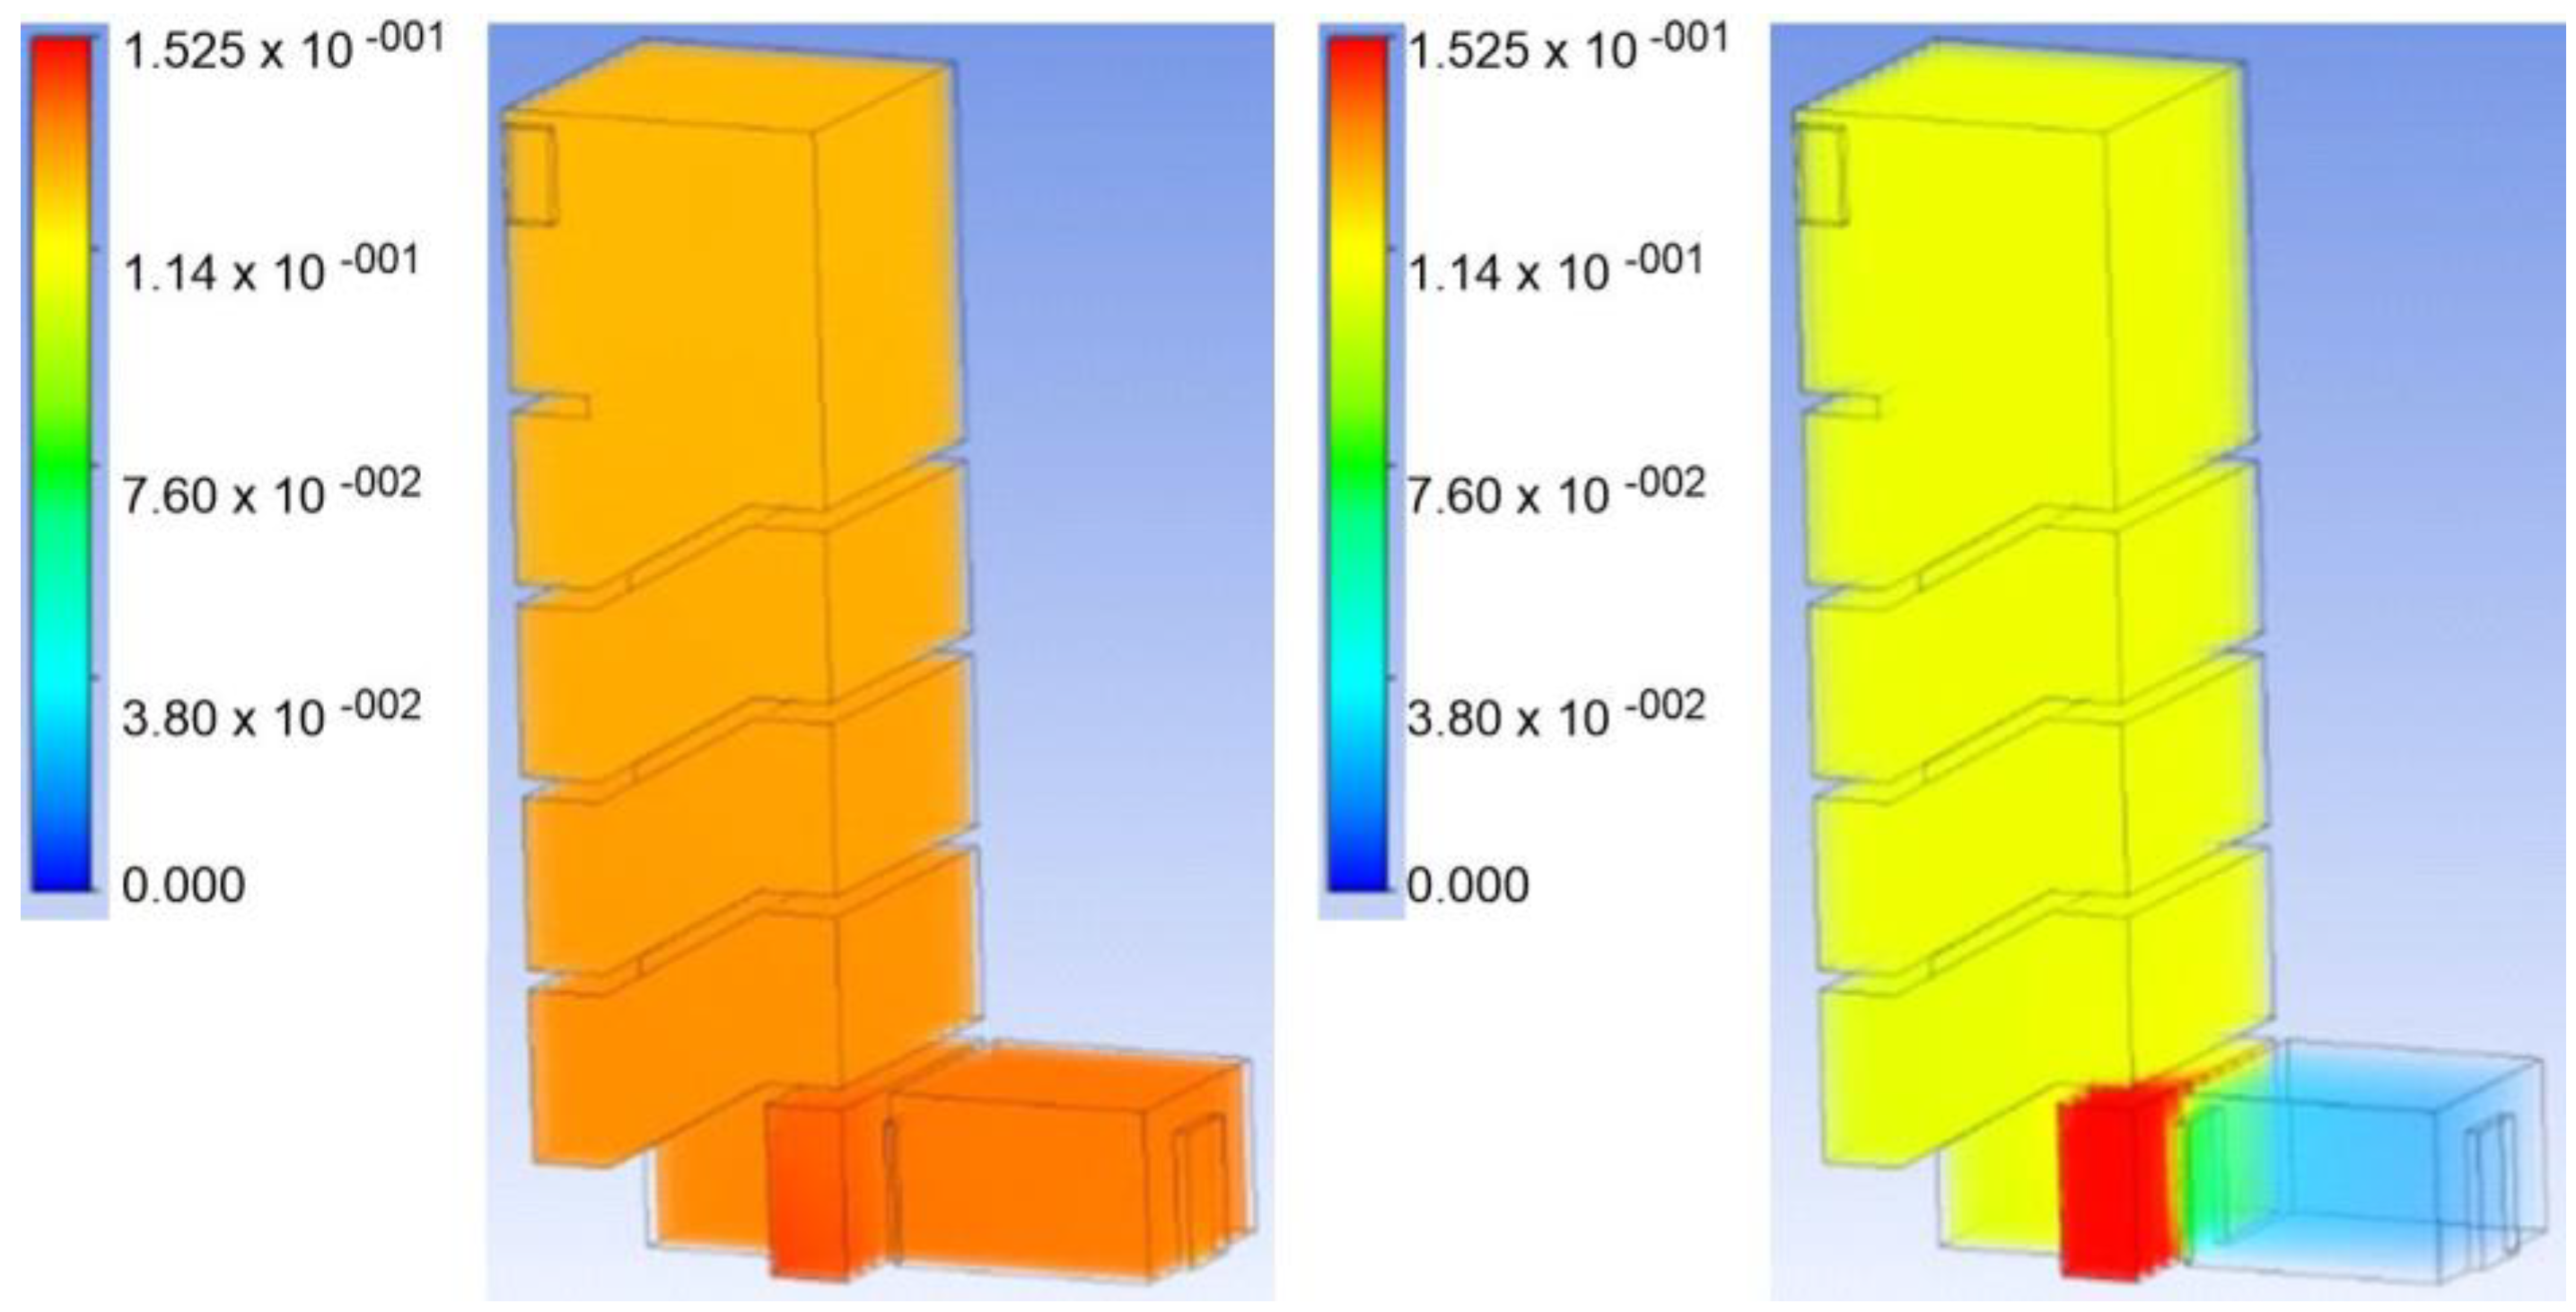
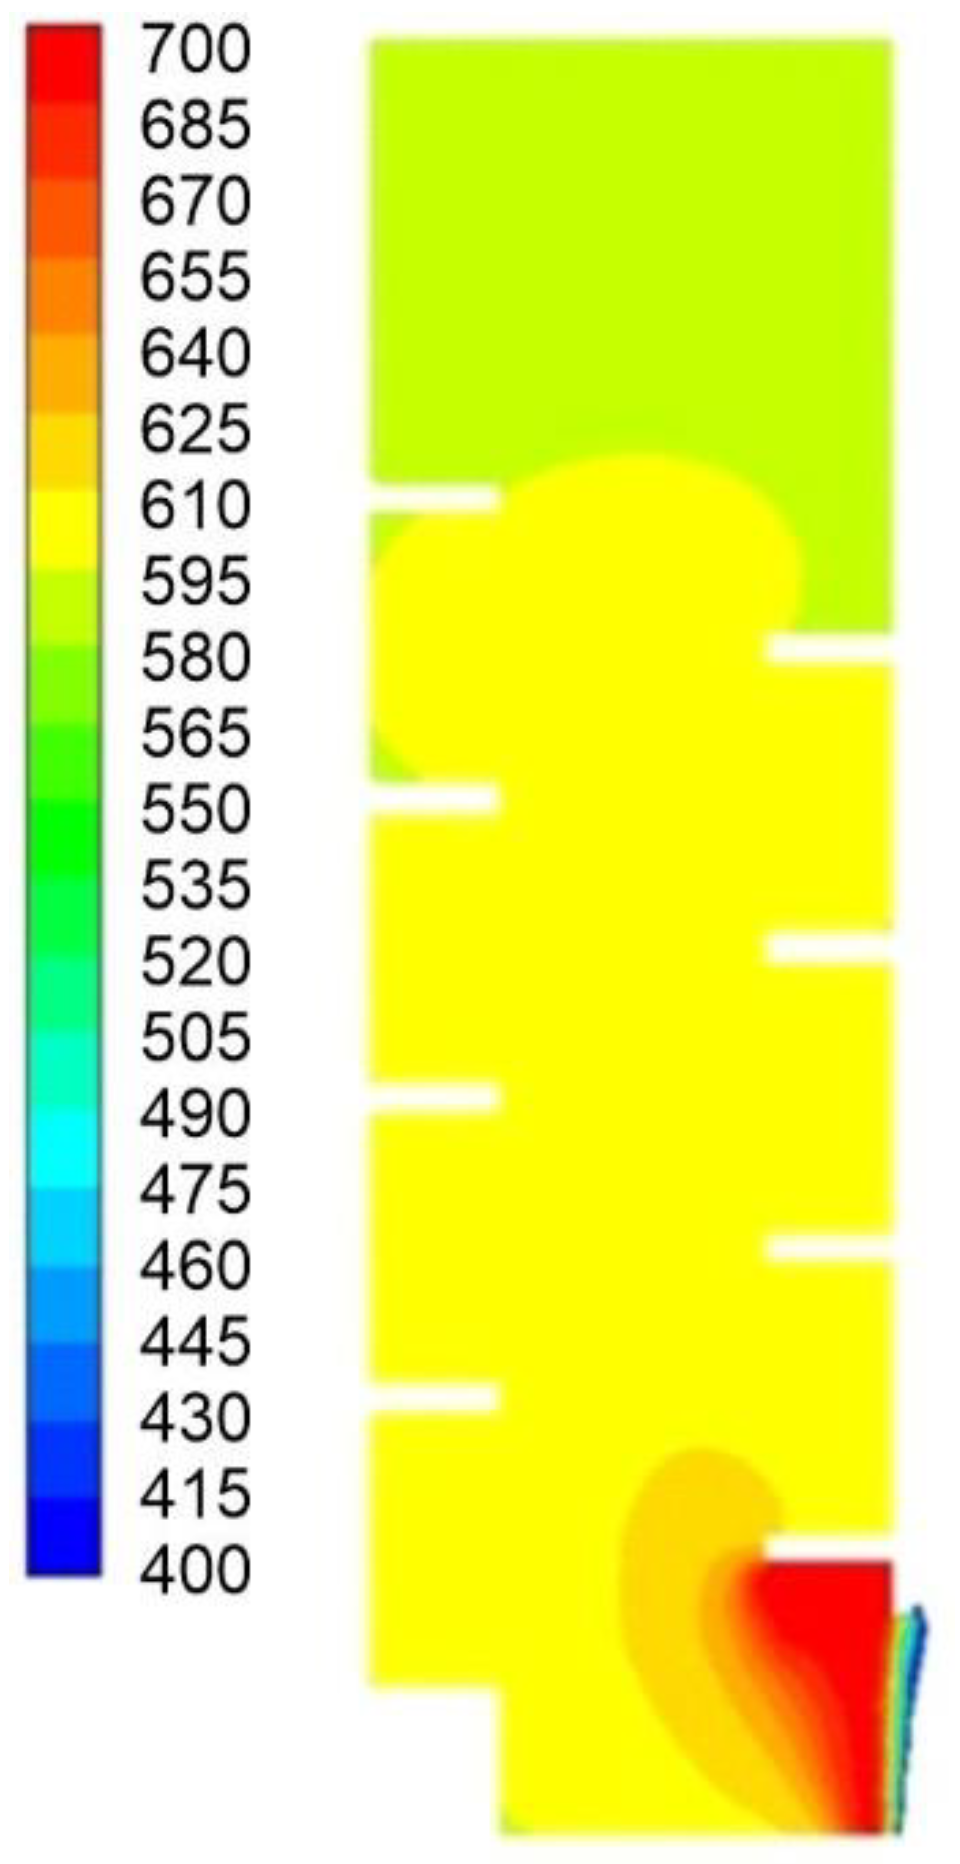
  • For the case illustrating the influence of an open window leading to the roof, one “pressure outlet” (p = atmospheric pressure) at the top window was set. The simulation demonstrated the flow of smoke with one exit point. Moreover, a fresh “air inlet” (marked as a pressure inlet with an overpressure of p = 10 Pa) was added to the previous model at the entrance door to the building.
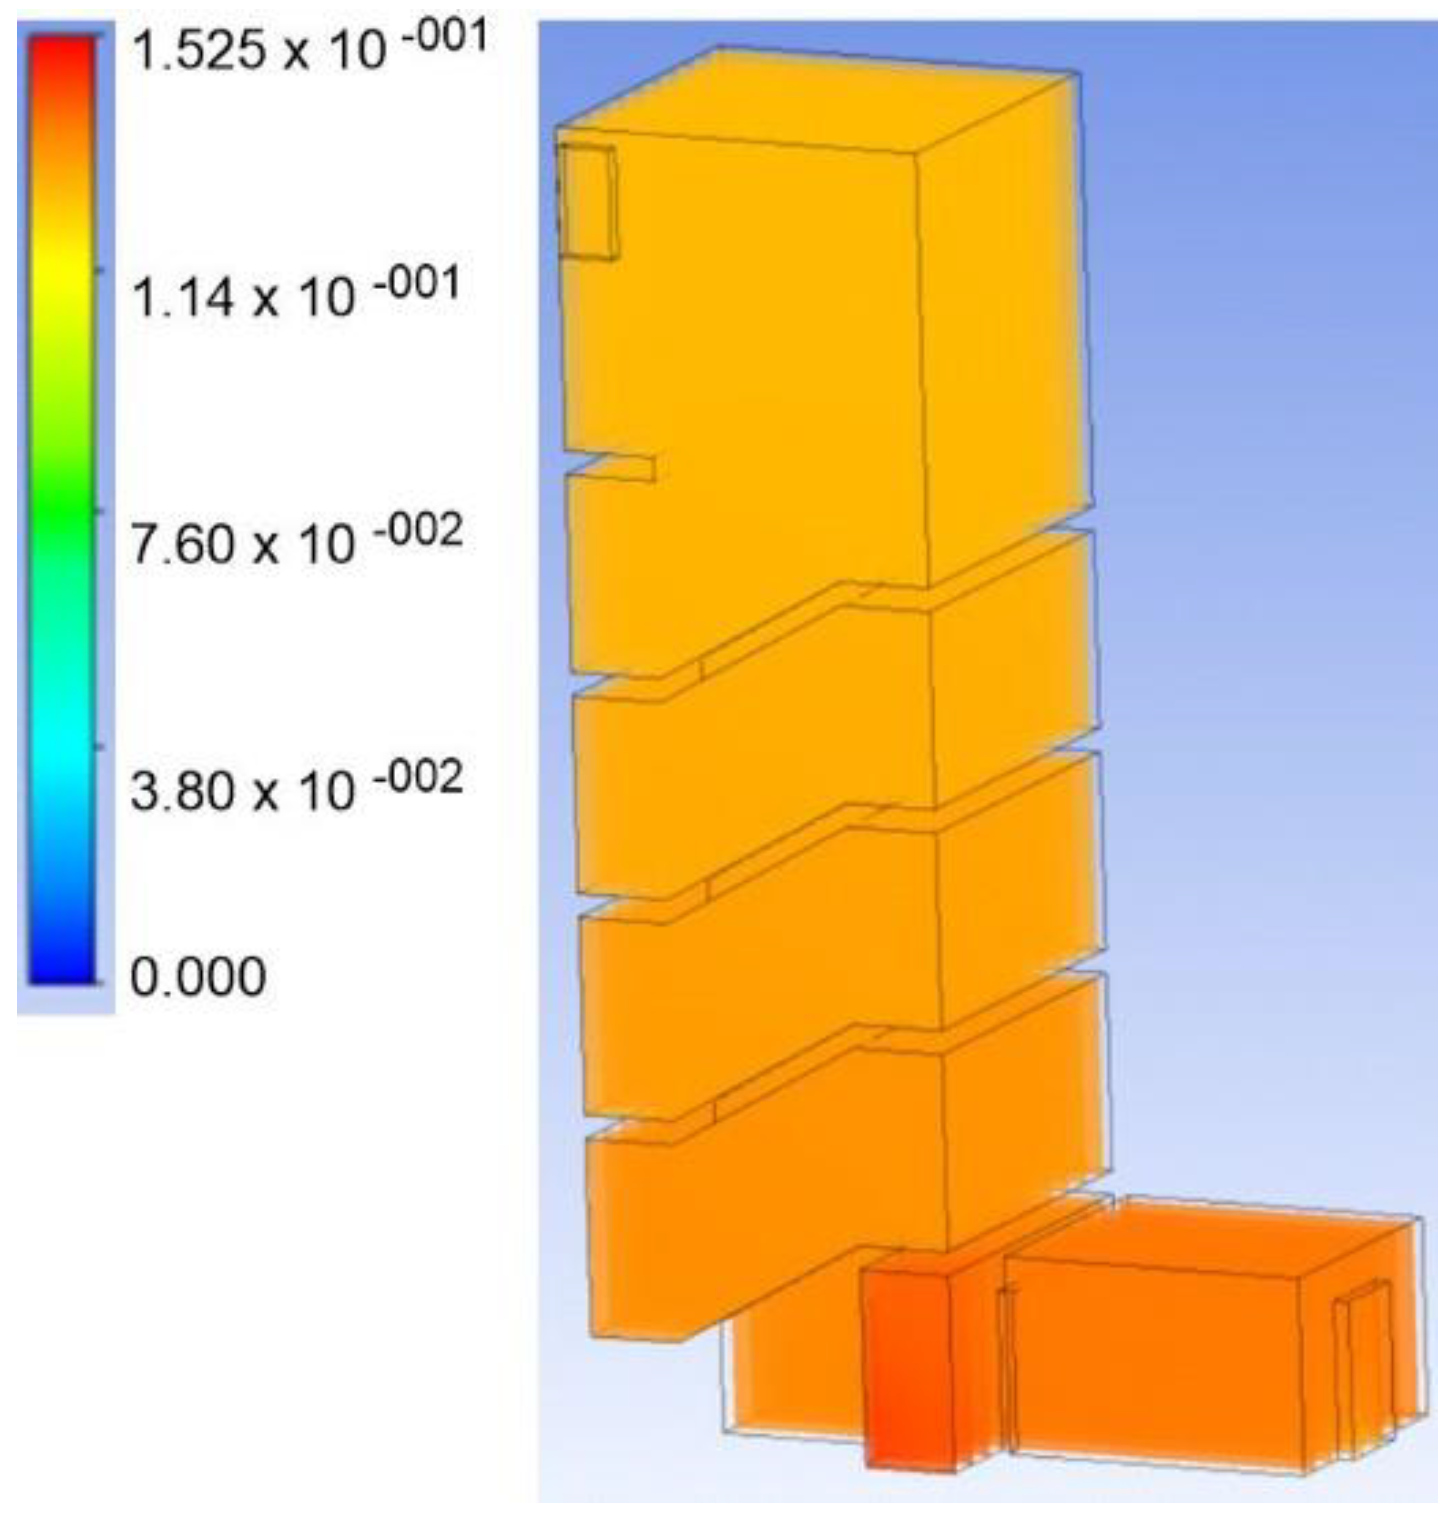
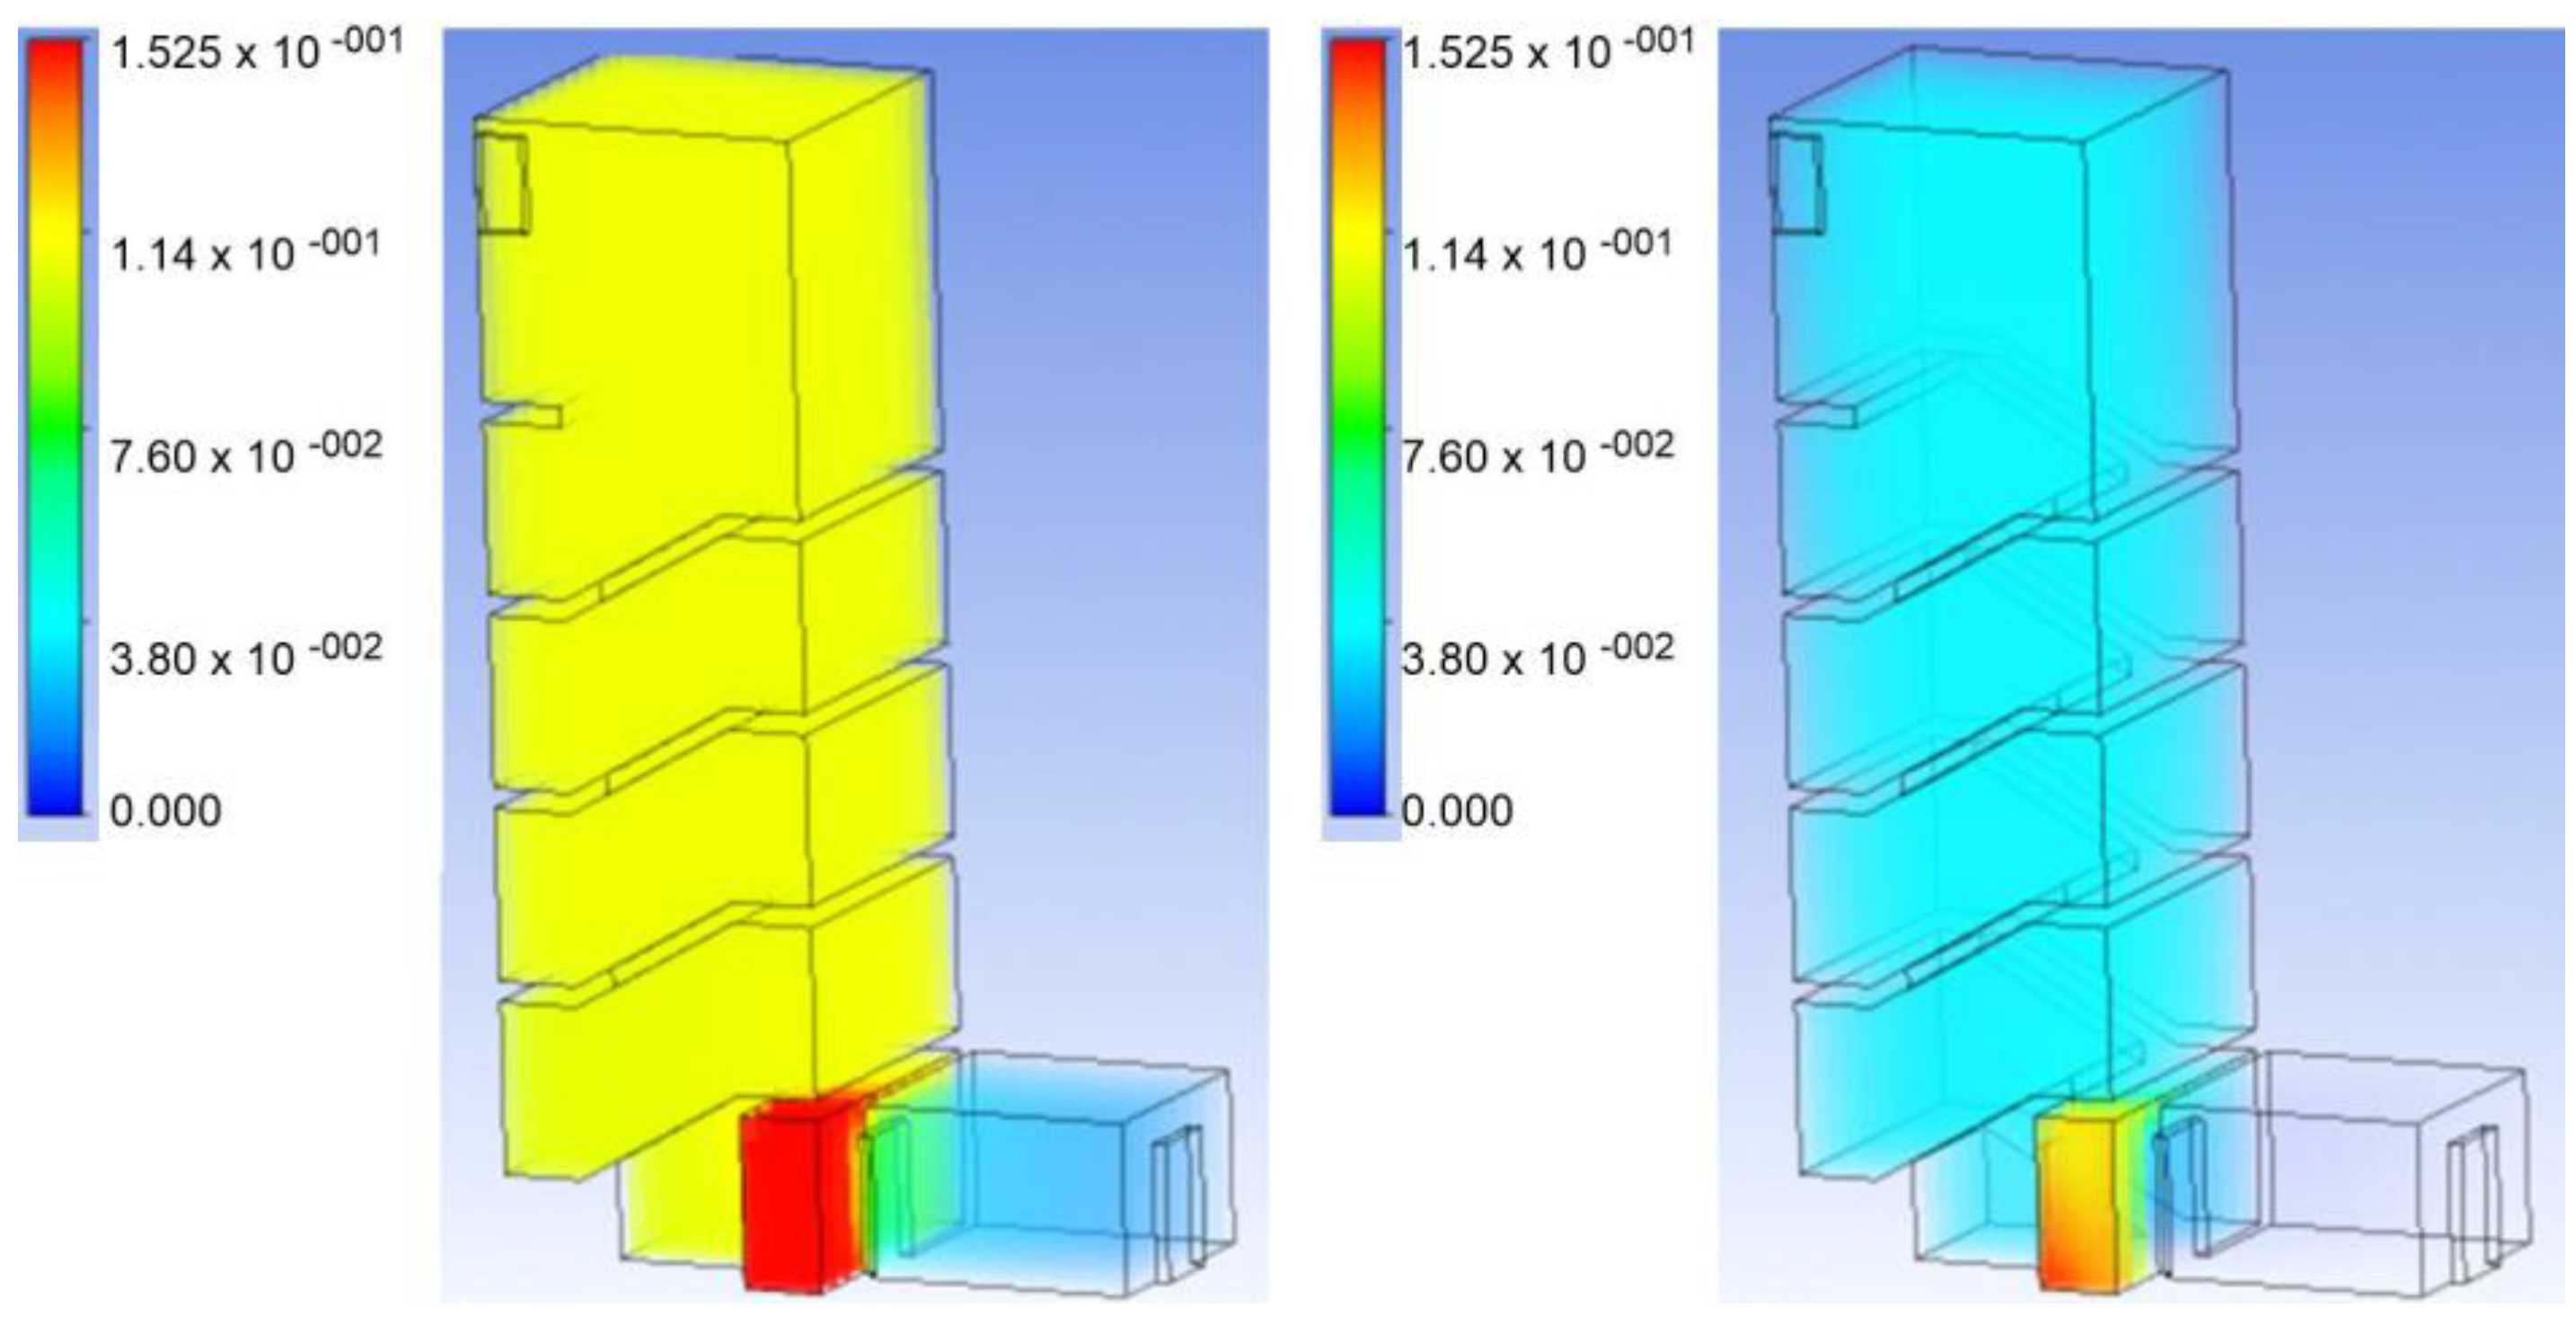
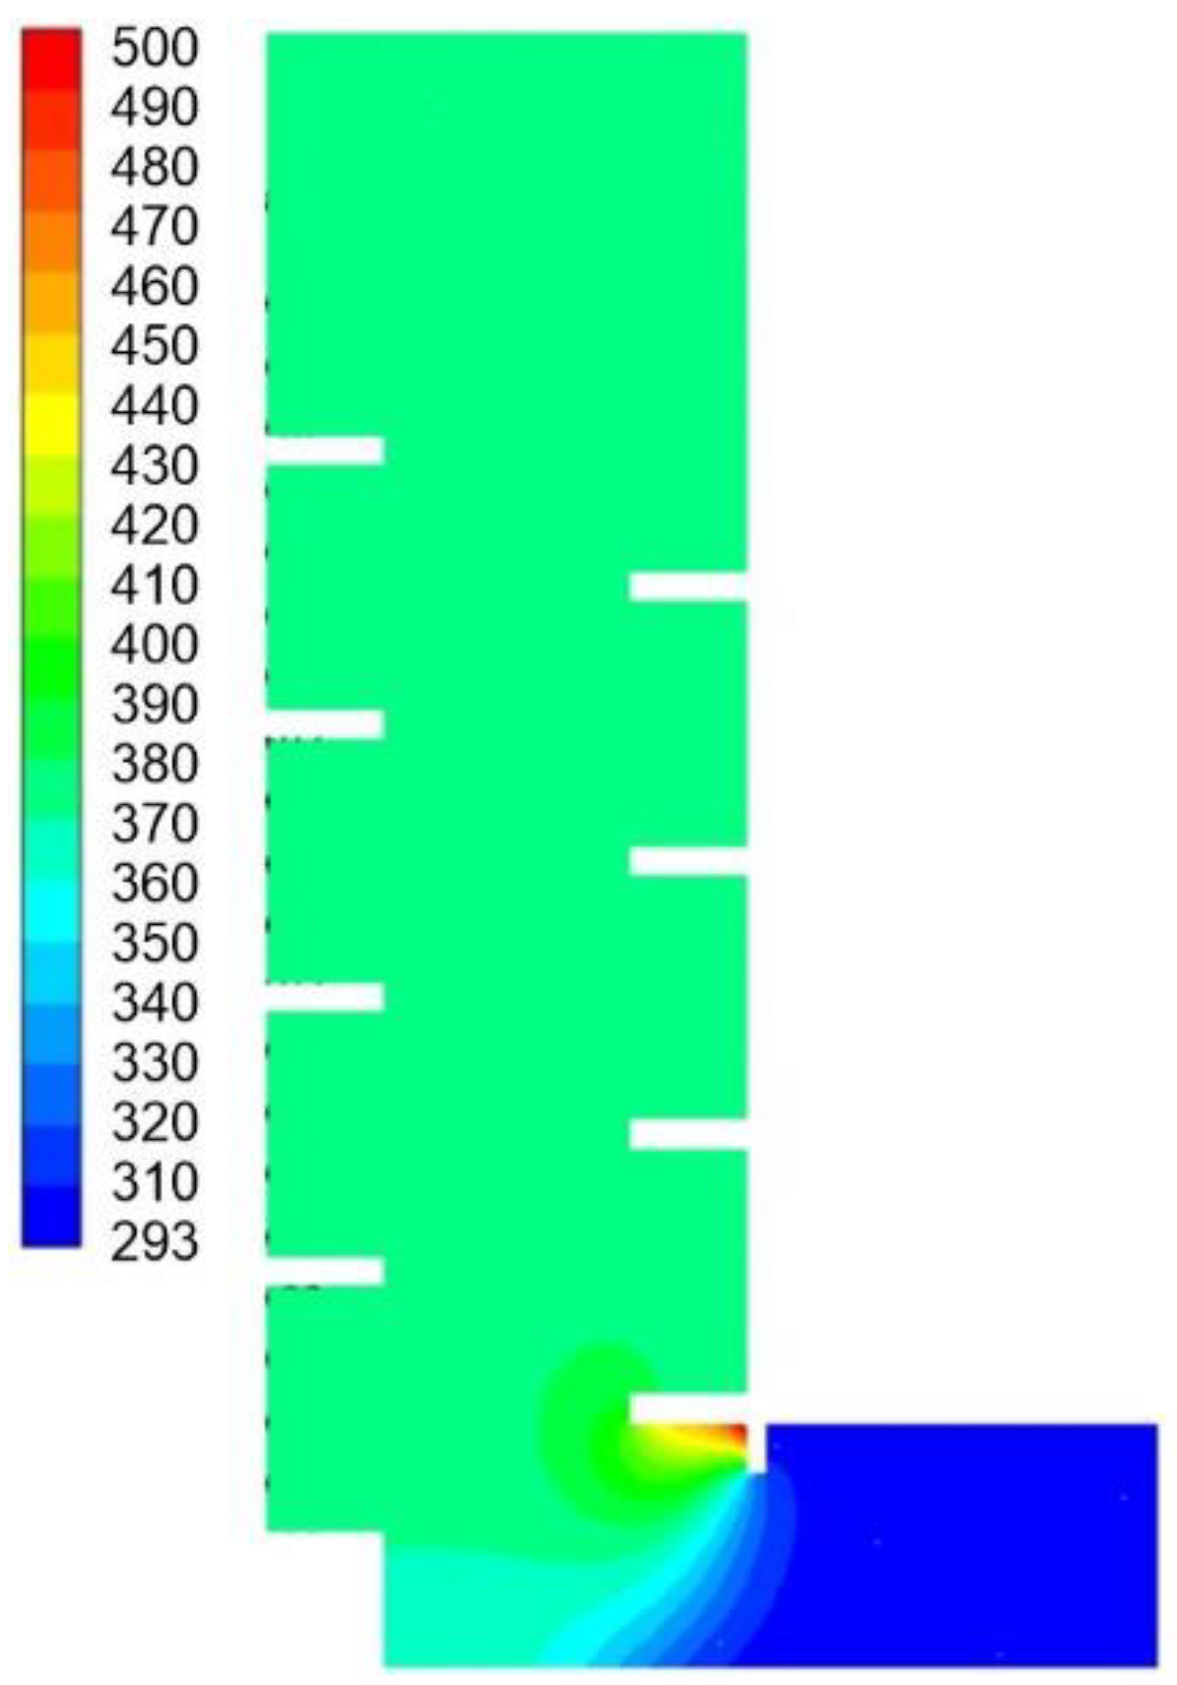
  • For the case illustrating the influence of an axial fan, a “pressure inlet” (with an inlet overpressure of p = 30 Pa) was established as the door inlet. This aimed to illustrate the conditions in which an axial fan is used.
All results were prepared in graphical form and carbon dioxide mass fractions were shown as isometric figures, allowing the presentation of gas penetration in the whole analyzed domain. The temperature spread was depicted as a 2D figure that matches the analyzed domain shape.

3. Results

3.1. Smoke Distribution in a Closed Building

The consideration of fire ventilation in a closed building was aimed at predicting the smoke time of the entire volume of the staircase filling with smoke. The results showed that after about 60 s, the whole block was smoky. This time might be the basis for determining the available safe escape time (ASET). The simulation results in successive time intervals are shown in Figure 3, Figure 4, Figure 5 and Figure 6.
Two seconds after opening the door, smoke flew into the staircase space, partially escaping into the room leading to the exit. The highest concentrations were noticeable in the space under the landing before the first flight of stairs. The swirls of smoke were also visible. In the first phase, when the building was filled with air, it dissipated quickly. With the increasing time of simulation, more smoke was present in the building; therefore, the concentration of carbon dioxide increased, until it reached a level of about 13% after 60 s. Figure 4 shows the distribution of carbon dioxide concentration throughout the building after 12 s.
After 12 s, the smoke reached the ceiling at the highest point of the building. The highest concentrations occurred in the ceiling zone on the ground floor, because this place was located at the shortest distance from the source of the outflow. Smoke also collected in the vestibule, finding its way out through the front door. Due to this, the smoke neutral zone separating the zone of fire gases and air was located at a height of about 2 m from the floor. This would allow the occupants of the ground floor apartments to safely leave the building.
After 30 s, the staircase was completely filled with smoke. Figure 5 depicts how the smoke rose through the upper part of the building towards the ceiling, where it then spread over the entire ceiling zone without any escape. On the lower floors, smoke accumulated in the stairwell and rose to the next floors.
The simulation described above was performed as variable with time. The time step was set to 0.2 s and the number of time steps was 450. After 65 s, the gas flow in the building remained constant, which allowed the calculation to stop earlier (Figure 6).
The next step was to analyze the conditions prevailing during the steady flow, in order to compare different variants of ventilation. With the closed window at the top of the building, smoke filled the entire space. The volume concentration of carbon dioxide was about 14%. Additionally, the smoke temperature exceeded 600 K. Such conditions made it impossible for trapped people to leave their apartments. The simulation results are shown in Figure 7 and Figure 8 in the form of the concentration of toxic gases in the entire volume, and temperature projected on the plane located in the center of the stairwell.
The highest temperature value and volume concentration of carbon dioxide were reached in the ceiling zone on the ground floor. High temperatures were also observed in the vestibule of the staircase. The smoke that filled the entire volume of the stairwell and the flight of stairs reached a higher pressure, so that after leaving the basement, it did not rise any further inside the building, but instead flowed towards the exit, finding an outlet to the atmosphere. The smoke in the upper part cooled down, mixing with the air in the staircase and giving off heat to the walls, whose temperature increased.

3.2. The Influence of an Open Window Leading to the Roof

Figure 9 shows the concentration of carbon dioxide for the closed and open window simulations. By creating an outlet at the top, much of the smoke raised upwards. Additionally, because of the pressure difference, some air was sucked into the building through the entrance door. This reduced the smoke density and the concentration of carbon dioxide in the staircase.
As a result of the air inflow from outside, where the temperature was 293 K, the temperature in the vestibule was reduced. The general conditions in the staircase space did not improve significantly, as the carbon dioxide concentration was still ~12% and the temperature outside the immediate vicinity of the outlet was 600 K. The temperature projected onto the vertical plane passing through the center of the stairwell is shown in Figure 10.
It was also observed that the opening of a window only slightly reduced the temperature and carbon dioxide concentration, which should still improve the conditions of evacuation, internal rescue and firefighting operations.

3.3. The Influence of an Axial Fan

The use of an axial fan introducing large amounts of cool air into the building interior significantly improved the conditions in the staircase. No smoke entered to the atrium, and the volume concentration of carbon dioxide in the entire staircase was limited to a level below 4%. A comparison of carbon dioxide concentrations with and without fan support is shown in Figure 11.
The temperature was also significantly lower; in the ceiling zone on the ground floor, it did not exceed 473 K. Such conditions would make it impossible for people trapped in the building to leave the apartments through the staircase. The temperature in the vertical section is shown in Figure 12.
The above comparisons showed the benefits of using mechanical fans during firefighters’ activities in the event of internal fires. They may significantly lower the temperature inside the facility, increase visibility and reduce the concentration of harmful fire gases. The use of the fan also caused a slight increase in pressure in the staircase. This fact may turn out to be worth analyzing, because with an excessively high overpressure in the cage, it may be impossible for less fit people to open the door from their apartments.

4. Discussion

Fire safety engineering is recognized as a unique branch of engineering [28]. When reviewing the needs of the building, there may be a number of objectives relevant to the fire strategy. The types of ventilation installed in a building, including gravity, mechanical and fire ventilation, influence its safety during both standard and fire conditions. Additionally, during emergencies, firefighters use portable fans to speed up fire extinguishing. A key element of building design is ensuring fire ventilation meets fire protection regulations. In the case of unconventional buildings, the use of numerical simulations may help in identifying the optimal solution [29]. Our results showed smoke levels (represented by the concentration of carbon dioxide) can quickly increase in the multi-story building without any ventilation, and the installation of different means of ventilation influences carbon dioxide concentrations rising with time. For instance, we determined that for the building fully filled with carbon dioxide (concentration approximately 13.5%), the average carbon dioxide concentration 60 s after the opening of the window leading to the roof was approximately equal to 10.2%. The usage of an axial fan additionally sped up the process and decreased the average carbon dioxide concentration to approximately 3.8%.
It was previously pointed out that any analytical model which addresses all factors that can influence the movement of gases throughout a building must deal with a complex set of interdependent factors [30]. In our study, the distribution of temperature and carbon dioxide concentration for a residential building spread over 5 above-ground floors was investigated. Our approach was in line with Hadjisophocleous and Jia, who simulated temperature, oxygen and carbon dioxide distribution with the use of FDS software to model smoke movement in a full-scale 10-storey building [31]. For calculations of the smoke and heat spread, additional equations of energy and radiation conservation as well as smoke transport were solved [32]. It was in line with the CFD model used in our paper. A complex fire risk assessment process can be also described mathematically with zone models. The main assumption of zone models was to divide the room uniformly in terms of different volume parameters. It was in line with Meroney et al., where the existing ventilation arrangement reproduced the characteristics of flow stagnation within the armament room [33]. Similarly to Elhelw et al., we noticed that burning rate, flame shape and radiation intensity are the most important parameters for fire properties. It was observed that parameters such as concentration of fire gases, temperature and properties of fire gases in the zones are averaged [34]. When a fire occurs in a single-slope tunnel without a shaft, the cold air is replenished from the entrance of the tunnel due to the stack effect [35].
Moreover, the calculations presented allowed us to obtain the visibility range. It was possible to determine the development and course of fire parameters that change over time. Previously, a series of simplified mathematical models based on the equations of continuity, energy and pressure balance allowed the estimation of the gas temperature and velocity [35]. Additionally, the use of the CFD method instead of the standard calculation gives a better overview of pressure and temperature changes for the fire safety of the protected compartment [36]. The issues solved within the analysis of smoke and heat spread are often highly turbulent, and, consequently, the description of the velocity and pressure field has a complicated form [37]. Furthermore, Niu et al. observed that the numerical simulations of gas temperature and air velocity distribution in a complicated buildings correlates with the RNG k-ε model, which was in line our data [38].
During a fire in a multi-story building, it is crucial to win time for occupants’ evacuation, and one of the possible methods is to utilize HVAC operations to control/slow down smoke propagation on the fire floor [39]. The application of a zone model to several single rooms is a useful approach to predict natural ventilation, for both buoyancy and combined wind-buoyancy ventilation [40]. It was in line with the presented results, where the input data included: room dimension (geometry), wall material, (conductivity, specific heat, thickness, density), dimensions and location of openings (doors, windows), mechanical ventilation properties, specificity of fire (HRR, combustion substrates as a function of time, limitation of the oxygen supply), sprinkler systems and specification of detectors. The results obtained on this basis are the conditions of the fire environment (temperature in the hot zone, temperature in the flame axis, oxygen and smoke concentration, wall and floor temperature), combustion intensity, flame height, flow velocity through holes, and the time after which the detector systems and sprinklers were activated.

Limitations to the Study

The CFD model was used within a designated medium-high building. The following assumptions were made: (1) replacing steps on the stairs with a sloping flat surface resembling a disabled ramp; (2) omission of barriers made of welded flat bars in the numerical model; (3) omission of doors and windows, leaving openings in their places for air and smoke inlet and outlet. Moreover, the turbulence model k-ε was selected. Furthermore, in the present work, we did not focus on the preparation of the smoke. Presently, it was crucial for us to understand how carbon dioxide flows for different spatial configurations of ventilation system, in order to indicate the practical aspect of our model.

5. Conclusions

The following conclusions can be drawn: (1) when the building is completely closed, smoke accumulates in the staircase, increasing the temperature and concentration of harmful fire gases, and making it difficult to carry out rescue operations and evacuation of residents; (2) the existence of a window leading to the roof is too small to effectively remove smoke from the entire building volume; (3) the use of mechanical ventilation significantly improves conditions in the staircase; (4) the provision of vents in the upper parts of the building is necessary for the extraction of smoke from the building—even the use of an axial fan with the window closed will not improve the conditions in the staircase; (5) the overpressure in the staircase caused by rising smoke will cause harmful gases to enter the apartments through all possible leaks in a door; (6) the use of an axial fan should be considered by the person in charge of the rescue operation each time during fires occurring in buildings higher than 12 m with large internal spaces—the rapid use of mechanical ventilation can shorten the time of operations and improve their safety.

Author Contributions

Conceptualization, Z.S.; methodology, Z.S.; software, Z.S. and A.P.; validation, A.P.-P., M.M.-L. and A.D.; formal analysis, A.P. and A.P.-P.; investigation, Z.S.; resources, Z.S.; data curation, A.P.; writing—original draft preparation, A.P. and A.D.; writing—review and editing, A.P.-P. and Z.S.; visualization, Z.S.; supervision, Z.S. and A.P.; project administration, Z.S.; funding acquisition, Z.S. All authors have read and agreed to the published version of the manuscript.

Funding

This research received no external funding.

Institutional Review Board Statement

Not applicable.

Informed Consent Statement

Not applicable.

Data Availability Statement

Data is available on request from the corresponding author.

Conflicts of Interest

The authors declare no conflict of interest.

References

  1. Lu, Z.; He, X.; Zhou, Y. Performance-based seismic analysis on a super high-rise building with improved viscously damped outrigger system. Struct. Control Health Monit. 2018, 25, e2190. [Google Scholar] [CrossRef]
  2. Xin, Y.; Changkui, L.; Jun, D.; Li, M.; Jing, F.; Yuanyuan, L.; Lei, B.; Chi-Min, S. Numerical Simulation of Fire Smoke Spread in a Super High-Rise Building for Different Fire Scenarios. Adv. Civ. Eng. 2019, 2019, 1659325. [Google Scholar]
  3. Black, W.Z. Smoke movement in elevator shafts during a high-rise structural fire. Fire Saf. J. 2009, 44, 16–182. [Google Scholar] [CrossRef]
  4. Yao-jian, L.; Guang-xuan, L.; Siu-ming, L. Influencing Factor Analysis of Ultra-tall Building Elevator Evacuation. Procedia Eng. 2014, 71, 583–590. [Google Scholar]
  5. Shinomiya, N.; Takada, S.; Ushio, T. Study on Ventilation in High-Rise Building Based on Pressure Differences Measured at Elevator Doors. Energy Procedia 2015, 78, 2712–2716. [Google Scholar] [CrossRef] [Green Version]
  6. Pasquay, T. Natural ventilation in high-rise buildings with double facades, saving or waste of energy. Energy Build. 2004, 36, 381–389. [Google Scholar] [CrossRef]
  7. Zhou, J.; Mao, J.; Huang, Y.; Xing, Z. Studies on Smoke Temperature Distribution in a Building Corridor Based on Reduced-scale Experiments. J. Asian Archit. Build. Eng. 2017, 16, 341–348. [Google Scholar] [CrossRef] [Green Version]
  8. Li, Q.; Li, S.-c.; Wang, Z.-h. Research on smoke exhaust effect at different installation height of mechanical exhaust port in ring corridor of high-rise building. Procedia Eng. 2016, 135, 327–335. [Google Scholar] [CrossRef] [Green Version]
  9. Park, H.; Meacham, B.J.; Dembsey, N. Conceptual Model Development for Holistic Building Fire Safety Performance Analysis. Fire Technol. 2015, 51, 173–193. [Google Scholar] [CrossRef] [Green Version]
  10. Guoxiang, Z.; Tarek, B.; Bart, M. Study of FDS simulations of buoyant fire-induced smoke movement in a high-rise building stairwell. Fire Saf. J. 2017, 91, 276–283. [Google Scholar]
  11. Majder-Lopatka, M.; Wesierski, T.; Dmochowska, A.; Salamonowicz, Z.; Polanczyk, A. The influence of hydrogen on the indications of the electrochemical carbon monoxide sensors. Sustainability 2020, 12, 14. [Google Scholar] [CrossRef] [Green Version]
  12. Baek, D.; Sung, K.H.; Ryou, H.S. Experimental study on the effect of heat release rate and aspect ratio of tunnel on the plug-holing phenomena in shallow underground tunnels. Int. J. Heat Mass Transf. 2017, 113, 1135–1141. [Google Scholar] [CrossRef]
  13. Merci, B.; Shipp, M. Smoke and heat control for fires in large car parks: Lessons learnt from research? Fire Saf. J. 2013, 57, 3–10. [Google Scholar] [CrossRef] [Green Version]
  14. Wang, W.; Zhu, Z.; Jiao, Z.; Mi, H.; Wang, Q. Characteristics of fire and smoke in the natural gas cabin of urban underground utility tunnels based on CFD simulations. Tunn. Undergr. Space Technol. 2020, 109, 103748. [Google Scholar] [CrossRef]
  15. Spearpoint, M.J.; Tohir, M.Z.M.; Abu, A.K.; Xie, P. Fire load energy densities for risk-based design of car parking buildings. Case Stud. Fire Saf. 2015, 3, 44–50. [Google Scholar] [CrossRef] [Green Version]
  16. Seike, M.; Kawabata, N.; Hasegawa, M. Quantitative assessment method for road tunnel fire safety: Development of an evacuation simulation method using CFD-derived smoke behavior. Saf. Sci. 2017, 94, 116–127. [Google Scholar] [CrossRef]
  17. Zhao, B.; Kruppa, J. Structural behaviour of an open car park under real fire scenarios. Fire Mater. Int. J. 2004, 28, 269–280. [Google Scholar] [CrossRef]
  18. Baalisampang, T.; Saliba, E.; Salehi, F.; Garaniya, V.; Chen, L. Optimisation of smoke extraction system in fire scenarios using CFD modelling. Process Saf. Environ. Prot. 2021, 149, 508–517. [Google Scholar] [CrossRef]
  19. Polanczyk, A.; Wawrzyniak, P.; Zbicinski, I. CFD analysis of dust explosion relief system in the counter-current industrial spray drying tower. Dry. Technol. 2013, 31, 881–890. [Google Scholar] [CrossRef]
  20. Zieminska-Stolarska, A.; Polanczyk, A.; Zbicinski, I. 3-D CFD simulations of hydrodynamics in the Sulejow dam reservoir. J. Hydrol. Hydromech. 2015, 63, 334–341. [Google Scholar] [CrossRef] [Green Version]
  21. Wawrzyniak, P.; Podyma, M.; Zbicinski, I.; Bartczak, Z.; Polanczyk, A.; Rabaeva, J. Model of Heat and Mass Transfer in an Industrial CounterCurrent Spray-Drying Tower. Dry. Technol. 2012, 30, 9. [Google Scholar]
  22. Wawrzyniak, P.; Polanczyk, A.; Zbicinski, I.; Jaskulski, M.; Podyma, M.; Rabaeva, J. Modeling of Dust Explosion in the Industrial Spray Dryer. Dry. Technol. 2012, 30, 1274–1282. [Google Scholar] [CrossRef]
  23. Wegrzynski, W.; Lipecki, T.; Krajewski, G. Wind and Fire Coupled Modelling—Part II: Good Practice Guidelines. Fire Technol. 2018, 54, 1443–1485. [Google Scholar] [CrossRef]
  24. Polanczyk, A.; Salamonowicz, Z.; Majder-Lopatka, M.; Dmochowska, A.; Jarosz, W.; Matuszkiewicz, R.; Makowski, R. 3D Simulation of Chlorine Dispersion in Rrural Area. Rocz. Ochr. Sr. 2018, 20, 1035–1048. [Google Scholar]
  25. Pontiggiaa, M.; Derudi, M.; Alba, M.; Scaioni, M.; Rota, R. Hazardous gas releases in urban areas: Assessment of consequences through CFD modelling. J. Hazard. Mater. 2010, 176, 589–596. [Google Scholar] [CrossRef]
  26. Salamonowicz, Z.; Krauze, A.; Majder-Lopatka, M.; Dmochowska, A.; Piechota-Polanczyk, A.; Polanczyk, A. Numerical Reconstruction of Hazardous Zones after the Release of Flammable Gases during Industrial Processes. Processes 2021, 9, 307. [Google Scholar] [CrossRef]
  27. Polanczyk, A.; Salamonowicz, Z. Computational modeling of gas mixture dispersion in a dynamic setup—2d and 3d numerical approach. E3S Web Conf. 2018, 44, 00146. [Google Scholar] [CrossRef] [Green Version]
  28. Fabiano, B. Loss prevention and safety promotion in the process industries: Issues and challenges. Process Saf. Environ. Prot. 2017, 110, 1–4. [Google Scholar] [CrossRef]
  29. Huang, H.S.; Su, C.H.; Li, C.B.; Lin, C.Y.; Lin, C.C. Enhancement of Fire Safety of an Existing Green Building due to Natural Ventilation. Eneries 2016, 9, 192. [Google Scholar] [CrossRef] [Green Version]
  30. YJuntao, Y.; Yun Yang, Y.C. Numerical Simulation of Smoke Movement Influence to Evacuation in a High-Rise Residential Building Fire. Procedia Eng. 2012, 45, 727–734. [Google Scholar]
  31. Hadjisophocleous, G.; Jia, Q. Comparison of FDS Prediction of Smoke Movement in a 10-Storey Building with Experimental Data. Fire Technol. 2009, 45, 163–177. [Google Scholar] [CrossRef]
  32. Boron, S.; Wegrzynski, W.; Kubica, P.; Czarnecki, L. Numerical Modelling of the Fire Extinguishing Gas Retention in Small Compartments. Appl. Sci. 2019, 9, 663. [Google Scholar] [CrossRef] [Green Version]
  33. Meroney, R.N.; Douglas, W.H.; Derickson, R.; Stroup, J.; Weber, K.; Garrett, P. CFD Simulation of ventilation and smoke movement in a large military firing range. J. Wind Eng. Ind. Aerodyn. 2015, 136, 12–22. [Google Scholar] [CrossRef]
  34. Elhelw, M.; El-Shobaky, A.; Attia, A.; El-Maghlany, W.M. Advanced dynamic modeling study of fire and smoke of crude oil storage tanks. Process. Saf. Environ. Prot. 2021, 146, 670–685. [Google Scholar] [CrossRef]
  35. Yi, L.; Wang, X.; Yang, Y.; Wang, Y.; Zhou, Y. A simplified mathematical model for estimating gas temperature and velocity under natural smoke exhaust in sloping city tunnel fires. Sustain. Cities Soc. 2020, 55, 102071. [Google Scholar] [CrossRef]
  36. McGrattan, K.; McDermott, R.; Floyd, J.; Hostikka, S.; Forney, G.; Baum, H. Computational fluid dynamics modelling of fire. Int. J. Comput. Fluid Dyn. 2012, 26, 349–361. [Google Scholar] [CrossRef]
  37. Blocken, B. LES over RANS in building simulation for outdoor and indoor applications: A foregone conclusion? In Building Simulation; Springer: Berlin/Heidelberg, Germany, 2018; Volume 11, pp. 821–870. [Google Scholar]
  38. Niu, J.-q.; Zhou, D.; Liang, X.-f.; Liu, S.; Liu, T.-h. Numerical simulation of the Reynolds number effect on the aerodynamic pressure in tunnels. J. Wind Eng. Ind. Aerodyn. 2018, 173, 187–198. [Google Scholar] [CrossRef]
  39. Yuan, Y.; Yan-yan, C.; Dong, L. Study on Smoke Control Strategy in a High-rise Building Fire. Procedia Eng. 2014, 71, 145–152. [Google Scholar]
  40. Tan, G.; Glicksman, L.R. Application of integrating multi-zone model with CFD simulation to natural ventilation prediction. Energy Build. 2005, 37, 1049–1057. [Google Scholar] [CrossRef]
Figure 1. 3D geometry of the analyzed building, generated with the use of Ansys SpaceClaim software.
Atmosphere 12 00705 g001
Figure 2. Numerical mesh generated with the use of Ansys ICEM software.
Atmosphere 12 00705 g002
Figure 3. Carbon dioxide distribution 2 s after the door was opened. Carbon dioxide was measured as a mass fraction.
Atmosphere 12 00705 g003
Figure 4. Carbon dioxide distribution 12 s after the door was opened. Carbon dioxide was measured as a mass fraction.
Atmosphere 12 00705 g004
Figure 5. Carbon dioxide distribution 30 s after the door was opened. Carbon dioxide was a measured as mass fraction.
Atmosphere 12 00705 g005
Figure 6. Carbon dioxide distribution 65 s after the door was opened. Carbon dioxide was measured as a mass fraction.
Atmosphere 12 00705 g006
Figure 7. Carbon dioxide distribution for a closed building. Carbon dioxide was measured as a mass fraction.
Atmosphere 12 00705 g007
Figure 8. Temperature distribution for a closed building. Temperature was measured in (K).
Atmosphere 12 00705 g008
Figure 9. Carbon dioxide distribution for a closed building (left) and after the window was opened (right). Carbon dioxide was measured as a mass fraction.
Atmosphere 12 00705 g009
Figure 10. Temperature distribution after the window was opened. Temperature was measured in (K).
Atmosphere 12 00705 g010
Figure 11. Carbon dioxide distribution in the staircase before (left) and after (right) axial fan application. Carbon dioxide was measured as a mass fraction.
Atmosphere 12 00705 g011
Figure 12. Temperature distribution in the building after axial fan application. Temperature was measured in (K).
Atmosphere 12 00705 g012
Publisher’s Note: MDPI stays neutral with regard to jurisdictional claims in published maps and institutional affiliations.

