Article

The Evolution Characteristics of Daily-Scale Silk Road Pattern and Its Relationship with Summer Temperature in the Yangtze River Valley

1
College of Air Traffic Management, Civil Aviation Flight University of China, Guanghan 618307, China
2
Key Laboratory of Meteorological Disaster, Ministry Education, Joint International Research Laboratory of Climate and Environment Change, Collaborative Innovation Center on Forecast and Evaluation of Meteorological Disasters, Nanjing University of Information Science and Technology, Nanjing 210044, China
*
Authors to whom correspondence should be addressed.
Submission received: 18 April 2021 / Revised: 28 May 2021 / Accepted: 7 June 2021 / Published: 9 June 2021

Abstract

:
By employing multi-reanalysis daily datasets and station data, this study focuses on the evolution characteristics of the daily-scale Silk Road pattern (SRP) and its effect on summer temperatures in the Yangtze River Valley (YRV). The results manifest that the evolution characteristics of positive- and negative-phase SRP (referred to SRP+ and SRP−) exhibit marked distinctions. The anomaly centers of SRP+ over West Central Asia (WCA) and Mongolia emerge firstly, vanishing simultaneously one week after peak date; however, the Far East (FE) anomaly centers can persist for a longer period. The SRP− starts with the WCA and FE centers, with a rapid decline in the strength of the WCA center and preservation of other anomaly centers after its peak. In the vertical direction, daily-scale SRP mainly concentrates in the mid-to-upper troposphere. Baroclinicity accounts for its early development and barotropic instability process favors the maintenance. Moreover, the SRP+ (SRP−) is inextricably linked to heat wave (cool summer) processes in the YRV. Concretely, before the onset of SRP+ events, an anomalous anticyclone and significant negative vorticities over East Asia related to SRP+ favor the zonal advance between the South Asia high (SAH) and western Pacific subtropical high (WPSH), inducing local descents over YRV area. The sinking adiabatic warming and clear-sky radiation warming can be considered as the possible causes for the YRV heat waves. The adiabatic cooling with the local ascents leads to more total cloud cover (positive precipitation anomalies) and less solar radiation incident to surface of the YRV, inducing the cool summer process during SRP−.

1. Introduction

For a long time, meteorologists generally point out that summer weather and climate over East Asia are inextricably linked to the East Asian summer monsoon, Qinghai-Tibet Plateau, and other external forcing factors (i.e., sea surface temperature in the tropical Pacific, Arctic sea ice, solar activity, and soil moisture) [1,2,3]. Variations of East Asian summer monsoon circulation are particularly complicated owing to the existence and persistence of summer atmospheric teleconnection patterns [4,5]. The well-known Silk Road pattern (SRP) is recognized as one of the dominant modes and most influential patterns during boreal summer over the Eurasian continent [6,7,8,9] and is considered as an effective predictor of East Asian summer climate anomalies.
In literature, the SRP features a stationary Rossby wave train pattern trapped along the upper-level westerly jet, geographically fixed over the Eurasian continent along approximately 40° N, which resembles the Eurasian part of a circumglobal teleconnection pattern in mid-latitude circulation of the Northern Hemisphere [10,11,12,13]. Previous studies indicated that it can regulate the interaction between the members of the Eurasian circulation systems and markedly affect the summer weather and climate anomalies over East Asia [5,14]. For instance, SRP exerts substantial influence on East Asian summer monsoon circulation [7,15,16]. It is closely linked to the Asian summer monsoon in both subtropical East Asia and India, and it could impact the withdrawal of the South China Sea (SCS) summer monsoon via modulating atmospheric circulation anomalies over the SCS [17]. The SRP contributes to formation of the Bonin high, the western Pacific subtropical high (WPSH), and the Mei-Yu front, affecting the precipitation and temperature around the Asian jet regions [14]. The positive (negative) phases SRP maybe triggers upper-level cyclonic (anticyclonic) anomalies and strong divergence (convergence) in the mid-latitudes over East Asia, with more (less) rainfall in southern China [5]. Moreover, the SRP has a profound effect on the temperature anomalies over the Japan, Europe, and Southeast Asia [18,19,20]. The combination of SRP and the Pacific–Japan pattern could cause stronger convergence (divergence) and significant anomalies of sea level pressure over Japan, leading to larger surface temperature decrease in the northern part of Japan [18]. Many studies pointed out that the SRP can significantly affect the temperature variation over many parts of Eurasia [11,19,20]. In addition, subsequent studies have indicated that SRP also has a significant effect on climate and weather over the northern China, southern China, and Indian Monsoon regions [7,21,22,23,24].
Plenty of works have been devoted to study its evolution characteristics, formation mechanism, and influence on East Asian summer monsoon climate by analyzing monthly fields [13,14]. Recently, various studies have shown that the atmospheric teleconnections can also be identified on daily timescales by analyzing daily fields, revealing their formation mechanism and evolution characteristics [25,26,27,28]. Besides, previous studies on the relationship between the SRP and summer temperature mainly focus on the Europe and Japan [18,19]. The middle and lower reaches of Yangtze River Valley in China is significantly affected by East Asian summer monsoon, which is prone to high temperature weather [29]. Moreover, the YRV is one of the most densely populated and economically developed region in China. The heat waves in the YRV have a more important impact on people’s production and life. However, the impact of SRP on the summer temperature in the YRV and the role of SRP in temperature anomalies need to be further explored [30]. Therefore, the current work attempts to explore the following issues: (1) what are the evolution characteristics of daily-scale SRP? (2) What are the influence of SRP on summer temperature in the Yangtze River Valley and underlying mechanisms? Addressing these issues will be beneficial to developing a better understanding of the SRP’s variation and its effect on the summer climate in China. As we will show, daily analysis unfolds more details of SRP climate effects.

2. Data and Methods

2.1. Data

This primary dataset used in this study is the European Centre for Medium-Range Weather Forecast (ECMWF) Reanalysis data (ERA5), on a horizontal resolution of 0.25° × 0.25° in longitude and latitude, with 37 regular vertical pressure levels. The variables include geopotential height (gpm), wind field (m s−1), vertical p-velocity (Pa s−1), air temperature (K), 2 metre temperature (K), surface solar radiation downwards (kJ m−2), total cloud cover (0–1), and relative vorticity (s−1) [31]. This reanalysis dataset is available online https://cds.climate.copernicus.eu/ (accessed on 7 May 2021). The analyzed time span is selected from 1979 to 2020 for the warm season (June–August).
We also employed the daily precipitation data obtained from China’s Ground Precipitation 0.5° × 0.5° Gridded Dataset (version 2.0) [32,33]. This observational dataset is available online http://data.cma.cn (accessed on 1 April 2020).

2.2. Methods

The present study mainly utilizes the methods of empirical orthogonal function (EOF) analysis, composite analysis, and the Student’s t-test. Only the results satisfying the criteria at the 0.05 confidence level are deemed statistically significant. According to the suggestion of Grumm and Hart [34], a 21-day binomial filter (10 days either side of a specific day) was firstly applied, which can effectively highlight the daily variability of each variable. Then, based on the period of 1979–2020, the daily climatological mean value and standard deviation (σ) of each variable were calculated based on the above smoothed daily fields. Compared with using unsmoothed single-day values, the climatological mean value and standard deviation appear more stable. Such 21-day sliding windows can also highlight the daily variability, which is an effective method for identifying typical synoptic to sub-monthly scale circulation patterns [26,27]. Finally, the normalized anomaly of a variable on a specific day was calculated as follows: the corresponding climatological daily mean was first subtracted to retain the majority of the synoptic signal, and the value was divided by the corresponding climatological daily standard deviation.
In addition, the phase-independent wave-activity flux (WAF) was calculated to describe the wave energy propagation characteristics of the quasi-stationary waves and transient fluctuations, which refers to the two-dimensional formula in the previous studies [35]. The climatological daily mean flow during summer (June–August) from 1979 to 2020 was used as the basic flow of this WAF formula, including zonal and meridional wind fields with zonal nonuniformity. The expression of two-dimensional WAF is:
W = p 2000   | U | { U ( Ψ x 2 Ψ Ψ x x ) + V ( Ψ x Ψ y Ψ Ψ x y ) U ( Ψ x Ψ y Ψ Ψ x y ) + V ( Ψ x 2 Ψ Ψ y y ) }
where U = ( U ,   V ) denotes the horizontal zonally varying basic flow, U and V represent the zonal and meridional wind component respectively, p signifies the pressure (hPa). Ψ is the stream function for quasi-geostrophic flow.

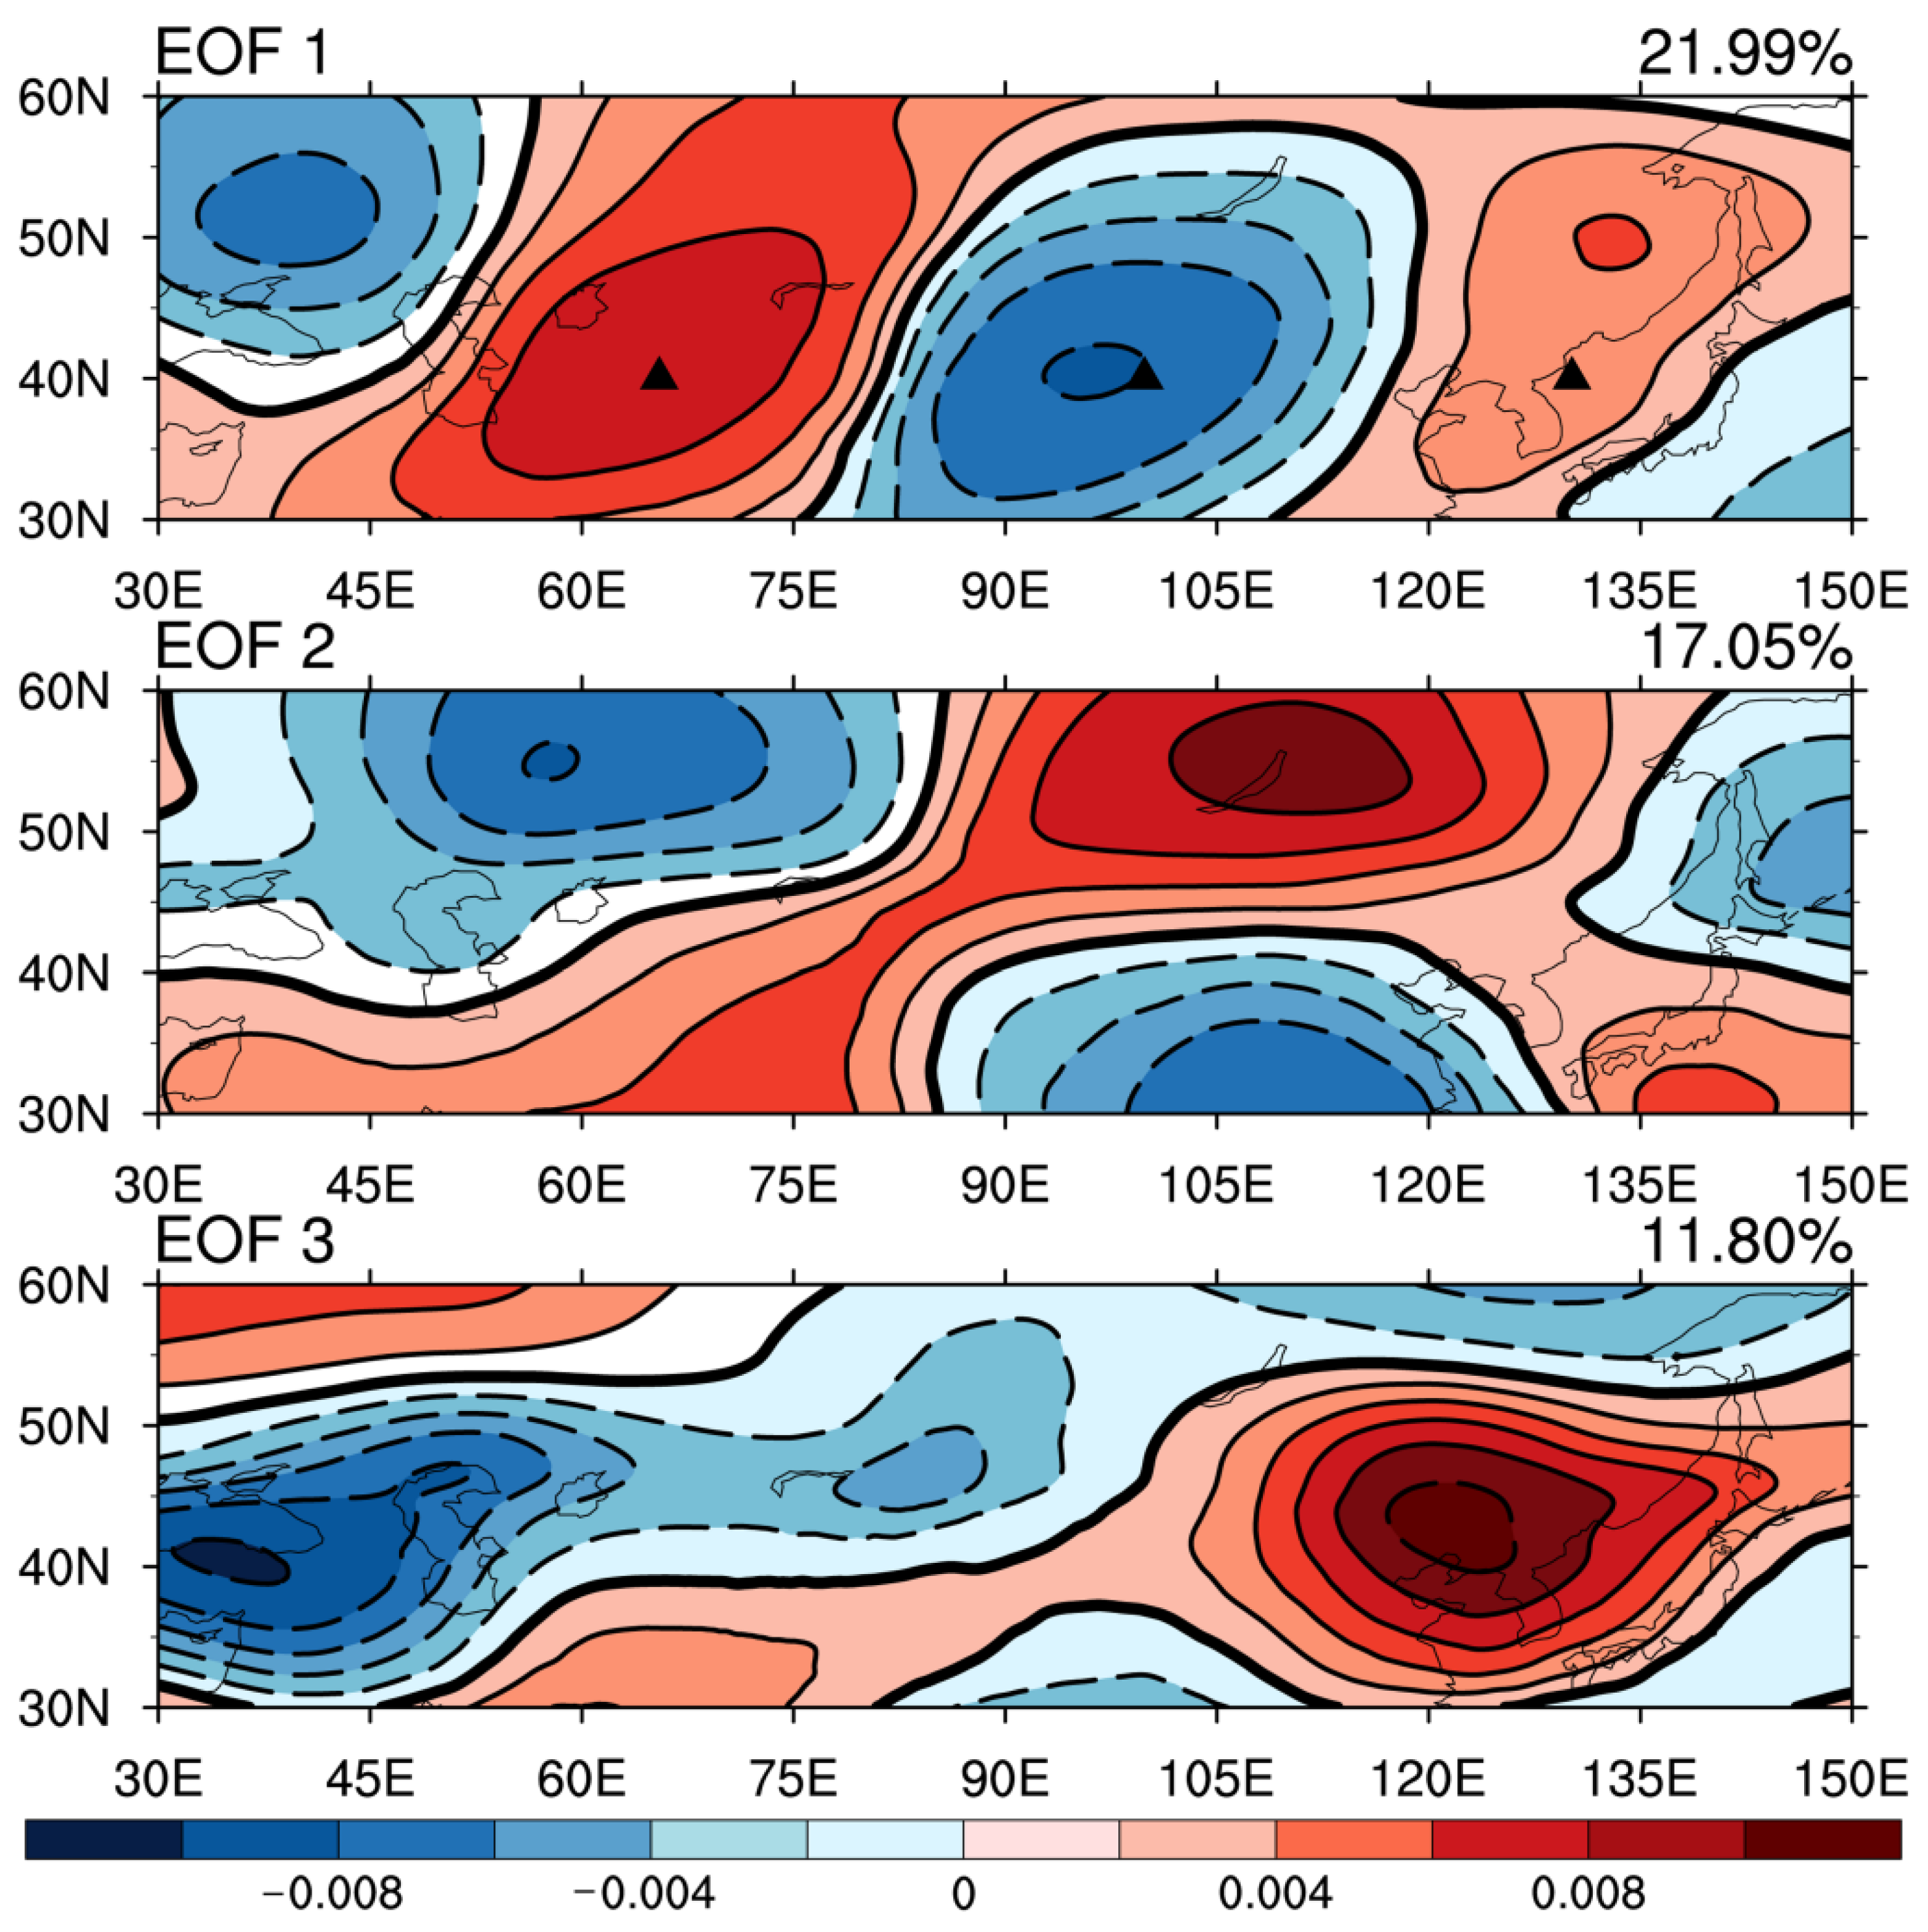
3. Identification of Daily-Scale SRP

Teleconnection patterns are usually identified in the summer mean circulation by analyzing monthly-mean fields in most of the previous studies [36,37]. This paper attempts to define the daily-scale SRP by using daily data. To identify the SRP, EOF analysis is performed on 200 hPa daily normalized height anomalies along the Asian jet region of 30–150° E, 30–60° N during the summertime (June–August) of 1979 to 2020. The first EOF mode is the so-called Silk Road pattern, which is wavelike and zonally organized. It explains 21.99% of the total variance (Figure 1). This pattern is very similar to the Silk Road pattern obtained by previous studies based on the monthly-mean fields [7,12,38].
Then, a daily SRP index (SRPI) was defined. Firstly, the three basic points selected to represent three anomaly centers of the SR pattern are (65° E, 40° N) over the West Central Asia (WCA), (100° E, 40° N) over Mongolian (MO) region, and (130° E, 40° N) over the Far East (FE), based on the first mode of EOF analysis (Figure 1). The same basic points were selected in previous studies to analyze the Silk Road pattern by use of monthly-mean data [17,18]. Secondly, SRPI was calculated by use of daily normalized 200 hPa geopotential height anomalies at the three basic points (Equation (1)).
SRPI = ( H WCA H MO + H FE ) 3   ,
where the HWcA, HMO, and HFE represent the normalized 200 hPa geopotential height anomalies at the three basic points in the EOF1 mode (the triangles in Figure 1), respectively. The positive phase appears as the SRPI exceeds zero, while the negative phase appears when SRPI is below zero. The peak phase of SRP is defined as the day when the daily SRPI is a local maximum and exceeds +1.0 standard deviation (σ), representing that the geopotential height anomalies of action centers attain maximal value over the Asian jet region.

4. Evolution Characteristics of Daily-Scale SRP

Composite analysis will be used in this section to investigate the evolution characteristics of the SRP on daily timescales. To ensure that the composite results satisfy the statistical significance, the adequate sample sizes of the positive and negative phases of SR pattern need to be picked out firstly (for convenience, referred to SRP+ and SRP− events respectively in current study).
Based on the daily fields processed by the method in Section 2.2, the more details and some fresh features of evolution characteristics and vertical structure of SRP will be investigated in the following analysis.
Daily-scale SRP+ (SRP−) events were identified, after the SRPI being defined. A typical SRP+ (SRP−) event must meet the following three criteria simultaneously. (1) SRPI is greater than (less than) +1.0 (−1.0) standard deviation (σ) for at least three consecutive days. (2) Height anomalies at 200 hPa show the tripole structure as ‘+ − +’ (‘− + −’) corresponding to the three basic anomaly centers. (3) Time interval between two SRP events must be more than 10 days. If two or more peak phases occur in less than 10 days, only the first peak is counted to ensure the independence of each peak phase [21].
In total, 40 SRP+ and 40 SRP− events were identified, according to the criteria. The year, start date, peak date, end date, duration, averaged SRPI, HWCA, HMO, and HFE of the identified typical SRP+ and SRP− events are displayed in Table 1 and Table 2, respectively. Particularly, on average there is less than one SRP event per summer identified according to the SRPI during 1979–2020 (42 summers). It is possible that though the daily-scale SRP also appears in some summers, its intensity and duration fail to meet the criteria of ‘a typical SRP event’, which features a daily SRPI value of +1.0 σ or greater persisting for less than three consecutive days. Further considering the complexity of East Asian summer circulation, these identified 40 SRP+ and 40 SRP− events can basically be viewed as the typical cases to investigate the evolution features and the relationship to summer temperature in the Yangtze River Valley.
As shown in the tables, the typical SRP+ events prevail most frequently during mid-to-late summer (July to August), but SRP− events tend to be more significant during early to mid-summer (June to July). The duration of SRP+ (SRP−) events can be up to 19 (17) days. The following composite analyses are generally based on the identified typical SRP+ and SRP− cases. For convenience, day 0 represents the peak date of SRP events; day (n) denotes the day prior to (negative) and after (positive) the peak date of SRP events.

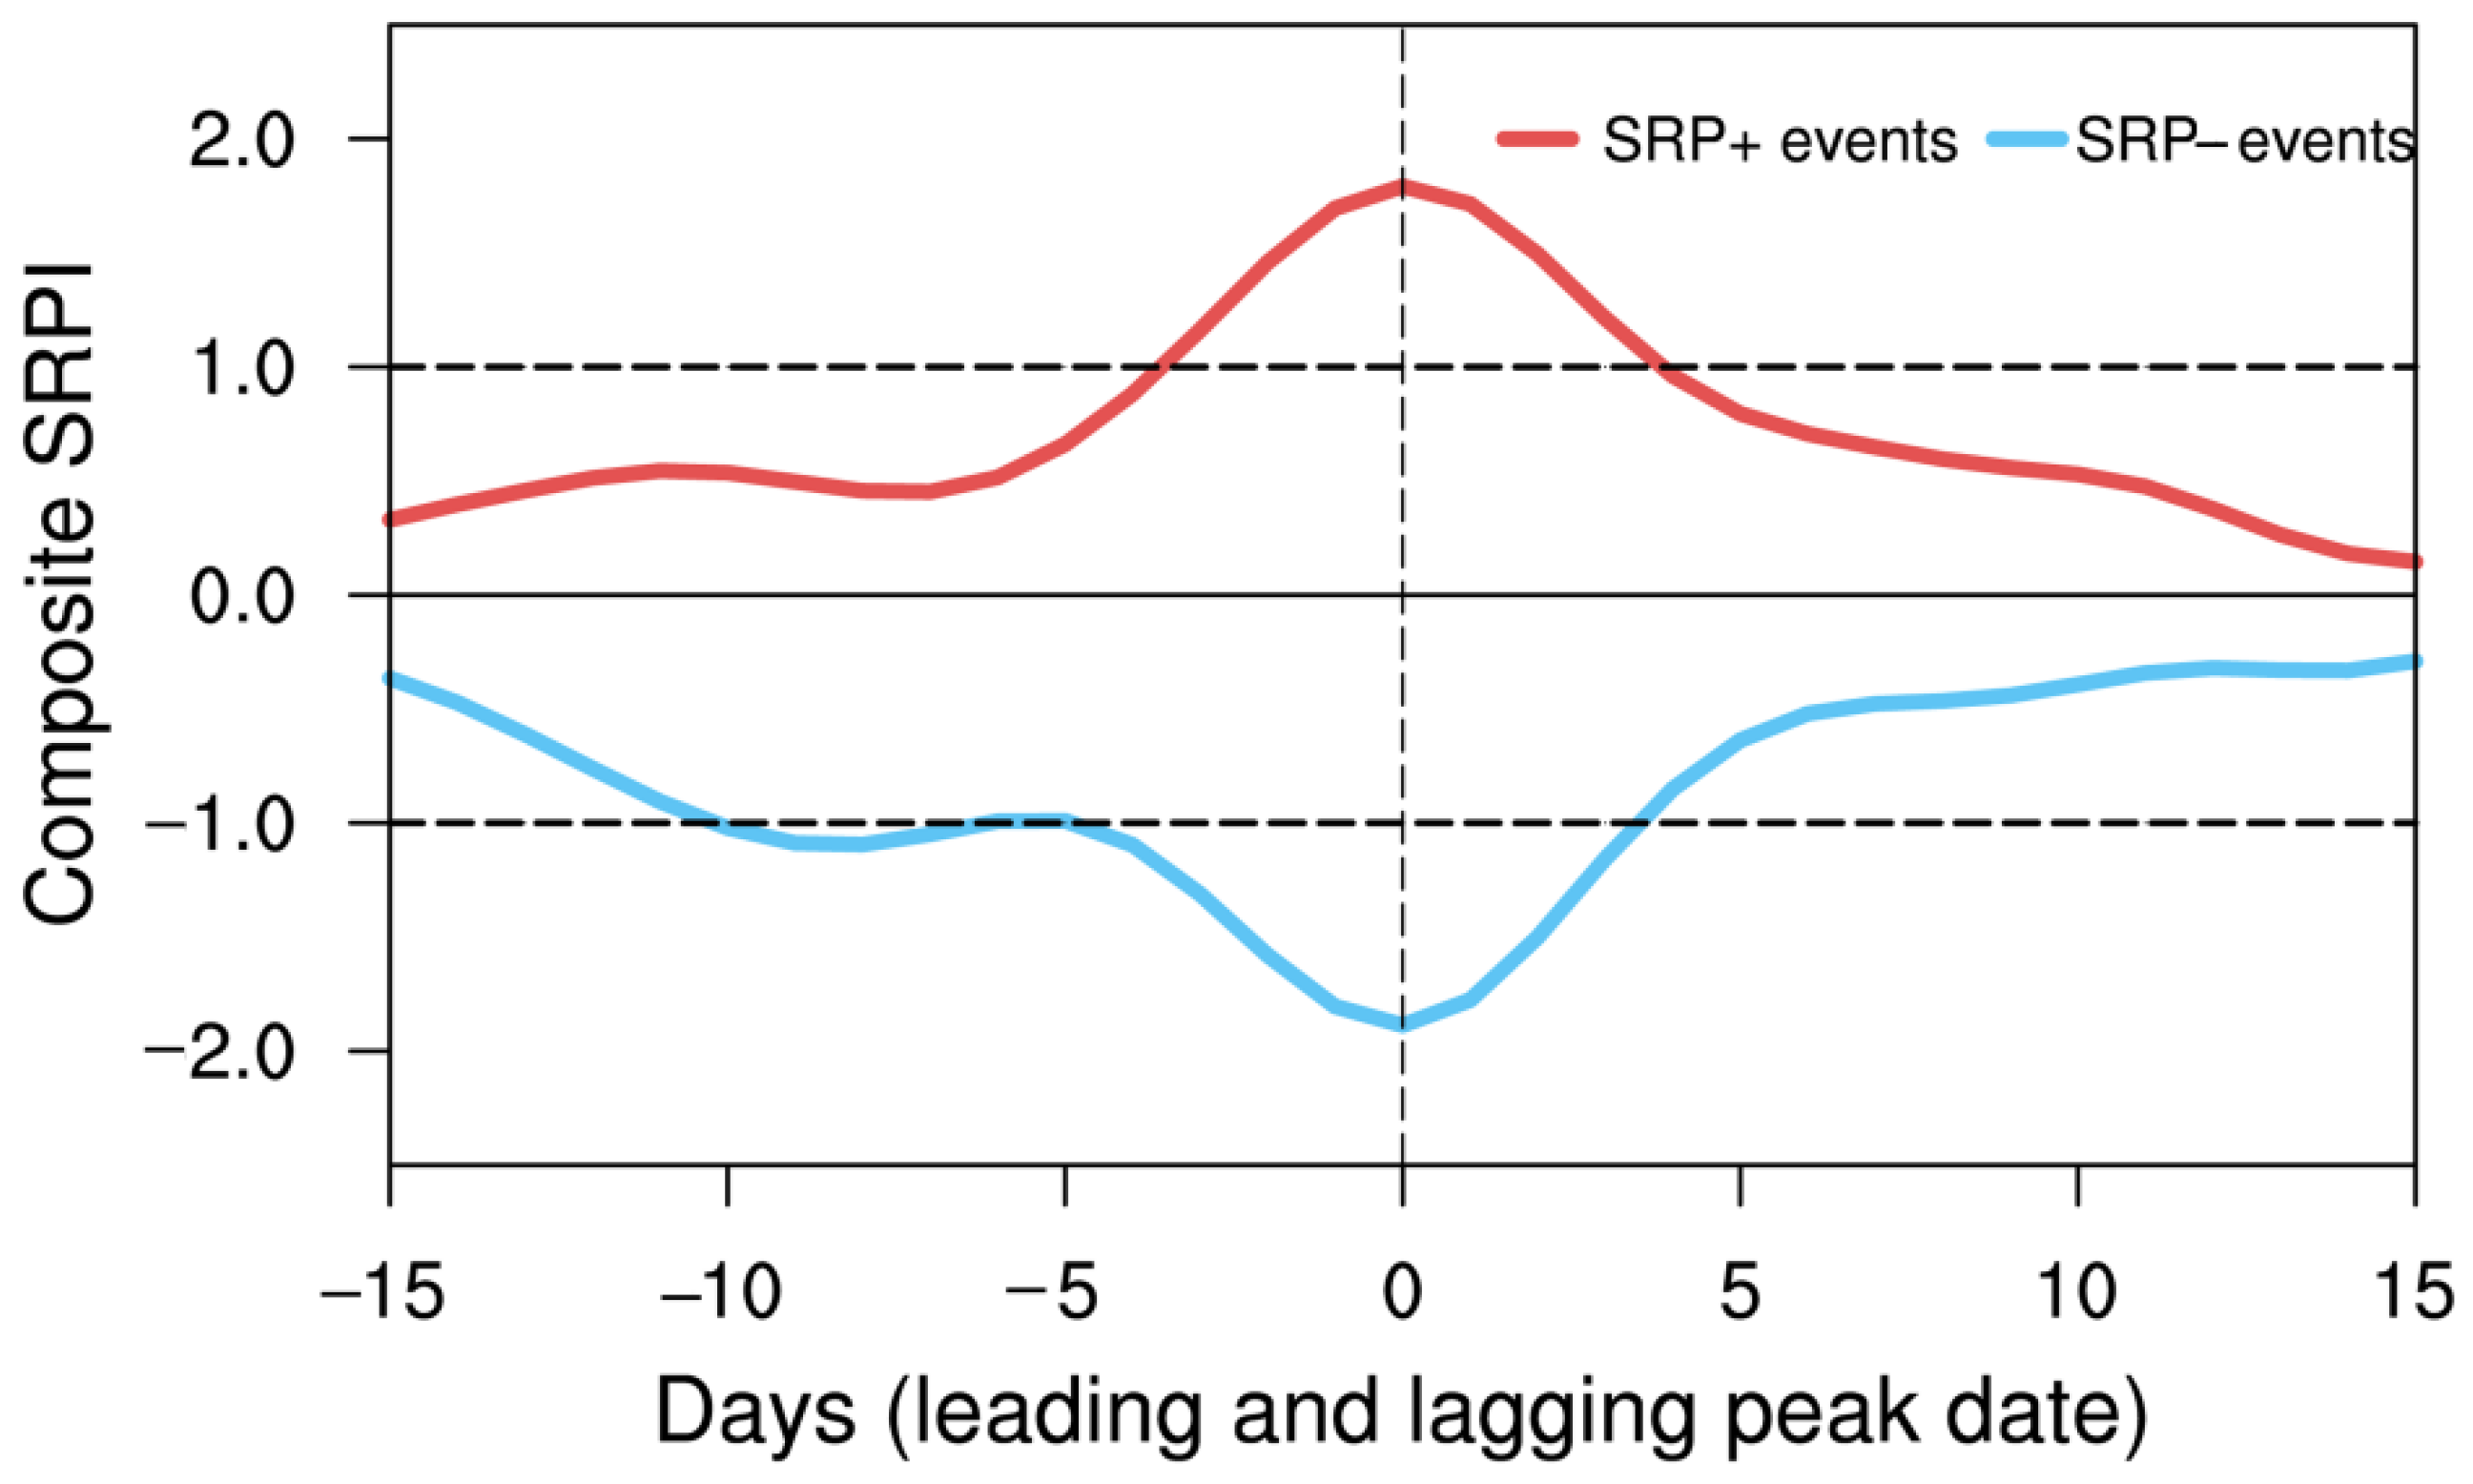
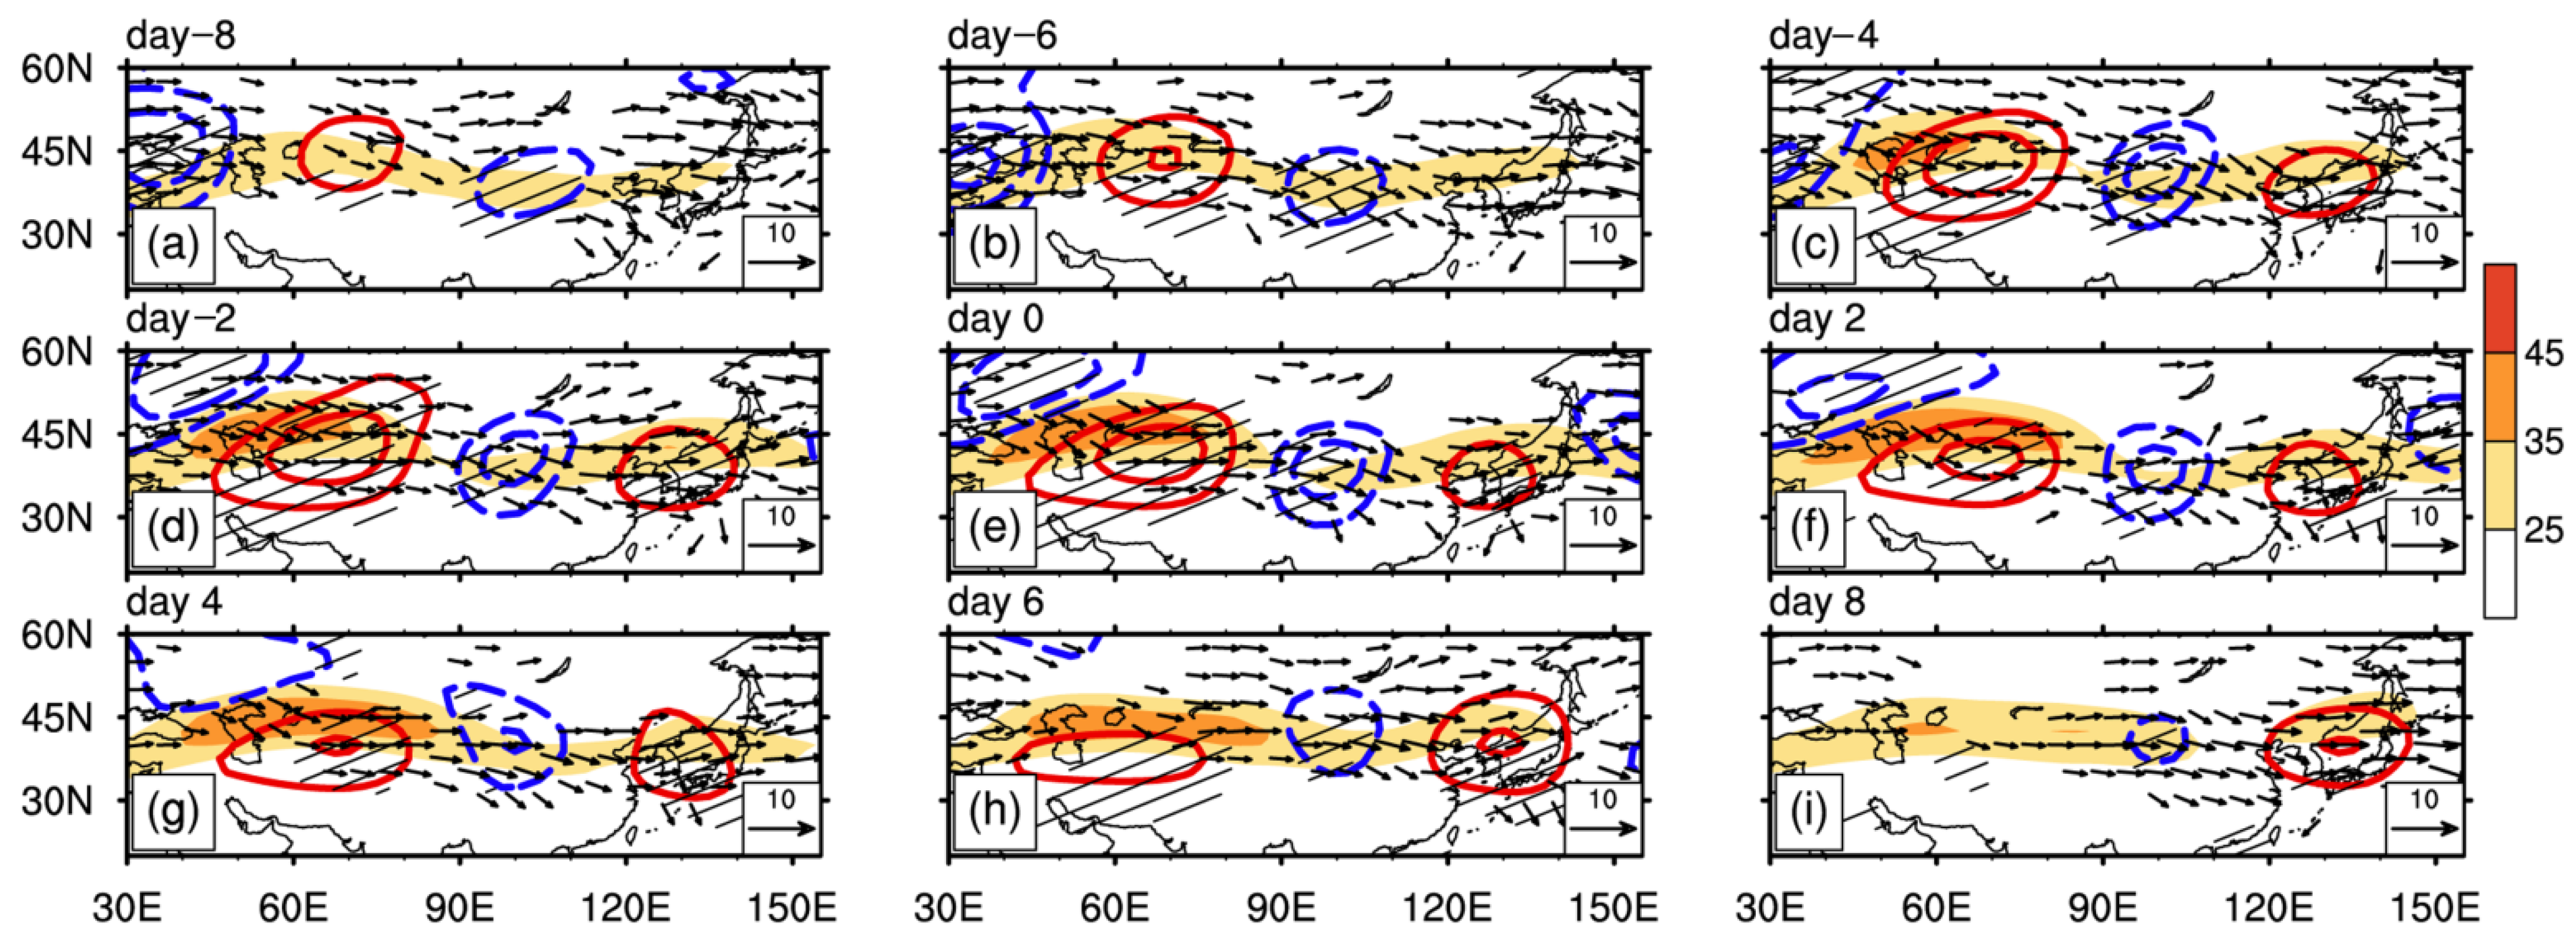
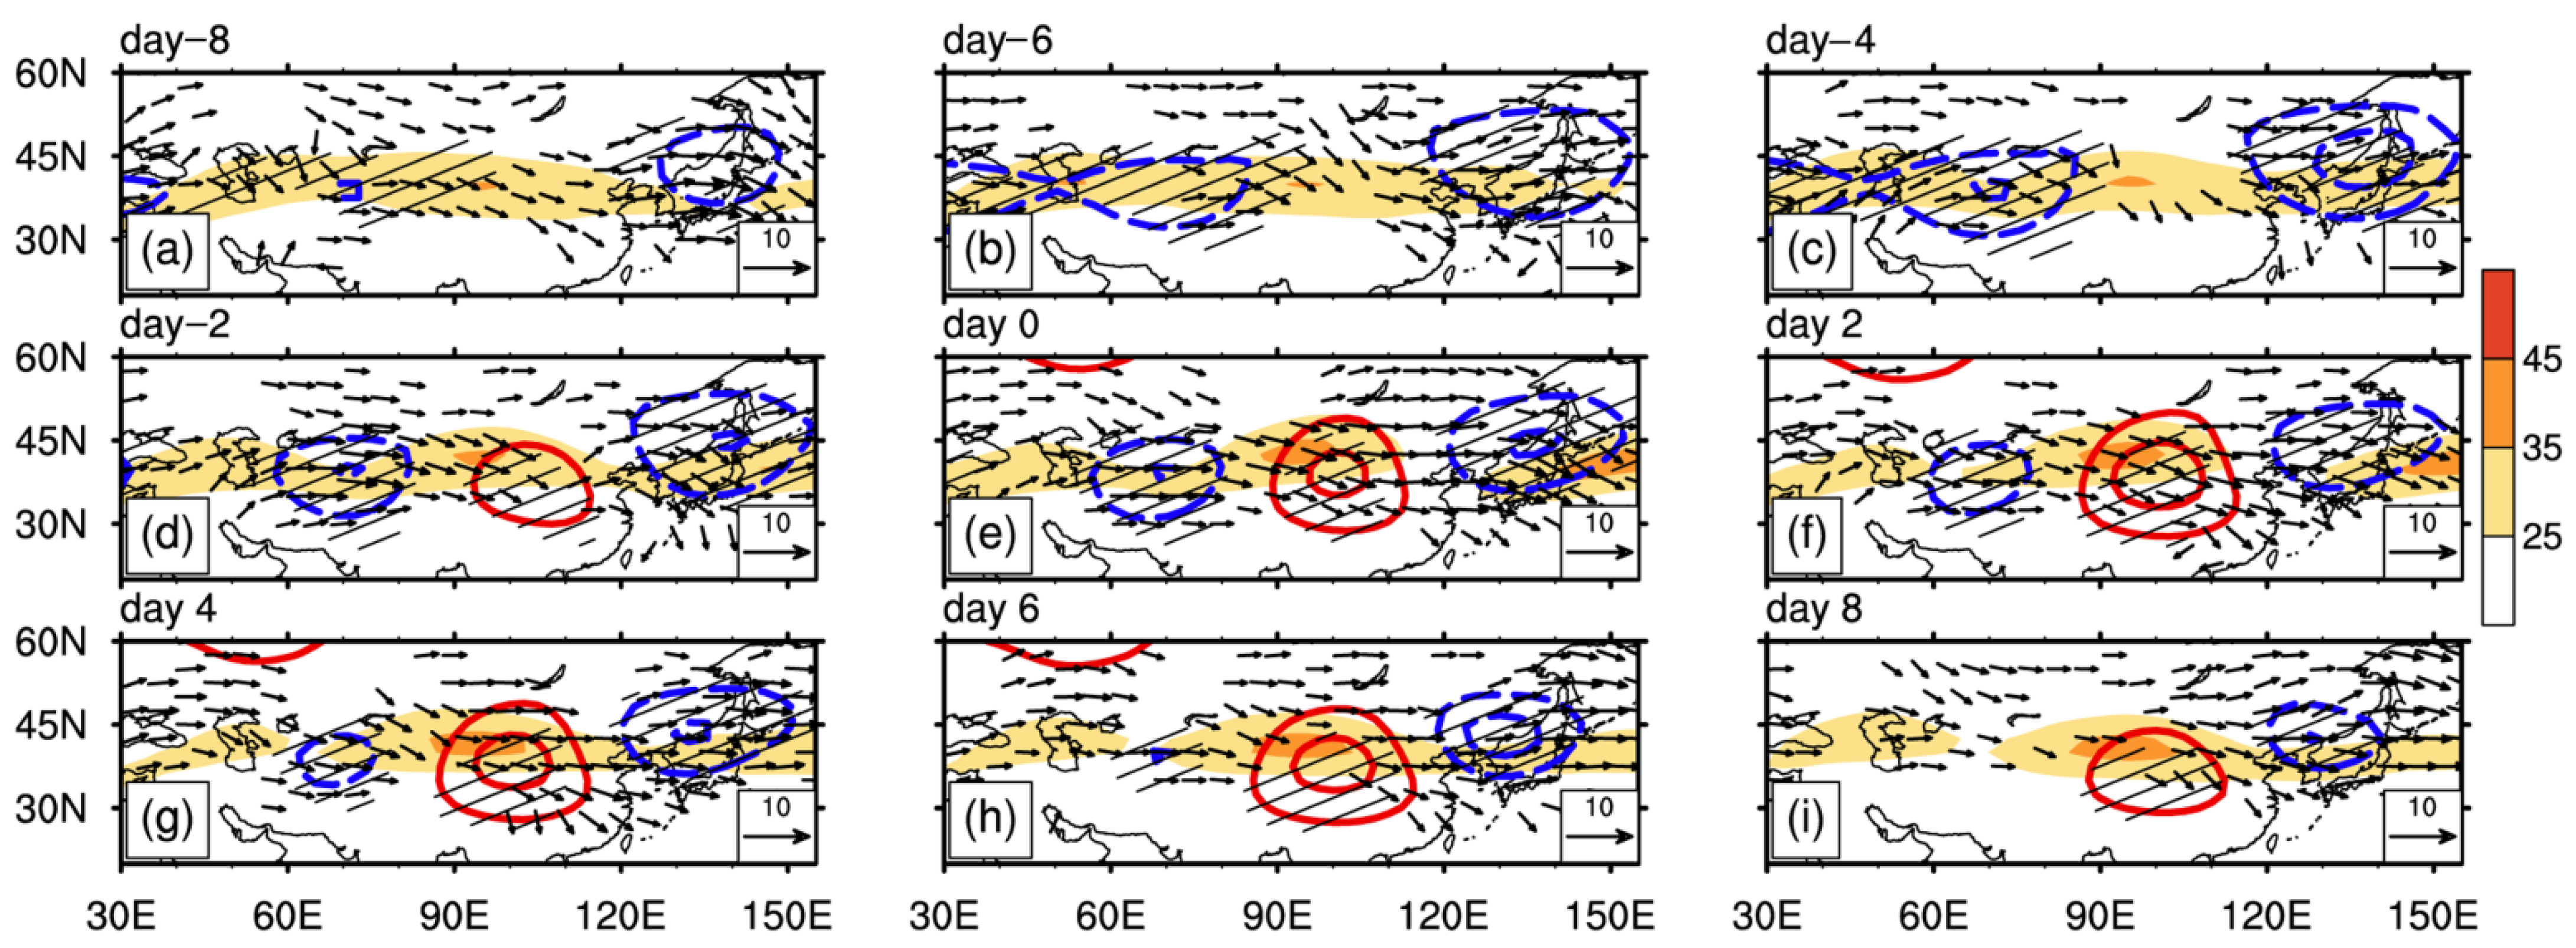
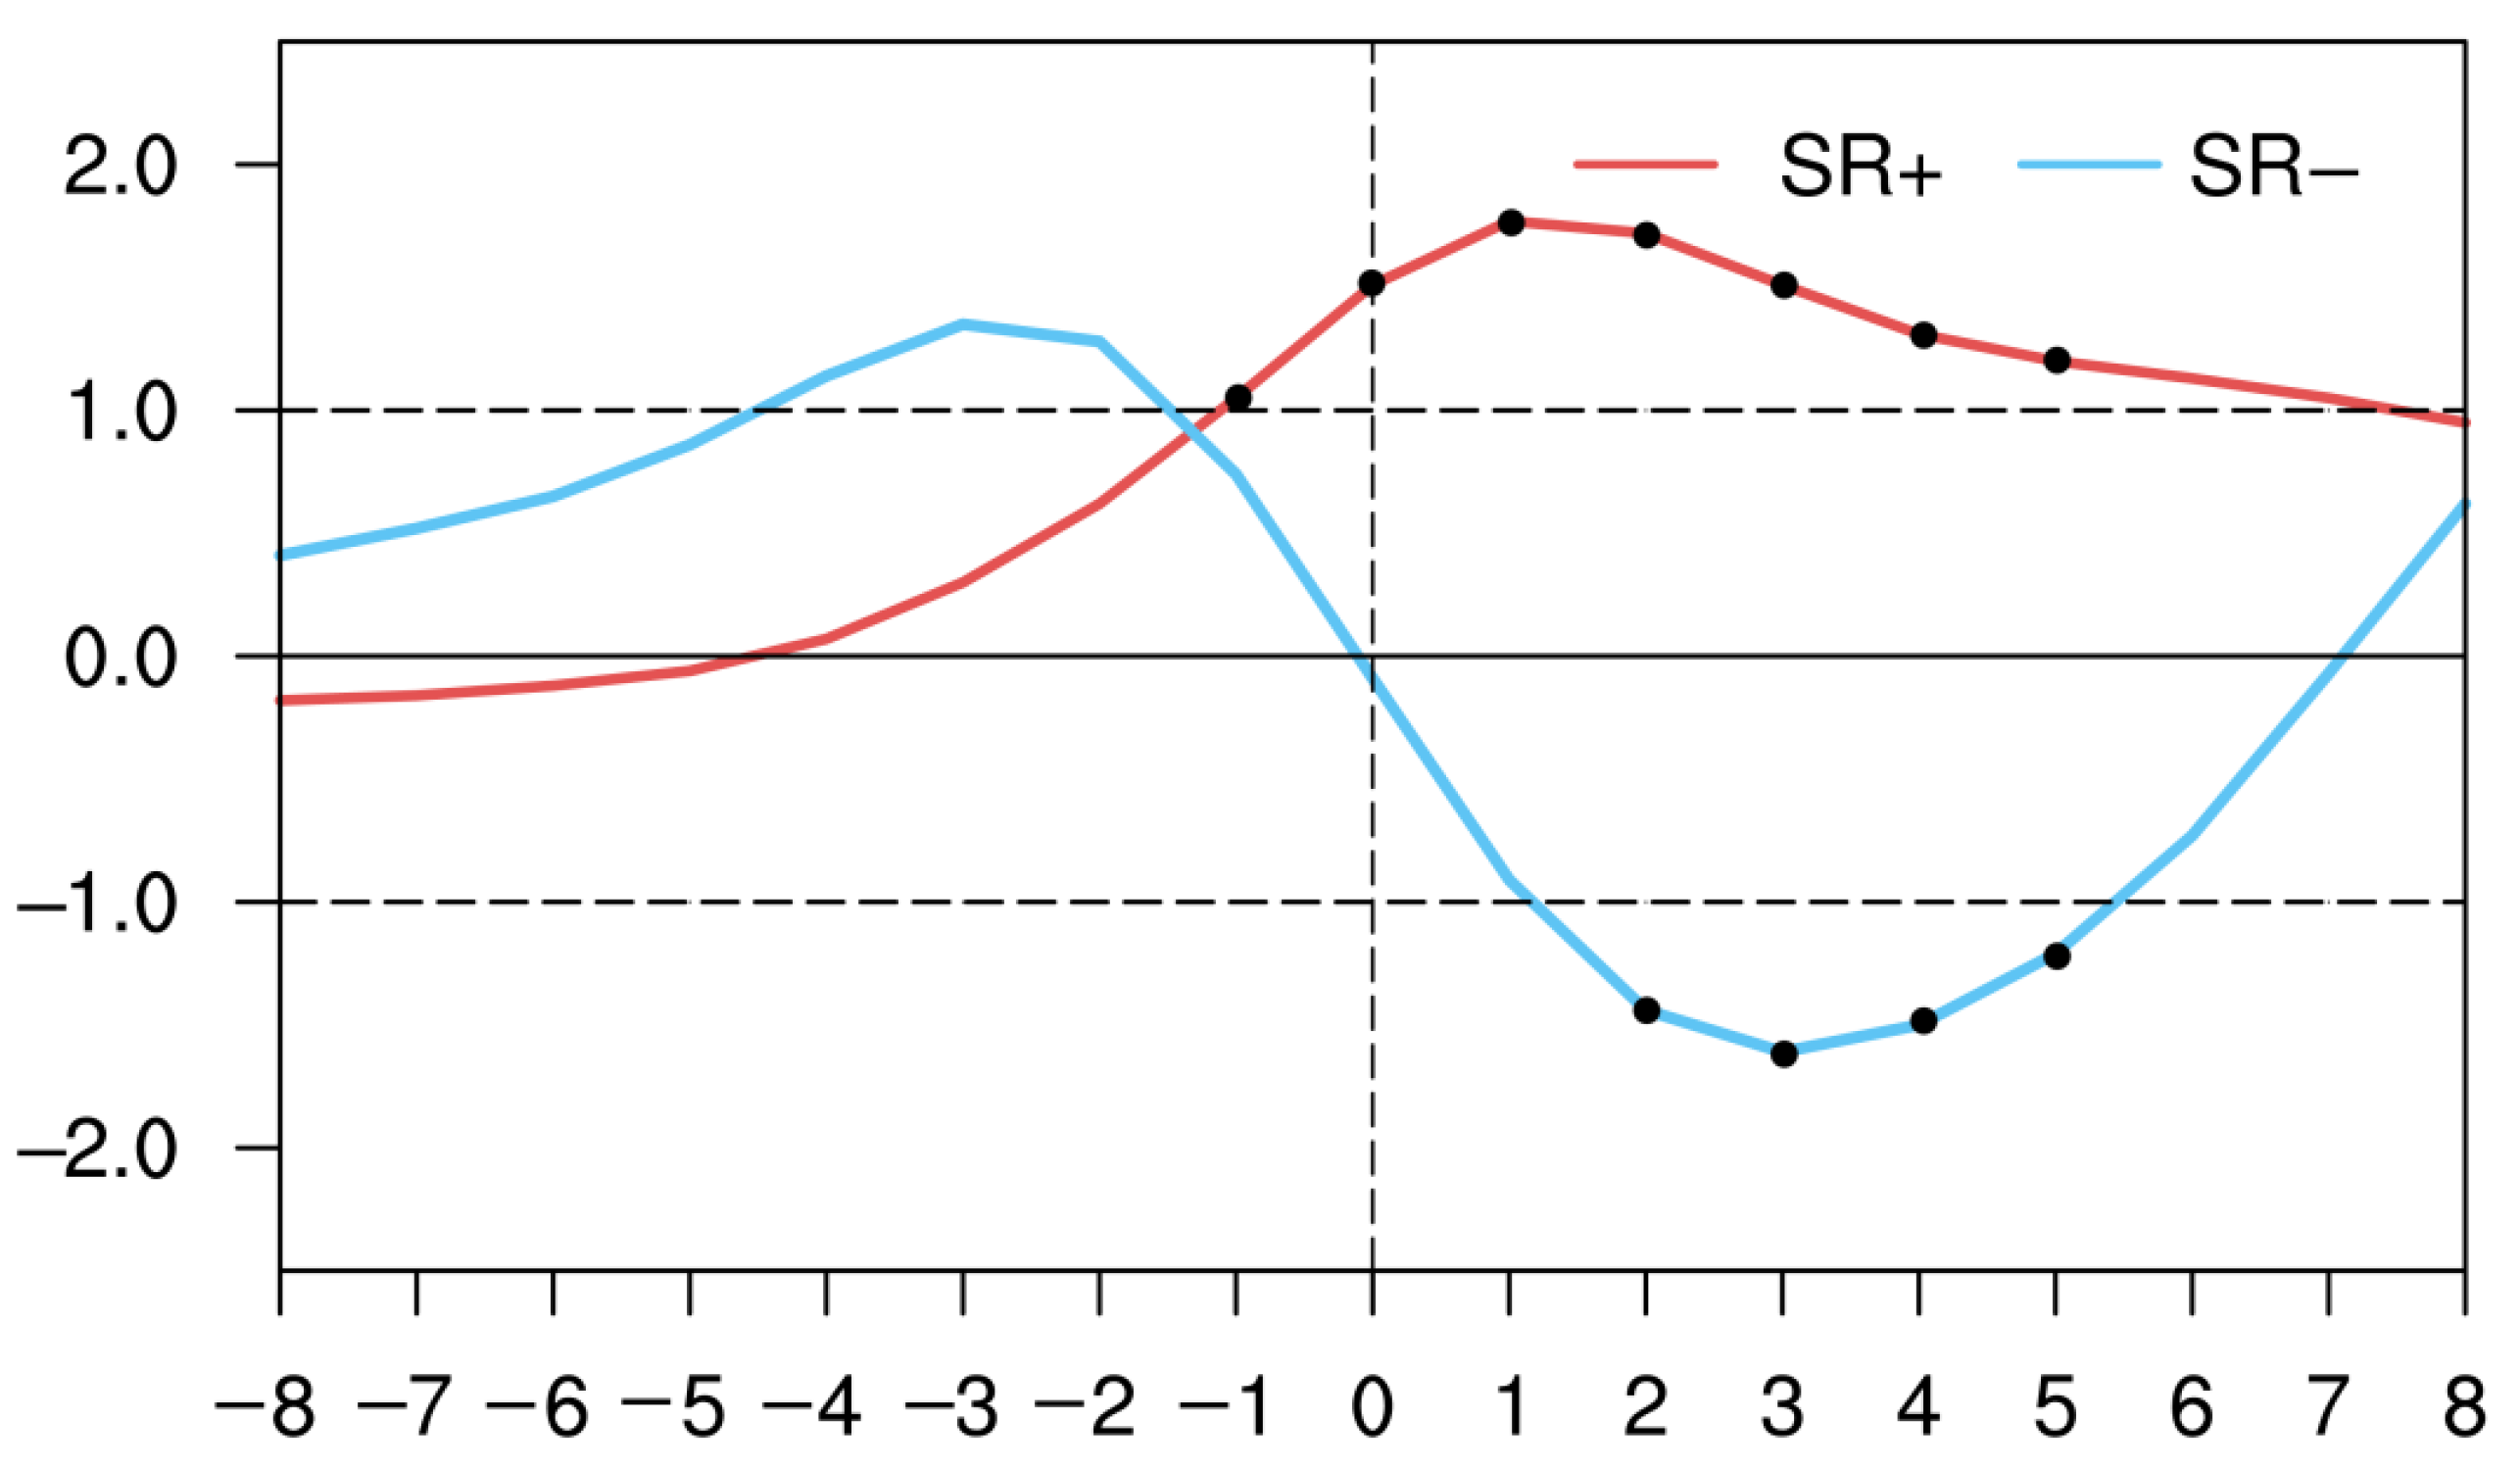
4.1. The Life Cycle of SRP

To analyze the life cycle of SRP, the composite SRPI indices are displayed in Figure 2. The peak date (day 0) represents the day when the SRPI reaches its maximal value and exceeds +1.0 σ. Positive and negative values of SRPI represent positive and negative phases of SRP respectively, and their absolute values represents the intensity of SRP.
As shown in Figure 2, the amplitude of SRP+ begins to rise rapidly from day −5 onward, experiencing considerable growth in the following 5 days. The SRP+ index exceeds the normal value by +1.0 σ approximately at day −3. By day 0, the SRP+ index attains maximal value, reaching its peak state, with a gradual decline of its intensity after that. The composites of SRP+ and SRP− indices show opposite structure. The SRPI index exceeds the normal value by −1.0 σ approximately at day −10, which is much earlier than that of SRP+. From day −5 onward, the SRI decreases rapidly, and reaches its minimal value on the peak date, and then increases gradually. Moreover, it is also found that the life cycles of both daily-scale SRP+ and SRP− can persist for more than 15 days.
Figure 3 shows the evolutions of the composite geopotential height anomalies field and wave-activity flux (WAF) at 200 hPa during the SRP+ events (day −8 to day 8). Prior to the peak date of SRP+ events, the positive height anomaly center over the West Central Asia and the negative height anomaly center over the Mongolia develop firstly and simultaneously form day −8 onward (Figure 3a), further strengthening in the following 4 days, with pronounced WAF emanating from the West Central Asia center. Meanwhile, the WAF disperses eastward along the Asian jet, stimulating the gradual emergence of the positive height anomaly center over the Far East. These three anomaly centers of SRP+ are consistent with the three basic points of the Silk Road pattern in the first EOF mode (Figure 1). By approximately day 2, the well-organized zonal tripole structure of daily-scale SRP+ completely forms at 200 hPa (Figure 3d). On the peak date, the SRPI index attains its maximal value, the intensity of the positive West Central Asia center and the negative Mongolia center significantly increases, indicating the formation of well-established SRP+, with three significant action centers over the West Central Asia, Mongolia, and Far East (Figure 3e) [7]. During the developing stage, an anomalous strong negative height anomaly center tended to be anchored to the west of the Ural Mountains at high latitudes for several days, and its intensity variation characteristics are similar to that of the negative height anomaly center around the Balkhash Lake, which is consistent with the conclusion of that the SRP is a pronounced circumglobal teleconnection pattern along the summertime Asian jet stream [22,39]. During the decaying period (approximately after day 2), with the dissipation of the upstream WAF, the intensities of West Central Asia and Mongolia centers decrease gradually and disappear one after another, which represents the vanishing of the zonal wave train structure of SRP+ (Figure 3i). In the meanwhile, the positive anomaly center over the Far East maintains its strength for a longer period without decline, even until the SRP turns to its negative phase, which is under the influence of the sustaining eastward wave energy propagation from the Mongolia to the East Asian coast.
This study also examines the composite 200 hPa geopotential height anomalies and WAF of SRP− events. It is evident that both positive and negative phases of SRP have similar and fixed positions of the three anomaly centers; however, the temporal evolution characteristics are different from those of the SRP+. As illustrated in Figure 4, the SRP− events start with a negative geopotential height anomaly center located over the Far East from day −8 onward, experiencing considerable growth during the subsequent 4 days (Figure 4a). In the meanwhile, the negative height anomaly center over the West Central Asia emerges, with a rapid growth in the strength from day −6 to day −4. The positive height anomaly center over Mongolia begins to develop from day −2 onward and then intensifies significantly, indicating the onset of SRP− events. During the peak stage, the well-organized SRP− is characterized by a zonal ‘− + −’ wave train structure, with a maximal amplitude at day 0, with more pronounced WAF emanating from the Caspian Sea regions along this zonal wave train. In the decaying period, the SRP− weakens firstly over the West Central Asia, where the negative anomaly center weaken substantially from day 2 and almost disappeared at day 6, showing a rapid decline compared to other centers. Nevertheless, both the positive anomaly center over Mongolia and the negative anomaly center over the Far East persist for several days with their intensity weakening slightly. In addition, it can be observed that the negative anomaly center over the Far East appears earlier and persists longer than other centers, and the positive anomaly center in Mongolia appears the last but maintain a certain strength for a longer period until the SRP− vanishes.
During the whole life cycle of daily-scale SRP+ and SRP−, the three significant action centers prevail in their fixed positions, with less movement during the development, maintenance, and decaying periods. Thus, the analyses of daily-mean fields show that the Silk Road pattern shows a nature of the quasi-stationary wave train on daily timescales, which is consistent with the previous research conclusions by using monthly-mean data [7,39,40].

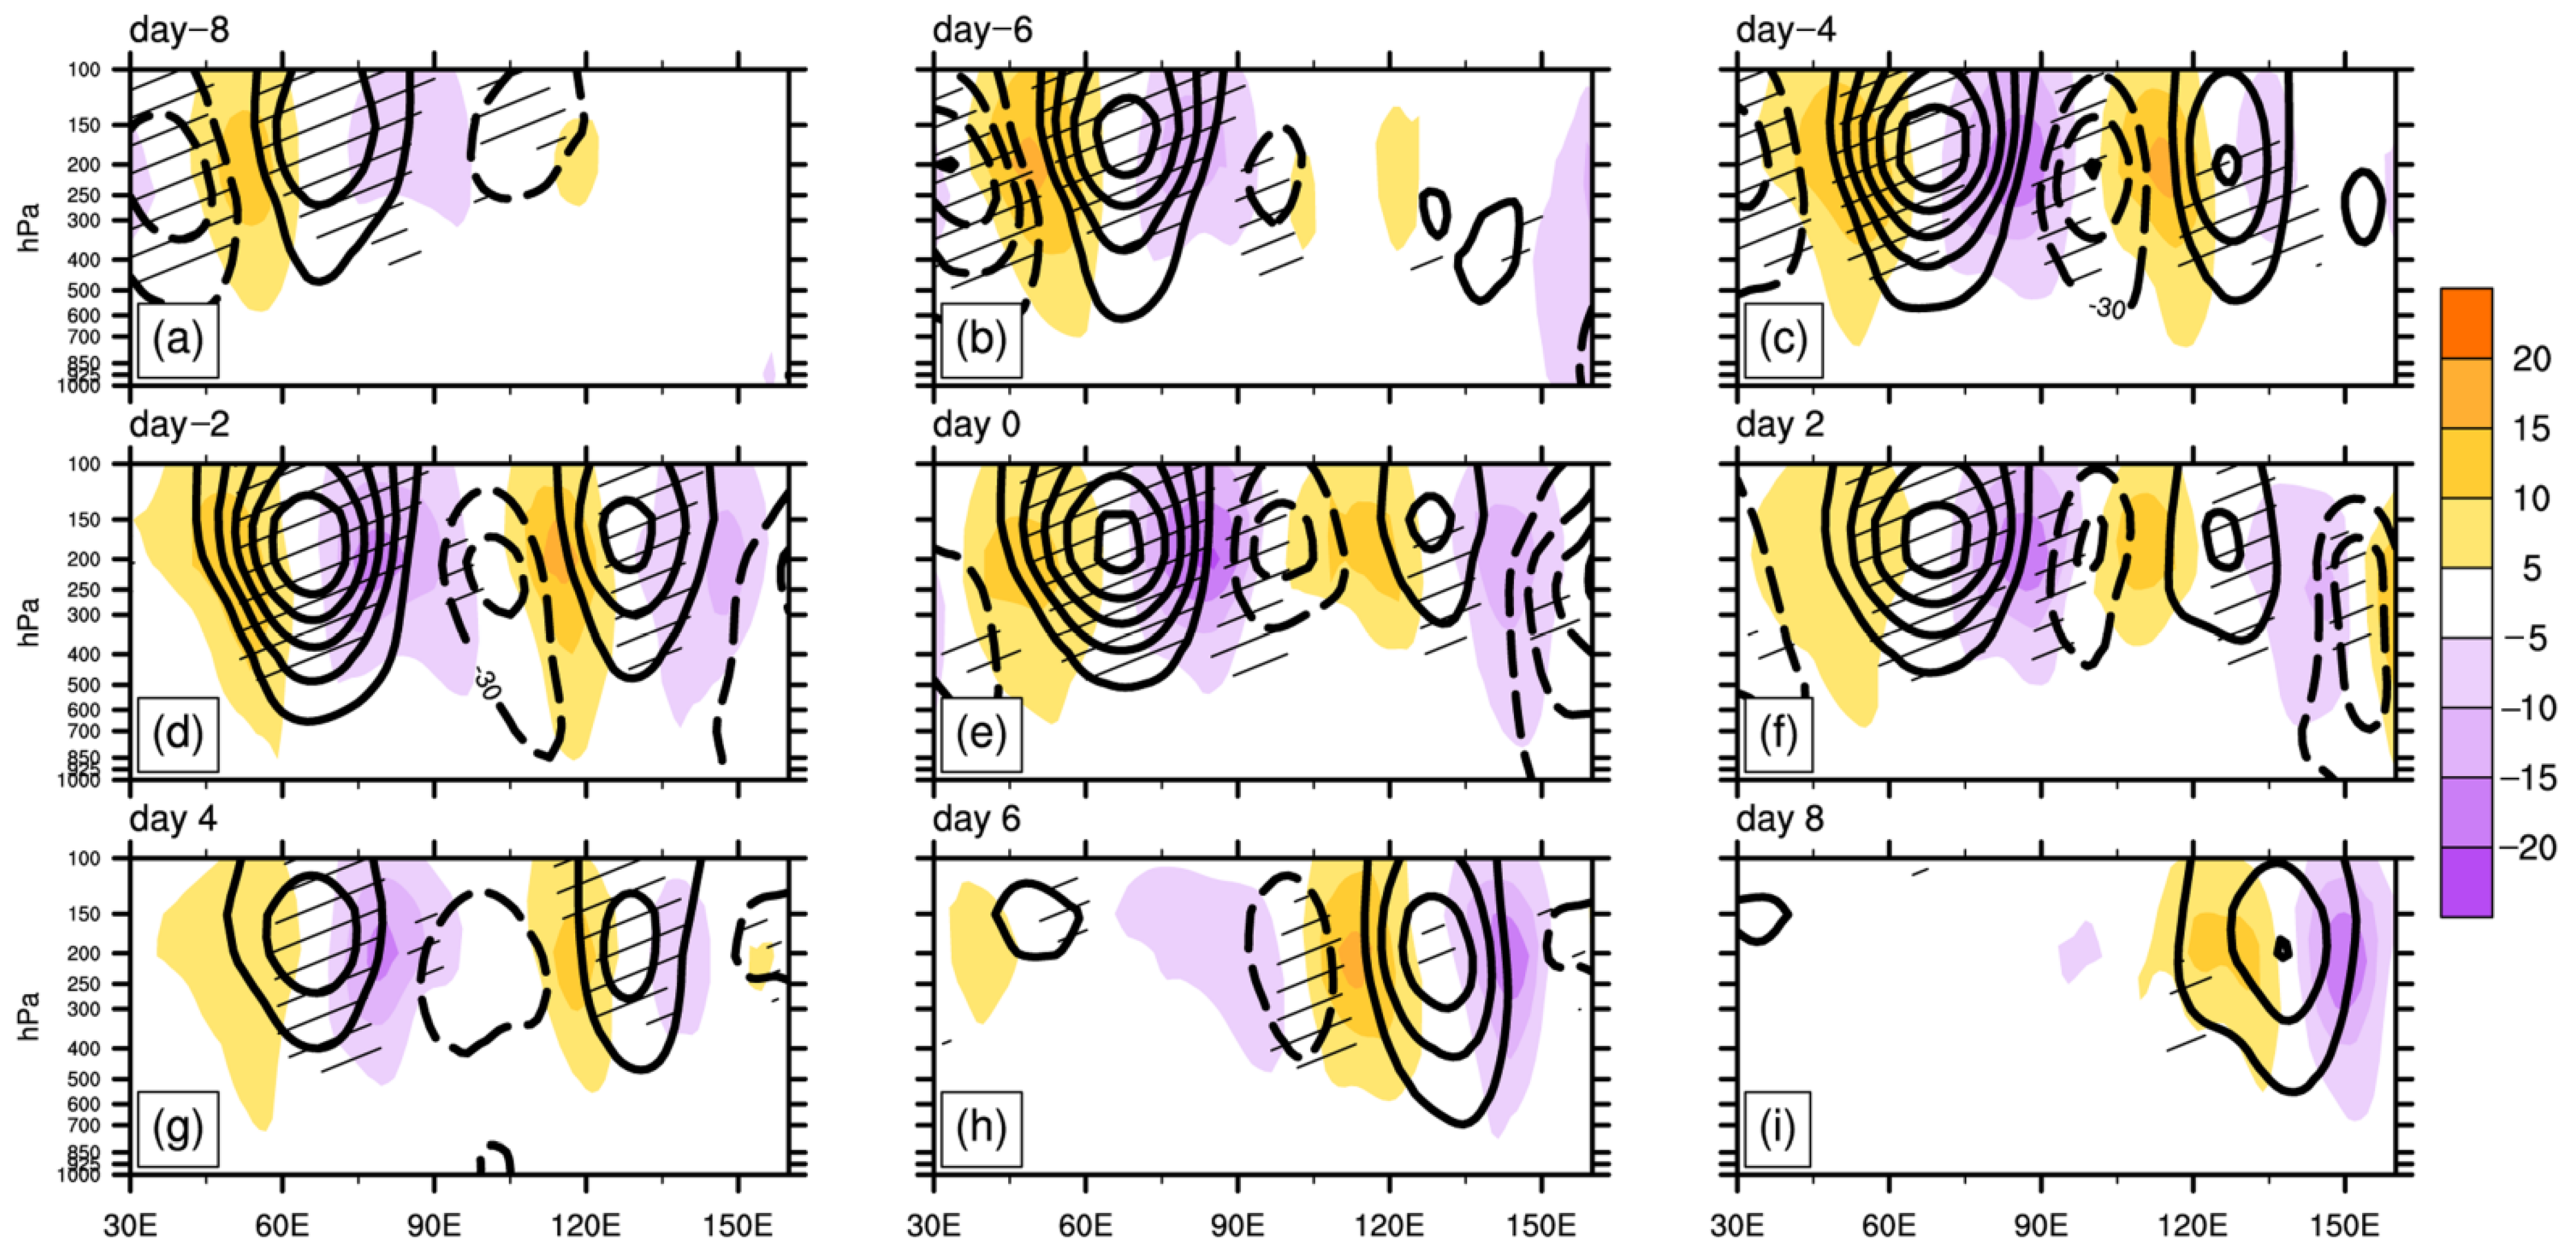
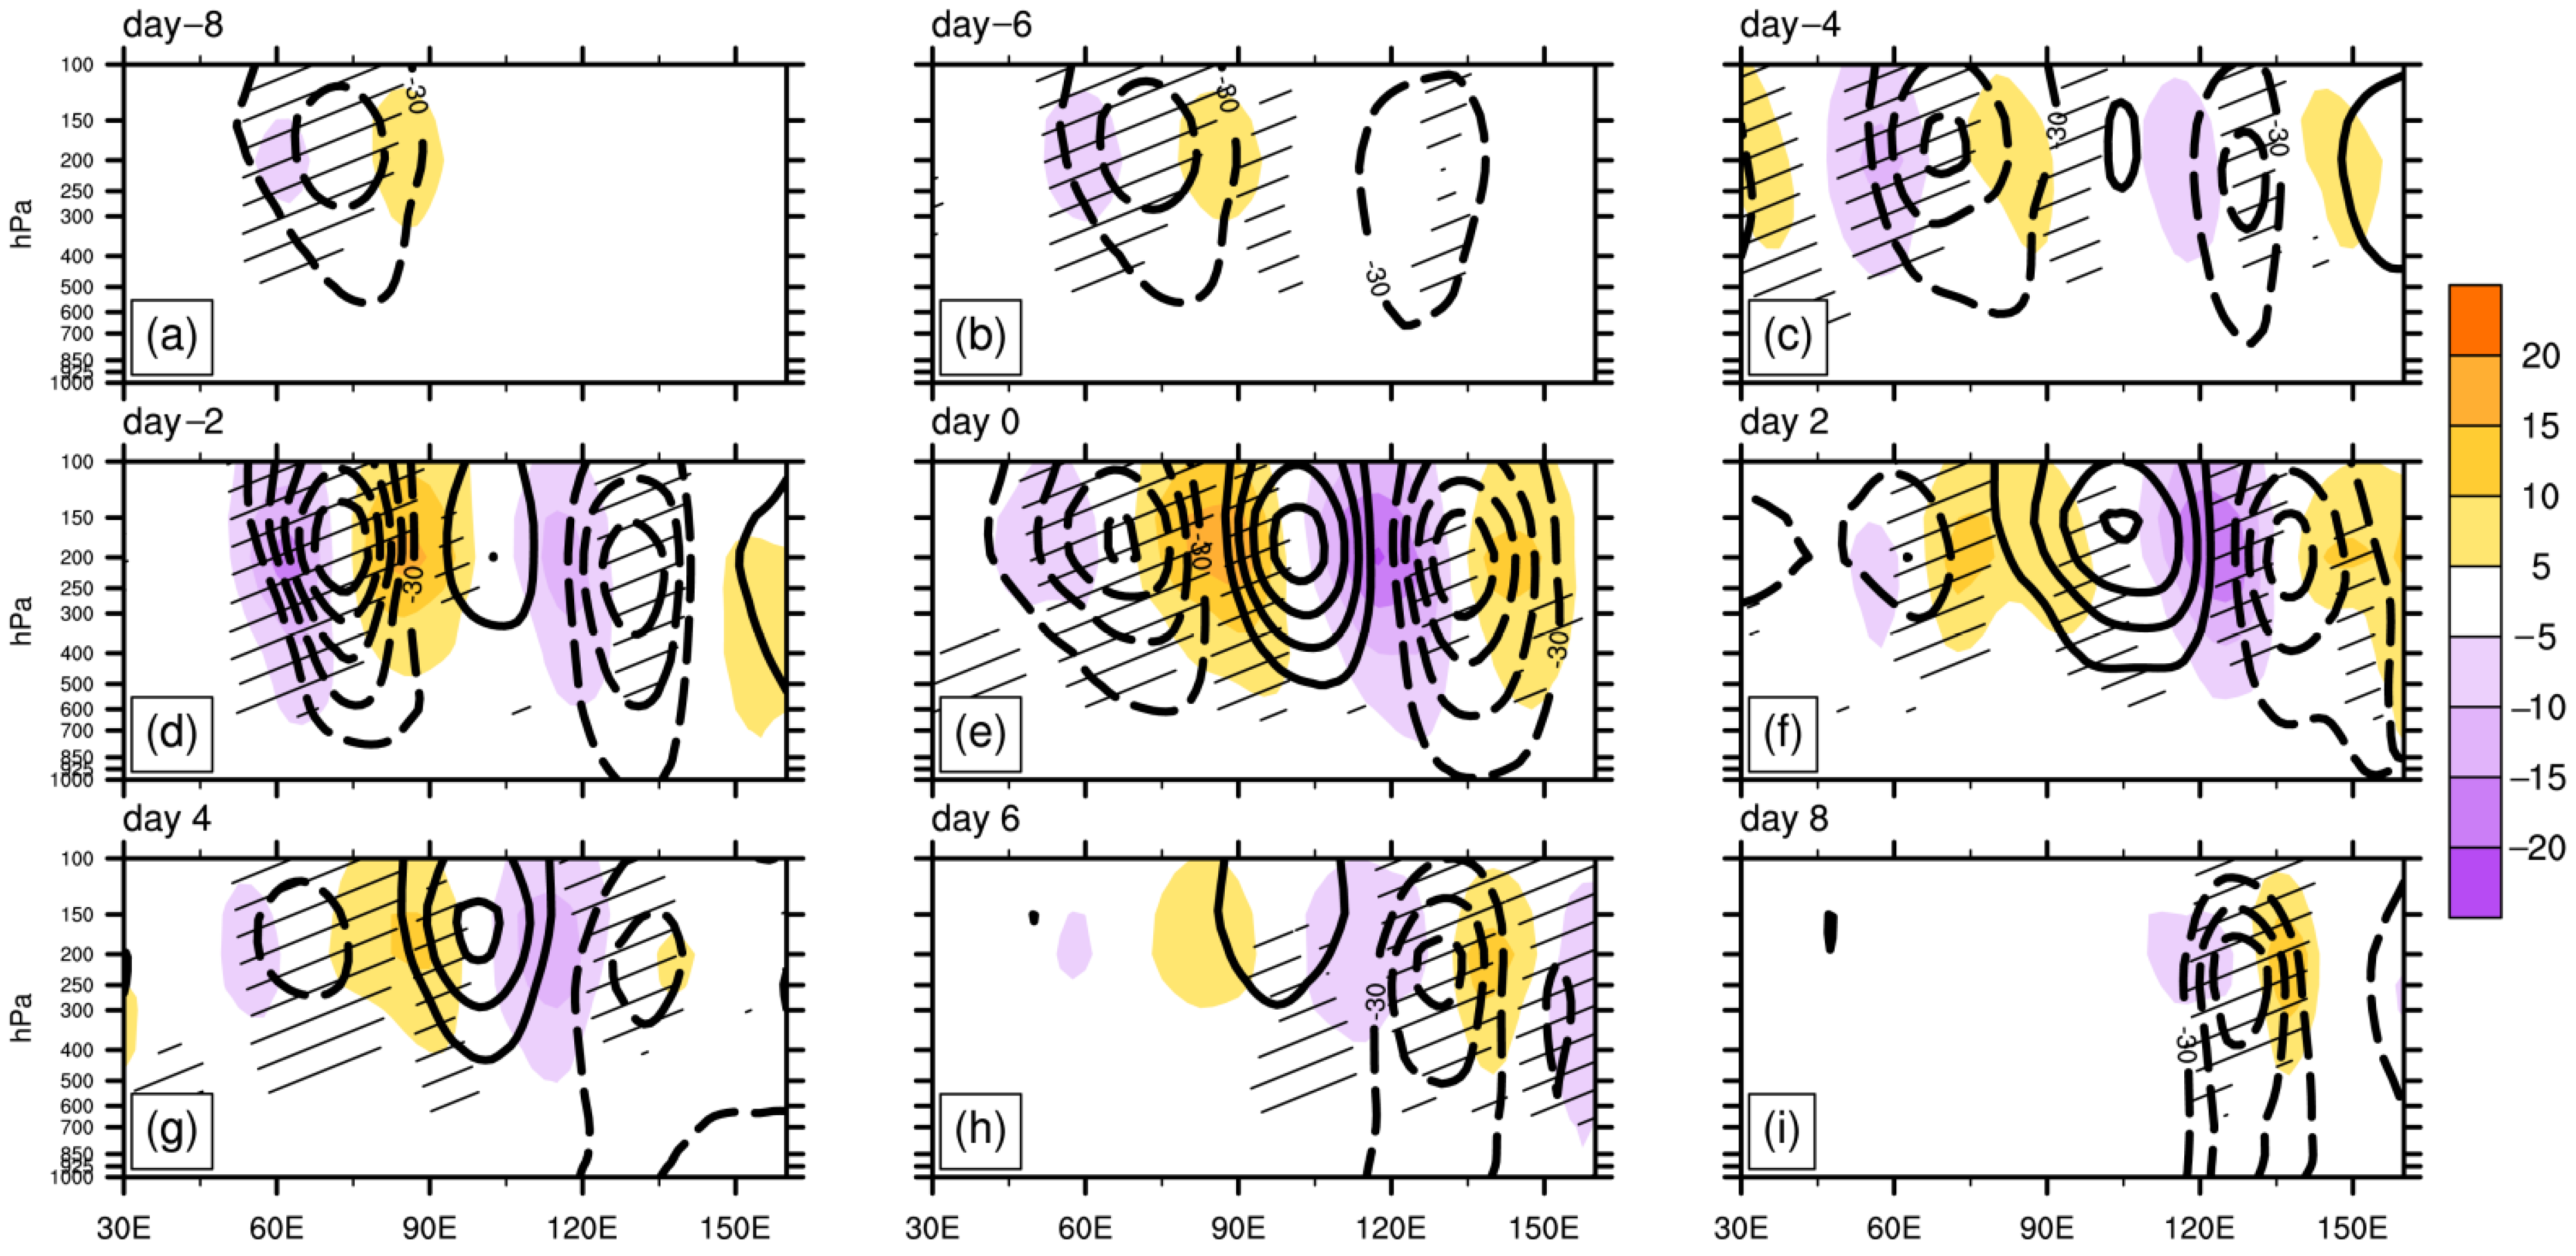
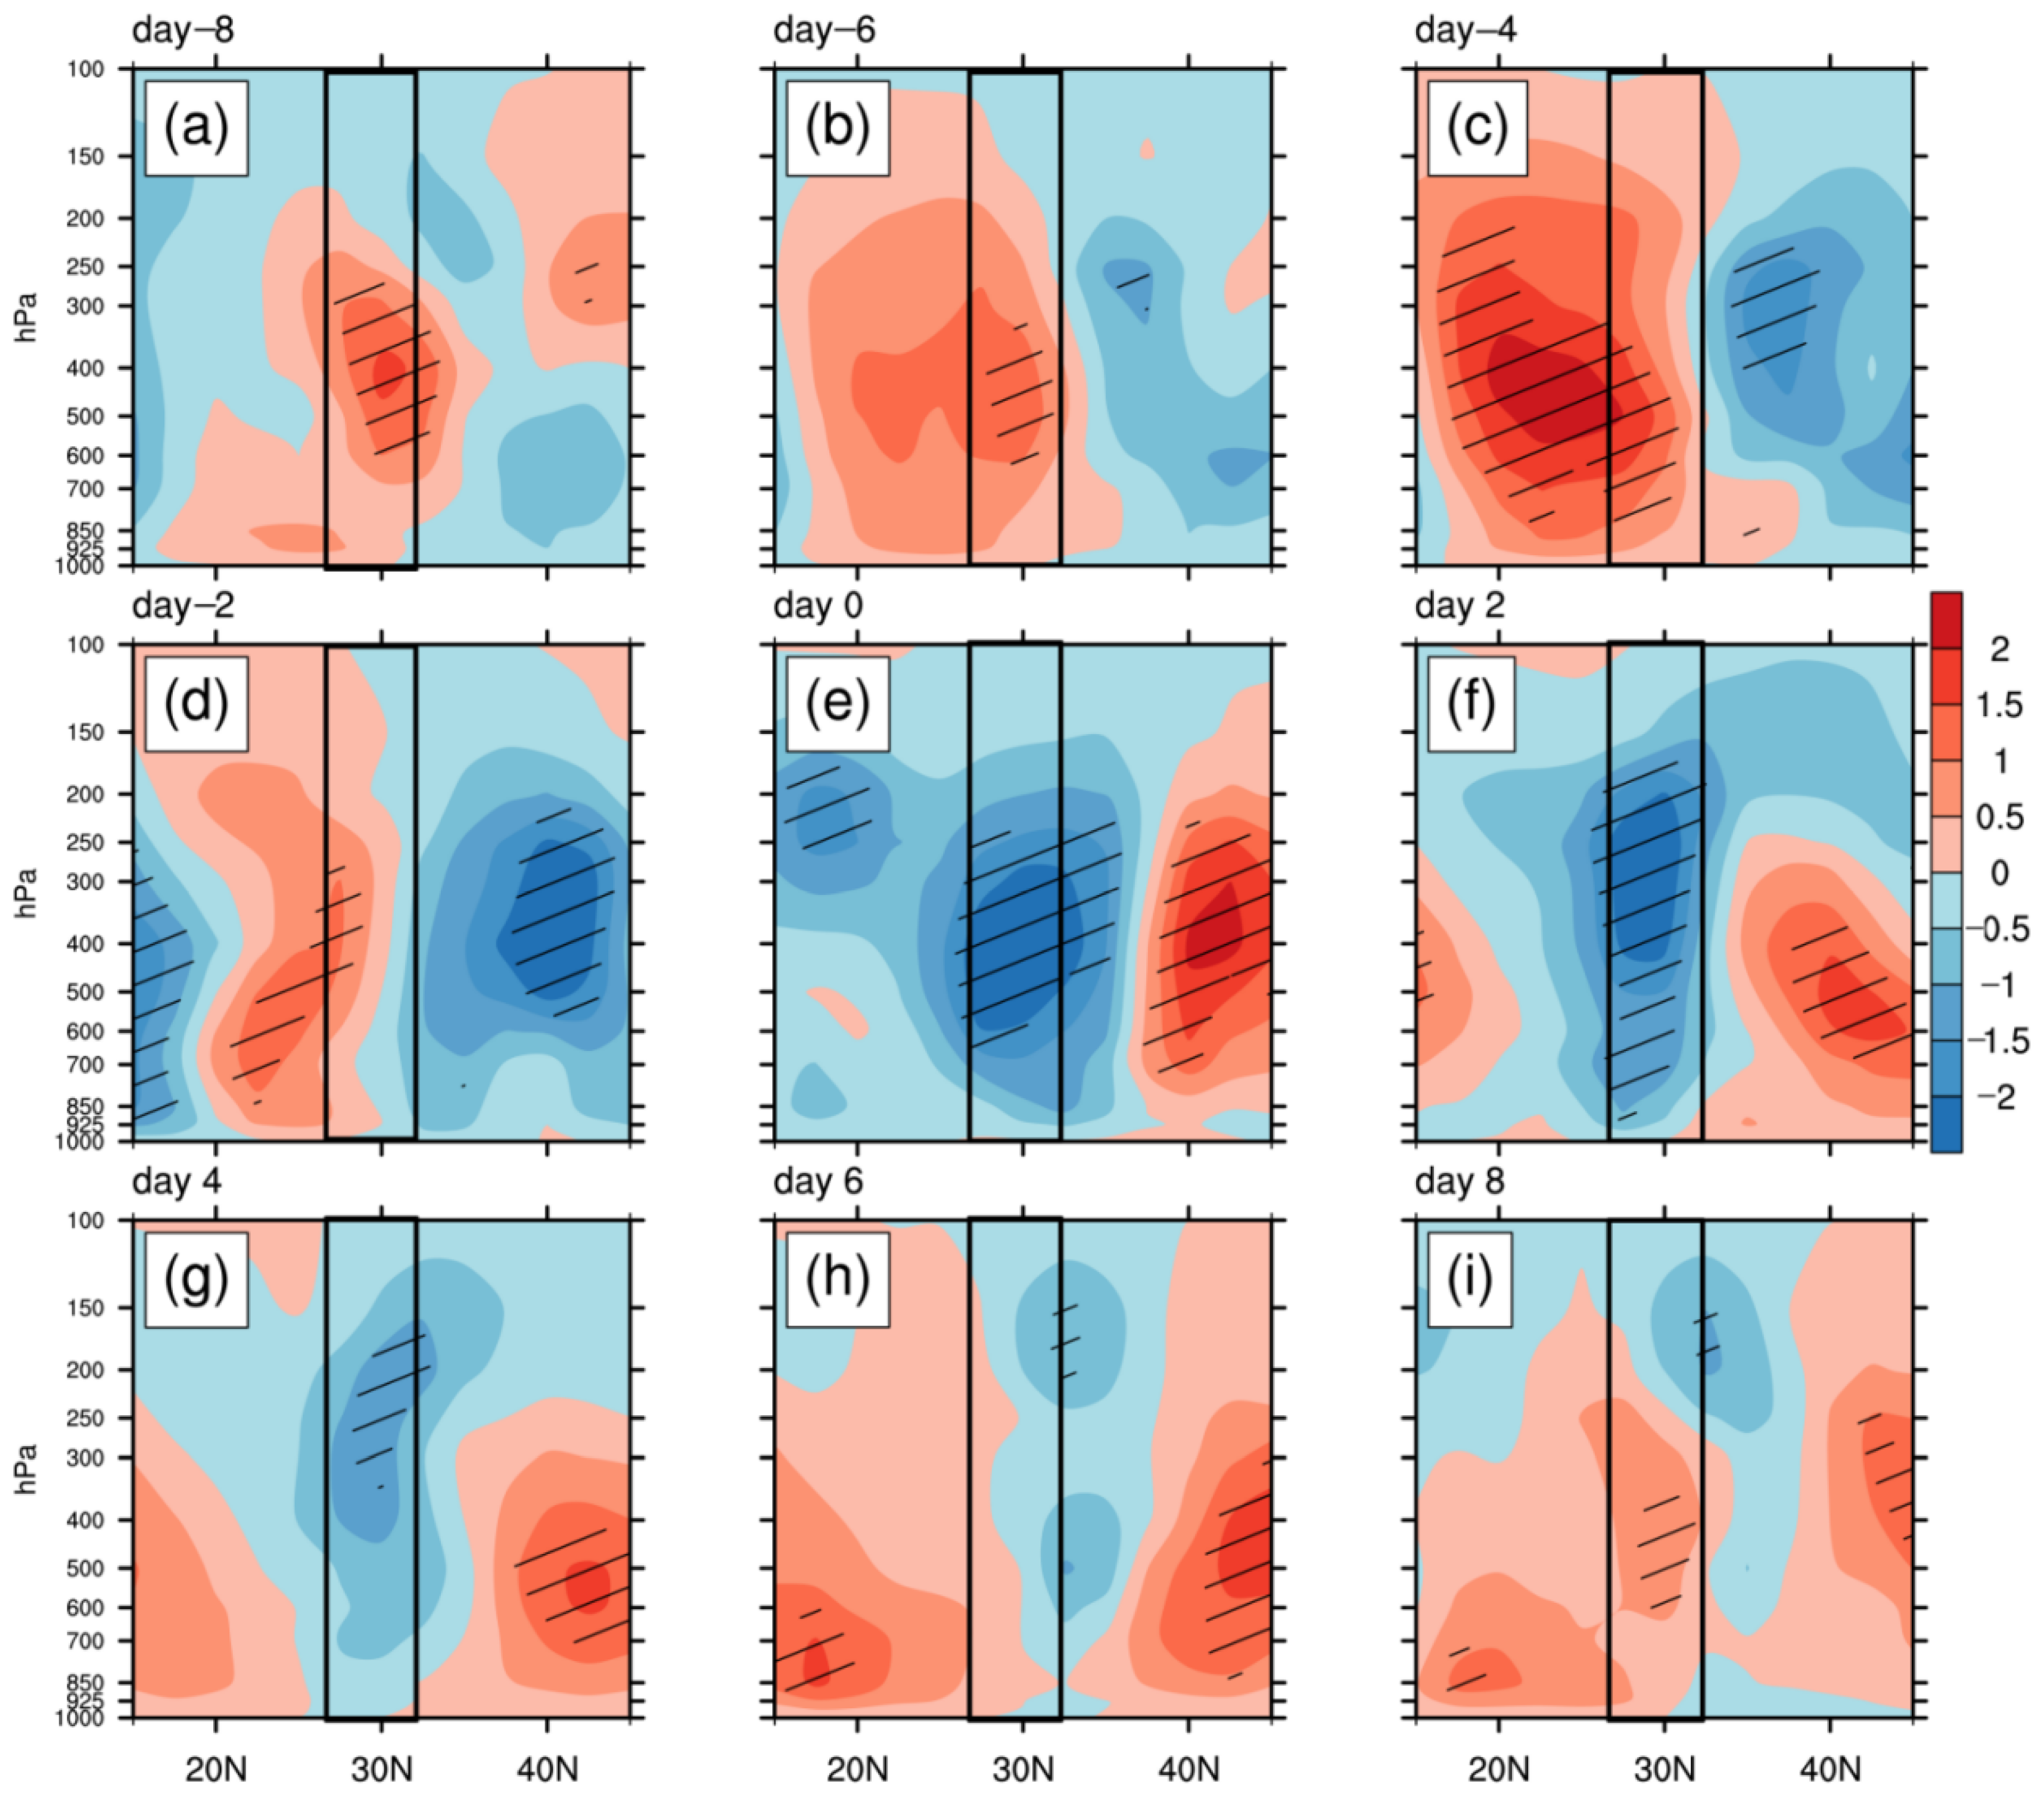
4.2. Vertical Structure of Daily-Scale SRP

To shed light on the evolution of the SRP, their vertical structures of SRP+ and SRP− are also explored in this section.
As mentioned above, the three anomaly centers of the SRP are all located near 40° N, remaining stable during the life cycle. Therefore, Figure 5 and Figure 6 present the longitude-pressure cross-section of geopotential height anomalies along 42.5° N during the life cycle of SRP+ and SRP− events, respectively. It shows that all the maximum anomaly centers of SR pattern appeared in the mid-to-upper troposphere approximately at 200 hPa. About 8 days prior to the peak date of SRP+ events, the upstream West Central Asia positive anomaly center and the Mongolia negative anomaly center emerged firstly, strengthening remarkably during the subsequent 4 days. In particular, the vertical structure of the West Central Asia center can extend from the 600 hPa to the tropopause (Figure 5a–c). Meanwhile, the downstream Far East positive anomaly center develops rapidly (Figure 5c). By day −4, these three anomaly centers generate the well-established zonal tripole structure before SRP+ gets maximal amplitude. The intensities of the West Central Asia and Mongolia anomaly centers reach the highest at day 0 (Figure 5e), weakening rapidly after the peak date. The positive Far East anomaly center exhibit a tendency of continuous enhancement, which is consistent with the variation characteristics of the SRP+ described in Figure 3.
The variation characteristics of the vertical structure during SRP− events are similar to that of SRP+ events (Figure 6). The maximums of three anomaly centers emerge at the height of 200 hPa, with an equivalent barotropic structure in vertical direction, which were obtained by comparing lower and upper troposphere circulation anomaly fields. The most significant distinction of evolution features between the SRP+ and SRP− lies in the variation characteristics of the Mongolia and Far East anomaly centers. Concretely, prior to the onset of SRP− events, the Mongolia positive anomaly center begins to emerge gradually from day −4, with a vertical structure extending to the height of 400 hPa (Figure 6c). The vertical structure of the Far East negative anomaly center can occupy the whole troposphere, with a stronger strength and longer duration than that of the West Central Asia negative anomaly center, which is consistent with the results obtained in Figure 4.
Additionally, in the vertical direction, the three anomaly centers of SRP almost exhibit barotropic structures. However, during the development stage, the nascent Mongolia negative anomaly center of SRP+ and the West Central Asia negative anomaly center of SRP− tilt a little westward with height, which shows a baroclinic vertical structure (Figure 5d). As documented in [40,41] that the barotropic instability and baroclinicity could extract the kinetic energy (KE) and available potential energy (APE), respectively, from the basic state, maintaining the development of the Rossby wave train pattern. Thus, the early development of SRP may be attributed to the baroclinicity, and the barotropic instability processes play a significant role in the maintenance of these three anomaly centers.

5. Temperature Anomalies in the YRV Related to SRP

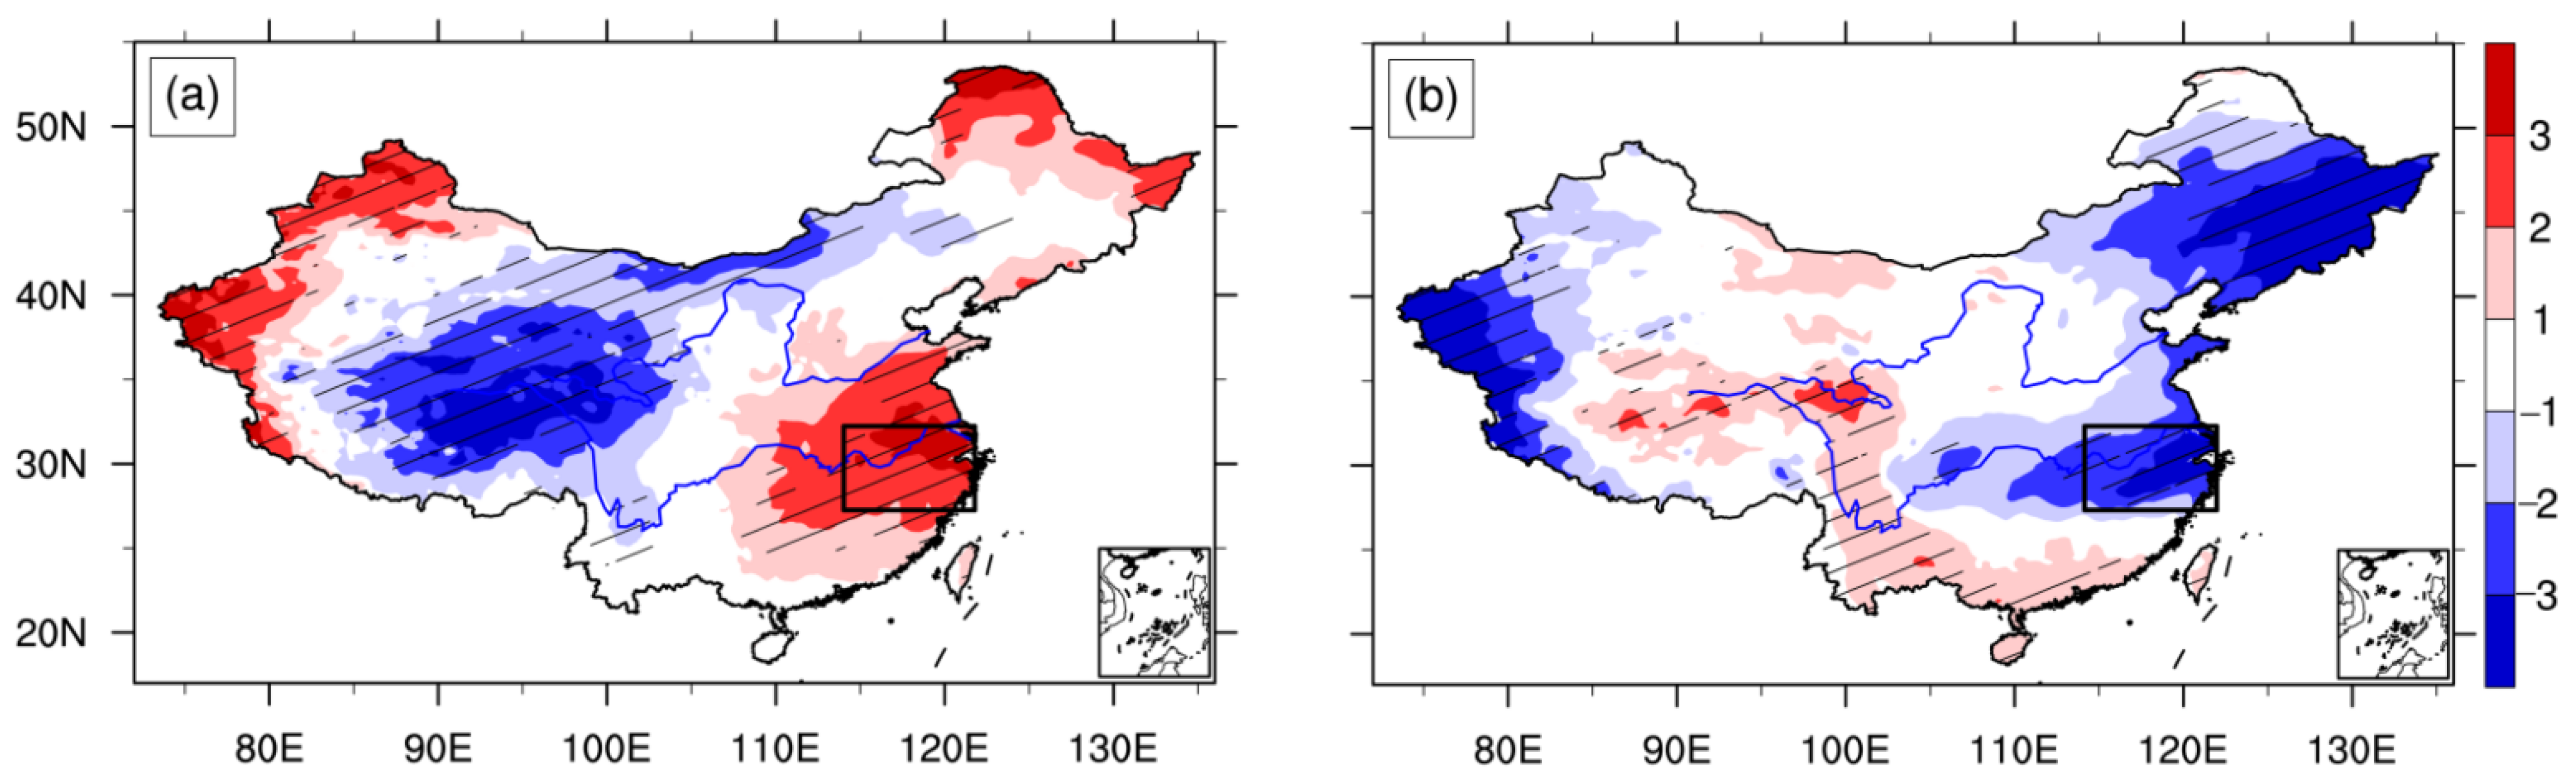
5.1. Influence of SRP on Summer Temperature in China

In this section, the possible influence of the SRP on the summer temperature over China are explored. Based on the samples in Table 1 and Table 2, Figure 7 presents the spatial distribution of composite averaged temperature anomalies during the SRP+ and SRP− events.
Corresponding to the SRP+ events, positive temperature anomalies dominated most of China, which has three significant positive centers over the middle and lower Yangtze River Valley (YRV), Xinjiang province, and part of Northeast China respectively, with the temperature anomalies having values of 1–3 degrees higher than the climatology mean. In addition, there is a significant center of negative temperature anomaly in Qinghai province and adjacent regions. As for the SRP− events, the distribution of the temperature anomalies has an opposite sign, characterized by negative temperature anomalies over mainland China. Three significant negative centers are located over the YRV, southern region of Xinjiang province, and most of Northeast China, respectively.
It is well known that the Yangtze River Valley, located in central-eastern China, is one of the most densely populated and economically developed regions in China. Thus, high temperatures or extreme heat waves in the YRV have a more important impact on people’s production and life. Some studies have shown that the YRV witnessed increased numbers of heat waves in the summer since 1951 [42,43]. Therefore, the following analysis will focus on the SRP-related temperature anomalies in the YRV (114–122° E, 27–32° N) and its possible causes.
Through further analyses, we find that the SRP+ (SRP−) is closely linked to the persistent heat waves and cool summer processes in the YRV. To prove that, the SRP-related heat waves and cool summer process should be defined firstly. The specific criterion and associated anomalies of the temperature and related circulations are provided in the following analysis. According to the previous studies, +1.0 standard deviation (σ) is selected as the threshold to identify the typical extreme weather and climate events [44,45]. In this study, the heat waves (cool summer processes) in the YRV must meet the following criterion: daily normalized domain-averaged temperature anomalies must be greater than (less than) +1.0 σ (−1.0 σ).
As mentioned above, the temperature anomalies in the YRV during the SRP+ and SRP− events exactly show an opposite distribution. Concretely, the SRP+ (SRP−) is closely related to the positive (negative) temperature anomalies signals in the middle and lower reaches of YRV. Therefore, a key region (114–122° E, 27–32° N) is selected to calculate the regional averaged temperature anomalies. As shown in Figure 8, the temperature anomalies increase substantially prior to the peak date of the SRP+ events. Daily normalized domain-averaged temperature anomalies of more than 1 σ can persist from day −1 to day 5, which can keep a certain strength for approximately 7 days, indicating the consecutive summer heat wave cases of YRV. After day 5, the temperature anomalies in the YRV descend significantly. As for the SRP− events, the daily normalized domain-averaged temperature anomalies rapidly descend from day −2, with minimal anomalies less than −1.5 σ at day 3, suggesting a continuous process of cool summer in the Yangtze River Valley (from day 2 to day 5). These results may imply that the daily-scale SRP+ (SRP−) has a profound effect on the summer persistent heat waves (cool summer process) in the YRV.
In order to better explain the important contribution of SRP to the temperature anomaly in the Yangtze River Valley, Figure 9 presents the days of heat wave events and cool summer processes within the YRV in each summer during 1979–2020. Particularly, it has to be stated that the SRP indeed represents only one of the favorable factors responsible for such prolonged extreme temperature anomaly events in the YRV. Accordingly, 171 summer heat wave days can be extracted from the 267 days accumulated by all the identified SRP+ events (Table 1), which account for about 29.03% of the total 589 summer heat wave days in the YRV during 1979–2020. Similarity, during the summers with the SRP− events, 193 cool summer cases can be extracted from the 290 days accumulated by all the identified SRP− events (Table 2), which account for about 30.1% of the total 641 cool summer days in the YRV during 1979–2020. It is also proved that the SRP may play an important role in the summer temperature anomaly of the Yangtze River Valley.

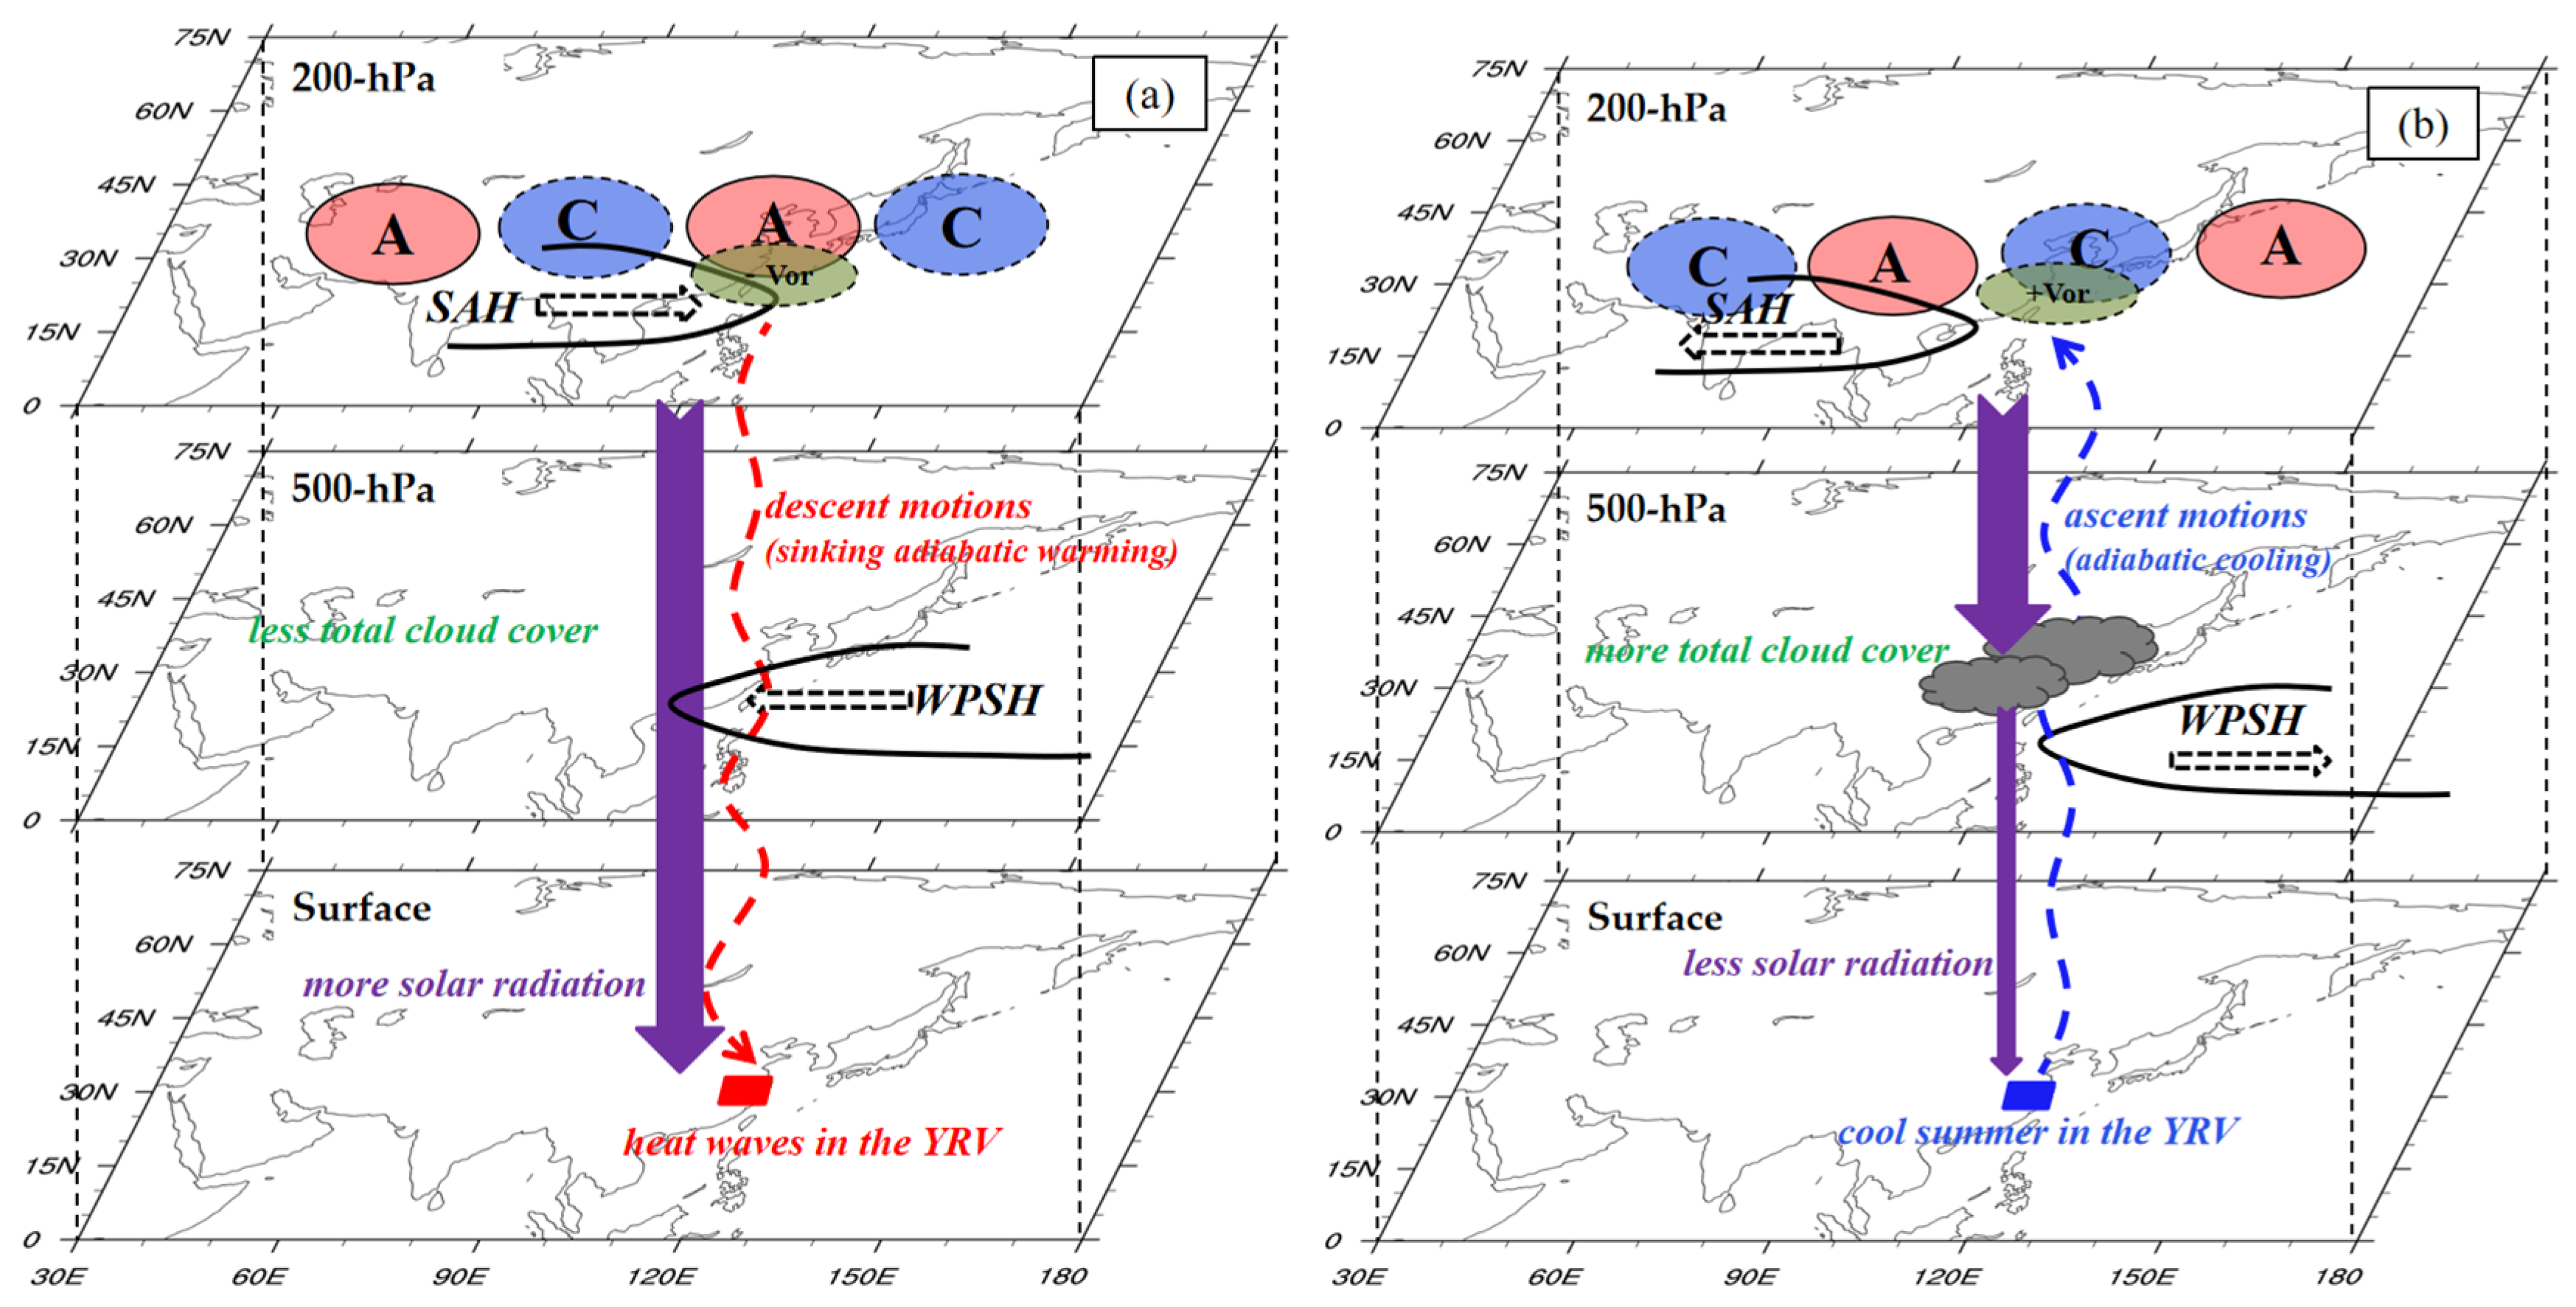
5.2. Possible Causes of SRP-Related Temperature Anomalies in the YRV

The occurrence and maintenance of regional extreme weather and climate events is closely linked to the anomalous regional circulation, and some of the extreme events are the result of the combined anomalies formed by a variety of climatic factors [46,47]. The generation of surface temperature anomalies is usually associated with the specific atmospheric circulation patterns [46]. In the following analysis, this study will further explore the possible causes of temperature anomalies in the middle and lower reaches of YRV from the perspective of Silk Road pattern, revealing the anomalous circulation patterns related to SRP responsible for the YRV temperature anomalies.
As shown in Figure 10, prior to the peak date of typical SRP+ events, an anomalous anticyclone/cyclone/anticyclone wave train (‘A/C/A’ in Figure 10) aligned in a near-zonal direction along the Asian jet can be identified in the upper troposphere at 200 hPa from day −6 onward, which can also be considered as the embodiment of SRP [14]. It is interesting to note that the anomalous ‘A/C/A’ wave train is similar to the Silk Road pattern which is mentioned in previous studies [5]. Throughout the maintenance stage of SRP+ events, an anomalous anticyclone dominated over the East Asia to the Northwest Pacific, with significant negative vorticities over the anomalous anticyclone area. Positive (negative) vorticity advection corresponds to the anomalous ascent (descent) motions. To ensure the conservation of potential vorticity, positive (negative) vorticity advection must be accompanied by adiabatic cooling (heating) [48]. Furthermore, another most distinct characteristic of large-scale circulation is the gradual westward extension of the western Pacific subtropical high (WPSH) at 500 hPa and the eastward shift of the South Asia high (SAH) at 200 hPa. The negative vorticities related to the anomalous anticyclonic circulation over East Asia accelerate the zonal advance between the SAH and WPSH, which is consistent with the previous studies [49]. From day −6 onward, they overlap with each other, with the negative vorticities in the overlapping area of the SAH and WPSH. Particularly, the similar zonal approach between the SAH and WPSH has been widely used in different studies, which can be viewed as an effective predictor for the temperature and precipitation anomalies over East Asia [5,26].
Figure 11 presents the latitude-pressure cross-section (114–122° E) of vertical p-velocity during the SRP+ events (day −8 to day 8). It is shown that both the anomalous anticyclone and overlapping of the SAH and WPSH may favor the anomalous descents above the YRV regions. After their zonal approach, the significant positive vertical p-velocity rapidly dominates the YRV areas from day −4, indicating the strong local descents, which can persist throughput the following 8 days. Thus, the persistent sinking adiabatic warming can be regarded as one of the important factors involved in surface warming or heat waves over the YRV area. On the other hand, anomalous descents can reduce the total cloud cover (negative anomalies of total cloud cover in Figure 12c) and increase solar radiation incident to surface of the YRV area (positive anomalies of solar radiation in Figure 12a). Therefore, the summer heat waves in the YRV regions during the SRP+ events may be also determined by the clear-sky warming.
Next, we will explore the possible causes of cool summer processes in the Yangtze River Valley during the typical SRP− events. Two days prior to its onset, a similar anomalous cyclone/anticyclone/cyclone wave train (‘C/A/C’ in Figure 13) can also be observed along the Asian jet. East Asia to the Northwest Pacific is under the influence of the anomalous cyclonic circulation and positive vorticities. Concurrently, the SAH and WPSH tend to diverge from each other towards the reverse directions and retreat to their normal positions. As illustrated in Figure 13, the positive vorticities between the SAH and WPSH enhanced remarkably around the peak dates, further accelerating the divergence of the SAH and WPSH from day −4 to day −2. By day 0, the eastern boundary of the SAH retreat to the east of 120° E, and the WPSH retreat westward to the western Pacific, which favors the development of the local ascent motions over the YRV area (Figure 14). It is well known the ascent motions may provide the favorable conditions for the YRV summer precipitation, leading to cool summers during the SRP− events. Moreover, the local ascents can also increase the total cloud cover (positive anomalies of total cloud cover in Figure 12d), with less solar radiation incident to the surface of the YRV areas (negative anomalies of solar radiation in Figure 12b), contributing to the development of the negative temperature anomalies in the middle and lower reaches of YRV. Thus, the cool summer processes in the YRV are mainly determined by the adiabatic cooling with the local ascent motions caused by the anomalous cyclonic circulation over the YRV related to the SRP−.
Figure 12. Composite average anomalies of surface solar radiation downwards ((a,b); unit: kJ m−2; shadings), total cloud cover ((c,d); unit: 0–1; shadings) and averaged precipitation anomalies ((c,d); contours are from −20 mm to 20 mm with interval of 5 mm) during the SR+ (a,c) and SRP− (b,d) events. The slash shadings indicate that the anomalies of surface solar radiation downwards (a,b) and total cloud cover (c,d) are statistically significant at the 0.05 confidence level. Red rectangles denote the YRV (114–122° E, 27–32° N) regions. Only negative and positive precipitation anomalies are plotted in Figure 14c,d, respectively.
Atmosphere 12 00747 g012
Figure 13. The same as in Figure 10, but for the SRP− events.
Atmosphere 12 00747 g013
Figure 14. The same as in Figure 11, but for the SRP− events.
Atmosphere 12 00747 g014

6. Conclusions and Discussion

In this study, the evolution characteristics of Silk Road pattern (SRP) and its association with summer precipitation in China are investigated using ERA5 reanalysis daily data. The main conclusions are summarized as follows.
The evolution characteristics of SRP+ and SRP− show marked distinctions, especially on the occurrence, maintenance, and disappearance of their three action centers. Prior to the peak date of SRP+ events, the anomaly centers over West Central Asia and Mongolia firstly emerge, experiencing considerable growth during the subsequent 4 days, with the eastward wave-activity flux (WAF) emanating from the Black Sea regions along the Asian jet. Although the anomaly center over the Far East appears later than other centers (almost from day −4), it can maintain its intensity for a longer period, owing to the convergence of sustaining eastward WAF over the Far East. During the decaying period, the intensities of the West Central Asia and Mongolia centers decrease gradually and vanish one after another. The SRP− events start with a negative anomaly center located over the Far East from day −8 onward, significantly strengthening after that. Meanwhile, the negative height anomaly center over the West Central Asia emerges, with a rapid growth in the strength from day −6 to day −4, and it is under the influence of eastward WAF emanating from the Caspian Sea regions. The positive height anomaly center over Mongolia begins to develop from day −2 onward and then intensifies significantly. During the decaying stage, the intensity of the West Central Asia negative center weakens substantially from day 2 earlier than other centers. Although the positive anomaly center in Mongolia appears last, it can maintain a certain strength for a longer period until the SRP− vanishes. In the vertical direction, SR pattern mainly concentrates in the upper-to-mid troposphere. The baroclinicity contributes to the development of daily-scale SRP, and its maintenance is inextricably linked to the barotropic instability processes.
In addition, as illustrated in the schematic diagram (Figure 15), the SR pattern has a significant effect on the summer temperature anomalies in the Yangtze River Valley (YRV). Concretely, during the SRP+ (SRP−) events, significant positive (negative) temperature anomalies can be observed in the YRV, indicating the heat waves (cool summer) processes. Prior to the peak date of SRP+ (SRP−), an anomalous anticyclone/cyclone/anticyclone (cyclone/anticyclone/cyclone) wave train can be clearly identified along the Asian jet. During SRP+, the anomalous anticyclonic circulation and negative vorticities over East Asia, favor the zonal advance between the SAH and WPSH. The overlapping of these two key systems remains in a favorable position for the violent sinking motions over YRV area. The sinking adiabatic warming can be regarded as one of the important factors involved in surface warming over the YRV area. Furthermore, the anomalous descents can reduce the total cloud cover, providing a favorable condition for the solar radiation incident to surface of the YRV area. Therefore, the summer heat waves in the YRV during the SRP+ events may be also related to clear-sky warming. With respect to SRP− events, owing to the anomalous cyclonic circulation and positive vorticities over East Asia, the SAH and WPSH depart from each other towards the reverse directions, retreating to their normal positions. As a result, the local ascent motions dominate gradually over the YRV, which increase the total cloud cover, with more precipitation signals and less solar radiation incident to surface of the YRV areas, then inducing the negative temperature anomalies (or cool summer processes) in the middle and lower reaches of YRV.
In general, sinking adiabatic warming and clear-sky radiation warming may be the possible causes for the significant heat waves events in the Yangtze River Valley during SRP+. Adiabatic cooling with the local ascents over the YRV area leads to more total cloud cover (precipitation) and less solar radiation incident to surface of the YRV, which are the possible causes of the cool summer process in the YRV during SRP−.
Besides, the SRP seems to exert great influence on the summer temperature anomalies in part of Southeast China, in Qinghai and Xinjiang province (Figure 7); however, the anomalous circulation fields related to the SRP, which can affect the temperature anomalies, need to be further explored. The SRP− is closely associated with the cool summer processes in the YRV. Furthermore, the variation of SRP− leads the variation of cool summer processes for several days. It is possible that the daily SRP index can be considered as a precursor for the persistent temperature anomalies over the YRV.

Author Contributions

Conceptualization, Y.W. and L.W.; methodology, C.W. and L.W.; software, C.W. and Y.L.; validation, Y.W. and C.W.; formal analysis, Y.W.; data curation, L.W. and Y.L.; writing—original draft preparation, C.W. and Y.W.; writing—review and editing, X.K. and Y.L.; visualization, X.K. All authors have read and agreed to the published version of the manuscript.

Funding

This research was jointly funded by the National Natural Science Foundations of China, grant number 41975085, and the Key Laboratory of Flight Techniques and Flight Safety, CAAC, grant number FZ2020ZZ05.

Institutional Review Board Statement

Not applicable.

Informed Consent Statement

Not applicable.

Data Availability Statement

Publicly available datasets were analyzed in this study. The data can be found here: The (ECMWF) Re-Analysis (ERA5) data is available online from https://cds.climate.copernicus.eu/ (accessed on 7 May 2021). The daily precipitation data was available online from http://data.cma.cn (accessed on 1 April 2020).

Acknowledgments

Special thanks to the reviewers for their valuable comments.

Conflicts of Interest

The authors declare no conflict of interest. The funders had no role in the design of the study; in the collection, analyses, or interpretation of data; in the writing of the manuscript, or in the decision to publish the results.

References

  1. Wu, G.X.; Liu, Y.M.; Liu, X.; Duan, A.M. How the Heating over the Tibetan Plateau Affects the Asian Climate in Summer. Chin. J. Atmos. Sci. 2005, 29, 47–56. [Google Scholar] [CrossRef]
  2. Wang, L.J.; Ge, J. Relationship between Low–frequency Oscillations of Atmospheric Heat Source over the Tibetan Plateau and Longitudinal Oscillations of the South Asia High in the Summer. Chin. J. Atmos. Sci. 2016, 40, 853–863. [Google Scholar] [CrossRef]
  3. Wang, G.L.; Wang, D.G.; Kevin, E.T.; Amir, E.; Miao, Y.; Michael, G.B.; Dana, T.P. The peak structure and future changes of the relationships between extreme precipitation and temperature. Nat. Clim. Chang. 2017, 7, 268. [Google Scholar] [CrossRef]
  4. Lu, R.Y.; Fu, Y.H. Summer climate variability in East Asian and the western North Pacific and its mechanisms. Adv. Earth Sci. 2009, 24, 123–131. [Google Scholar] [CrossRef]
  5. Wang, C.; Wang, L.J. Combined Effects of Synoptic-Scale Teleconnection Patterns on Summer Precipitation in Southern China. Atmosphere 2018, 9, 154. [Google Scholar] [CrossRef] [Green Version]
  6. Zhou, F.L.; Zhang, R.H.; Han, J.P. Relationship between the Circumglobal Teleconnection and Silk Road Pattern over Eurasian continent. Sci. Bull. 2019, 64, 374–376. [Google Scholar] [CrossRef] [Green Version]
  7. Lu, R.Y.; Oh, J.H.; Kim, B.J. A teleconnection pattern in upper-level meridional wind over the North African and Eurasian continent in summer. Tellus 2002, 54, 44–55. [Google Scholar] [CrossRef]
  8. Guan, Z.Y.; Yamagata, T. The unusual summer of 1994 in East Asia: IOD teleconnections. Geophys. Res. Lett. 2003, 30, 235–250. [Google Scholar] [CrossRef] [Green Version]
  9. Liu, Y.; Zhou, W.; Qu, X.; Wu, R.G. An Interdecadal Change of the Boreal Summer Silk Road Pattern around the Late 1990s. J. Clim. 2020, 33, 7083–7100. [Google Scholar] [CrossRef]
  10. Lin, Z.D.; Lu, R.Y.; Zhou, W. Change in early-summer meridional teleconnection over the western North Pacific and East Asia around the late 1970s. Int. J. Climatol. 2010, 30, 2195–2204. [Google Scholar] [CrossRef]
  11. Enomoto, T.; Hoskins, B.J.; Matsuda, Y. The formation mechanism of the Bonin high in August. Q. J. R. Meteorol. Soc. 2003, 129, 157–178. [Google Scholar] [CrossRef]
  12. Hong, X.W.; Xue, S.H.; Lu, R.Y.; Liu, Y.Y. Comparison between the interannual and decadal components of the Silk Road pattern. Atmos. Ocean Sci. Lett. 2018, 11, 270–274. [Google Scholar] [CrossRef] [Green Version]
  13. Ogasawara, T.; Kawamura, R. Combined Effects of Teleconnection Patterns on Anomalous Summer Weather in Japan. J. Meteorol. Soc. Jpn. 2007, 85, 11–24. [Google Scholar] [CrossRef] [Green Version]
  14. Hong, X.W.; Lu, R.Y. The meridional displacement of summer Asian jet, Silk Road Pattern, and tropical SST anomalies. J. Clim. 2018, 29, 3753–3766. [Google Scholar] [CrossRef]
  15. Chen, G.S.; Huang, R.H. Excitation mechanisms of the teleconnection patterns affecting the July precipitation in Northwest China. J. Clim. 2012, 25, 7834–7851. [Google Scholar] [CrossRef]
  16. Lin, Z.D. Intercomparison of the impacts of four summer teleconnections over Eurasia on East Asian rainfall. Adv. Atmos. Sci. 2014, 31, 1366–1376. [Google Scholar] [CrossRef]
  17. Hu, P.; Chen, W.; Chen, S.; Liu, Y.Y.; Huang, R.P. Impact of the September Silk Road Pattern on the South China Sea summer monsoon withdrawal. Int. J. Climatol. 2020, 40, 6361–6368. [Google Scholar] [CrossRef]
  18. Wakabayashi, S.; Kawamura, R. Extraction of major teleconnection patterns possibly associated with the anomalous summer climate in Japan. J. Meteorol. Soc. Jpn. 2004, 82, 1577–1588. [Google Scholar] [CrossRef] [Green Version]
  19. Sun, X.Q.; Li, S.L.; Hong, X.W.; Lu, R.Y. Simulated Influence of the Atlantic Multidecadal Oscillation on Summer Eurasian Nonuniform Warming since the Mid-1990s. Adv. Atmos. Sci. 2019, 36, 43–54. [Google Scholar] [CrossRef]
  20. Guan, W.N.; Hu, H.B.; Ren, X.J.; Yang, X.Q. Subseasonal zonal variability of the western Pacific subtropical high in summer: Climate impacts and underlying mechanisms. Clim. Dyn. 2019, 53, 1577–1588. [Google Scholar] [CrossRef] [Green Version]
  21. Wang, N.; Zhang, Y.C. Evolution of Eurasian teleconnection pattern and its relationship to climate anomalies in China. Clim. Dyn. 2015, 44, 1017–1028. [Google Scholar] [CrossRef] [Green Version]
  22. Saeed, S.; Lipzig, N.V.; Müller, W.A.; Saeed, F.; Zanchettin, D. Influence of the circumglobal wave-train on European summer precipitation. Clim. Dyn. 2014, 43, 503–515. [Google Scholar] [CrossRef]
  23. Huang, G.; Liu, Y.; Huang, R.H. The interannual variability of summer rainfall in the arid and semiarid regions of northern China and its association with the Northern Hemisphere circumglobal teleconnection. Adv. Atmos. Sci. 2011, 28, 257–268. [Google Scholar] [CrossRef]
  24. Huang, R.H.; Liu, Y.; Feng, T. Interdecadal change of summer precipitation over Eastern China around the late-1990s and associated circulation anomalies, internal dynamical causes. Chin. Sci. Bull. 2013, 58, 1339–1349. [Google Scholar] [CrossRef] [Green Version]
  25. Wang, L.J.; Wang, C.; Guo, D. Evolution mechanism of synoptic-scale EAP teleconnection pattern and its relationship to summer precipitation in China. Atmos. Res. 2018, 214, 150–162. [Google Scholar] [CrossRef]
  26. Chen, Y.; Zhai, P.M. Synoptic-scale precursors of the East Asia/Pacific teleconnection pattern responsible for persistent extreme precipitation in the Yangtze River Valley. Q. J. R. Meteorol. Soc. 2015, 141, 1389–1403. [Google Scholar] [CrossRef]
  27. Chen, Y.; Zhai, P.M. Mechanisms for concurrent low-latitude circulation anomalies responsible for persistent extreme precipitation in the Yangtze River Valley. Clim. Dyn. 2016, 47, 989–1006. [Google Scholar] [CrossRef] [Green Version]
  28. Chen, Y.; Zhai, P.M.; Liao, Z.; Li, L. Persistent precipitation extremes in the Yangtze River Valley prolonged by opportune configuration among atmospheric teleconnections. Q. J. R. Meteorol. Soc. 2019, 145, 2603–2626. [Google Scholar] [CrossRef]
  29. Li, X.Y.; Lu, R.Y. Subseasonal change in the seesaw pattern of precipitation between the Yangtze River basin and the tropical western North Pacific during summer. Adv. Atmos. Sci. 2018, 35, 1231–1242. [Google Scholar] [CrossRef]
  30. Gong, Z.Q.; Feng, G.L.; Dogar, M.M.; Huang, G. The possible physical mechanism for the EAP–SR co-action. Clim. Dyn. 2017, 51, 1499–1516. [Google Scholar] [CrossRef] [Green Version]
  31. Hersbach, H.; Dee, D. ERA5 Reanalysis is in Production. ECMWF News 2016, 147, 147. [Google Scholar]
  32. National Meteorological Information Center. Assessment Report of China’s Ground Precipitation 0.5° × 0.5° Gridded Dataset (V2.0); National Meteorological Information Center: Beijing, China, 2010. [Google Scholar]
  33. Hutchinson, M.F. Interpolation of Rainfall Data with Thin Plate Smoothing Splines-Part I: Two Dimensional Smoothing of Data with Short Range Correlation. J. Geogr. Inf. Decis. Anal. 1998, 2, 153–167. [Google Scholar]
  34. Grumm, R.H.; Hart, R.H. Standardized anomalies applied to significant cold season weather events: Preliminary findings. Weather Forecast. 2001, 16, 736–754. [Google Scholar] [CrossRef]
  35. Takaya, K.; Nakamura, H. A Formulation of a Phase-Independent Wave-Activity Flux for Stationary and Migratory Quasigeostrophic Eddies on a Zonally Varying Basic Flow. J. Atmos. Sci. 2001, 58, 608–627. [Google Scholar] [CrossRef]
  36. Huang, G. An index measuring the interannual variation of the East Asian Summer Monsoon–the EAP index. Adv. Atmos. Sci. 2004, 21, 41–52. [Google Scholar] [CrossRef]
  37. Li, X.Y.; Lu, R.Y.; Greatbatch, R.J.; Li, G.; Hong, X.W. Maintenance Mechanism for the Teleconnection Pattern over the High Latitudes of the Eurasian Continent in Summer. J. Clim. 2019, 33, 1017–1030. [Google Scholar] [CrossRef] [Green Version]
  38. Qu, X.; Huang, G. Impacts of tropical Indian Ocean SST on the meridional displacement of East Asian jet in boreal summer. Int. J. Climatol. 2012, 32, 2073–2080. [Google Scholar] [CrossRef]
  39. Kosaka, Y.; Nakamura, H.; Watanabe, M.; Kimoto, M. Analysis on the dynamics of a wave-like teleconnection pattern along the summertime Asian jet based on a reanalysis dataset and climate model simulations. J. Meteorol. Soc. Jpn. 2009, 87, 561–580. [Google Scholar] [CrossRef] [Green Version]
  40. Sato, N.; Takahashi, M. Dynamical processes related to the appearance of quasi-stationary waves on the subtropical jet in the midsummer Northern Hemisphere. J. Clim. 2006, 19, 1531–1544. [Google Scholar] [CrossRef]
  41. Chen, G.S.; Huang, R.H.; Zhou, L.T. Baroclinic Instability of the Silk Road Pattern Induced by Thermal Damping. J. Atmos. Sci. 2013, 70, 2875–2893. [Google Scholar] [CrossRef]
  42. Chen, X.L.; Zhou, T.J. Relative contributions of external SST forcing and internal atmospheric variability to July-August heat waves over the Yangtze River valley. Clim. Dyn. 2017, 51, 4403–4419. [Google Scholar] [CrossRef]
  43. Chen, R.D.; Lu, R.Y. Comparisons of the Circulation Anomalies Associated with Extreme Heat in Different Regions of Eastern China. J. Clim. 2015, 28, 5844–5930. [Google Scholar] [CrossRef]
  44. Chen, H.S.; Liu, L.; Zhu, Y.J. Possible linkage between winter extreme low temperature events over China and synoptic-scale transient wave activity. Sci. China Earth Sci. 2013, 56, 1266–1280. [Google Scholar] [CrossRef]
  45. Li, Z.H.; Li, C.Y.; Song, J.; Tan, Y.K.; Li, X. An analysis of the characteristics and causes of extremely high temperature days in the Yangtze–Huaihe River basins in summer 1960–2011. Clim. Environ. Res. 2015, 20, 511–522. (In Chinese) [Google Scholar] [CrossRef]
  46. Bellprat, O.; Guemas, V.; Doblas-Reyes, F.; Donat, M.G. Towards reliable extreme weather and climate event attribution. Nat. Commun. 2019, 10, 1–7. [Google Scholar] [CrossRef] [PubMed] [Green Version]
  47. Liu, Y.; Huang, R.H. Linkages between the South and East Asian Monsoon water vapor transport during boreal summer. J. Clim. 2019, 32, 4509–4524. [Google Scholar] [CrossRef]
  48. Holton, J.R. An Introduction to Dynamic Meteorology, 4th ed.; Academic Press: Burlington, VT, USA, 2004; pp. 146–147. ISBN 9780123540157. [Google Scholar]
  49. Li, N.; Xiao, Z.N.; Zhao, L. Analysis on the Mechanism of the 2018 Summer Extreme High Temperature Event in Northeast China. Clim. Environ. Res. 2020, 25, 469–482. (In Chinese) [Google Scholar] [CrossRef]
Figure 1. The preceding three EOF modes of daily 200 hPa normalized height anomalies along the Asian jet region (30–150° E, 30–60° N) during the summertime (June–August) of 1979 to 2020. Solid and dashed contours in EOF1 mode denote the positive and negative values, respectively (with interval of 0.002). The triangles represent the three basic points in Equation (1).
Atmosphere 12 00747 g001
Figure 2. Composite indices of SRP+ (red line) and SRP− (blue line) events from day −15 to day 15. The numbers on the abscissa represent the days leading (negative) and lagging (positive) the peak date of SRP events.
Atmosphere 12 00747 g002
Figure 3. Composite 200 hPa geopotential height anomalies (contours are from −80 to 80 gpm with interval of 40 gpm, red for positive and blue for negative), the zonal wind speed (shading; units: m s−1), and wave-activity flux (vector; units: m2 s–2) of SRP+ events from day –8 to day 8 (ai) in Table 1. The slash shadings denote that the height anomalies are statistically significant at the 0.05 confidence level. The numbers at the top-left corner above each panel represent the days leading (negative) and lagging (positive) the peak date of the SRP+ events. Wave fluxes smaller than 4 m2 s–2 are not plotted.
Atmosphere 12 00747 g003
Figure 4. The same as in Figure 3, but for the SRP− events in Table 2.
Atmosphere 12 00747 g004
Figure 5. Longitude-pressure cross-section of geopotential height anomalies (contours are from −120 gpm to 120 gpm with the interval of 30 gpm) and meridional wind anomalies (shadings; units: m s−1) along 40° N during the SRP+ events (ai: from day −8 to day 8). The slash shadings indicate that the height anomalies are statistically significant at the 0.05 confidence level. The numbers at the top-left corner above each panel represent the days leading (negative) and lagging (positive) the peak date of the SRP+ events.
Atmosphere 12 00747 g005
Figure 6. The same as in Figure 5, but for the SRP− events.
Atmosphere 12 00747 g006
Figure 7. Spatial distribution of the average temperature anomalies ((a,b); units: °C) during the SRP+ (a) and SRP− (b) events; The slash shadings indicate that the anomalies are statistically significant at the 0.05 confidence level. Black rectangles in Figure 7a,b denote the YRV regions (114–122° E, 27–32° N) which are selected to calculate the domain-averaged temperature anomalies.
Atmosphere 12 00747 g007
Figure 8. Daily normalized domain-averaged temperature anomalies during the SRP+ and SRP− events from day −8 to day 8 in the YRV (114–122° E, 27–32° N); The solid circles indicate that the anomalies are statistically significant at the 0.05 confidence level.
Atmosphere 12 00747 g008
Figure 9. Days of heat wave cases ((a), light blue rectangle; red rectangles represent the days of heat wave cases related to SRP+) and cool summer processes ((b), blue rectangle; red rectangles represent the days of cool summer cases related to SRP−) within the YRV (114–122° E, 27–32° N) in each summer (June–August) during 1979–2020.
Atmosphere 12 00747 g009
Figure 10. Composite average horizontal wind anomalies at 200 hPa (vector; units: m s−1) and the relative vorticity (shadings; units: s−1) during the SRP+ events from day −8 to day 8 (ai). The thick black contours (588 dagpm-contour) and the blue dashed contours (1250 dagpm-contour) denote the activities of WPSH at 500 hPa and SAH at 200 hPa, respectively. The letters ‘C’ and ‘A’ represent an anomalous cyclone and anticyclone, respectively.
Atmosphere 12 00747 g010
Figure 11. Latitude-pressure cross-section (114–122° E) of vertical p-velocity (shading; units: hPa s−1) during the SR+ events from day −8 to day 8 (ai). The slash shadings indicate that the anomalies are statistically significant at the 0.05 confidence level. Black rectangles denote the YRV regions (114–122° E, 27–32° N).
Atmosphere 12 00747 g011
Figure 15. Schematic diagrams for possible causes of the heat waves and cool summer processes in the YRV during the SRP+ (a) and SRP− (b) events. The letters ‘C’ (blue shadings) and ‘A’ (red shadings) represent the anomalous cyclone and anticyclone, respectively. The black solid lines at 200-hPa and 500-hPa denote the boundary of the SAH and WPSH, whose propagation directions are indicated by the dashed blank arrows. The thick and thin purple arrows denote the more and less solar radiation incident to surface of the YRV, respectively. The more total cover is represented by the gray cloud shape. The ascent and descent motions are presented as blue and red dashed lines. The green shadings denote the positive and negative vorticities over the YRV area.
Atmosphere 12 00747 g015
Table 1. The year, start date, peak date, end date, duration (unit: day), average SRPI, and HWCA, HMO, HFE of the 40 SRP+ events.
YearStart DatePeak DateEnd DateDurationSRPIHWCAHMOHFE
197910 Jul11 Jul14 Jul51.6281.797−1.2601.828
198014 Jul15 Jul16 Jul31.1801.046−1.3531.141
19823 Aug7 Aug11 Aug91.9461.738−2.1931.907
198329 Jul31 Jul6 Aug92.2252.440−1.7062.475
198318 Aug18 Aug21 Aug41.6851.667−1.8111.577
198424 Jul28 Jul30 Jul71.6311.844−1.5981.452
198416 Aug20 Aug30 Aug152.1891.902−2.1792.486
19857 Jul7 Jul13 Jul71.2921.467−1.3781.031
198524 Jul28 Jul31 Jul81.5501.169−1.7501.731
198615 Jul17 Jul19 Jul51.5701.461−1.7131.536
19861 Aug1 Aug3 Aug31.8521.859−1.6942.003
198616 Aug17 Aug19 Aug41.1470.907−1.2251.309
198711 Aug17 Aug29 Aug191.2761.202−0.9501.676
19882 Jul4 Jul6 Jul51.5291.616−1.8171.154
199019 Jun22 Jun26 Jun81.6591.137−1.8591.981
19908 Aug12 Aug14 Aug71.3851.404−1.6001.151
199128 Aug28 Aug30 Aug31.6831.822−1.7461.482
199220 Jul22 Jul23 Jul41.3341.008−1.4991.495
199223 Aug25 Aug27 Aug51.2311.216−1.4251.052
199424 Jun2 Jul11 Jul181.5391.547−1.1741.896
19944 Aug5 Aug7 Aug42.0802.125−2.1171.998
199512 Aug13 Aug20 Aug91.7111.245−1.8862.002
199715 Jul19 Jul19 Jul51.3921.644−1.3791.153
199717 Aug19 Aug20 Aug42.1372.229−2.0042.178
19981 Aug11 Aug13 Aug131.1801.462−0.8551.223
200129 Jun1 Jul2 Jul41.4511.511−1.3331.509
20029 Aug10 Aug11 Aug31.3461.831−1.1861.102
200318 Jul24 Jul27 Jul101.4680.977−1.5661.861
200315 Aug17 Aug18 Aug41.4071.125−1.3591.737
200525 Jun27 Jun28 Jun41.1941.274−1.3880.920
200812 Jul14 Jul17 Jul61.0871.295−1.0490.917
200810 Aug11 Aug12 Aug31.2681.194−1.0661.544
200914 Aug14 Aug17 Aug41.2231.225−1.0131.431
20117 Jul8 Jul12 Jul61.1861.309−1.1171.132
201220 Aug20 Aug24 Aug51.6061.111−1.6562.051
201329 Jul1 Aug9 Aug121.9251.944−1.9421.889
201513 Jul17 Jul20 Jul81.7391.363−1.9151.939
20178 Aug9 Aug10 Aug31.2011.603−1.0080.992
201922 Jul23 Jul24 Jul32.0142.155−1.7372.150
202012 Aug16 Aug20 Aug91.8411.797−1.9241.758
Table 2. The year, start date, peak date, end date, duration (unit: day), average SRPI, and HWCA, HMO, HFE of the 40 SRP− events.
YearStart DatePeak DateEnd DateDurationSRPIHWCAHMOHFE
19796 Jun12 Jun16 Jun11−1.476−1.2551.461−1.712
198112 Jun13 Jun19 Jun8−1.947−2.2011.791−1.849
198222 Jun24 Jun24 Jun3−1.091−1.4171.052−0.804
19825 Jul8 Jul9 Jul5−1.074−1.0831.126−1.013
19836 Jul7 Jul11 Jul6−1.406−1.4551.418−1.345
198510 Jun12 Jun18 Jun9−1.332−1.3771.611−1.008
19879 Jun21 Jun25 Jun17−1.667−1.6291.366−2.006
198815 Jun15 Jun19 Jun5−1.151−1.1361.149−1.168
198911 Jun20 Jun22 Jun12−1.694−1.9601.592−1.530
19893 Jul4 Jul6 Jul4−1.813−1.7651.766−1.908
199119 Jun22 Jun28 Jun10−1.696−1.5701.514−2.004
19926 Jun10 Jun20 Jun15−2.171−2.1532.377−1.983
199210 Aug11 Aug13 Aug4−1.287−1.1880.954−1.719
19932 Jun7 Jun9 Jun8−1.474−1.1431.621−1.658
199522 Jun26 Jun28 Jun7−1.581−1.1741.625−1.944
199615 Jun17 Jun19 Jun5−1.391−1.0261.433−1.714
19965 Jul7 Jul8 Jul4−1.305−0.9661.479−1.470
199711 Jun12 Jun15 Jun5−1.434−1.8091.188−1.375
19987 Jun15 Jun18 Jun12−1.655−1.3512.002−1.612
199910 Jun10 Jun13 Jun4−1.991−1.7332.219−2.021
20003 Jun10 Jun14 Jun12−2.031−1.7951.938−2.360
200018 Jul24 Jul26 Jul9−1.494−1.1071.456−1.919
200212 Jun16 Jun20 Jun9−1.841−1.6281.780−2.115
20027 Jul9 Jul16 Jul10−1.389−1.7991.006−1.362
200510 Jun12 Jun20 Jun11−1.321−1.4241.300−1.239
20065 Jun6 Jun11 Jun7−2.080−1.9551.811−2.474
200918 Jun23 Jun27 Jun10−2.015−1.8632.038−2.144
200923 Aug24 Aug25 Aug3−1.013−1.0350.814−1.190
201021 Jun23 Jun24 Jun4−1.158−1.2401.056−1.178
20105 Jul6 Jul7 Jul3−1.104−1.2660.995−1.051
20128 Jun11 Jun14 Jun7−1.502−1.7781.634−1.094
201317 Jun17 Jun20 Jun4−1.267−1.0931.557−1.151
20147 Jun11 Jun13 Jun7−1.619−1.4091.477−1.971
201525 Jun27 Jun28 Jun4−1.159−1.0130.946−1.518
201623 Jun25 Jun26 Jun4−1.316−0.9081.469−1.571
201616 Aug17 Aug18 Aug3−1.163−1.4041.033−1.052
201710 Jun12 Jun17 Jun8−1.790−2.0321.588−1.570
201819 Jun22 Jun29 Jun11−1.525−1.3411.896−1.338
201920 Jun23 Jun25 Jun6−1.514−1.9371.772−0.833
202028 Jun29 Jun1 Jul4−1.194−1.0261.308−1.248
Publisher’s Note: MDPI stays neutral with regard to jurisdictional claims in published maps and institutional affiliations.

