Article

Analysis of the Interactions between the 200 hPa Jet and Air Pollutants in the Near-Surface Layer over East Asia in Summer

1
School of Atmospheric Sciences, Nanjing University, Nanjing 210023, China
2
Nanjing Meteorological Bureau, Nanjing 210019, China
*
Authors to whom correspondence should be addressed.
Submission received: 4 June 2021 / Revised: 29 June 2021 / Accepted: 6 July 2021 / Published: 8 July 2021
(This article belongs to the Special Issue Air Pollution in China)

Abstract

:
The rapid economic development in East Asia has led to serious air pollution problems in the near-surface layer. Studies have shown that there is an interaction between air pollution and the East Asian upper-level jet, which is an important weather system controlling the climate in East Asia. Therefore, it is of great significance to study the relationship between the surface layer air pollutants and the upper-level jet stream in East Asia. Based on the daily wind and vertical velocity data provided by the National Centers for Environmental Prediction/National Center for Atmospheric Research as well as the surface pollutant and meteorological variable data provided by the Science Data Bank, we use statistical analysis methods to study the relationship between the East Asian upper-level jet and the high-concentration area of near-surface air pollutants in summer. Meanwhile, the mechanisms of the interaction are preliminarily discussed. The results show that the North China Plain and the Tarim Basin are the high-value areas of the particulate matter (PM) in summer during 2013–2018, and the ozone (O3) concentration in the near-surface atmospheric layer in the North China Plain is also high. The average concentrations of the PM2.5, PM10 and O3 in the North China Plain are 45.09, 70.28 and 131.27 μg·m−3, respectively, and the days with the concentration exceeding the standard reach 401, 461 and 488, respectively. During this period, there is an increasing trend in the O3 concentration and a decreasing trend in the PM concentration. The average ratio of the PM2.5 to PM10 is approximately 0.65 with a decreasing trend. The air pollutant concentration in this region has a significant relationship with the location of the East Asian upper-level jet. The low wind speed at the surface level under the control of the upper-level jet is the main reason for the high pollutant concentration besides the pollutant emission. They relate to each other through the surface humidity and the meridional and zonal wind. Meanwhile, the concentrations of the PM2.5 and PM10 are high in the near-surface layer in the Tarim Basin, and the average concentrations are 45.19 and 49.08 μg·m−3, respectively. The days with the concentration exceeding the standard are 265 and 193, respectively. The interannual variation in the PM concentration shows an increasing trend first and then a decreasing trend. The average ratio of PM2.5 to PM10 in this region reaches approximately 0.9. The ratio reaches the highest in 2013 and 2014 and then decreases to and maintains at approximately 0.85. The concentration of air pollutants in the basin has a significant relationship with the intensity of the upper-level jet in East Asia. The weakening of the upper-level jet will lead to a decrease in the surface humidity in the northern part of the basin, an increase in the surface temperature in the western part of the basin and a decrease in the surface zonal wind in the eastern part of the basin, which will result in a higher PM concentration.

1. Introduction

Since the industrial revolution, the increase in human activities has exacerbated climate change in the earth system. At present, observation results have proved that global climate change has become an unequivocal fact, such as the continuous rise of the global temperature, glacier melting and frequent extreme weather events, which are serious threats to human survival and development [1]. Therefore, the in-depth understanding of climate change is the current hotspot of scientific research, which will provide scientific support for climatic policymaking.
Some studies have pointed out that there is an interaction between climate change and air pollution [2]. Among the influencing factors of climate change, the role of aerosol is the most uncertain [1]. The main component of air pollutants is the atmospheric aerosol. The atmospheric aerosol refers to the particulate matter (PM) suspended in the atmosphere. Aerosol particles can be solid or liquid and can also exist in the mixing form of solid and liquid. In general, the diameters of the atmospheric aerosol particles are several nanometers to tens of microns. The sources of aerosol particles in the atmosphere are different, and different aerosols have different physical, chemical and optical properties, resulting in more complex climatic effects of aerosols. The climatic effects of aerosols can be divided into direct climatic effects, indirect effects and semi-direct effects. Although the three effects are different in their interaction mechanisms, they all essentially lead to the change in the earth climate system by affecting the radiation budget balance of the earth-atmosphere system [3,4,5,6,7]. At the same time, variations in the climate system will cause the variation in relevant meteorological factors, which will have an impact on the distribution of air pollutants [8,9].
The East Asian upper-level jet is a narrow wind belt with a high wind speed above 500 hPa in the East Asia region [10]. Many observational data show that the strongest subtropical westerly wind speed generally exists at 200 hPa [10,11], and the East Asian jet is generally defined as the 200 hPa maximum zonal wind speed zone. The East Asian upper-level jet has significant seasonal variation, and its location and intensity will change accordingly. The jet stream, with its strong shears, plays an important role in forming upper level convergence and divergence. Therefore, it causes variations of the weight of all the air in a column from the ground to the limit of the atmosphere. In other words, The upper level jet stream makes the surface pressure change, which could result in variations in the air flow field at the ground [12]. At present, a large number of studies have shown that the East Asian upper-level jet controls the atmospheric circulation in East Asia and has an extremely important impact on the weather and climate in East Asia [13,14,15]. Secondary circulations will be generated around the East Asian upper-level jet, leading to the coupling of upper-level and low-level weather systems accompanied by the exchange of the matter, momentum and energy between the upper level and the ground. Therefore, the East Asian upper-level jet, as important weather and climate system in East Asia, may have a certain interaction with the surface pollutants. Studies have shown that surface pollutants have effects on the upper-level jet stream. Song et al. [16] and Chen et al. [17] pointed out that the increase in summer aerosols will cause the southward movement of the upper-level jet stream, which is mainly due to the change in the upper-level temperature gradient caused by the aerosol forcing. Liu et al. [18] pointed out that, in winter, to the north of 30° N, the mid-latitude cooling caused by aerosols leads to the enhancement of the subtropical jet stream and the weakening of the temperate jet stream, which further makes the upper-level jet stream move southward. In other studies, it has been found that the upper-level jet stream can affect the distribution of surface pollutants. Ordóñez et al. [19] found that the location of the North Atlantic jet stream has a greater impact on the concentration distribution of the surface PM10 than on its intensity. Barnes and Fiore [20] have shown that the location of the jet stream in eastern North America in summer is closely related to the surface ozone concentration. Kerr et al. [21] used a model to analyze the position of the upper-level jet stream affecting the transport of the ozone by affecting the surface meridional wind. However, current research mainly focusses on the one-way effect between the upper-level jet stream and surface pollutants and rarely focusses on the interaction between them. In addition, the East Asia region has a wide zonal range, and the distributions of the terrain, coastline and land use are relatively complex. The region is mainly controlled by the monsoon system, and the seasonal change in the climate is distinctive. In particular, the role of the summer monsoon system is relatively significant. Meanwhile, the population in East Asia accounts for one third of the world’s population. On the one hand, the climate change in East Asia has a significant impact on the production and lives of the local people. On the other hand, the climate in East Asia is also strongly affected by human factors related to the rapid economic development of Asian countries. Therefore, the East Asian upper-level jet is one of the main members of the monsoon system that controls the weather and climate in East Asia, and the surface pollutant is an important factor affecting weather and climate changes. It is of great practical significance to study the interaction between them in summer and explore the mechanism.

2. Materials and Methods

2.1. Data

The National Centers for Environmental Prediction/National Center for Atmospheric Research (NCEP/NCAR) daily reanalysis data of the zonal wind and vertical velocity from 1989 to 2018 are used with the horizontal resolution of 2.5° × 2.5° (the number of grid points is 144 × 73) and the vertical resolution of 17 layers.
The surface pollutant data and the surface meteorological variables including the relative humidity, temperature, surface meridional wind and surface zonal wind data are derived from the second version of the high-resolution air pollution reanalysis dataset in China in the Science Data Bank during 2013–2018. The dataset mainly contains two parts. The first part is the surface concentration reanalysis data of six conventional air pollutants (PM2.5, PM10, SO₂, NO₂, CO and O₃) in China from 2013 to 2018. These data are obtained by assimilating the surface observation data provided by the China National Environmental Monitoring Center by using the ensemble Kalman filter and the Nested Air Quality Prediction Modeling System. The second part is the Weather Research and Forecasting model simulation data of surface meteorological variables including the wind speed, temperature, air pressure and relative humidity during the same period. The spatio-temporal resolution of the dataset is high with the temporal resolution of 1 h and the spatial resolution of 15 km. By using cross-validation, independent data verification and comparing with similar data at home and abroad, it was found that the dataset is highly accurate [22]. In this study, four surface pollutants of the NO2, PM10, PM2.5 and O3 are selected as the main research objects, and the O3 data are processed into the format of the maximum concentration in 8 h per day.

2.2. Methods

All methods used in this paper were coded and computed in the programming language Python.

2.2.1. Empirical Orthogonal Function Decomposition

The empirical orthogonal function (EOF) is applied to the meteorological variable that changes with time, and the meteorological variable is decomposed into two parts, namely, the function of time and the function of space.
Assuming that the sample size is n and the meteorological variable X contains p spatial points (variables), the anomaly value of any spatial point i at any time point j can be regarded as the linear combination of p spatial functions v ik and p time functions y ki (k = 1, 2, 3…… and p). The decomposition is expressed as a matrix form of X = VY.
The space vector V is a matrix of n row and n column, which are orthogonal to each other:
VT × V = I (I is a unit matrix)
The time vectors Y is an n-row and m-column matrix, and Y are also orthogonal:
Y × YT = Λ (Λ is a diagonal matrix)
Defining the matrix A as A = X × XT, and then we have:
A = V × Λ × VT
V is also the eigenvector of A, Λ’s principal diagonal is the eigenvalue of A and the rest are all 0. Y can be obtained as Y = VT × X.
This method is used to study the spatio-temporal characteristics of 200 hPa zonal wind. More information about EOF can be found in [23].

2.2.2. Singular Value Decomposition

The singular value decomposition (SVD) method is performed on the covariance matrix of two variables. The anomalies fields of the variables and the normalized variables are commonly used. The decomposition result reveals the spatial correlation of two variable fields within a certain time range to a great extent. The heterogeneous correlation diagrams of the left and right fields explain the correlation between the two variables, and the SVD results are tested by using the Monte-Carlo method to avoid false correlation. The detailed descriptions and application of SVD is given in [24].This approach is used to test the relationships between upper level jet stream (200 hPa zonal wind) and surface pollutants (PMs and O3) over East Asia.

2.2.3. Pearson Correlation Coefficient

The Pearson correlation coefficient is a statistic that measures the linear correlation between two variables. It is usually represented by r, and its value ranges between −1 and 1. The calculation formula of the correlation coefficient between variables x1, x2, x3...xn and variables y1, y2, y3...yn is as follows:
r = i = 1 n ( x i x ¯ ) ( y i y ¯ ) i = 1 n ( x i x ¯ ) i = 1 n ( y i y ¯ )
The correlation coefficient in this study is tested by using the Monte Carlo method. That is, the two variables are considered to obey the normal distribution. The H0 hypothesis is when the correlation coefficient is r, the two variables are not correlated. Given the confidence level α, the corresponding critical value can be determined according to the degree of freedom so that the probability distribution function conforms to P (|r| > r1-α) = α. If |r| > r1-α, the hypothesis H0 is rejected, and the correlation between the two variables is significant. Otherwise, the two variables are not correlated. The specific approaches are as follows.
First, a pair of arrays that conform to the normal distribution with sample sizes of n are randomly generated, and the Pearson correlation coefficient between them is calculated.
Second, the first step is repeated 15,000 times, and the obtained correlation coefficients are sorted in descending order. The 5000th correlation coefficient (1-α) is found and marked as r1-α.
Third, the actual correlation coefficient |r| and the r1-α are compared. If |r| > r1-α, the two variables are correlated. Otherwise, they are not correlated.
We used this method to analyze the relationships between jet stream (200 hPa zonal wind) and surface meteorological elements (humidity, temperature, meridional wind and zonal wind), as well as the relationships between surface pollutants (PMs and O3) and surface meteorological variables (humidity, temperature, meridional wind and zonal wind). The Monte Carlo method is also used to test whether the correlation is significant [25].

2.3. Relevant Definitions of the East Asian Upper-Level Jet

In this study, the area with the westerly wind speed greater than 30 m·s−1 at 200 hPa in East Asia (70–140° W, 15–55° N) is defined as the East Asian upper-level jet. The position of the East Asian upper-level jet is defined as the latitude of the maximum westerly wind speed at 200 hPa in East Asia. The intensity of the East Asian upper-level jet is defined as the average wind speed on the jet stream axis. Figure 1 shows the average climate state of the 200 hPa jet stream axis in summer from 1989 to 2018. The position of the 200 hPa jet stream in summer is around 40° N with relatively large interannual fluctuations.

3. Results

3.1. Characteristics of the East Asian Upper-Level Jet and Surface Pollutants in Summer

3.1.1. Spatio-Temporal Characteristics of the East Asian Upper-Level Jet in Summer

The monthly average data of 200 hPa zonal wind in summer over East Asia from 2009 to 2018 are selected, and the spatio-temporal decomposition is carried out based on the data. The covariance contribution rates of the first two modes of the EOF (hereafter referred to as EOF1 and EOF2, respectively) decomposition results (Figure 2) are 57.54% and 8.78%, respectively. The spatial distribution of the EOF1 shows that the dividing line of the 200 hPa zonal wind is around 40° N, which is the average position of the upper-level jet stream in summer. The variations in the north and the south are opposite, which shows that the EOF1 represents the position variation in the upper-level jet stream. In the time series corresponding to the EOF1, the time coefficients are all negative in June during 2009–2018, while the time coefficients are both positive in July and August in the same years. This indicates that the position of the jet stream in June in this decade is to the south of that in July and August in the same years. The spatial distribution of the EOF2 of the 200 hPa upper-level zonal wind shows that there is a minimum area centered around 40° N, which is the average position of the upper-level jet stream in summer. Therefore, the EOF2 represents the intensity variation in the upper-level jet stream.

3.1.2. Distribution Characteristics of Surface Pollutants in East Asia in Summer

The average concentrations of the NO2, PM10, O3 (the maximum concentration in 8 h) and PM2.5 in summer from 2013 to 2018 are shown in Figure 3. Combined with the first-level concentration indices of pollutants in the Ambient Air Quality Standards (GB 3095–2012), it can be seen that the overall NO2 concentration in summer in China is within the normal standard range. There is relatively serious PM pollution in the Tarim Basin (37–42 ° N, 75–90 ° E) and most parts of northern China. The O3 concentration is relatively high in northern China and most areas of Qinghai-Tibet. The O3 pollution in the North China Plain (35–40° N, 113–123° E) is the most serious. Therefore, the PM10 and PM2.5 in the Tarim Basin and the PM10, O3, and PM2.5 in the North China Plain are taken as the research objects of summer pollutants in this study.
In summer during 2013–2018, the average concentrations of the PM2.5 and PM10 in the Tarim Basin are 45.19 and 49.08 μg·m−3 (Table 1), respectively. The interannual variations of the PM concentration increased year by year before 2015 and decreased after 2015. The PM concentration reached the maximum in 2015, and many discrete values in 2018 indicate that severe PM pollution events occurred frequently in that year (Figure 4a,b). In Figure 5a, the days with the PM2.5 exceeding the standard are more than those of the PM10 in summer in the Tarim Basin with a total of 265 and 193 days during 2013 to 2018, respectively. The ratio of PM2.5 to PM10 in this area is high with an average of approximately 0.9 (Figure 7). The ratio of the PM2.5 to PM10 reaches a high value in 2013 and 2014 with the maximum reaching 1, but the ratio declines in subsequent years and maintains at around 0.85 (Figure 6a).
The average concentrations of the three pollutants of the PM2.5, PM10 and O3 in the North China Plain in the summer during 2013–2018 are 45.09, 70.28 and 131.27 μg·m−3 (Table 1), respectively. The days with concentrations exceeding the standard reach 401, 461 and 488, respectively, and the days with the PM10 exceeding the standard are more than those of the PM2.5 (Figure 5b). Figure 4c–e show that the PM concentrations in the North China Plain show decreasing trends, while the O3 concentration shows an increasing trend. The average ratio of the PM2.5 to PM10 in this area is approximately 0.65, and the ratio shows a decreasing trend (Figure 6 and Figure 7).

3.2. Relationship between the East Asian Upper-Level Jet and Surface Pollutants in Summer

3.2.1. Preliminary Analysis of the Relationship between the East Asian Upper-Level Jet and Surface Pollutants in Summer

According to the analysis results in Section 3.1.1, it can be concluded that there is an intraseasonal northward shift of the jet stream position in summer during 2013–2018. Therefore, the impact of the East Asian upper-level jet on pollutants in each month in summer is discussed separately. The temporal average of the monthly 200 hPa zonal wind and the pollutant concentration, including the PM10, O3, and PM2.5, in the summer during 2013–2018 are calculated. Figure 8 shows that the average position of the upper-level jet stream in June is around 40° N, and the average central wind speed is higher than 39 m·s−1. The average positions of the upper-level jet stream in July and August are around 45° N. The average wind speeds of the jet stream centers in July and August are approximately 31 and 35 m·s−1, respectively. The above results show that the upper-level jet stream has an obvious northward jump in summer, which is consistent with the EOF analysis result. The intensity of the upper-level jet stream in summer is the strongest in June and the weakest in July.
In addition, the pollutants in the North China Plain in June locate near the left side of the entrance region of the upper-level jet stream (Figure 8a,d). Combined with the atmospheric meridional vertical circulation in June (Figure 9a), it can be seen that the North China Plain, locating near 32–40° N, is dominated by the descending motion in the left side of the entrance region of the upper-level jet stream between 850 and 300 hPa, while there is a weak ascending motion below 850 hPa, the average vertical velocity in North China Plain in June from Table 2 can also prove this. It indicates that the atmospheric stratification over the North China Plain is relatively stable in June, which is conducive to the pollutant accumulation. The 1000 hPa surface wind during the same period (Figure 8g) shows that the pollutants from southern China are transported to the North China Plain due to the large-scale southerly wind. The low wind speed in the North China Plain is not conducive to the pollutant diffusion in the region. Therefore, the pollutant concentrations are high in the North China Plain in June including PM10, O3 and PM2.5.
Combined with Table 2, in July and August, the North China Plain is located near the right side of the exit region of the upper-level jet stream over the Sea of Japan. It is dominated by the ascending motion caused by the upper-level jet stream, which makes pollutants, including PM10, O3 and PM2.5, diffuse in the vertical direction to a certain extent in the North China Plain, and the surface concentration is lower than that in June. However, the surface wind speed in the North China Plain is relatively low, and the horizontal diffusion of pollutants is relatively hard. Therefore, the pollution in the North China Plain in July and August is still serious.
The Tarim Basin has a special topography. Except for the Hexi Corridor to the east, the north, west and south sides are all surrounded by high mountains with an average altitude of more than 5000 m [26,27]. Throughout the summer, the Tarim Basin locates at the right of the entrance region of the upper-level jet stream dominated by the ascending motion caused by the upper-level jet stream (Table 2). However, Figure 9b–e indicate that the ascending motion above 700 hPa is very weak, and the air vertical movement is not enough to carry the surface PM10 and PM2.5 away from the basin. Meanwhile, the Tarim Basin is dominated by the easterly wind, and the surface wind speed is relatively low in summer. The horizontal diffusion of pollutants is hindered by the surrounding mountains (Figure 8g–i). Therefore, the pollutant concentrations including PM2.5 and PM10 are high in summer in the Tarim Basin.
The above analyses show that there is a connection between the summer jet stream and surface pollutants.

3.2.2. Relationship between the Surface Pollutants and the Position and Intensity of the East Asian Upper-Level Jet in Summer

The SVD method is used to further analyze the relationship between the East Asian upper-level jet and surface pollutants in summer. The sum of the cumulative covariance contribution of the first two modes of the SVD (hereafter referred to as SVD1 and SVD2, respectively) of the surface O3 concentration and the 200 hPa zonal wind in summer is 88.46%. The sum of the square of the explained total covariance of the SVD1 is 81.35%, and the correlation coefficient of the time series of the left and right fields is 0.96, showing the synchronized variation in the two fields. In Figure 10e,f, when the time coefficients of the left and right fields are both positive, there are positive anomalies of the O3 concentration in the North China Plain in the left field. The dividing line in the right field is about 40°N, which is the average position of the East Asian upper-level jet axis in summer, and the north and south regions of the 200 hPa zonal wind show positive anomalies and negative anomalies, respectively. That is, the position of the upper-level jet stream is more southward when the surface O3 concentration is higher in the North China Plain, and vice versa. Moreover, the spatial distribution of the right field heterogeneous correlation of this mode is similar to that of the EOF1 of the 200 hPa zonal wind. Therefore, the SVD1 of the surface O3 concentration and 200 hPa zonal wind represents the relationship between the surface O3 and the position of the East Asian upper-level jet.
For the SVD2 of the O3 concentration and 200 hPa zonal wind in summer, the sum of the square of the explained total covariance is 7.31%, and the correlation coefficient of the time series of the left and right fields is 0.94, showing the synchronized variation relationship. The spatial distribution of the left field heterogeneous correlation is similar to that of the EOF2 of the 200 hPa zonal wind. Therefore, the left and right fields heterogeneous correlation of the SVD2 represents the relationship between the surface O3 and the intensity of the East Asian upper-level jet. However, their relationship is not significant in the North China Plain (Figure 11e,f).
Therefore, there may be a certain relationship between the surface O3 concentration in the North China Plain in summer and the position of the East Asian upper-level jet, but the relationship with the intensity of the upper-level jet stream is not significant.
Since the SVD results of the 200 hPa zonal wind and the surface PM10 and PM2.5 concentrations are similar in summer, the relationship of the 200 hPa zonal wind with the PM10 and that with the PM2.5 are discussed together. For the SVD1 and SVD2 of the 200 hPa zonal wind and the PM10 and PM2.5, the sums of the cumulative covariance contribution are 86.39% and 85.06%, respectively. The sum of squares of the explained total covariance of the SVD1 are 71.13% and 71.76%, respectively. The correlation coefficients of the time series of the left and right fields are 0.96 and 0.84, respectively, showing the synchronized variation relationship. The slashes in Figure 10a–d show that, when the anomalies of the PM10 and PM2.5 concentrations in the North China Plain in the left field are negative, the dividing line of the 200 hPa zonal wind in the right field is about 40°N, which is the average position of the East Asian upper-level jet axis in summer, and the north and south regions show negative anomalies and positive anomalies, respectively. That is, the position of the East Asian upper-level jet is more northward when the concentrations of the PM10 and PM2.5 are low in the North China Plain, and vice versa. Moreover, the spatial distribution of the left-field heterogeneous correlation of this mode is similar to that of the EOF1 of the 200 hPa zonal wind. Therefore, the surface PM10 and PM2.5 concentrations are associated with the position of the East Asian upper-level jet.
For the SVD2 of the 200 hPa zonal wind and the PM10 and PM2.5 surface concentration in summer, the sum of squares of the explained total covariance are 15.26% and 13.30%, respectively. The correlation coefficients of the time series of the left and right fields are 0.91 and 0.83, respectively, presenting the synchronized variation relationship. The slashes in Figure 11a–d show that when the anomalies of the PM10 and PM2.5 concentrations in the Tarim Basin in China are negative, there is a negative anomalous region of the 200 hPa zonal wind centered around 40° N, which corresponds to the average position of the East Asian upper-level jet in summer. That is, the intensity of the East Asian jet stream is low (high) when the PM10 and PM2.5 concentrations are high (low) in the Tarim Basin. The spatial distribution of the right field heterogeneous correlation of this mode is similar to that of the EOF2 of the 200 hPa zonal wind. Therefore, the left and right fields heterogeneous correlation of the SVD2 represents the relationship between the surface concentrations of the PM10 and PM2.5 and the intensity of the East Asian upper-level jet.
By comparing the significance of the heterogeneous correlation diagrams of the first and second modes, we found that the anomalous PM10 and PM2.5 concentrations in summer over the North China Plain may have a certain relationship with the position variation in the East Asian upper-level jet, but the relationship with the intensity anomaly of the upper-level jet stream is not significant. The anomalous surface PM10 and PM2.5 concentrations in the Tarim Basin may have a certain relationship with the intensity anomaly of the East Asian upper-level jet, but the relationship with the position variation in the upper-level jet stream is not significant.
In summary, there is a certain relationship between the movement of the East Asian upper-level jet in summer and the variations of the three pollutants’ concentrations, including PM10, PM2.5 and O3, in the North China Plain. When the position of the East Asian upper-level jet is more northward, the concentrations of the PM10, PM2.5 and O3 in North China Plain are significantly lower, and vice versa. There is a connection between the intensity variation in the East Asian upper-level jet in summer and the concentration variations of the PM10 and PM2.5 in the Tarim Basin. When the intensity of the East Asian upper-level jet is relatively high, the concentrations of the PM10 and PM2.5 in the Tarim basin are both low, and vice versa.

3.3. Preliminary Analyses of the Interaction Mechanism between the Summer Jet Stream and Pollutants

The East Asian upper-level jet has a three-dimensional structure, and a series of secondary circulations are generated around the upper-level jet stream, which are associated with surface pollutants. The idea of using statistical methods to study the interaction between them is to find out the medium existing in the interaction between them. That is, to find out the surface meteorological variable that connects to the upper-level jet stream and then interacts with surface pollutants. Due to the exchange of the energy, matter and momentum between the upper-level jet stream and the surface, the surface meteorological variables, such as the humidity, temperature, zonal wind and meridional wind, are selected in the study. The correlation analysis method is used to explore the relationships between the upper-level jet stream and the surface meteorological variables including the humidity, temperature, surface zonal wind and surface meridional wind as well as the relationships between the surface meteorological variables and the surface pollutants.

3.3.1. Relationship between the Summer Jet Stream and Surface Meteorological Variables

According to the analyses in Section 3.1.1, it can be concluded that the EOF1 of the 200 hPa zonal wind in the summer from 2013 to 2018 represents the position variation in the summer jet stream. The correlation analysis between the time series of the EOF1 and the surface meteorological variables in the corresponding period can be regarded as the correlation analysis between the position of the upper-level jet stream and the surface meteorological variables in summer. Figure 12 shows that, in the North China Plain, the position of the East Asian upper-level jet in summer has significant positive correlations with the surface humidity and temperature and negative correlations with the surface meridional and zonal wind. In the Tarim Basin, the position variation in the East Asian upper-level jet in summer is significantly positively correlated with the humidity and temperature and negatively correlated with the surface zonal wind. However, the position variation in the East Asian upper-level jet is positively correlated with the surface meridional wind in a small region in the western part of the Tarim Basin, and there is a negative correlation between them in the eastern part of the Tarim Basin.
Combined with the spatio-temporal distribution of the first mode of the 200 hPa zonal wind, it can be said that when the position of the East Asian upper-level jet is more northward, the surface humidity and temperature in North China Plain are higher, and the surface meridional wind and zonal wind are weaker. The surface humidity and temperature in the Tarim Basin are higher, and the surface zonal wind is weaker. The surface meridional wind in the west part of the Tarim Basin is stronger, and weaker in the east part, and vice versa.
The EOF2 of the 200 hPa zonal wind in summer from 2013 to 2018 represents the intensity variation in the summer jet stream. The correlation analyses between the time series of the EOF2 and the surface meteorological variables in the corresponding period represent the relationship between the intensity of summer upper-level jet stream and the surface meteorological variables. In Figure 13, the intensity of the East Asian jet stream is proportional to the surface temperature in the North China Plain, while it is insignificantly related to the surface humidity, meridional wind and zonal wind. In the Tarim Basin, the intensity of the East Asian upper-level jet has a significantly negative correlation with the surface humidity in the northern region, a significantly positive correlation with the surface temperature in the whole area and a significantly negative correlation with the surface zonal wind in the eastern region, but its relationship with the surface meridional wind is insignificant.
According to the spatio-temporal distribution of the second mode of the 200 hPa zonal wind, when the intensity of the East Asian upper-level jet is weaker, the surface temperature in the North China Plain is higher, the surface humidity in the northern Tarim Basin is lower, the surface temperature in the region is higher and the surface zonal wind in the eastern part of the basin is weaker, and vice versa.

3.3.2. Relationship between Pollutants and Surface Meteorological Variables in Summer

The correlation coefficients of the surface pollutants including PM10, O3 and PM2.5 with the daily average data of surface meteorological variables in summer from 2013 to 2018 are shown in Figure 14. The PM10, O3, and PM2.5 in the North China Plain are negatively correlated with the surface humidity and are significantly positively correlated with the surface temperature, zonal wind and meridional wind. However, the significant regions of the correlations between different pollutants and meteorological variables are different. The PM2.5 has a significantly negative correlation with the humidity only in the southern part of the North China Plain. The PMs maintain significant positive correlations with the surface temperature only in the northern and southeastern parts of the North China Plain. In addition, these three pollutants are significantly negatively correlated with the surface zonal wind in different areas in the east parts of the North China Plain. That is, when the pollutant concentrations in the North China Plain are higher (lower), the surface humidity in the certain region is lower (higher) correspondingly, the temperature is higher (lower), and the zonal wind and the meridional wind are stronger (weaker).
Both the PM10 and PM2.5 in the Tarim Basin have good heterocorrelations with the surface humidity and zonal wind, and the PMs are significantly positively correlated with the surface temperature only in the west part of the Tarim Basin and have significant negative correlations with the surface meridional wind in the south part of the Tarim Basin. That is, when the concentrations of the PM10 and PM2.5 in the Tarim Basin are higher (lower), the surface humidity in the region is lower (higher) and the zonal wind is weaker (stronger). The surface temperature in the west part of the region increases (decreases) and the surface meridional wind in the south part of the region weakens (strengthens).
The summer months of 2013–2018 could be divided into the southerly jet month and the northerly jet month, as well as the stronger and weaker jet months according to the time series of the first and second modes of the 200 hPa zonal wind in summer of 2013–2018. In the light of the four classification results, the pollutant concentrations in different jet months in both the North China Plain and Tarim Basin are calculated as shown in Table 3. It can be seen from Table 3 that the concentrations of PM2.5, PM10 and O3 in the North China Plain can reach 48.09, 75.37, and 141.70 μg·m−3, respectively, when the East Asian jet shifts southward. These loadings are much higher than their seasonal means in summer of 2013–2018. The average concentration of PM2.5, PM10 and O3 in the North China Plain can reach 41.54, 64.5 and 125.01μg·m−3, respectively, when the East Asian jet shifts northward, which is lower than their seasonal means in summer of 2013–2018.
The concentrations of PM2.5 PM10 in the Tarim Basin can reach 36.30 and 38.88 μg·m−3, respectively, when the intensity of the East Asian jet is relatively stronger. These loadings are lower than their seasonal means in summer of 2013–2018. The concentrations of PM2.5 and PM10 in the Tarim Basin can reach 53.24 and 59.04 μg·m−3, respectively, when the intensity of the East Asian jet is weaker, which are higher than their seasonal means in summer of 2013–2018.
Combined with the analyses in Section 3.2.2, it can be concluded that the position of the upper-level jet stream in summer may be related to the PM10, O3 and PM2.5 due to the effects of the surface humidity and the meridional and zonal wind in the corresponding region of North China Plain. When the position of the upper-level jet stream in summer is more northward, the surface humidity is higher, and the meridional and zonal wind is stronger. At this time, the concentrations of three pollutants in North China are all lower, and vice versa. The intensity of the East Asian upper-level jet in summer may have correlations with the PM10 and PM2.5 due to the interaction with the surface humidity in the northern part of the Tarim Basin, the surface temperature in the western part, and the surface zonal wind in the eastern part. When the intensity of the East Asian upper-level jet is weaker, the humidity in the northern part of the region is lower, the temperature in the western part is higher, and the zonal wind in the eastern part is weaker. At this time, the concentrations of surface PMs are higher, and vice versa.

4. Conclusions and Discussion

Based on the NCEP/NCAR daily wind and vertical velocity data, as well as the surface pollutants and meteorological variables data derived from the Science Data Bank, statistical analysis methods were used to study the relationships between the East Asian upper-level jet and the high concentration areas of near-surface air pollutants in summer in this study, and the interaction mechanisms between them are preliminarily discussed. The conclusions are as follows.
(1)
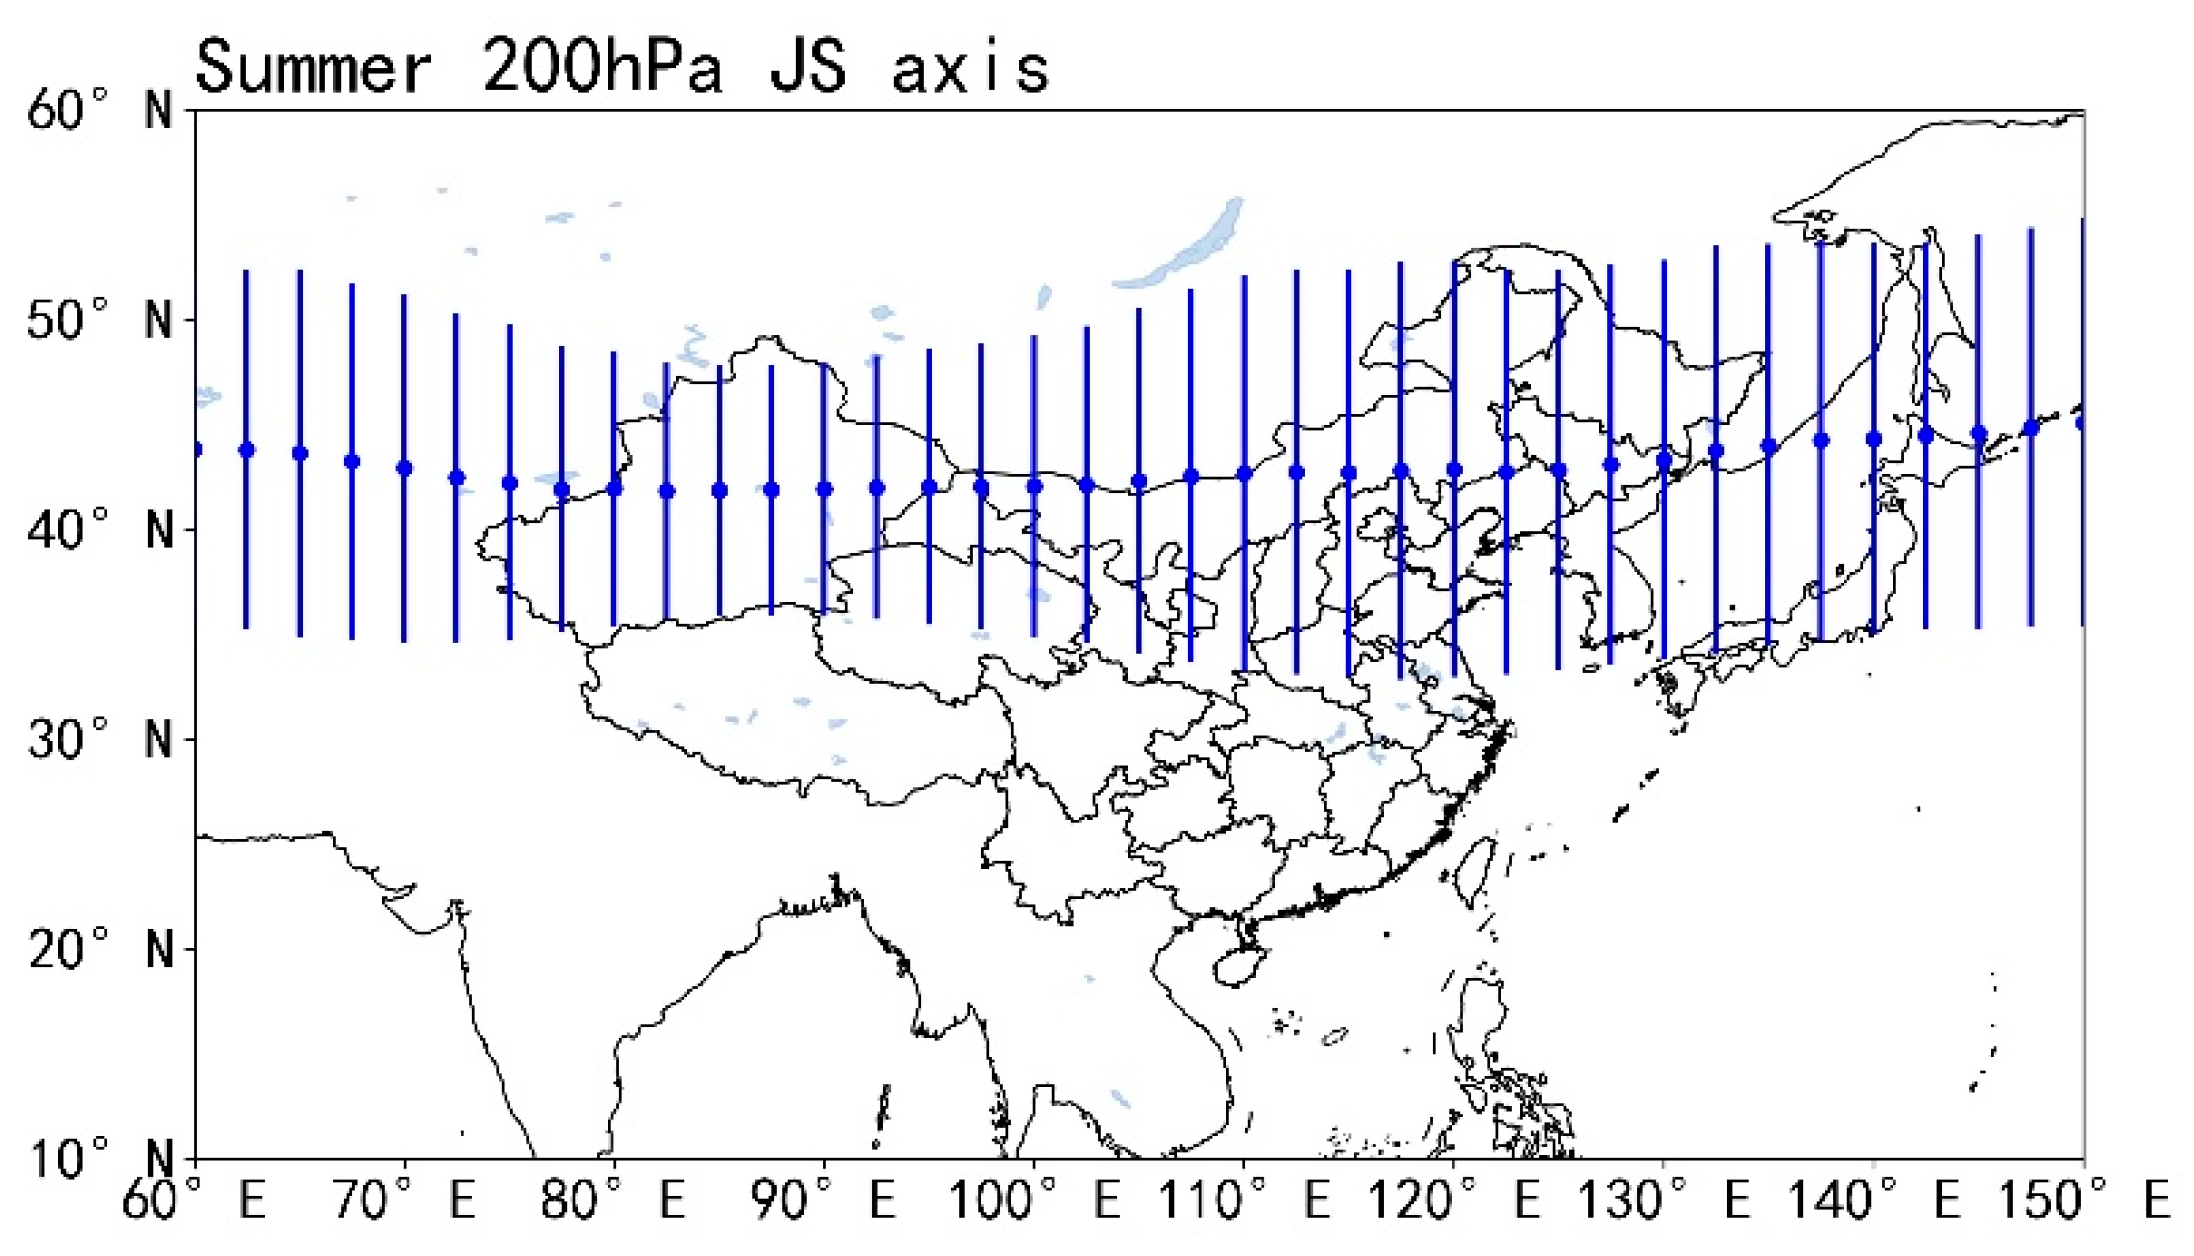
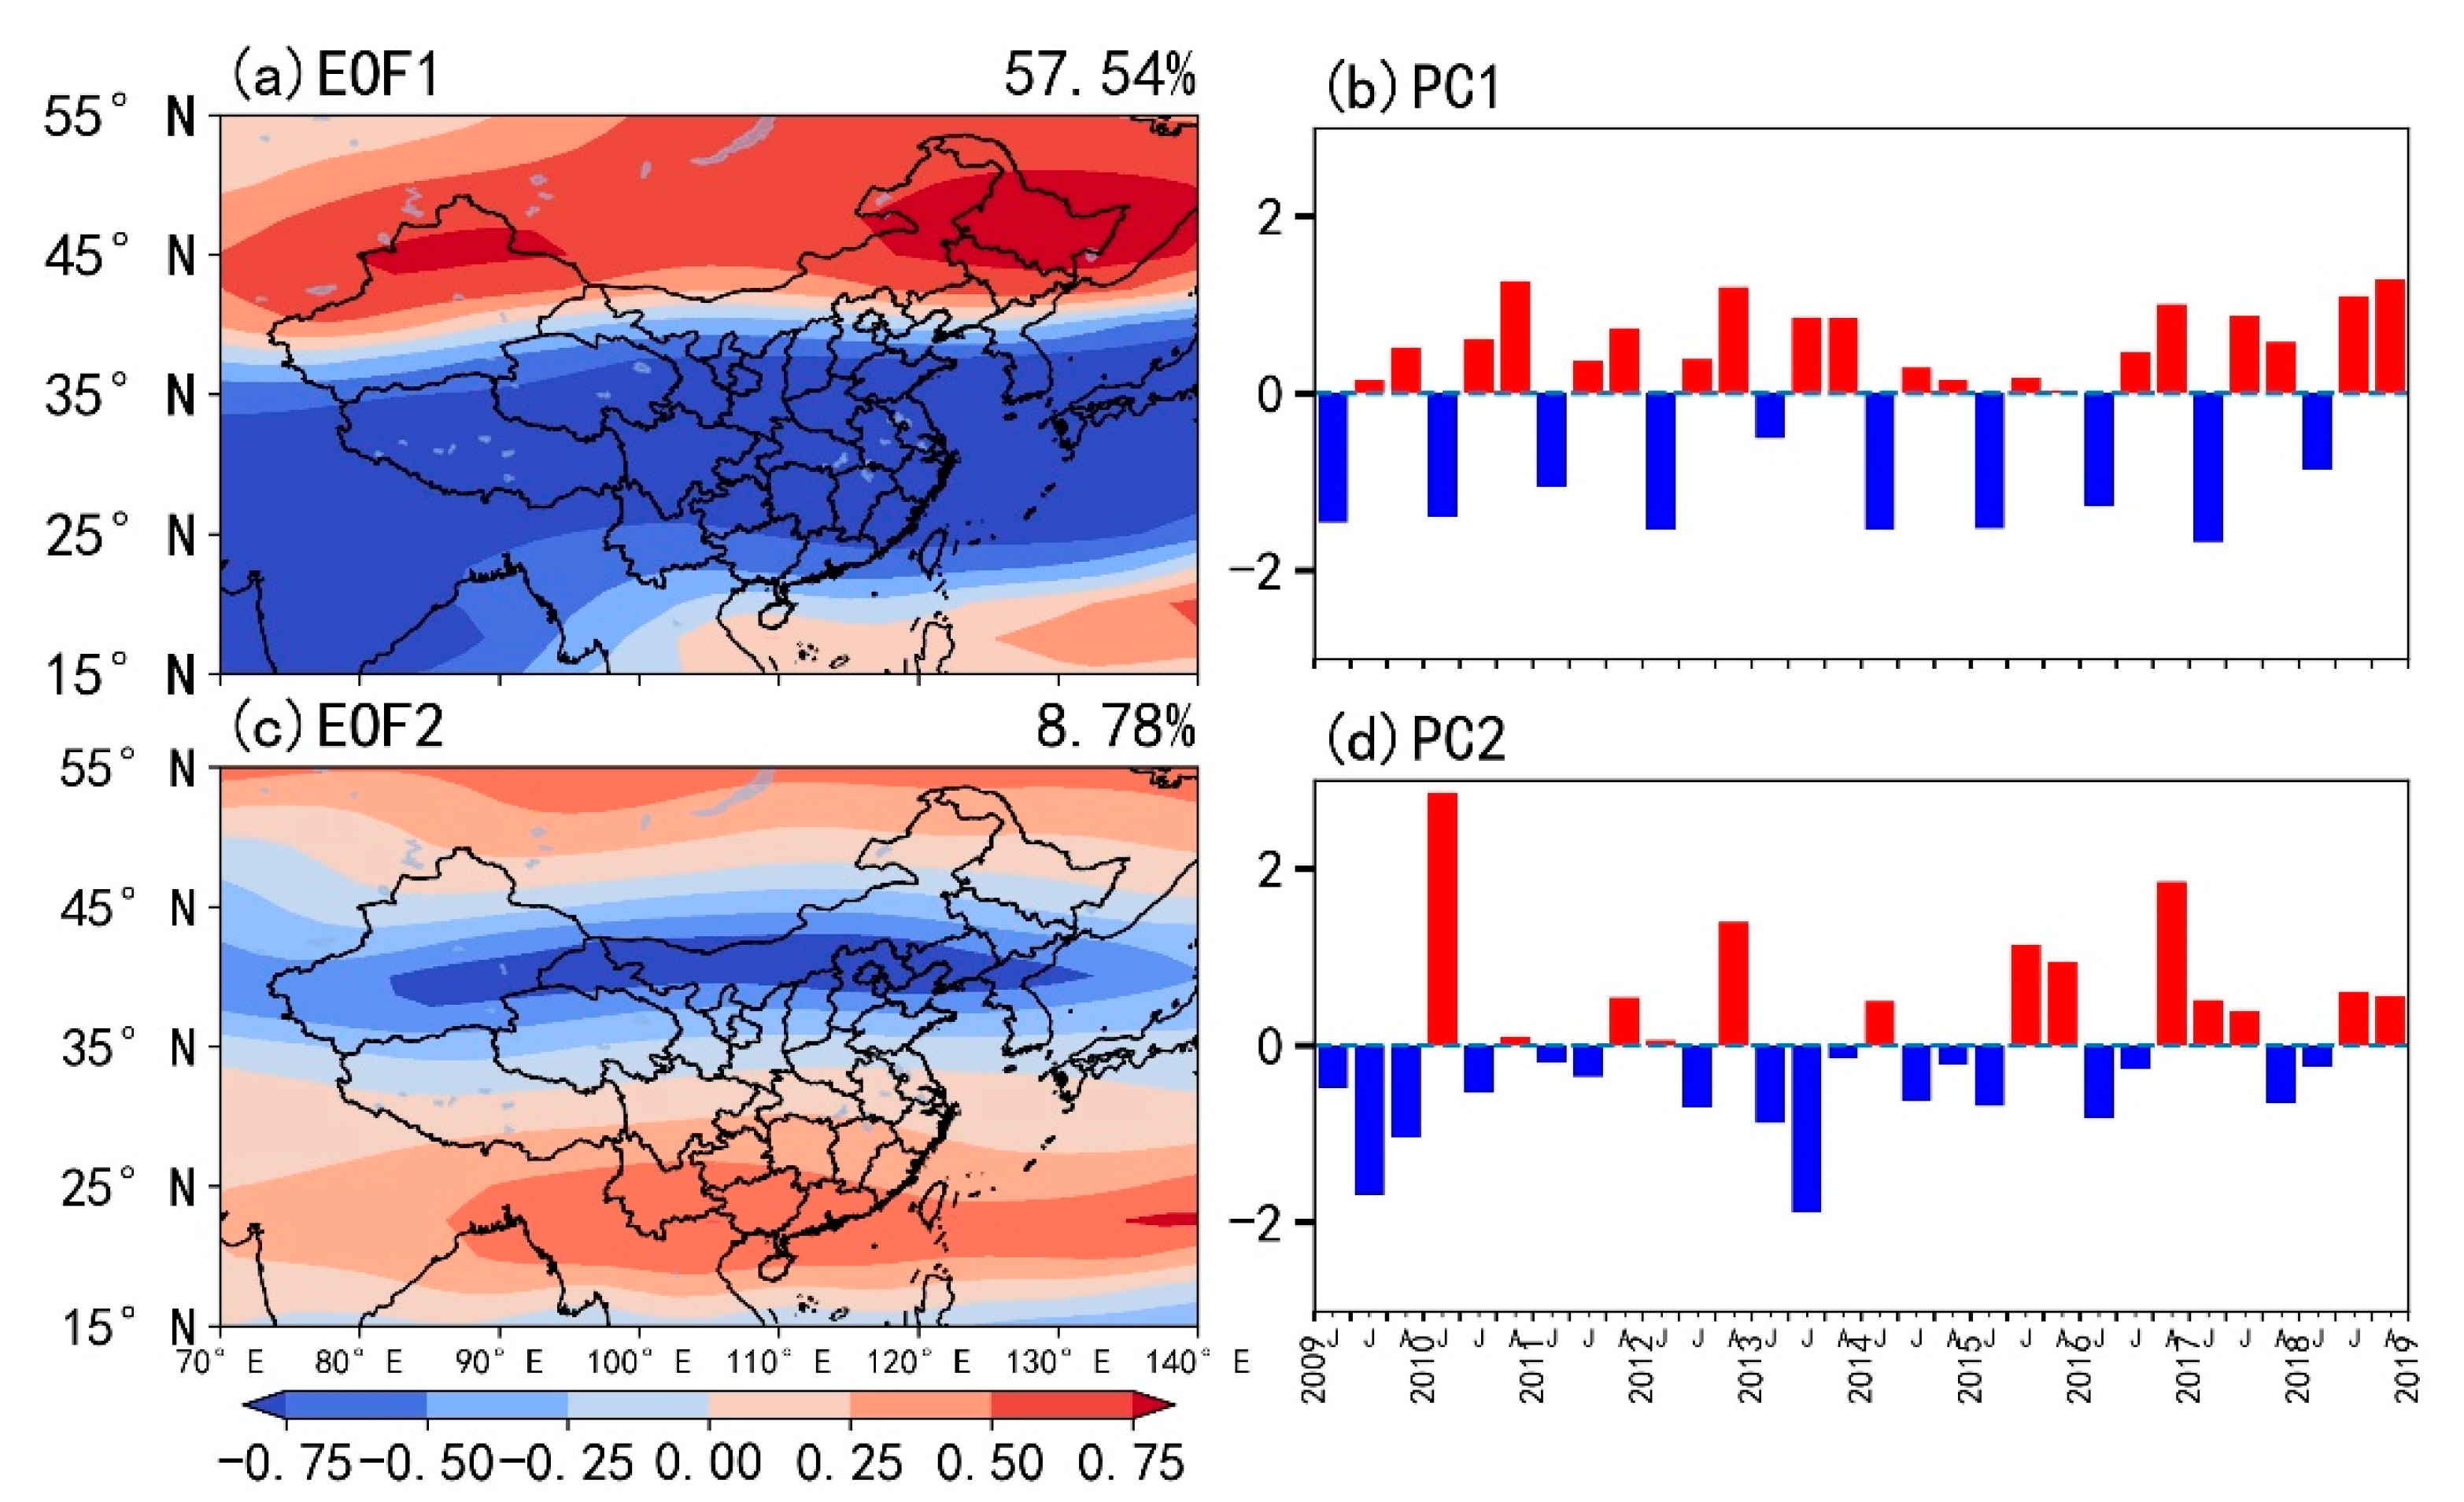
In summer, the average position of the East Asian upper-level jet axis is around 40° N. The EOF1 of the 200 hPa zonal wind in East Asia represents the position variation in the East Asian upper-level jet in summer. The corresponding time coefficient diagrams show that the position of the East Asian upper-level jet has a northward jump in summer. The EOF2 reflects the intensity variation in the East Asian upper-level jet in summer.
(2)
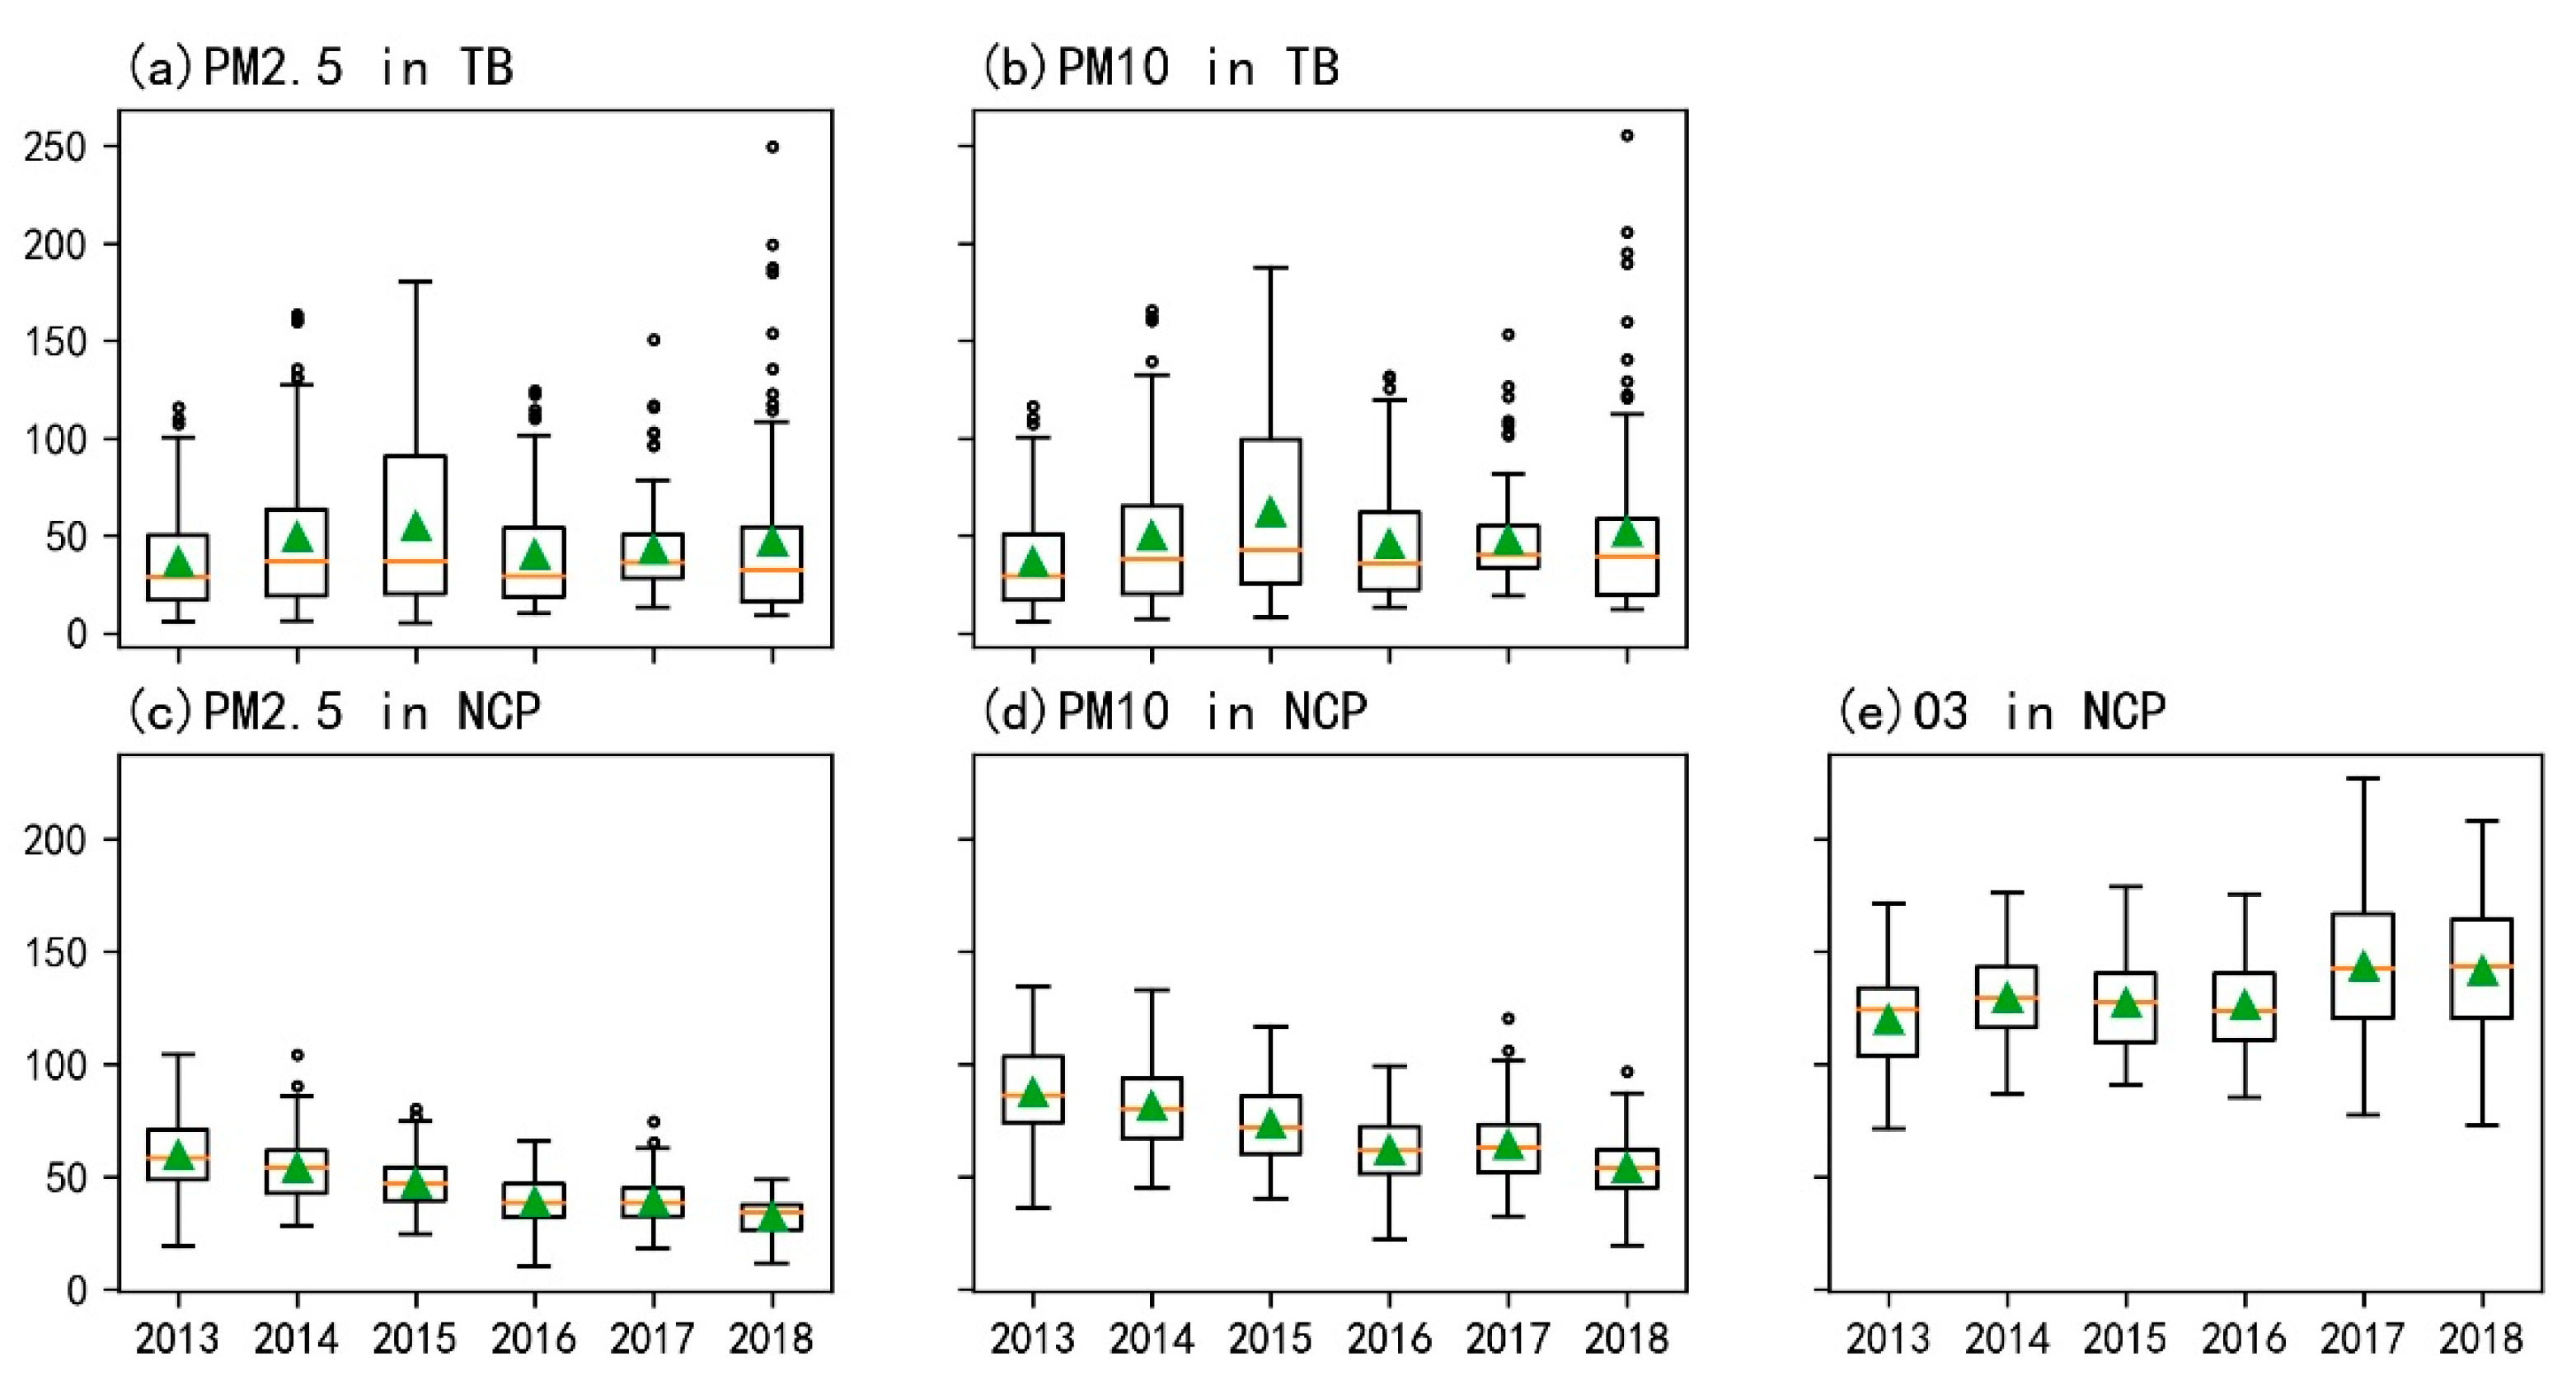
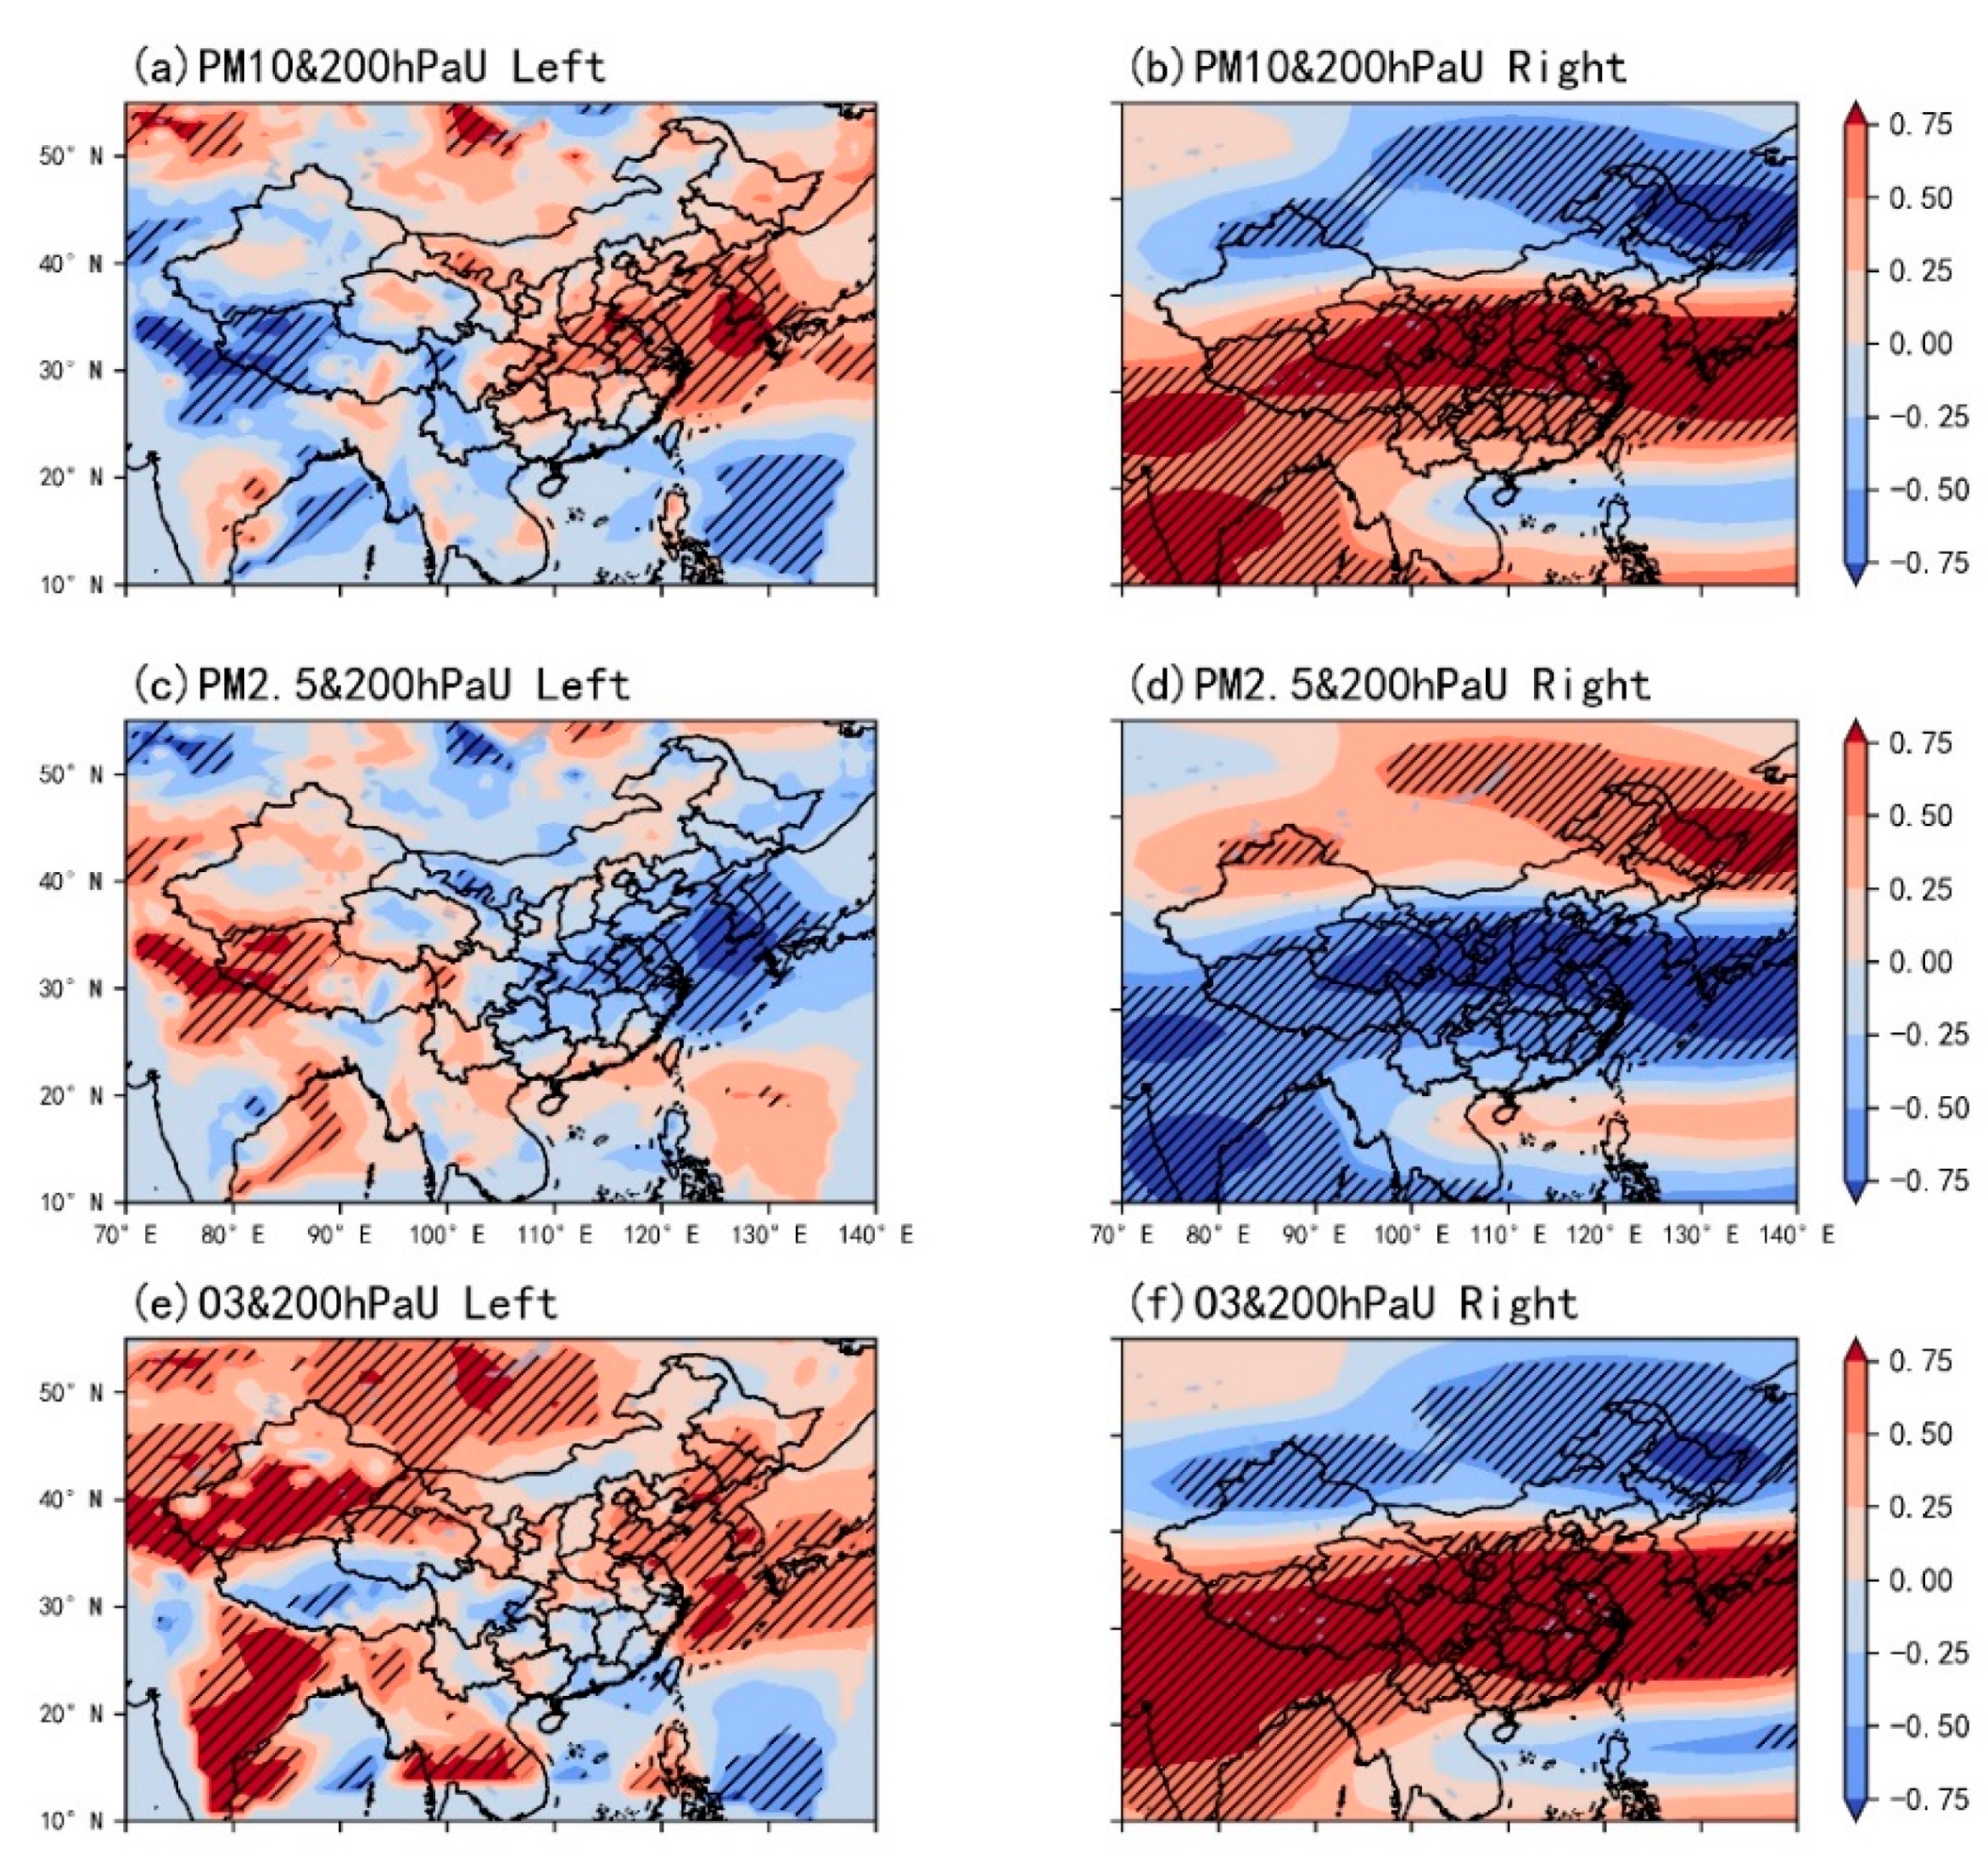
In the summer, pollutants concentrate in the North China Plain and Tarim Basin. The PM2.5, PM10 and O3 are the main pollutants in the North China Plain with the average concentrations of 45.09, 70.28 and 131.27 μg·m−3, respectively. The days with concentrations exceeding the standard are 401, 461 and 488, respectively. The O3 concentration has an increasing trend during this period, while the PM concentration has a decreasing trend. The average ratio of the PM2.5 to PM10 is approximately 0.65, and the ratio shows a descending trend. The main pollutants in the Tarim Basin are the PM2.5 and PM10 with average concentrations of 45.19 and 49.08 μg·m−3, respectively. The days with concentrations exceeding the standard are 265 and 193, respectively. The interannual variation in PM concentration shows an increasing trend at first and then a decreasing trend. The average ratio of PM2.5 to PM10 in this region is about 0.9. The ratio reaches the highest in 2013 and 2014 and then decreases to and maintains at about 0.85. In June, the North China Plain locates on the left side of the upper-level jet stream entrance region, which is dominated by descending motions. The surface wind speed is relatively low, which is not conducive to the pollutant diffusion, resulting in high concentrations of pollutants, including the PM10, O3 and PM2.5. In July and August, the North China Plain locates near the right side of the upper-level jet stream exit region, and there are mainly ascending motions in the vertical direction, which lead to the lower concentrations of pollutants including the PM10, O3 and PM2.5 in July and August than those in June. However, the surface wind speed is low, and the pollutants are not effectively diffused, so the concentrations of the PM10, O3 and PM2.5 are still higher. Throughout the summer, the Tarim Basin locates on the right side of the upper-level jet stream entrance region. There are mainly ascending motions in the vertical direction caused by the upper-level jet stream, and there is mainly easterly wind in the horizontal direction. However, due to the special terrain of the Tarim Basin, the diffusion process of the PM10 and PM2.5 in horizontal and vertical directions is blocked, resulting in higher concentrations of the PM10 and PM2.5 in this region.
(3)
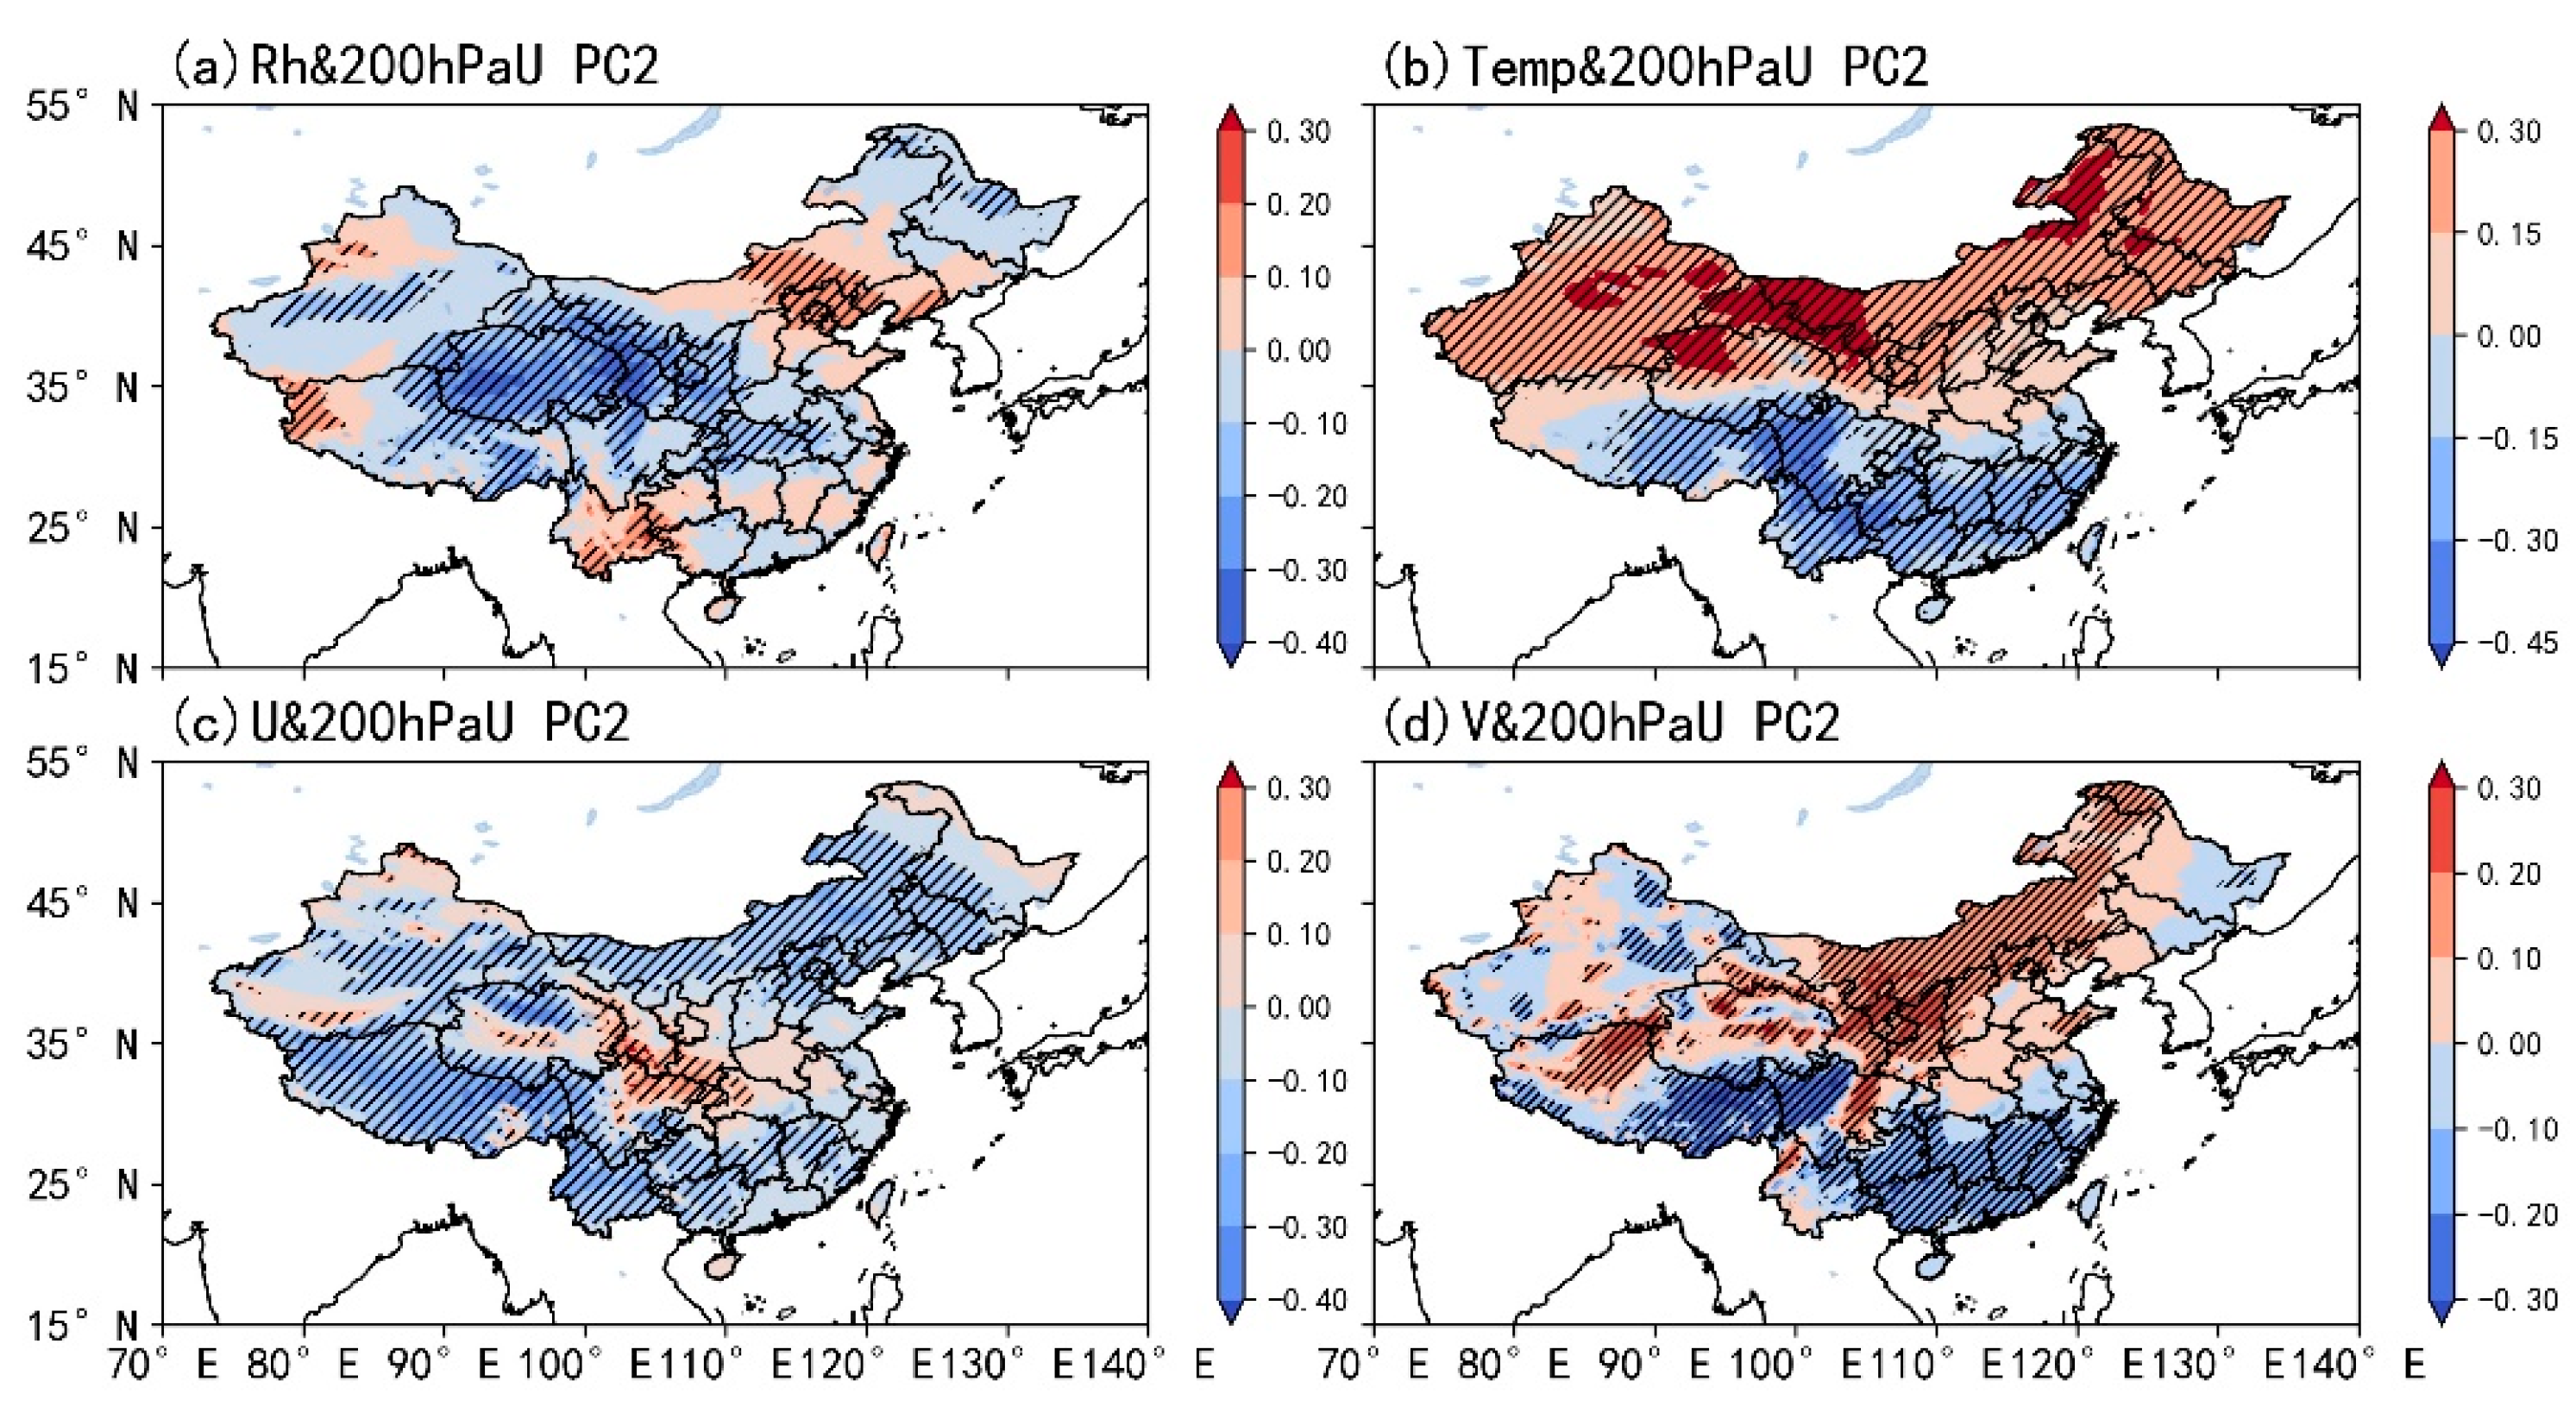
The analysis results on the relationship between upper-level jet stream and air pollutants in East Asia indicate that the position of the upper-level jet stream in summer may be related to the PM10, O3 and PM2.5 due to the effects of the surface humidity and the meridional and zonal wind in the corresponding region of the North China Plain. When the position of the upper-level jet stream is more northward in summer, the surface humidity is higher and the meridional and zonal wind is weaker. At this time, the concentrations of the three pollutants in North China are all lower, and vice versa. Meanwhile, the intensity of the East Asian upper-level jet may have correlations with the PM10 and PM2.5 due to the interaction with the surface humidity in the northern part of the Tarim Basin, the surface temperature in the western part, and the zonal wind in the eastern part. When the intensity of the East Asian upper-level jet is weaker, the humidity in the northern part of the region is lower, the temperature in the western part is lower, the surface zonal wind in the eastern part is weaker and the PM concentration in the Tarim Basin is higher, and vice versa.
Chen et al. [17] used CESM and indicated that the regional anthropogenic aerosol caused the 200 hPa jet stream to weaken and shift southward over East Asia in summer. which is in agreement with our results, despite the different kind of aerosol. Wang et al. [28] found that the sand-dust weather often occurred in Taklimakan Desert in spring and summer. The dust particle also had an influence on the summer atmospheric boundary layer structure in Taklimakan Desert. This result can imply that the upper level jet stream has a connection with surface pollutants in Tarim Basin to some extent. Results here also show some connections between the jet and surface air pollutants in summer. Kerr et al. [21] used the global model to study the influence of the upper-level jet stream position on the surface zonal wind and meridional wind in the mid-latitude region of the northern hemisphere in summer. Their results showed that the influence of the upper-level jet stream position on the surface zonal wind mainly occurred over the sea, while its impact on the surface meridional wind occurred over both the sea and the land. Their finding is slightly different from the conclusion of this paper. The possible reason might be that the range of the study area is different. Further investigations are needed based on the regional numerical models to identify the difference.
In this study, the interactions between meteorological variables and pollutants in the vicinity of pollutant regions are not considered when analyzing the relationships between the concentrations of near-surface air pollutants and meteorological variables. In addition, the research conclusions are all obtained based on statistical methods. The rules revealed in the conclusions and the complex interaction mechanisms between the East Asian upper-level jet and surface pollutants require further verification and exploration based on the numerical models.

Author Contributions

Conceptualization, W.W., B.Z. and Y.S.; software, W.W., H.L. and Y.G.; validation, W.W., B.Z. and T.W.; formal analysis, W.W. and H.C.; writing—original draft preparation, W.W.; writing—review and editing, B.Z.; supervision, B.Z. All authors have read and agreed to the published version of the manuscript.

Funding

This research was funded by the National Key R&D Program of China, the National Natural Science Foundation of China and the Fundamental Research Funds for the Central Universities (2019YFA0606803, 42075099, 0207-14380169, 41675143, 42077192, 41621005).

Institutional Review Board Statement

Not applicable.

Informed Consent statement

Not applicable.

Data Availability Statement

The high-resolution air pollution and the surface meteorological variables reanalysis dataset in China during 2013–2018 and are available here: [https://www.scidb.cn/en/detail?dataSetId=696756084735475712&dataSetType=personal] (accessed on 2 June 2021). The NCEP/NCAR reanalysis data can be found here: [https://psl.noaa.gov/data/gridded/data.ncep.reanalysis.html] (accessed on 2 June 2021).

Acknowledgments

We thank Nanjing Hurricane Translation for reviewing the English language quality of this paper. This work was supported by the National Key R&D Program of China, the National Natural Science Foundation of China and the Fundamental Research Funds for the Central Universities (2019YFA0606803, 42075099, 0207-14380169, 41675143, 42077192, 41621005).

Conflicts of Interest

The authors declare that they have no competing interests.

References

  1. IPCC. Climate Change 2013: The Physical Science Basis: Working Group I Contribution to the Fifth Assessment Report of the Intergovernmental Panel on Climate Change; Cambridge University Press: Cambridge, UK, 2014; ISBN 978-1-107-05799-9. [Google Scholar]
  2. Ding, Y.H.; Li, Q.P.; Liu, Y.J.; Zhang, L.; Song, Y.F.; Zhang, J. Atomospheric Aerosols, Air Pollution and Climate Change. Available online: http://qxqk.nmc.cn/html/2009/3/20090301.html (accessed on 30 March 2021).
  3. Twomey, S. Pollution and the Planetary Albedo. Atmos. Environ. 1974, 8, 1251–1256. [Google Scholar] [CrossRef]
  4. Albrecht, B.A. Aerosols, Cloud Microphysics, and Fractional Cloudiness. Science 1989, 245, 1227–1230. [Google Scholar] [CrossRef]
  5. Pincus, R.; Baker, M.B. Effect of Precipitation on the Albedo Susceptibility of Clouds in the Marine Boundary Layer. Nature 1994, 372, 250–252. [Google Scholar] [CrossRef]
  6. Haywood, J.; Boucher, O. Estimates of the Direct and Indirect Radiative Forcing Due to Tropospheric Aerosols: A Review. Rev. Geophys. 2000, 38. [Google Scholar] [CrossRef]
  7. Hansen, J.; Sato, M.; Ruedy, R. Radiative Forcing and Climate Response. J. Geophys. Res. 1997, 102, 6831–6864. [Google Scholar] [CrossRef]
  8. Zhang, X.Y.; Arimoto, R.; An, Z.S. Dust Emission from Chinese Desert Sources Linked to Variations in Atmospheric Circulation. J. Geophys. Res. 1997, 102, 28041–28047. [Google Scholar] [CrossRef]
  9. Zhu, J.; Liao, H.; Li, J. Increases in Aerosol Concentrations over Eastern China Due to the Decadal-Scale Weakening of the East Asian Summer Monsoon. Geophys. Res. Lett. 2012, 39, 9809. [Google Scholar] [CrossRef] [Green Version]
  10. Chambers, E. The Jet Stream. J. Navig. 1959, 12, 266–288. [Google Scholar] [CrossRef]
  11. Jin, R.; Li, Y.; Long, Q.; Liu, S. The 200-HPa Wind Perturbation in the Subtropical Westerly over East Asia Related to Medium-Range Forecast of Summer Rainfall in China. J. Meteorol. Res. 2018, 32, 491–502. [Google Scholar] [CrossRef]
  12. Alaka, M.A.-R. The Jet Stream; U.S. Navy, Fifth Naval District, Publications and Printing Office: Norfolk 11, VA, USA, 1953. [Google Scholar]
  13. Yang, S. Variations of the East Asian Jet Stream and Asian–Pacific–American Winter Climate Anomalies. J. Clim. 2002, 15, 20. [Google Scholar] [CrossRef]
  14. Zhongda, L.; Riyu, L. Interannual Meridional Displacement of the East Asian Upper-Tropospheric Jet Stream in Summer. Adv. Atmos. Sci. 2005, 22, 199–211. [Google Scholar] [CrossRef]
  15. Rui, M.; Daoyi, G.; Qiaomin, F. Influences of the East Asian Jet Stream on Winter Climate in China. Available online: http://html.rhhz.net/yyqxxb/html/20070226.htm (accessed on 31 March 2021).
  16. Song, F.; Zhou, T.; Qian, Y. Responses of East Asian Summer Monsoon to Natural and Anthropogenic Forcings in the 17 Latest CMIP5 Models: Responses of EASM to External Forcings. Geophys. Res. Lett. 2014, 41, 596–603. [Google Scholar] [CrossRef]
  17. Chen, G.; Wang, W.-C.; Chen, J.-P. Circulation Responses to Regional Aerosol Climate Forcing in Summer over East Asia. Clim. Dyn. 2018, 51, 3973–3984. [Google Scholar] [CrossRef]
  18. Liu, Z.; Ming, Y.; Wang, L.; Bollasina, M.; Luo, M.; Lau, N.; Yim, S.H. A Model Investigation of Aerosol-Induced Changes in the East Asian Winter Monsoon. Geophys. Res. Lett. 2019, 46, 10186–10195. [Google Scholar] [CrossRef] [Green Version]
  19. Ordóñez, C.; Barriopedro, D.; García-Herrera, R. Role of the Position of the North Atlantic Jet in the Variability and Odds of Extreme PM10 in Europe. Atmos. Environ. 2019, 210, 35–46. [Google Scholar] [CrossRef]
  20. Barnes, E.A.; Fiore, A.M. Surface Ozone Variability and the Jet Position: Implications for Projecting Future Air Quality: Ozone Variability, Jet, and Climate Change. Geophys. Res. Lett. 2013, 40, 2839–2844. [Google Scholar] [CrossRef] [Green Version]
  21. Kerr, G.H.; Waugh, D.W.; Steenrod, S.D.; Strode, S.A.; Strahan, S.E. Surface Ozone-Meteorology Relationships: Spatial Variations and the Role of the Jet Stream. Atmos. Sci. 2020, 125, e2020JD032735. [Google Scholar] [CrossRef]
  22. Kong, L.; Tang, X.; Zhu, J.; Wang, Z.; Li, J.; Wu, H.; Wu, Q.; Chen, H.; Zhu, L.; Wang, W.; et al. A 6-Year-Long (2013–2018) High-Resolution Air Quality Reanalysis Dataset in China Based on the Assimilation of Surface Observations from CNEMC. Earth Syst. Sci. Data 2021, 13, 529–570. [Google Scholar] [CrossRef]
  23. Hannachi, A.; Jolliffe, I.; Stephenson, D. Empirical Orthogonal Functions and Related Techniques in Atmospheric Science: A Review. Int. J. Climatol. 2007, 27. [Google Scholar] [CrossRef]
  24. Bretherton, C.S.; Smith, C.; Wallace, J.M. An Intercomparison of Methods for Finding Coupled Patterns in Climate Data. J. Clim. 1992, 5, 541–560. [Google Scholar] [CrossRef] [Green Version]
  25. Wilks, D.S. Statistical Methods in the Atmospheric Sciences; Academic Press: Cambridge, MA, USA, 2011; ISBN 978-0-12-385022-5. [Google Scholar]
  26. Sun, J.; Zhang, M.; Liu, T. Spatial and Temporal Characteristics of Dust Storms in China and Its Surrounding Regions, 1960-1999: Relations to Source Area and Climate. J. Geophys. Res. 2001, 106, 10325–10334. [Google Scholar] [CrossRef]
  27. Chen, S.; Huang, J.; Kang, L.; Wang, H.; Ma, X.; He, Y.; Yuan, T.; Yang, B.; Huang, Z. Emission, Transport and Radiative Effects of Mineral Dust from Taklimakan and Gobi Deserts: Comparison of Measurements and Model Results. Atmos. Chem. Phys. 2016, 17, 2401–2421. [Google Scholar] [CrossRef] [Green Version]
  28. Wang, M.; Wei, W.; He, Q.; Yang, Y.; Fan, L.; Zhang, J. Summer Atmospheric Boundary Layer Structure in the Hinterland of Taklimakan Desert, China. J. Arid Land 2016, 8, 846–860. [Google Scholar] [CrossRef] [Green Version]
Figure 1. The average climate state of the jet stream axis at 200 hPa in summer from 1989 to 2018 (scatter points and error bars indicate the average position and the variabilities of the jet stream axis, respectively).
Atmosphere 12 00886 g001
Figure 2. Spatial distributions (a,c) and the time coefficients (b,d) of the EOF1 and EOF2 of the 200 hPa zonal wind in summer from 2009 to 2018.
Atmosphere 12 00886 g002
Figure 3. Season mean concentrations of air pollutants (a) NO2, (b) PM10, (c) O3 (8 h maximum concentration) and (d) PM2.5 in China in summer during 2013–2018 (unit: μg·m−3, the slashed area indicates that the pollutant concentration in the area has exceeded the first-level concentration index of the Ambient Air Quality Standards in China).
Atmosphere 12 00886 g003
Figure 4. Interannual variation in the average pollutant concentrations in the Tarim Basin (a,b) and the North China Plain (ce) (unit: μg·m−3, orange lines represent the median, green triangles represent the average value, and hollow dots represent the discrete value).
Atmosphere 12 00886 g004
Figure 5. Days with pollutant concentrations exceeding the national first-level environmental standard in the Tarim Basin (a) and the North China Plain (b) in summer from 2013 to 2018.
Atmosphere 12 00886 g005
Figure 6. Interannual variation in the ratio of the PM2.5 to PM10 concentration in the Tarim Basin (a) and the North China Plain (b) in summer from 2013 to 2018 (orange lines represent the median, green triangles represent the mean value and black dots represent the discrete point).
Atmosphere 12 00886 g006
Figure 7. Spatial distribution of the ratio of the PM2.5 to PM10 in summer from 2013 to 2018.
Atmosphere 12 00886 g007
Figure 8. Variations of the 200 hPa westerly jet stream (unit: m·s−1, af, contours), distributions of the monthly mean surface air pollutants (unit: μg·m−3, including PM10, O3 and PM2.5) and 1000 hPa wind fields (unit: m·s−1, gi, vectors) in June, July and August from 2013 to 2018. The PM10, O3, PM2.5 are plotted in shaded in ac, df, gi, respectively.
Atmosphere 12 00886 g008
Figure 9. The height-latitude profile of the meridional-averaged zonal wind (unit: m·s−1, contours) and vertical movement (unit: pa·s−1, shades: red indicates ascending motion, blue indicates descending motion) in different areas in July and August. (a,c,e) represent the situation in the North China Plain, and (b,d,f) represent the situation in the Tarim Basin.
Atmosphere 12 00886 g009
Figure 10. The (a,c,e) left and (b,d,f) right heterogeneous correlation diagrams of the SVD1 of the surface pollutants including the PM10, O3 and PM2.5 (the left field) and the 200 hPa zonal wind field (the right field) in summer from 2013 to 2018. The slashes indicate that the results passed the 95% Monte Carlo correlation test.
Atmosphere 12 00886 g010
Figure 11. The (a,c,e) left and (b,d,f) right heterogeneous correlation diagrams of the SVD2 of the surface pollutants including the PM10, O3 and PM2.5 (the left field) and the 200 hPa zonal wind field (the right field) in summer from 2013 to 2018. The slashes indicate that the results passed the 95% Monte Carlo correlation test.
Atmosphere 12 00886 g011
Figure 12. The correlation coefficients between the time series of the EOF1 of the 200 hPa zonal wind and surface meteorological variables of the (a) humidity, (b) temperature, (c) surface zonal wind and (d) surface meridional wind in summer during 2013–2018. The slashes indicate that the results passed the 95% Monte Carlo correlation test.
Atmosphere 12 00886 g012
Figure 13. The correlation coefficients between the time series of the EOF2 of the 200 hPa zonal wind and surface meteorological variables of the (a) humidity, (b) temperature, (c) surface zonal wind and (d) surface meridional wind in summer during 2013–2018. The slashes indicate that the results passed the 95% Monte Carlo correlation test.
Atmosphere 12 00886 g013
Figure 14. Correlation coefficients between surface pollutants and corresponding surface meteorological variables in summer from 2013 to 2018. (a) PM10 and humidity, (d) PM10 and temperature, (g) PM10 and zonal wind and (j) PM10 and meridional wind. (b) O3 and humidity, (e) O3 and temperature, (h) O3 and zonal wind and (k) O3 and meridional wind. (c) PM2.5 and humidity, (f) PM2.5 and temperature, (i) PM2.5 and zonal wind and (l) PM2.5 and meridional wind. The slashes indicate that the results passed the 95% Monte Carlo correlation test.
Atmosphere 12 00886 g014
Table 1. Average concentration of pollutants in the Tarim Basin and the North China Plain from 2013 to 2018 (unit: μg·m−3).
Area\Pollution KindPM2.5PM10O3
TB45.1949.08-
NCP45.0970.28131.27
Table 2. The average value of the meteorological elements and pollutant concentrations in the North China Plain (NCP) and Tarim Basin (TB) in June, July and August.
JunJulAug
NCPsurface wind speed (m·s−1)2.482.611.36
200 hPa zonal wind speed (m·s−1)31.7717.3918.60
vertical velocity(pa·s−1) *0.009−0.022−0.003
PM2.5 (μg·m−3)48.0944.0939.60
PM10 (μg·m−3)75.3767.2162.15
O3 (μg·m−3)141.70126.13123.50
TBsurface wind speed (m·s−1)1.411.761.99
200 hPa zonal wind speed (m·s−1)30.2926.7129.03
vertical velocity(pa·s−1) *−0.037−0.056−0.061
PM2.5(μg·m−3)35.5644.5143.43
PM10(μg·m−3)39.3248.2147.41
* The vertical velocity is the average value of the vertical velocity below the 200 hPa level.
Table 3. The average concentration of the air pollutants in North China Plain (NCP) and the Tarim Basin (TB) in different East Asian jet periods in summer from 2013–2018. (units:μg·m−3).
PM2.5PM10O3
NCPSouthward48.0975.37141.70
Northward41.5464.5125.01
Average43.9268.25130.44
TBstrong36.3038.88-
weak53.2459.04-
Average41.1744.98-
Publisher’s Note: MDPI stays neutral with regard to jurisdictional claims in published maps and institutional affiliations.

