Article

The Influence of Transport on PAHs and Other Carbonaceous Species’ (OC, EC) Concentration in Aerosols in the Coastal Zone of the Gulf of Gdansk (Gdynia)

by
Joanna Klaudia Buch
,
Anita Urszula Lewandowska
*,
Marta Staniszewska
,
Kinga Areta Wiśniewska
and
Karolina Venessa Bartkowski
Institute of Oceanography, University of Gdansk, Al. Marszałka J. Piłsudskiego 46, 81-378 Gdynia, Poland
*
Author to whom correspondence should be addressed.
Submission received: 13 July 2021 / Revised: 31 July 2021 / Accepted: 1 August 2021 / Published: 5 August 2021
(This article belongs to the Special Issue Assessing Atmospheric Pollution and Its Impacts on the Human Health)

Abstract

:
The aim of this study was to determine the influence of transport on the concentration of carbon species in aerosols collected in the coastal zone of the Gulf of Gdansk in the period outside the heating season. Elemental carbon (EC), organic carbon (OC), and the ΣPAHs5 concentrations were measured in aerosols of two size: <3 μm (respirable aerosols) and >3 μm in diameter (inhalable aerosols). Samples were collected between 13 July 2015 and 22 July 2015 (holiday period) and between 14 September 2015 and 30 September 2015 (school period). In both periods samples were taken only during the morning (7:00–9:00 a.m.) and afternoon (3:00–5:00 p.m.) road traffic hours. The highest mean values of the ΣPAHs5 and EC were recorded in small particles during the school period in the morning road traffic peak hours. The mean concentration of OC was the highest in small aerosols during the holiday period. However, there were no statistically significant differences between the concentrations of organic carbon in the morning and afternoon peak hours. Strict sampling and measurement procedures, together with the analysis of air mass backward trajectories and pollutant markers, indicated that the role of land transport was the greatest when local to regional winds prevailed, bringing pollution from nearby schools and the beltway.

1. Introduction

Coastal cities tend to have cleaner air than inland cities. However, even in their atmosphere the concentration of pollutants may increase, especially in the immediate vicinity of their emission sources [1]. In urbanized coastal cities, transport plays an important role in shaping poor air quality, in addition to the municipal and housing sector. The first source appears most clearly during the heating season. In the warmer months of the year, communication can take over the role of the dominant emitter of pollutants. The term ‘communication’ is usually understood as road (heavy and passenger), rail, and air transport. Land-based road pollution also enters the atmosphere as a result of the abrasion of tires and brakes and re-suspension of road dust [2]. In this way, large particles with a diameter of 2.5–10 µm are emitted, while fine aerosols (<2.5 µm) are present in the atmosphere mainly as a result of fuel combustion. The quality of the atmosphere in coastal cities is also negatively affected by sea transport (e.g., ferries, container ships, bulk carriers, chemical tankers) and the proximity of ports (e.g., transshipment activities). In coastal or port regions, emissions from ships can significantly increase the concentration of NOx, SO2, PMx, and their components [3,4]. The largest increase in the concentration of aerosols and their components is recorded along the traffic routes. This is manifested mainly by a high concentration of elemental carbon (EC), which is the basic indicator of air pollution from transport [5]. In the atmosphere of urbanized cities, as much as 80% of EC in aerosols come from exhaust emissions, 14% from heating houses, 4% from maritime transport, and only 2% from the energy industry and refinery activity [6]. In addition to elemental carbon, the composition of aerosols emitted in the transport sector is dominated by organic carbon, polycyclic aromatic hydrocarbons, and sulfur and nitrogen compounds [7,8,9]. Organic aerosols from road traffic can be released directly from the exhaust due to incomplete combustion of fuels and lubricating oil or can be formed in the atmosphere by the oxidation of traffic generated VOCs such as aromatics [10]. Lang et al., (2017) found a very high correlation coefficient (r2) between the annual average OC concentration with vehicular OC emissions (r2 = 0.95) and VOC emissions (r2 = 0.9) to the atmospheric OC level [11]. In turn Zhang (2006) found that the average content of OC and EC in fine (2.5 µm) particles is 38% and 4% from gasoline cars and even higher from diesel cars (58% and 16%, respectively) [12]. Studies conducted in China by Cai et al. (2017) showed similar results for diesel vehicles in the case of OC (56.9%) in PM2.5 [13]. However, EC content in PM2.5 was 17.6% for heavy duty diesel, 17.7% for light duty diesel, and 8% on average for gasoline. Of course, burning fossil fuels such as gasoline and diesel releases carbon dioxide, a greenhouse gas, into the atmosphere [14]. Considering the health aspects, carbon aerosols currently require the greatest attention. Since the 1990s, it has been indicated that the presence of road pollutants in aerosols is associated with human exposure. Vehicle emissions contribute to the formation of ground level ozone, which together with other chemicals emitted by various means of transport, can trigger human health problems such as aggravated asthma, reduced lung capacity, and increased susceptibility to respiratory illnesses, including pneumonia and bronchitis [15]. The increase in air pollution from transport emission contributes also to the increase in the incidence of cardiovascular diseases and cancer. This, in turn, leads to a higher mortality, especially in urbanized areas [16,17,18,19]. Diesel particulate matter is of particular concern because long-term exposure is likely to cause lung cancer.
There is a direct relationship between the exposure to human health and life and the particle size and chemical composition. Larger particles, 2.5 to 10 µm in diameter, are retained in the upper respiratory tract, while the smallest (<2.5 µm) reach the lungs and alveoli, and even the bloodstream [20,21,22]. Long-term exposure of the brain to the traffic pollution slows down the maturation processes of this organ and causes changes in its functioning. This is manifested by decreased brain activity when viewing and listening. In turn, in the youngest children (up to 5 years of age) whose mothers experienced longer exposure to traffic pollution during pregnancy, structural changes in the brain were found. It has also been observed that in the left hemisphere of the brain there was a reduction in the volume of white matter, which is responsible for supporting memory [15,23,24,25,26,27]. Long-term exposure to polluted air also reduces the volume of brain tissue in the elderly [26,27]. Fetuses, new-born children, elder people, and people with chronic illnesses are especially susceptible to the effects of air pollutants from transport sources.
Due to the constant development of transport routes, the motorization of the population is increasing, along with the number of passenger cars. In the Gdynia region in 2005, it amounted to nearly 101,000. Ten years later it was already 57% higher (178,146 units) [28]. This phenomenon results in increased traffic, which in turn leads to the increased emissions of transport pollutants into the air. So far, it has been proven that the increase of these components is directly correlated with the proximity of traffic routes [6]. People who live, work, or attend school near major roads appear to have an increased incidence and severity of health problems associated with air pollution exposure related to roadway traffic. Children, the elderly, people with pre-existing cardiopulmonary disease, and people of low socioeconomic status are among those at higher risk of health impacts resulting from the air pollution near roadways [14]. Taking the above into account, the aim of this study was to determine the influence of transport on the concentration of carbon compounds (PAHs, OC, EC) in aerosols collected in the urbanized coastal zone of the southern Baltic Sea (Gdynia station) outside the heating season, in the morning and afternoon hours of the road traffic peak. In addition to the above, the aim of the research was to determine which period (school or vacation) and which meteorological conditions increase the role of transport in shaping high concentrations of the analyzed carbon compounds, especially in small aerosols (<3 μm in diameter), which are the most dangerous to human health.

2. Materials and Methods

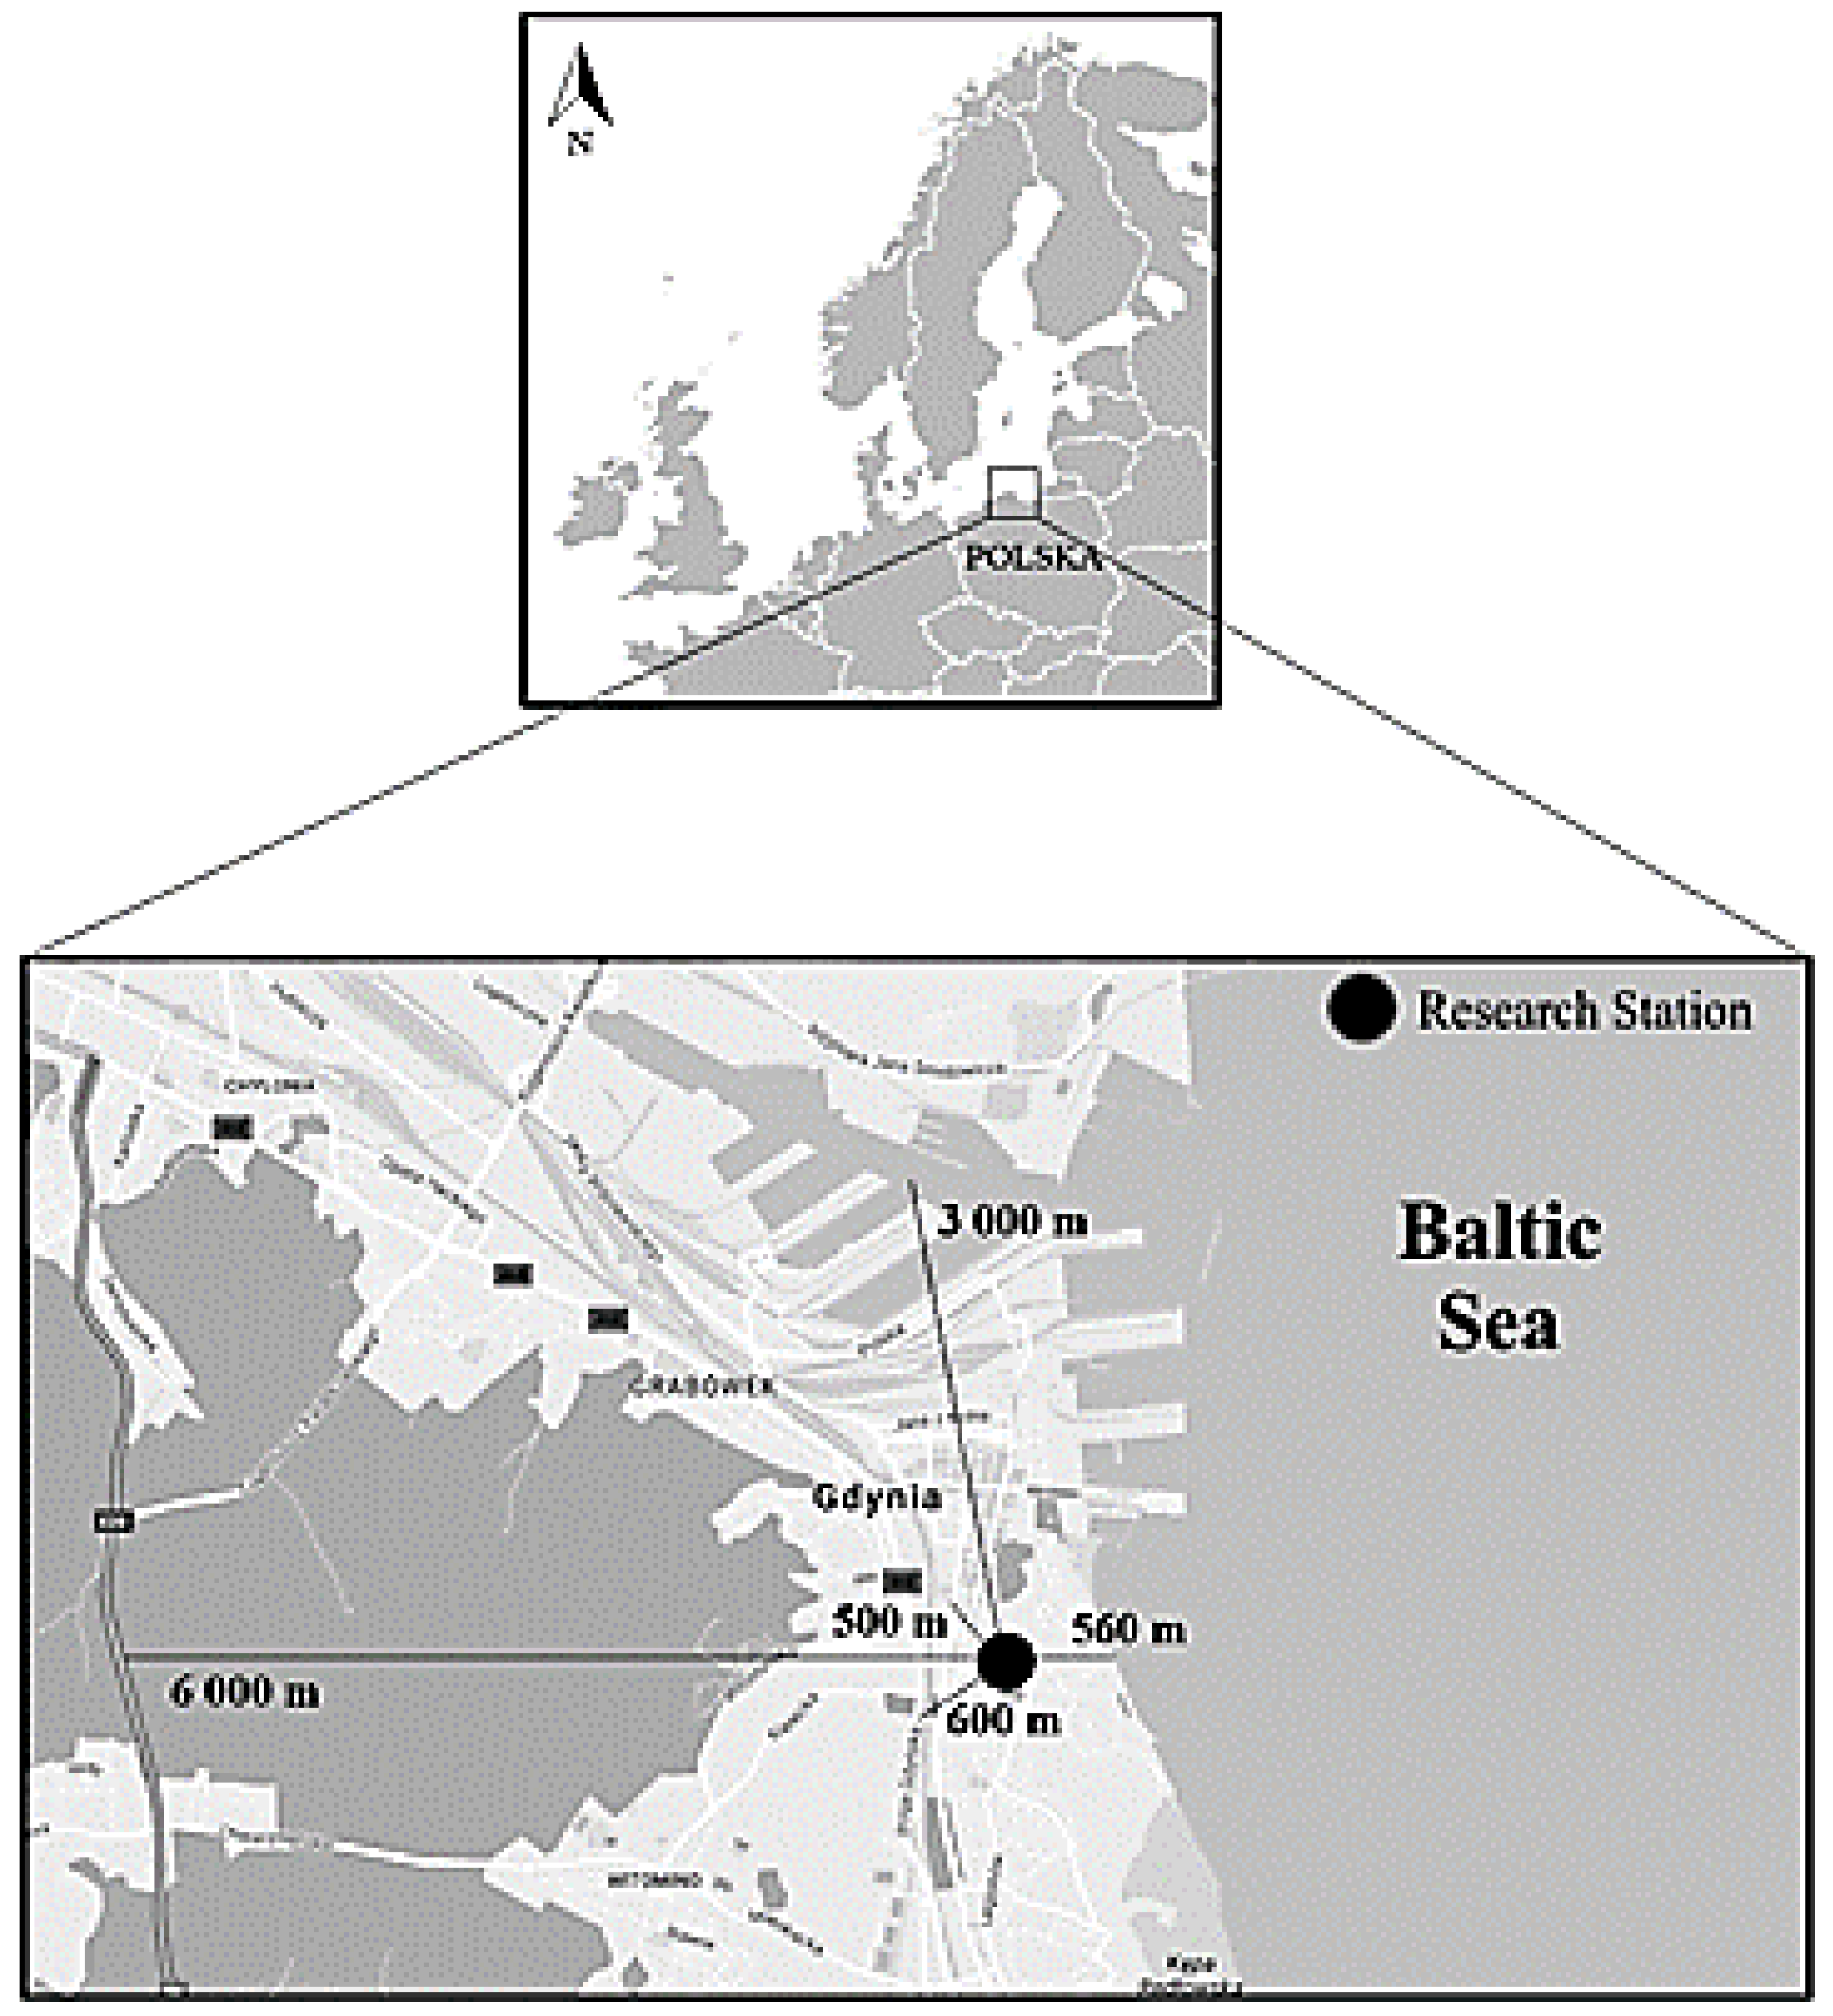
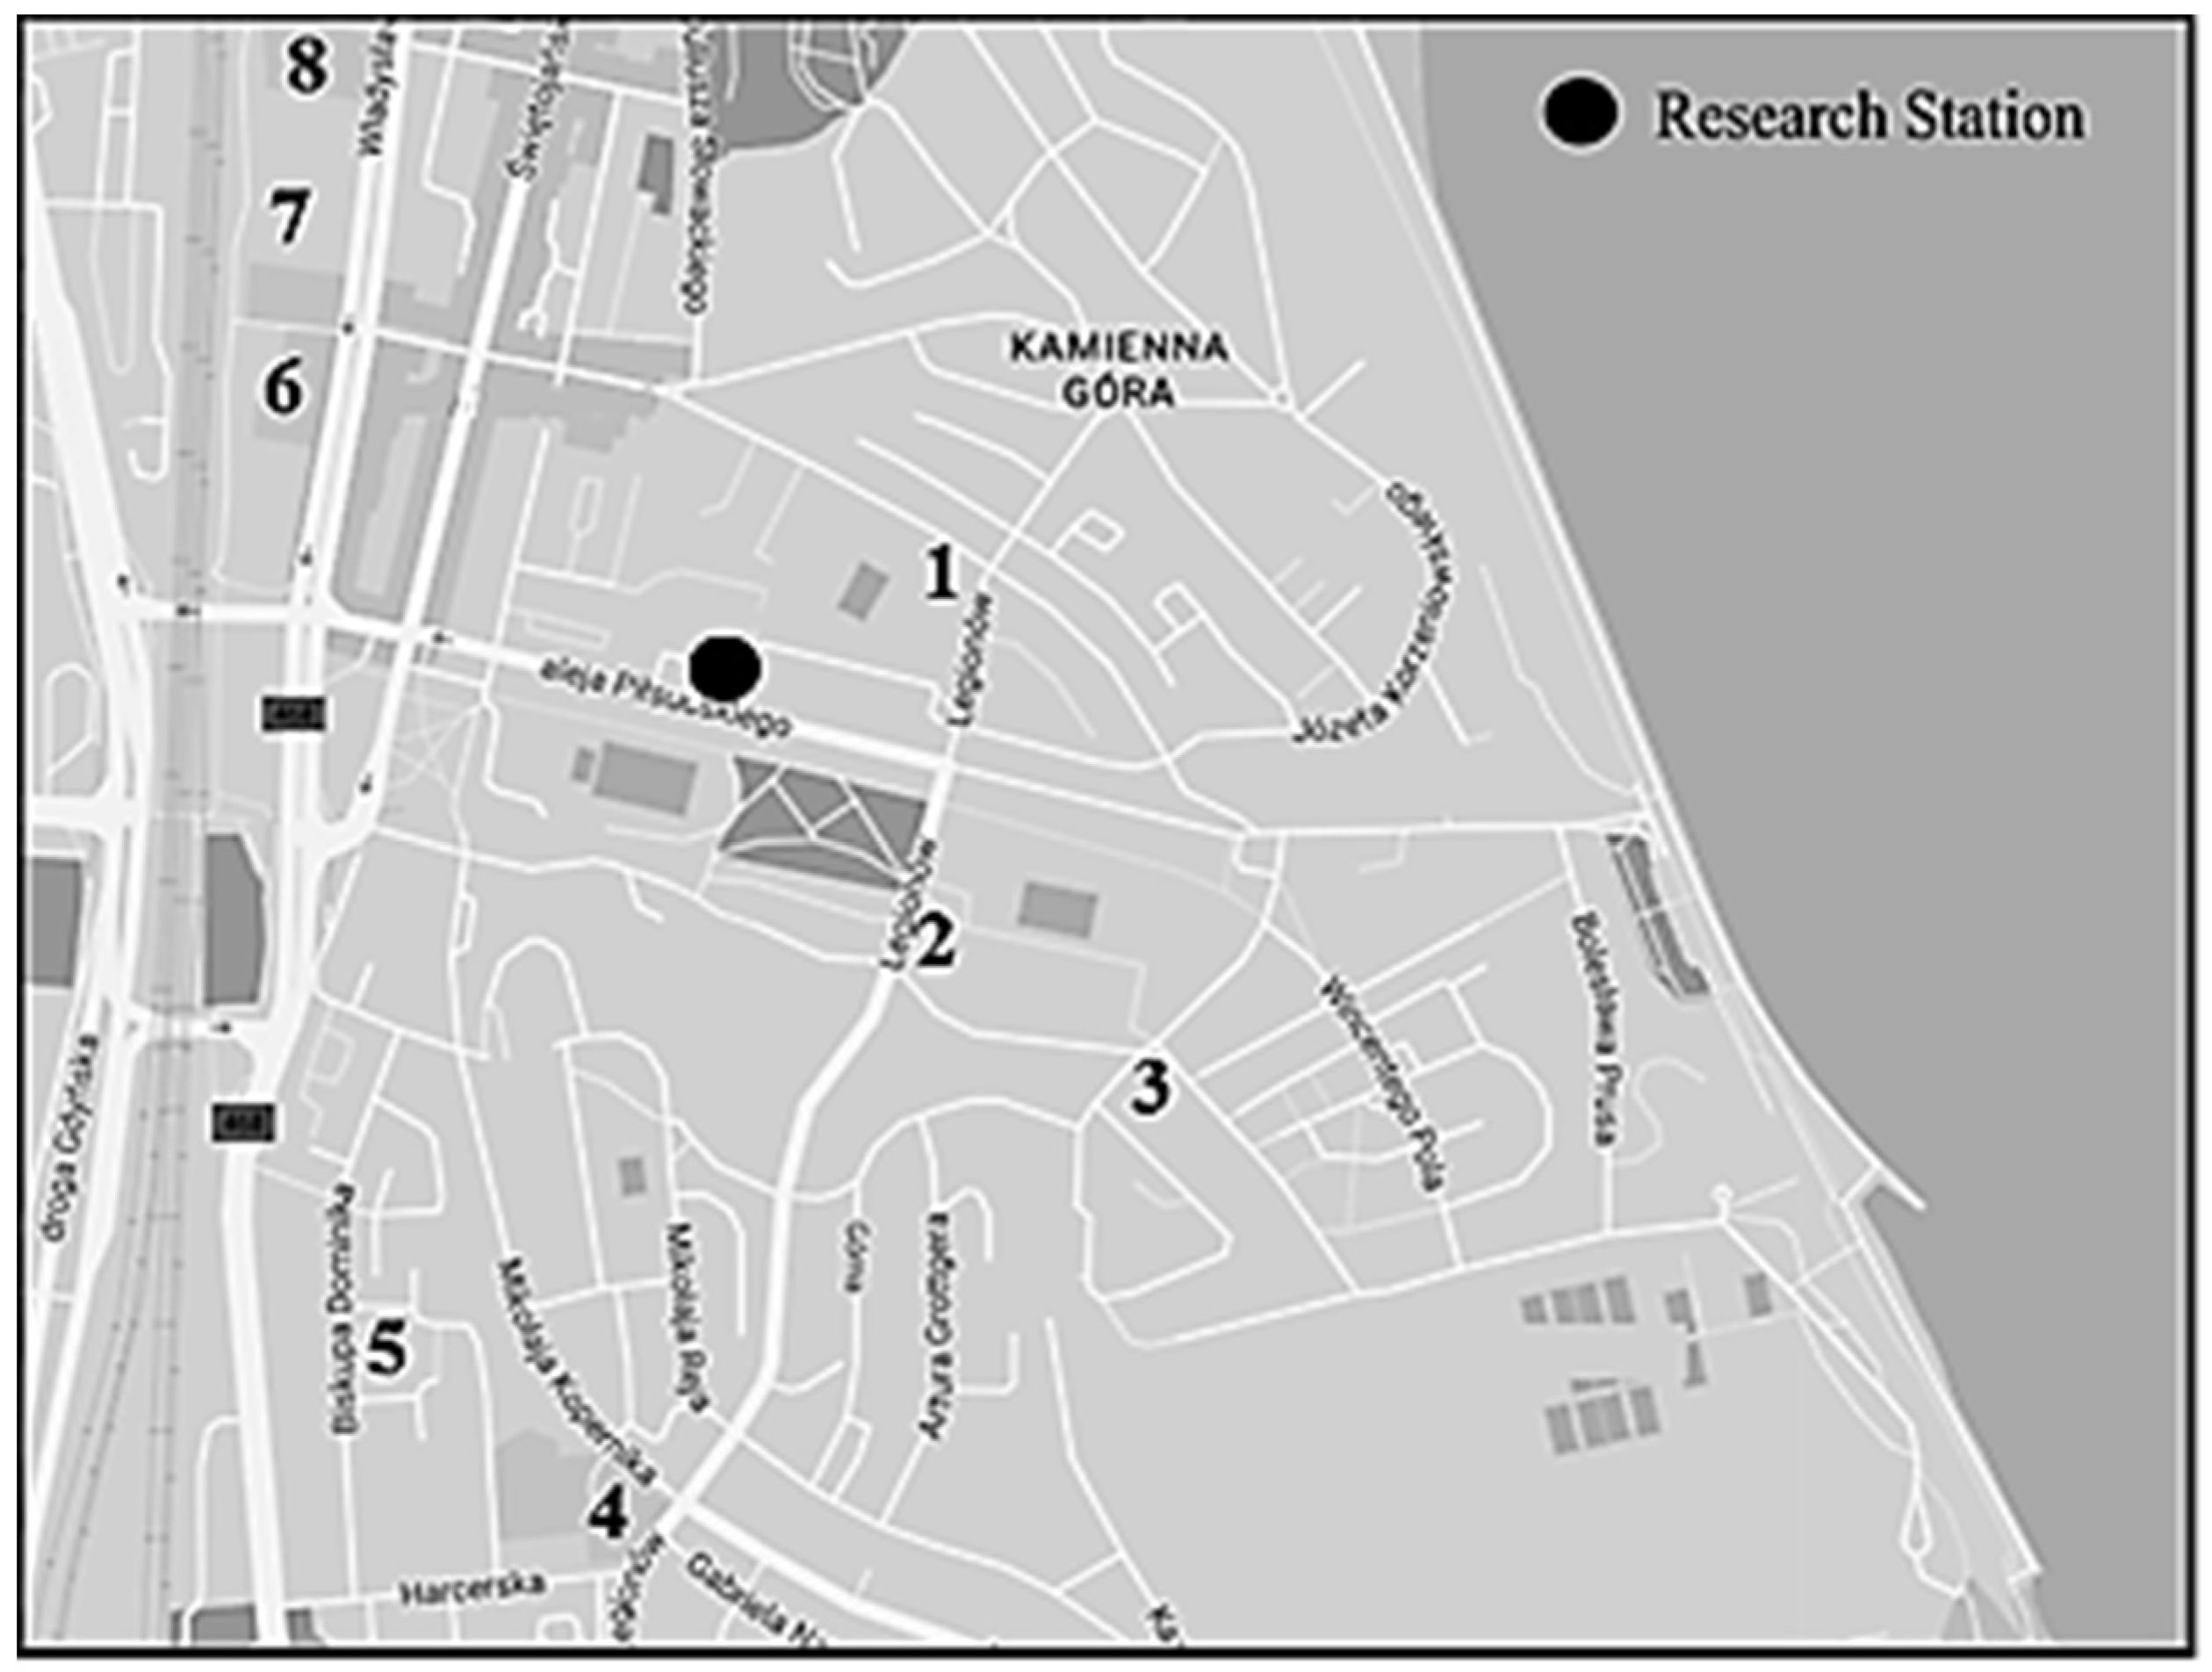
2.1. Location of the Measuring Station

Aerosol samples were collected in Gdynia, at the Faculty of Oceanography and Geography of the University of Gdansk (54°30′ N, 18°32′ E). The building is located in the urbanized part of the city, about 600 m from the shoreline of the Baltic Sea (Gdansk Bay). The research station is surrounded by many traffic routes (Figure 1). The largest of them is the Tri-City ring road located to the south-west, 6000 m away from the IO UG. Moreover, heavy traffic characterizes Władysław IV Street (500 m) and Silesia Street (635 m). At a distance of 600 m from the station there is also a fast city rail. The closest is Pilsudski street (15 m), where the measurements were carried out. The Port of Gdynia is located north-west of the station, 3000 m away.
In the vicinity of the measuring station, there is increased traffic in the morning and afternoon hours, which is mainly related to the presence of numerous schools to which children are transported (Figure 2). The closest of them is located 128 m and the farthest 690 m away from the measuring station.

2.2. Aerosol Sampling

Aerosol samples were collected in the period between 13 July 2015 and 22 July 2015 (holiday period) and between 14 September 2015 and 30 September 2015 (school period). In both cases, samples were taken outside of the heating period. It was aimed at eliminating the source related to the communal-living sector, which plays a great role in shaping the air quality in the research area. Measurements were carried out in two-hour cycles during the morning and afternoon rush hours (7:00–9:00 a.m.; 3:00–5:00 p.m.).
Aerosols were collected using a Tisch Environmental, Inc. high-flow impactor (TEI) (model: TE-235). It operates at a nominal flow of 1.132 m3·min−1 (40 scfm; 68 m3·h−1) at a pressure of 760 mm Hg and a temperature of 25 °C. Aerosols were collected on TE-QMA Micro Quartz filters, 14.3 cm × 13.7 cm in size (aerosols from 0.49 µm to 10 µm). The smallest particles, below 0.49 µm, were collected on a Whatman 41 filter, which had a size of 20.3 cm × 25.4 cm. Before use, all filters were preheated (580 °C, 6 h) and then conditioned in a desiccator for 24 h (Rh: 45% ± 5% and 20 °C ± 5 °C). All filters were weighed twice with an accuracy of 10−5 g on a vertical plate of a RADWAG microbalance AS 110.R2, adjusted to the size of the filters. After sampling, the filters were re-conditioned for 48 h in the desiccator and weighed twice again. All activities related to installing, removing, and weighing the filters were carried out in a laminar air flow chamber. The limit of quantification (LOQ) was set at 0.12 μg (20 replicates). The uncertainty of the method was <3.0% (at a certainty level of 99%).

2.3. Analysis of Organic and Elemental Carbon and Polycyclic Aromatic Hydrocarbons

The analysis of organic (OC) and elemental (EC) carbon in aerosols was performed by the thermo-optical method with the use of a thermo-optical analyzer (Sunset Laboratory Dual-Optical Carbonaceous Analyzer; protocol EUSAAR 2). For the analysis, a filter fragment with an area of 1.5 cm2 was used. In addition to automatic calibration, an external standard (99.9% sugar solution) was analyzed every 10–15 samples [29,30]. The detection limit of the method was set to 0.1 µg·m−3 for both OC and EC (n = 12). The analytical error of the method was 4.5% at a confidence interval of 99% [22,29,30,31,32].
Concentrations of five PAHs (benzo(a)pyrene, benzo(a)anthracene, fluoranthene, pyrene and chrysene) were determined by means of high-performance liquid chromatography using a Dionex UltiMate 3000 analyzer with a fluorescence detector (benzo(a)pyrene λex. = 296 nm, λem. = 408 nm; fluoranthene and pyrene λex. = 270 nm, λem. = 440 nm; benzo(a)antracene and chrysene λex. = 275 nm, λem. = 380 nm). The isolation of PAHs was conducted by means of solvent extraction (acetonitrile: dichloromethane 3:1 v/v) in an ultrasonic bath [33]. The concentration values for the standard curve ranged from 0.125 to 10 ng·cm−3. The limit of quantification was 0.01 ng·cm−3. The recovery determined against the reference material (SRM-2585) was 83%, 78%, 91%, 91%, and 99% for BaP, FLA, PYR, B(a)A, and CHR, respectively [32,33,34].

2.4. Anion Analysis

Prior to chromatographic analysis, a fragment of 10.8 cm2 was cut from quartz filters with dimensions of 14.3 cm × 13.7 cm, while a fragment of 3.8 cm2 was cut from a filter with dimensions of 20.3 cm × 25.4 cm. Next, the cut filters were placed in polyethylene tubes and 12 cm3 of milli-Q water was added. The next step was to sonicate the samples (20 min) in an ultrasonic bath (Sonic 6D, Sonic 10, Polsonic Palczyński, Warsaw, Poland) in order to bring the ions into solution. The extract obtained in this way was filtered through membrane filters with a pore diameter of 0.25 µm. The ions NO3 and SO42− were determined by ion chromatography 881 Compact IC pro (Metrohm AG, Herisau, Switzerland) in accordance with Polish Standard PrPN-EN No 10304-1. For sulphates and nitrates, the limit of detection was 0.1 μg·m−3 and 0.2 μg·m−3, respectively, and the error of the method was 4.7% and 5.5%. In all cases, a confidence level of 99% was assumed [35].

2.5. Variation of Meteorological Parameters

Gdynia, where aerosol samples were collected, lies in the temperate climate zone, which is constantly modified by the influence of the vicinity of the Baltic Sea. Such a location determines the less severe winters and, at the same time, mild summers. The average annual temperature for the summer period is 14 °C, and for the winter period it is 2.3 °C. Average precipitation totals are 590 mm (1971–2000) with maximum values in July (13%). The dominant wind direction in Gdynia is westerly (1981–2010) [36].
During the research period, the highest average temperature value of 19.4 °C was recorded during the afternoon traffic rush during the summer holidays in July (with a maximum of 26.8 °C; 21 July; 3:00–5:00 p.m.) (Table 1).
The lowest temperature was also noted in the afternoon rush hour in September (school period), and amounted to 16.8 °C (with a minimum of 11.5 °C, 30.09; 3:00–5:00 p.m.) (Table 1). Relative air humidity ranged from 31% (17/7; 7:00–9:00 a.m.) to 83% (16/9; 3:00–5:00 p.m.). Higher RH values were recorded during the school period than during the holiday period. The mean wind speed values were slightly higher during the holiday season (3.2 m∙s−1) than during the school season (2.0 m∙s−1). The maximum wind speed was recorded on 17 July (vacation period) during the morning rush hour and it was 9.8 m∙s−1. The lowest wind speed was recorded on 16 September between 7:00 a.m. and 9:00 a.m. and it was equal to 0.1 m∙s−1 (Table 1). The mean atmospheric pressure was higher during the school period. The highest pressure was recorded on 29 September in the morning peak hours (1033 hPa), and the lowest on 16 September in the afternoon (999 hPa).
During the summer holidays, in the morning rush hour the westerly wind direction was dominant (80%), and in the afternoon south-westerly (46%) and southerly (34%) winds dominated. During the school period, in the morning traffic hours, the south-west direction had the highest share (84%), while in the afternoon traffic hours winds from the south-east direction were predominant (46%) (Table 1).

2.6. Atmospheric Air Pollution Indicators from Transport Sources Used in the Work

There are several indicators that allow us to estimate whether the chemical composition of aerosols in a given research area is determined by the emission from transport sources. While EC has a primary origin, OC can be both primarily emitted but also formed in the atmosphere through condensation to the aerosol phase of low vapor pressure compounds emitted primary as pollutants or formed in the atmosphere. Thereby, a large fraction of OC in the atmosphere has a secondary origin. Because of this, the OC/EC ratio in aerosol fractions differs widely, both in space and seasonally, and it could be a useful diagnostic ratio to investigate sources and processes happening in the atmosphere, which could lead to the formation of secondary organic compounds [37,38,39,40]. The value of the OC/EC ratio depends on the emission sources associated with different combustion processes. Higher concentrations of OC and EC occur during the heating season [41]. They are also increasing in areas of heavy traffic. In general, both OC and EC are characterized by higher concentrations near traffic routes than in rural or industrial areas [42,43,44,45]. When the OC/EC value is between 2.6 and 6.0, the organic carbon comes from the combustion of fossil fuels [43]. It is assumed that for biomass combustion, the coefficient exceeds 6 [46,47,48]. Pio et al., (2011) measured the OC and EC at both roadside and urban background sites in Portugal and the UK and obtained the lowest OC/EC ratio ranging from 0.3 to 0.4 for the road-generated aerosols. The results of Pio et al., (2011) are in agreement with the findings of Yu et al., (2011) [49]. On the other hand, they are lower than measured by Hildemann et al., (1991) [50] for particles emitted from gasoline (OC/EC = 2.2) and diesel vehicles (0.8). The latter results may be the consequence of using other methods of estimating OC and EC concentrations in the 1990s.
Polycyclic aromatic hydrocarbons (PAHs) have also been used as indicators of atmospheric pollution from transport sources in various areas of the world. For example, Masclet et al., (1986) [51] and Miguel et al., (1998) [52] found that the gasoline engine emissions were enriched in benzo(ghi)perylene and coronene and diesel exhausts emitted mainly chrysene, fluoranthene, and pyrene. In turn, Duan et al., (2016) [53] noted that fluoranthene, naphthalene, phenanthrene, pyrene, fluorene, chrysene, and benzo(a)pyrene are dominant PAHs emitted from coal-fired power plants. For a heavy oil and natural gas fueled-boiler, naphthalene, phenanthrene, fluoranthene, pyrene, fluorene, and benzo(b)chrysene were found to be the major PAHs. Sometimes relationships are found that allow us to determine the origin of PAHs in aerosols. For example, a B(a)A/chrysene ratio above 1 suggests that the source of the aerosols is fuel combustion. A similar source is indicated by a B(a)A/(B(a)A + CHR) ratio above 0.2 and a fluoranthene/pyrene ratio above 1. The ratio of fluoranthene/(pyrene + fluoranthene) within the range of 0.4–0.5 indicates combustion liquid fuels, and when its value is higher than 0.5, it implies burning coal and biomass. When the value of the above index falls below 0.4, the carbon source is oil combustion [7].
Another well-recognized marker is the aerosol nitrate to sulfate ratio. It is used to distinguish the air pollution coming from mobile sources from those emitted by stationary sources (point emitters, e.g., power plants, refineries). When nitrate ions dominate over sulphate ions in aerosols, meaning that the NO3/SO42− ratio is above 1, this indicates that transport is the main source of pollutants [54,55].
In addition to the chemical indicators listed above, the analysis of meteorological data facilitates the identification of aerosol sources. For this purpose, wind roses are plotted to determine potential local and regional sources of pollution (Table 1). In order to determine the movement of air masses from distant sources, the HYSPLIT model developed by NOAA can be used [56]. A detailed description of their trajectories has been presented in previous publications [57,58].

2.7. Statistical Treatment of the Data

To verify the significance of the impact of the analyzed factors (e.g., distance from the street, level of traffic), two tests were applied. The non-parametric U Mann–Whitney Test was applied to examine differences between two sets of independent data and the Kruskal–Wallis test was used for more than two groups of independent variables. Analogous tests were applied to determine the influence of selected factors on the deposition of organic carbon. For all dependencies presented in the publication, the levels of tests’ significance have been considered to be important only when the p value was less than 0.05. All the statistical analysis was performed using STATISTICA® Software (Dell Inc., software.dell.com, Tulusa, OK, USA, Version 13).

3. Results

The research conducted in Gdynia in 2015 was aimed at determining the extent to which transport related to driving children to school contributes to air pollution with carbon compounds. For this reason, measurements were carried out only in the non-heating period, which was divided into two cycles. The first one covered summer holidays (July 2015), when there is no traffic related to transporting children to school. September (2015) was selected as the school period. In both measurement cycles, samples were taken during road traffic peak hours (7:00–9:00 a.m. and 3:00–5:00 p.m.). During the measurements in September, the traffic volume in Gdynia ranged from 37,000 to 45,000 vehicles a day and was on average one third higher than during the summer holidays [59]. This could have resulted in slightly higher concentrations of PAHs (21.4 ng∙m−3) and EC (0.5 µg∙m−3) in PM10 aerosols during the school period than during the holiday season (20.3 ng∙m−3 and 0.3 µg∙m−3, for PAHs and EC, respectively). Among carbon compounds, only the concentration of organic carbon in PM10 was higher in July than in September 2015 (6.1 µg∙m−3 and 4.3 µg∙m−3, respectively), which could be a consequence of the increased vegetation of plants on land and in the sea at that time. However, the Mann–Whitney U test did not confirm a statistically significant difference in the concentrations of all analyzed carbon compounds (PAHs, OC and EC) between the school and holiday periods (test, p > 0.05). In order to better interpret the sources of origin of the analyzed carbon compounds in the discussed periods, the results were divided into two size classes: up to 3 µm in diameter (respirable aerosols) and from 3 µm to 10 µm in diameter (inhalable aerosols) (Table 2). Additionally, the study takes into account the ionic components of aerosols (nitrates and sulphates) as a supplement to the information on air pollution from stationary and mobile sources (NO3/SO42− factor) [54,55].
The concentration of total PAHs was always higher in particles smaller than 3 µm in diameter. Only in the morning road traffic peak, during the school period, was there a reverse tendency that the mean the concentration of ∑PAH5 was higher in particles with a diameter of 3 to 10 µm. It was also the only case where the concentration of ∑PAH5 was higher during the school period than during the holiday period. At the same time, regardless of the particle size and duration of measurements (school and holiday period), the concentration of ∑PAH5 was always higher in the morning than in the afternoon (Table 2). Among the analyzed PAHs, the highest concentration values in both fractions, both during school and holiday periods, as well as during the morning and afternoon road traffic peak, were exhibited by fluoranthene (Table 2). The concentrations of other PAHs were at a similar level. The lowest values were found for B(a)A (from <LD of the analytical method to 0.2 ng∙m−3). Apart from benzo(a)pyrene, which belongs to the five-ring hydrocarbons, the remaining analyzed PAHs are classified as tetracyclic (pyrene, chrysene, fluoranthene, benzo(a)anthracene). Two-and three-ring PAHs have a low molecular weight (LMW), four-ring PAHs have an average molecular weight (MMW), while five- and six-ring PAHs have a high molecular weight (HMW). The physical and chemical properties of PAHs change with the molecular weight and chemical structure. Low molecular weight compounds, which were not analyzed in this study, have a higher vapor pressure and are present in the environment in gaseous form. In addition, they are less hydrophobic than medium and high molecular weight hydrocarbons and therefore dissolve more easily in water. PAHs of medium and high molecular weights are more difficult to degrade, and thus more persistent in the natural environment. PAHs with four or more aromatic rings are hydrophobic and typically non-polar compounds. This determines their behavior in the natural environment. In general, PAHs with a higher molecular weight exhibit sorption properties on smaller aerosols [60], which could explain why the concentration of PAHs was higher in particles smaller than 3 µm in diameter. The high concentrations of PAHs in large aerosols obtained in the morning hours during the school period could have resulted from the prevailing weather conditions. The process of PAHs sorption on aerosols is more intensive under higher air humidity. In the discussed period of time, the average air humidity was 64 ± 9% and was higher than in other research periods (Table 1). At that time, the atmospheric pressure was also characterized by the highest range of values (from 1002 to 1033 hPa). The increase in atmospheric pressure reduces the speed of air circulation and prevents the transfer of PAHs from aerosol to gaseous form [61]. For this reason, during the morning hours of school period, when the air humidity and atmospheric pressure were higher, higher concentrations of the analyzed PAHs in aerosols >3 μm of diameter could be recorded. In the afternoon hours of the school period, the pressure periodically dropped below 1000 hPa, and the humidity was several % lower than in the morning hours (Table 1).
The mean concentration of organic (OC) and elemental (EC) carbon was always higher in aerosols below 3 µm in diameter. In a similar manner to the concentration of ∑PAH5, the concentration of these compounds was also higher in the morning hours than in the afternoon traffic peak hours. However, while the concentration of EC was higher or at a similar level during the school period, higher values of OC were observed during the summer holidays. Organic carbon during the holiday season accounted for as much as 94% in the total carbon fraction in particles smaller than 3 µm and 92% in particles larger than 3 µm in diameter. Its share decreased during the school period, when the EC concentration increased. At that time, OC constituted 88% of the TC mass in particles <3 µm in diameter, and 84% of TC in particles >3 µm in diameter.
The average concentration of nitrates and sulphates, as well as the EC concentration, was higher during the school period than during the holiday period (Table 2). Regardless of the season and the time of day, it was always greater in aerosols <3 µm in diameter.

4. Discussion

4.1. The Origin of Carbon Compounds during the Holiday Season

Measurements carried out in Gdynia during the holiday season did not show statistically significant differences in concentrations depending on the time of sampling in the case of ∑PAH5, both forms of carbon (OC and EC), or basic ionic components (NO3, SO42−) (Figure 3).
The median concentrations of all compounds were very similar in the morning and afternoon hours. This may be due to the fact that during the holidays in the area of the Tri-City agglomeration, the traffic volume is largely determined by tourism. Therefore, it is not at its highest during peak traffic hours. Rather, it falls in the late morning hours, when tourists head for the beach and the early afternoon hours, when tourists come down for lunch. Additionally, some residents are on vacation during the summer months. Of course, driving children to school is also eliminated. However, the obtained value of the PAHs origin index described by the relationship PIR/B(a)P was high and amounted to 6.9. This indicates that the dominant source of these compounds in aerosols over Gdynia during the summer holidays was combustion in diesel engines [62,63]. The same source was found both for small particles in the morning hours (6.1) and in the afternoon (5.7) and for large particles during both road traffic peak hours (6.2 and 11.4, respectively in the morning and afternoon). The high concentration of fluoranthene in relation to pyrene (mean value Flu/Pyr = 159) also indicated the communicative source of PAHs during the holidays. This source played a more significant role in the morning (Flu/Pyr = 337) than in the afternoon (Flu/Pyr = 138). The more than two times higher concentration of fluoranthene in small aerosols as compared to large particles also proves the impact of combustion in diesel engines. This trend was recorded both in the morning and in the afternoon (Table 2). The same source of aerosols during the holiday season was indicated by the value of the NO3/SO42− ratio. Again, its greater importance was established in the morning (7:00–9:00 a.m.) when the mean value of the ratio was 1.3 (1.2 and 1.4, respectively, in particles <3 µm and >3 µm in diameter). In the afternoon (3:00–5:00 p.m.) the NO3/SO42− ratio was slightly lower and averaged 1.1 (1.0 and 1.2, respectively, in particles <3 µm and >3 µm in diameter) [54,55].
Another indicator, the OC/EC ratio, was at the level of 14.0 during the holiday period (with an average of 11.4 in the entire measurement period), which proves the significant role of vegetation in forming the high concentrations of organic carbon at that time [62]. This compound could be present in aerosols as a consequence of naturally occurring processes, i.e., emission of plant spores, pollen, vegetation debris, microorganisms, and organic matter from the soil surface and the nearby sea [32,57,64,65,66,67,68]. The value of the coefficient was always higher in the smaller aerosols, both in the morning and afternoon hours (12.3 and 23.4, respectively) than in the aerosols with a diameter of 3 to 10 µm (8.2 and 7.1 in the morning and afternoon, respectively). It was also found that in aerosols <3 µm in diameter, the source of OC and EC origin during the summer holidays was always common, as indicated by the Pearson correlation coefficient between the concentrations of OC and EC (r = 0.8 and r = 0.95, respectively in the morning hours and afternoon). In particles >3 µm in diameter during the holiday season, no common source of OC and EC origin was established during any of the road traffic peak hours (Pearson correlation r < 0.5). This could be due to the fact that as much as 67% of the EC concentrations measured in these particles in the morning hours and 43% of the concentrations in the afternoon hours were below the limit of quantification of the method (Table 2). This suggests a different source of organic carbon, apart from the transport sector, is large aerosols, despite lower OC/EC values compared to small particles. Organic carbon, apart from plant vegetation, could be present at that time in large aerosols as a consequence of biomass combustion during food processing. The research was conducted in the summer, when both residents and tourists often grill [69,70,71]. It could also be a component of secondary aerosols resulting from the physical or chemical adsorption of gases on particles, which led to an increase in its concentration [72,73].
The influence of transport was noticeable during the summer holidays in small particles, especially in the morning hours, when the wind dominated from the Tri-City ring road. Its force was then up to 10 m∙s−1 (Table 1, Figure 1). During this time, the OC/EC ratio in particles <3 µm in diameter was almost two times lower than in the afternoon (23.4 and 12.3, respectively), as a consequence of the increase in EC concentration [6]. The ring road connects all the cities of the Tri-City (Gdansk, Sopot, Gdynia) and at the same time a route leading to the Hel Peninsula, which is one of the places most visited by tourists on the Polish Baltic coast during the holidays. Its significance for the increase in EC concentration in aerosols has already been reported in this area of research [34,58,61,74].
In the afternoon hours, the average wind speed was 2.8 m∙s−1 and was lower than in the morning hours (Table 1). The highest value of OC/EC recorded at that time in particles smaller than 3 µm (23.4) was the result of two times lower EC concentrations compared to the morning hours. However, since the source of OC and EC origin was common at that time (Pearson’s correlation r = 0.95), the influence of transport on the concentration of both compounds cannot be ruled out. At that time, the road leading through Gdynia, located 600 m south-west of the measuring station, can be indicated as a potential carbon compound source from the transport sector (Figure 1). On the other hand, the high values of OC concentrations in small particles present in the atmosphere over Gdynia during the afternoon hours are probably a consequence the presence of secondary organic carbon in them or/and of biomass combustion during food processing [69,70,71].

4.2. The Origin of Carbon Compounds during the School Period

During the school period (September 2015), the difference in the concentrations obtained in the morning and afternoon traffic rush hours was more pronounced than in the holiday season (Figure 4). This relationship was confirmed by the U Mann–Whitney test for PAHs (p = 0.05) and for elemental carbon (p = 0.04). Statistical significance was not confirmed for nitrates, sulphates, or organic carbon (p > 0.05).
Higher median concentrations of ∑PAH5 and EC, as well as OC, were recorded in the morning from 7:00 a.m. to 9:00 a.m. (Table 2), when children are transported to school and adults are going to work. Then, the traffic intensity in the study area increases, which could have generated an increase in air pollution from transport sources [6,75]. In the morning, when class starts at 8:00 a.m. or 9:00 a.m., dozens of cars dropping off children and running their engines are observed in front of schools. In the afternoon, high levels of traffic are spread over time. This is due to the different times that the classes end for particular groups of students and the additional activities they perform (extracurricular activities). For this reason, a large proportion of children return home on foot, without the need for a car. These factors determined the differences in the concentrations of traffic pollution in aerosols measured during the school period in the atmosphere over Gdynia in the morning and afternoon hours. In the morning, the value of the PIR/B(a)P ratio pointed to the transport source of PAHs related to combustion in diesel engines, which was almost twice as high as in the afternoon (4.0 and 2.2, respectively) [60,63]. The value of this coefficient was several times higher in small aerosol particles (4.4 and 3.4, respectively in the morning and afternoon traffic rush hours) than in large particles (1.4 and 0.8, respectively in the morning and afternoon traffic rush hours). It was found that the value of the coefficient was not affected by the concentration of B(a)P, which during the school period did not show statistically significant differences depending on the time of day (U Mann–Whitney test, p = 0.2). Both in the morning and afternoon hours, the concentration of this compound was also at a similar level in large and small particles (Table 2). Pyrene was the PAH that differentiated the PIR/B(a)P ratio during the school period. Its median differed statistically significantly depending on the time of day, both in small and large particles (Table 2), which was confirmed by the U Mann–Whitney test (p = 0.03). In the case of small aerosols, the concentration of pyrene in the morning traffic rush hours was twice as high, and in the case of large aerosols it was even three times higher than in the afternoon hours (Table 2). Such high concentrations of pyrene indicated that in the morning there was an additional source of PAHs in aerosols, apart from transport sector, probably related to the combustion of fuels for heating purposes [60,63,76]. Taking into account the beginning of autumn and the cooling that prevailed in Poland at that time, it is possible that users of detached houses in the mornings heated them more intensively using solid fuels for this purpose. This would also explain the high concentrations of fluoranthene, which is a congener of PAHs, which, in addition to transport emissions, also result from the combustion of coal and wood [60,77]. In the morning hours, the median concentration of this compound was 25.62 ng·dm−3, and it was almost two times higher than in the afternoon (13.71 ng·dm−3). In addition, high concentrations of fluoranthene in the morning were also recorded in large particles, which may confirm their non-transport source of origin (Table 2). A similar dependence was shown in large aerosols of benzo(a)anthracene, whose median concentration in the morning traffic rush hours was 0.14 ng·dm−3 and was seven times higher than that obtained in the afternoon (0.02 ng·dm−3).
During the school period, the greater impact of road transport in the morning was also confirmed by the NO3/SO42− ratio, which on average amounted to 1.2 during this time. In the afternoon, the value of the coefficient decreased to 0.9, suggesting that some of the pollutants in the atmosphere above Gdynia could come from emissions from stationary sources [54,55]. The OC/EC value during the school period was set at 6.8 and was lower in the morning than in the afternoon (5.8 and 9.1, respectively). This indicates a greater importance of transport in the emission of elemental carbon to the atmosphere during the hours of transporting children to school [64,78,79]. Similar results were obtained by Querol et al., (2013) [64] conducting research in the years 1999–2011 at 78 research stations located throughout Spain. The researchers considered areas with varying degrees of urbanization, agricultural areas, and background stations away from large cities. The lowest value of the OC/EC ratio was obtained by Querol et al., (2013) [64], similarly to this study, in the morning. It always corresponded to a marked increase in the volume of traffic.

4.3. Selected Episodes with the Highest Influence of Land and Maritime Transport

Both during the holiday and school periods, there were several interesting cases in which the concentration of the analyzed compounds was determined by meteorological conditions and the time of day. The first episode took place on 16 July 2015. Then, air masses were transported over the station from the north-west (from the North Sea), but the wind direction changed significantly with the time of day (Figure 5). The value of the NO3/SO42− ratio in PM10 was then the highest in the entire holiday season, and amounted to 1.9 on average. The concentration of ∑PAH5 was also very high (29.17 ng·dm−3). The average wind speed equal to 2.4 m·s−1 indicated a local to regional source of aerosols [58,80].
As the discussed situation occurred during the holiday season, and the air temperature that day reached 20 °C, the increase in the concentration of pollutants in the air over Gdynia could have been caused by increased tourist traffic towards the beaches of Tri-City. In the morning hours (7:00–9:00 a.m.), when the wind direction from the ring road dominated (Figure 5a) and the wind speed was up to 7 m·s−1, the value of the NO3/SO42− coefficient in PM10 aerosols measured in Gdynia increased to 2.2. This indicated the transport source of the pollution origin at that time [5,55]. This was confirmed by the low value of the OC/EC ratio compared to the average for the entire holiday period (11.5 and 19.6, respectively) [64]. Additionally, on the morning of 16 July the maximum ∑PAH5 concentration was recorded (37.7 ng·dm−3), which also proves the significant influence of transport [75]. In the afternoon, the winds were blowing from east to south-east from the streets around the station. The wind speed was already low (1.4 m·s−1), which led to less dispersion of pollutants. For this reason, the concentration of ∑PAH5 remained at a high level (20.7 ng∙dm−3). Additionally, the value of the NO3/SO42− coefficient was similar to that in the morning (1.9).
The next episode took place on 20 July 2015, when the wind was coming from the north-west (Figure 6). On that day, the concentration of nitrates was very low, with an average of 0.7 µg·dm−3, while the concentration of sulfates was high and amounted to 1.1 µg·dm−3 (mean 0.67 µg·dm−3). Consequently, the NO3/SO42− ratio had a very small value of 0.1. Taking into account the proximity of the port and the incoming wind from its region, the probable sources of pollution in the atmosphere above the research station were day shipping and port activity [81]. The value of the OC/EC ratio was high (18.4) and did not indicate a large share of elemental carbon in aerosols at that time. However, the high concentration of ∑PAH5 (15.8 ng·dm−3) and the obtained value of the PIR/B(a)P ratio at the level of 16.1 may suggest the presence of carbon compounds emitted to the atmosphere from combustion in diesel engines. As on that day the wind speed reached 8.5 m·s−1, the pollutants were well dispersed. On the next measuring day, the concentrations had halved.
Another situation was recorded on 16 September 2015, when the NO3/SO42− ratio reached its maximum value during the entire measurement period, equal to 2.7. The likely cause of the increase in nitrate concentration was the film festival taking place in Gdynia and the related increased traffic volume. On that day, the wind direction from the east (in the morning) and from the south-east (afternoon hours) was recorded (Figure 7). The wind speed was low (on average 1.4 m·s−1), which led to the accumulation of pollutants close to the emission source and their poor dispersion [5,80]. The obtained value of the PIR/B(a)P ratio, amounting to an average of 2.2, indicated the role of petrol-powered cars in the formation of high concentrations of ∑PAH5 (20.75 ng·dm−3).
The role of transport on that day was clear, both in the morning and in the afternoon rush hours. From 7:00 a.m. to 9:00 a.m. the NO3/SO42− ratio was equal to 2.3, and from 3:00 to 5:00 p.m. it adopted the highest value over the entire measurement period, amounting to 2.9. It was found that the source of air pollution, determined using the PIR/B(a)P ratio, was related to the emissions from combustion in gasoline engines, both in the morning and in the afternoon (1.7 and 2.5, respectively). In the morning, when the average wind speed was very low and averaged 0.7 m·s−1, the concentration of ∑PAH5 reached 31.5 ng·dm−3. In the afternoon, when the wind speed doubled (1.7 m·s−1 on average), the concentration of ∑PAH5 decreased to 10.0 ng·dm−3. In the morning, in the vicinity of the research station, there could be a greater accumulation of local pollutants. In turn, in the afternoon, pollutants could be transported from the important roads located on the southeast and east of the measuring station [80,82]. Many of them are access roads to nearby schools (Figure 2).

5. Conclusions

PM10 measurements conducted in the coastal zone of the Baltic Sea in 2015 indicated higher concentrations of nitrate, sulphate, and elemental carbon in the school period, while the concentration of organic carbon in aerosols was higher during the holidays. In the case of PAHs concentration, the difference between the school and vacation periods was not clear. While the concentrations of fluoranthene, chrysene, and pyrene were higher during the holidays, the concentration of B(a)P and B(a)A were higher in the school period.
The analysis of aerosol pollution markers suggested that during the holidays, the quality of the surrounding air was mainly determined by the combustion of diesel oil in transport related to tourism, passenger ships, and port activity. These sources apparently appeared in the morning hours (7:00–9:00 a.m.). During the school period, the main source of pollutants was gasoline combustion. At the beginning of autumn, due to the drop in air temperature, the role of the heating sector also cannot be ignored.
The highest mean values of the ΣPAHs5 and EC were recorded in small particles (<3 μm in diameter) during the school period, which were found in the morning road traffic peak hours. The mean concentration of OC was also the highest in small aerosols during the holiday period. However, there were no statistically significant differences between the concentrations of organic carbon concentration in the morning and afternoon peak hours. Strict sampling and measurement procedure, together with analysis of air mass backward trajectories and pollutant markers, indicated that the role of land transport was the greatest when local to regional winds prevailed, bringing pollution from nearby schools and the beltway.

Author Contributions

Conceptualization, A.U.L.; data curation, J.K.B., K.A.W., and K.V.B.; formal analysis, J.K.B., K.A.W., and K.V.B.; funding acquisition, A.U.L. and M.S.; investigation, J.K.B. and K.V.B.; methodology, M.S. and A.U.L.; project administration, A.U.L.; resources, A.U.L., M.S., and K.V.B.; supervision, A.U.L.; validation, A.U.L. and M.S.; visualization, J.K.B. and K.A.W.; writing—original draft, J.K.B., A.U.L., and M.S.; writing—review and editing, A.U.L. All authors have read and agreed to the published version of the manuscript.

Funding

This research received no external funding.

Institutional Review Board Statement

Not applicable.

Informed Consent Statement

Not applicable.

Data Availability Statement

Not applicable.

Conflicts of Interest

The authors declare no conflict of interest.

References

  1. Viana, M.; Kuhlbusch, T.A.J.; Querol, X.; Alastuey, A.; Harrison, R.M.; Hopke, P.K.; Winiwarter, W.; Vallius, M.; Szidat, S.; Prévôt, A.S.H.; et al. Source Apportionment of Particulate Matter in Europe: A Review of Methods and Results. J. Aerosol Sci. 2008, 39, 827–849. [Google Scholar] [CrossRef]
  2. Jandacka, D.; Durcanska, D.; Bujdos, M. The Contribution of Road Traffic to Particulate Matter and Metals in Air Pollution in the Vicinity of an Urban Road. Transp. Res. Part D Transp. Environ. 2017, 50, 397–408. [Google Scholar] [CrossRef]
  3. Donateo, A.; Gregoris, E.; Gambaro, A.; Merico, E.; Giua, R.; Nocioni, A.; Contini, D. Contribution of Harbour Activities and Ship Traffic to PM2.5, Particle Number Concentrations and PAHs in a Port City of the Mediterranean Sea (Italy). Environ. Sci. Pollut. Res. 2014, 21, 9415–9429. [Google Scholar] [CrossRef]
  4. Merico, E.; Gambaro, A.; Argiriou, A.; Alebic-Juretic, A.; Barbaro, E.; Cesari, D.; Chasapidis, L.; Dimopoulos, S.; Dinoi, A.; Donateo, A.; et al. Atmospheric Impact of Ship Traffic in Four Adriatic-Ionian Port-Cities: Comparison and Harmonization of Different Approaches. Transp. Res. Part D Transp. Environ. 2017, 50, 431–445. [Google Scholar] [CrossRef]
  5. Abu-Allaban, M.; Gillies, J.A.; Gertler, A.W.; Clayton, R.; Proffitt, D. Tailpipe, Resuspended Road Dust, and Brake-Wear Emission Factors from on-Road Vehicles. Atmos. Environ. 2003, 37, 5283–5293. [Google Scholar] [CrossRef]
  6. Keuken, M.P.; Zandveld, P.; Jonkers, S.; Moerman, M.; Jedynska, A.D.; Verbeek, R.; Visschedijk, A.; Elshout, S.; Panteliadis, P.; Velders, G.J.M. Modelling Elemental Carbon at Regional, Urban and Traffic Locations in The Netherlands. Atmos. Environ. 2013, 73, 73–80. [Google Scholar] [CrossRef]
  7. Arnott, W.P.; Zielinska, B.; Rogers, C.F.; Sagebiel, J.; Park, K.; Chow, J.; Moosmüller, H.; Watson, J.G.; Kelly, K.; Wagner, D.; et al. Evaluation of 1047-Nm Photoacoustic Instruments and Photoelectric Aerosol Sensors in Source-Sampling of Black Carbon Aerosol and Particle-Bound PAHs from Gasoline and Diesel Powered Vehicles. Environ. Sci. Technol. 2005, 39, 5398–5406. [Google Scholar] [CrossRef] [PubMed]
  8. Geller, M.D.; Sardar, S.B.; Phuleria, H.; Fine, P.M.; Sioutas, C. Measurements of Particle Number and Mass Concentrations and Size Distributions in a Tunnel Environment. Environ. Sci. Technol. 2005, 39, 8653–8663. [Google Scholar] [CrossRef] [PubMed]
  9. Piątkowski, P.; Bohdal, T. Testing of Ecological Properties of Spark Ignition Engine Fed with LPG Mixture. Rocz. Ochr. Srodowiska 2011, 13, 607–618. [Google Scholar]
  10. Kanakidou, M.; Seinfeld, J.H.; Pandis, S.N.; Barnes, I.; Dentener, F.J.; Facchini, M.C.; Van Dingenen, R.; Ervens, B.; Nenes, A.; Nielsen, C.J.; et al. Organic Aerosol and Global Climate Modelling: A Review. Atmos. Chem. Phys. 2005, 5, 1053–1123. [Google Scholar] [CrossRef] [Green Version]
  11. Lang, J.; Zhang, Y.; Zhou, Y.; Cheng, S.; Chen, D.; Guo, X.; Chen, S.; Li, X.; Xing, X.; Wang, H. Trends of PM2.5 and Chemical Composition in Beijing, 2000–2015. Aerosol Air Qual. Res. 2017, 17, 412–425. [Google Scholar] [CrossRef]
  12. Zhang, Y.X. Study on Speciation of Particulate Organic Matter from Combustion Sources; Beking University: Beijing, China, 2006. [Google Scholar]
  13. Cai, T.; Zhang, Y.; Fang, D.; Shang, J.; Zhang, Y.; Zhang, Y. Chinese Vehicle Emissions Characteristic Testing with Small Sample Size: Results and Comparison. Atmos. Pollut. Res. 2017, 8, 154–163. [Google Scholar] [CrossRef] [Green Version]
  14. Available online: www.epa.gov (accessed on 30 June 2021).
  15. Boothe, V.L.; Shendell, D.G. Potential Health Effects Associated with Residential Proximity to Freeways and Primary Roads: Review of Scientific Literature, 1999–2006. J. Environ. Health 2008, 70, 33–41. [Google Scholar] [PubMed]
  16. Dockery, D.W.; Pope, C.A. Acute Respiratory Effects of Particulate Air Pollution. Annu. Rev. Public Health 1994, 15, 107–132. [Google Scholar] [CrossRef]
  17. Dockery, D.W.; Pope, C.A.; Xu, X.; Spengler, J.D.; Ware, J.H.; Fay, M.E.; Ferris, B.G.; Speizer, F.E. An Association between Air Pollution and Mortality in Six U.S. Cities. N. Engl. J. Med. 1993, 329, 1753–1759. [Google Scholar] [CrossRef] [Green Version]
  18. de Kok, T.M.C.M.; Driece, H.A.L.; Hogervorst, J.G.F.; Briedé, J.J. Toxicological Assessment of Ambient and Traffic-Related Particulate Matter: A Review of Recent Studies. Mutat. Res. Rev. Mutat. Res. 2006, 613, 103–122. [Google Scholar] [CrossRef] [PubMed]
  19. Rogula-Kozłowska, W.; Rogula-Kopiec, P.; Klejnowski, K.; Błaszczyk, J. Influence of traffic emission on the concentration of two forms of carbon and their mass distribution in relation to the particle size in the atmospheric aerosol of an urban area. Annu. Set Environ. Prot. 2013, 15, 1623–1644. (In Polish) [Google Scholar]
  20. Hassanvand, M.S.; Naddafi, K.; Faridi, S.; Nabizadeh, R.; Sowlat, M.H.; Momeniha, F.; Gholampour, A.; Arhami, M.; Kashani, H.; Zare, A.; et al. Characterization of PAHs and Metals in Indoor/Outdoor PM10/PM2.5/PM1 in a Retirement Home and a School Dormitory. Sci. Total Environ. 2015, 527–528, 100–110. [Google Scholar] [CrossRef] [PubMed]
  21. Witkowska, A.; Lewandowska, A.U. Water Soluble Organic Carbon in Aerosols (PM1, PM2.5, PM10) and Various Precipitation Forms (Rain, Snow, Mixed) over the Southern Baltic Sea Station. Sci. Total Environ. 2016, 573, 337–346. [Google Scholar] [CrossRef] [PubMed]
  22. Witkowska, A.; Lewandowska, A.U.; Saniewska, D.; Falkowska, L.M. Effect of Agriculture and Vegetation on Carbonaceous Aerosol Concentrations (PM2.5 and PM10) in Puszcza Borecka National Nature Reserve (Poland). Air Qual. Atmos. Health 2016, 9, 761–773. [Google Scholar] [CrossRef] [PubMed] [Green Version]
  23. Peterson, B.S.; Rauh, V.A.; Bansal, R.; Hao, X.; Toth, Z.; Nati, G.; Walsh, K.; Miller, R.L.; Arias, F.; Semanek, D.; et al. Effects of Prenatal Exposure to Air Pollutants (Polycyclic Aromatic Hydrocarbons) on the Development of Brain White Matter, Cognition, and Behavior in Later Childhood. JAMA Psychiatry 2015, 72, 531–540. [Google Scholar] [CrossRef]
  24. Chen, S.; Gao, C.; Tang, W.; Zhu, H.; Han, Y.; Jiang, Q.; Li, T.; Cao, X.; Wang, Z. Self-Powered Cleaning of Air Pollution by Wind Driven Triboelectric Nanogenerator. Nano Energy 2015, 14, 217–225. [Google Scholar] [CrossRef]
  25. Wilker, E.H.; Preis, S.R.; Beiser, A.S.; Wolf, P.A.; Au, R.; Kloog, I.; Li, W.; Schwartz, J.; Koutrakis, P.; DeCarli, C.; et al. Long-Term Exposure to Fine Particulate Matter, Residential Proximity to Major Roads and Measures of Brain Structure. Stroke 2015, 46, 1161–1166. [Google Scholar] [CrossRef] [PubMed] [Green Version]
  26. World Health Organization. Effects of Air Pollution on Children’s Health and Development: A Review of the Evidence; WHO: Geneva, Switzerland, 2005. [Google Scholar]
  27. Perera, F.P.; Wang, S.; Rauh, V.; Zhou, H.; Stigter, L.; Camann, D.; Jedrychowski, W.; Mroz, E.; Majewska, R. Prenatal Exposure to Air Pollution, Maternal Psychological Distress, and Child Behavior. Pediatrics 2013, 132, e1284–e1294. [Google Scholar] [CrossRef] [PubMed] [Green Version]
  28. Available online: www.imgw.pl (accessed on 30 June 2021).
  29. Schmid, H.; Laskus, L.; Jürgen Abraham, H.; Baltensperger, U.; Lavanchy, V.; Bizjak, M.; Burba, P.; Cachier, H.; Crow, D.; Chow, J.; et al. Results of the “Carbon Conference” International Aerosol Carbon Round Robin Test Stage I. Atmos. Environ. 2001, 35, 2111–2121. [Google Scholar] [CrossRef]
  30. Cavalli, F.; Viana, M.; Yttri, K.E.; Genberg, J.; Putaud, J.-P. Toward a Standardised Thermal-Optical Protocol for Measuring Atmospheric Organic and Elemental Carbon: The EUSAAR Protocol. Atmos. Meas. Tech. 2010, 3, 79–89. [Google Scholar] [CrossRef] [Green Version]
  31. Wiśniewska, K.; Lewandowska, A.U.; Witkowska, A. Factors Determining Dry Deposition of Total Mercury and Organic Carbon in House Dust of Residents of the Tri-City and the Surrounding Area (Baltic Sea Coast). Air Qual. Atmos. Health 2017, 10, 821–832. [Google Scholar] [CrossRef] [Green Version]
  32. Wiśniewska, K.; Lewandowska, A.U.; Staniszewska, M. Air Quality at Two Stations (Gdynia and Rumia) Located in the Region of Gulf of Gdansk during Periods of Intensive Smog in Poland. Air Qual. Atmos. Health 2019, 12, 879–890. [Google Scholar] [CrossRef] [Green Version]
  33. Staniszewska, M.; Graca, B.; Bełdowska, M.; Saniewska, D. Factors Controlling Benzo(a)Pyrene Concentration in Aerosols in the Urbanized Coastal Zone. A Case Study: Gdynia, Poland (Southern Baltic Sea). Environ. Sci. Pollut. Res. 2013, 20, 4154–4163. [Google Scholar] [CrossRef] [Green Version]
  34. Lewandowska, A.U.; Staniszewska, M.; Witkowska, A.; Machuta, M.; Falkowska, L. Benzo(a)Pyrene Parallel Measurements in PM1 and PM2.5 in the Coastal Zone of the Gulf of Gdansk (Baltic Sea) in the Heating and Non-Heating Seasons. Environ. Sci. Pollut. Res. 2018, 25, 19458–19469. [Google Scholar] [CrossRef] [Green Version]
  35. Falkowska, L.; Lewandowska, A. Sulphates in Particles of Different Sizes in the Marine Boundary Layer over the Southern Baltic Sea. Oceanologia 2004, 46. [Google Scholar]
  36. Available online: https://bip.um.gdynia.pl/ (accessed on 30 June 2021).
  37. Na, K.; Sawant, A.A.; Song, C.; Cocker, D.R. Primary and Secondary Carbonaceous Species in the Atmosphere of Western Riverside County, California. Atmos. Environ. 2004, 38, 1345–1355. [Google Scholar] [CrossRef]
  38. Lonati, G.; Ozgen, S.; Giugliano, M. Primary and Secondary Carbonaceous Species in PM2.5 Samples in Milan (Italy). Atmos. Environ. 2007, 41, 4599–4610. [Google Scholar] [CrossRef]
  39. Pio, C.; Cerqueira, M.; Harrison, R.M.; Nunes, T.; Mirante, F.; Alves, C.; Oliveira, C.; Sanchez de la Campa, A.; Artíñano, B.; Matos, M. OC/EC Ratio Observations in Europe: Re-Thinking the Approach for Apportionment between Primary and Secondary Organic Carbon. Atmos. Environ. 2011, 45, 6121–6132. [Google Scholar] [CrossRef]
  40. Cesari, D.; Merico, E.; Dinoi, A.; Marinoni, A.; Bonasoni, P.; Contini, D. Seasonal Variability of Carbonaceous Aerosols in an Urban Background Area in Southern Italy. Atmos. Res. 2018, 200, 97–108. [Google Scholar] [CrossRef]
  41. Gu, J.; Bai, Z.; Liu, A.; Wu, L.; Xie, Y.; Li, W.; Dong, H.; Zhang, X. Characterization of Atmospheric Organic Carbon and Element Carbon of PM2.5 and PM10 at Tianjin, China. Aerosol Air Qual. Res. 2010, 10, 167–176. [Google Scholar] [CrossRef] [Green Version]
  42. Watson, J.G.; Chow, J.C.; Lowenthal, D.H.; Pritchett, L.C.; Frazier, C.A.; Neuroth, G.R.; Robbins, R. Differences in the Carbon Composition of Source Profiles for Diesel- and Gasoline-Powered Vehicles. Atmos. Environ. 1994, 28, 2493–2505. [Google Scholar] [CrossRef]
  43. Cao, J.J.; Lee, S.C.; Ho, K.F.; Zou, S.C.; Fung, K.; Li, Y.; Watson, J.G.; Chow, J.C. Spatial and Seasonal Variations of Atmospheric Organic Carbon and Elemental Carbon in Pearl River Delta Region, China. Atmos. Environ. 2004, 38, 4447–4456. [Google Scholar] [CrossRef]
  44. Chow, J.C.; Watson, J.G.; Kuhns, H.; Etyemezian, V.; Lowenthal, D.H.; Crow, D.; Kohl, S.D.; Engelbrecht, J.P.; Green, M.C. Source Profiles for Industrial, Mobile, and Area Sources in the Big Bend Regional Aerosol Visibility and Observational Study. Chemosphere 2004, 54, 185–208. [Google Scholar] [CrossRef]
  45. Bautista, A.T.; Pabroa, P.C.B.; Santos, F.L.; Racho, J.M.D.; Quirit, L.L. Carbonaceous Particulate Matter Characterization in an Urban and a Rural Site in the Philippines. Atmos. Pollut. Res. 2014, 5, 245–252. [Google Scholar] [CrossRef] [Green Version]
  46. Shen, Z.; Cao, J.; Arimoto, R.; Han, Y.; Zhu, C.; Tian, J.; Liu, S. Chemical Characteristics of Fine Particles (PM1) from Xi’an, China. Aerosol Sci. Technol. 2010, 44, 461–472. [Google Scholar] [CrossRef]
  47. Watson, J.G.; Chow, J.C.; Chen, L.-W.A.; Lowenthal, D.H.; Fujita, E.M.; Kuhns, H.D.; Sodeman, D.A.; Campbell, D.E.; Moosmüller, H.; Zhu, D.; et al. Particulate Emission Factors for Mobile Fossil Fuel and Biomass Combustion Sources. Sci. Total Environ. 2011, 409, 2384–2396. [Google Scholar] [CrossRef] [PubMed]
  48. Tiitta, P.; Vakkari, V.; Croteau, P.; Beukes, J.P.; van Zyl, P.G.; Josipovic, M.; Venter, A.D.; Jaars, K.; Pienaar, J.J.; Ng, N.L.; et al. Chemical Composition, Main Sources and Temporal Variability of PM1 Aerosols in Southern African Grassland. Atmos. Chem. Phys. 2014, 14, 1909–1927. [Google Scholar] [CrossRef] [Green Version]
  49. Yu, J.Z.; Huang, X.H.H.; Ho, S.S.H.; Bian, Q. Nonpolar Organic Compounds in Fine Particles: Quantification by Thermal Desorption–GC/MS and Evidence for Their Significant Oxidation in Ambient Aerosols in Hong Kong. Anal. Bioanal. Chem. 2011, 401, 3125–3139. [Google Scholar] [CrossRef] [PubMed]
  50. Hildemann, L.M.; Markowski, G.R.; Cass, G.R. Chemical Composition of Emissions from Urban Sources of Fine Organic Aerosol. Environ. Sci. Technol. 1991, 25, 744–759. [Google Scholar] [CrossRef] [Green Version]
  51. Masclet, P.; Mouvier, G.; Nikolaou, K. Relative Decay Index and Sources of Polycyclic Aromatic Hydrocarbons. Atmos. Environ. (1967) 1986, 20, 439–446. [Google Scholar] [CrossRef]
  52. Miguel, A.H.; Kirchstetter, T.W.; Harley, R.A.; Hering, S.V. On-Road Emissions of Particulate Polycyclic Aromatic Hydrocarbons and Black Carbon from Gasoline and Diesel Vehicles. Environ. Sci. Technol. 1998, 32, 450–455. [Google Scholar] [CrossRef]
  53. Duan, X.; Shen, G.; Yang, H.; Tian, J.; Wei, F.; Gong, J.; Zhang, J. Dietary Intake Polycyclic Aromatic Hydrocarbons (PAHs) and Associated Cancer Risk in a Cohort of Chinese Urban Adults: Inter- and Intra-Individual Variability. Chemosphere 2016, 144, 2469–2475. [Google Scholar] [CrossRef] [Green Version]
  54. Wang, Z.; Zhang, X.; Chen, Z.; Zhang, Y. Mercury Concentrations in Size-Fractionated Airborne Particles at Urban and Suburban Sites in Beijing, China. Atmos. Environ. 2006, 40, 2194–2201. [Google Scholar] [CrossRef]
  55. Lai, S.; Zou, S.; Cao, J.; Lee, S.; Ho, K. Characterizing Ionic Species in PM2.5 and PM10 in Four Pearl River Delta Cities, South China. J. Environ. Sci. 2007, 19, 939–947. [Google Scholar] [CrossRef]
  56. Available online: www.arl.noaa.gov/ready/hysplit4.html (accessed on 30 June 2021).
  57. Lewandowska, A.; Falkowska, L.; Murawiec, D.; Pryputniewicz, D.; Burska, D.; Bełdowska, M. Elemental and Organic Carbon in Aerosols over Urbanized Coastal Region (Southern Baltic Sea, Gdynia). Sci. Total Environ. 2010, 408, 4761–4769. [Google Scholar] [CrossRef] [PubMed]
  58. Lewandowska, A.U.; Falkowska, L.M. Sea salt in aerosols over the southern Baltic. Part 1. The generation and transportation of marine particles. Oceanologia 2013, 55, 279–298. [Google Scholar] [CrossRef]
  59. Available online: https://bdl.stat.gov.pl (accessed on 30 June 2021).
  60. Ravindra, K.; Sokhi, R.; Van Grieken, R. Atmospheric Polycyclic Aromatic Hydrocarbons: Source Attribution, Emission Factors and Regulation. Atmos. Environ. 2008, 42, 2895–2921. [Google Scholar] [CrossRef] [Green Version]
  61. Skalska, K.; Lewandowska, A.U.; Staniszewska, M.; Reindl, A.; Witkowska, A.; Falkowska, L. Sources, Deposition Flux and Carcinogenic Potential of PM2.5-Bound Polycyclic Aromatic Hydrocarbons in the Coastal Zone of the Baltic Sea (Gdynia, Poland). Air Qual. Atmos. Health 2019, 12, 1291–1301. [Google Scholar] [CrossRef] [Green Version]
  62. Ravindra, K.; Bencs, L.; Wauters, E.; de Hoog, J.; Deutsch, F.; Roekens, E.; Bleux, N.; Berghmans, P.; Van Grieken, R. Seasonal and Site-Specific Variation in Vapour and Aerosol Phase PAHs over Flanders (Belgium) and Their Relation with Anthropogenic Activities. Atmos. Environ. 2006, 40, 771–785. [Google Scholar] [CrossRef] [Green Version]
  63. Tobiszewski, M.; Namieśnik, J. PAH Diagnostic Ratios for the Identification of Pollution Emission Sources. Environ. Pollut. 2012, 162, 110–119. [Google Scholar] [CrossRef]
  64. Querol, X.; Alastuey, A.; Viana, M.; Moreno, T.; Reche, C.; Minguillón, M.C.; Ripoll, A.; Pandolfi, M.; Amato, F.; Karanasiou, A.; et al. Variability of Carbonaceous Aerosols in Remote, Rural, Urban and Industrial Environments in Spain: Implications for Air Quality Policy. Atmos. Chem. Phys. 2013, 13, 6185–6206. [Google Scholar] [CrossRef] [Green Version]
  65. Duan, F.; Liu, X.; Yu, T.; Cachier, H. Identification and Estimate of Biomass Burning Contribution to the Urban Aerosol Organic Carbon Concentrations in Beijing. Atmos. Environ. 2004, 38, 1275–1282. [Google Scholar] [CrossRef]
  66. Kim, W.; Lee, H.; Kim, J.; Jeong, U.; Kweon, J. Estimation of Seasonal Diurnal Variations in Primary and Secondary Organic Carbon Concentrations in the Urban Atmosphere: EC Tracer and Multiple Regression Approaches. Atmos. Environ. 2012, 56, 101–108. [Google Scholar] [CrossRef]
  67. Lewandowska, A.U.; Śliwińska-Wilczewska, S.; Woźniczka, D. Identification of Cyanobacteria and Microalgae in Aerosols of Various Sizes in the Air over the Southern Baltic Sea. Mar. Pollut. Bull. 2017, 125, 30–38. [Google Scholar] [CrossRef]
  68. Wiśniewska, K.A.; Śliwińska-Wilczewska, S.; Lewandowska, A.U. The First Characterization of Airborne Cyanobacteria and Microalgae in the Adriatic Sea Region. PLoS ONE 2020, 15, e0238808. [Google Scholar] [CrossRef] [PubMed]
  69. Chow, J.C.; Watson, J.G.; Chen, L.-W.A.; Rice, J.; Frank, N.H. Quantification of PM2.5 Organic Carbon Sampling Artifacts in US Networks. Atmos. Chem. Phys. 2010, 10, 5223–5239. [Google Scholar] [CrossRef] [Green Version]
  70. Minguillón, M.C.; Perron, N.; Querol, X.; Szidat, S.; Fahrni, S.M.; Alastuey, A.; Jimenez, J.L.; Mohr, C.; Ortega, A.M.; Day, D.A.; et al. Fossil versus Contemporary Sources of Fine Elemental and Organic Carbonaceous Particulate Matter during the DAURE Campaign in Northeast Spain. Atmos. Chem. Phys. 2011, 11, 12067–12084. [Google Scholar] [CrossRef] [Green Version]
  71. Mohr, C.; DeCarlo, P.F.; Heringa, M.F.; Chirico, R.; Slowik, J.G.; Richter, R.; Reche, C.; Alastuey, A.; Querol, X.; Seco, R.; et al. Identification and Quantification of Organic Aerosol from Cooking and Other Sources in Barcelona Using Aerosol Mass Spectrometer Data. Atmos. Chem. Phys. 2012, 12, 1649–1665. [Google Scholar] [CrossRef] [Green Version]
  72. Marenco, F.; Bonasoni, P.; Calzolari, F.; Ceriani, M.; Chiari, M.; Cristofanelli, P.; D’Alessandro, A.; Fermo, P.; Lucarelli, F.; Mazzei, F.; et al. Characterization of Atmospheric Aerosols at Monte Cimone, Italy, during Summer 2004: Source Apportionment and Transport Mechanisms. J. Geophys. Res. Atmos. 2006, 111. [Google Scholar] [CrossRef] [Green Version]
  73. Cerqueira, M.; Pio, C.; Legrand, M.; Puxbaum, H.; Kasper-Giebl, A.; Afonso, J.; Preunkert, S.; Gelencsér, A.; Fialho, P. Particulate Carbon in Precipitation at European Background Sites. J. Aerosol Sci. 2010, 41, 51–61. [Google Scholar] [CrossRef] [Green Version]
  74. Lewandowska, A.U.; Bełdowska, M.; Witkowska, A.; Falkowska, L.; Wiśniewska, K. Mercury Bonds with Carbon (OC and EC) in Small Aerosols (PM1) in the Urbanized Coastal Zone of the Gulf of Gdansk (Southern Baltic). Ecotoxicol. Environ. Saf. 2018, 157, 350–357. [Google Scholar] [CrossRef]
  75. Alves, C.A.; Vicente, A.M.P.; Gomes, J.; Nunes, T.; Duarte, M.; Bandowe, B.A.M. Polycyclic Aromatic Hydrocarbons (PAHs) and Their Derivatives (Oxygenated-PAHs, Nitrated-PAHs and Azaarenes) in Size-Fractionated Particles Emitted in an Urban Road Tunnel. Atmos. Res. 2016, 180, 128–137. [Google Scholar] [CrossRef]
  76. Tolis, E.I.; Saraga, D.E.; Filiou, K.F.; Tziavos, N.I.; Tsiaousis, C.P.; Dinas, A.; Bartzis, J.G. One-Year Intensive Characterization on PM2.5 Nearby Port Area of Thessaloniki, Greece. Environ. Sci. Pollut. Res. 2015, 22, 6812–6826. [Google Scholar] [CrossRef]
  77. Bernalte, E.; Marín Sánchez, C.; Pinilla Gil, E.; Cereceda Balic, F.; Vidal Cortez, V. An Exploratory Study of Particulate PAHs in Low-Polluted Urban and Rural Areas of Southwest Spain: Concentrations, Source Assignment, Seasonal Variation and Correlations with Other Air Pollutants. Water Air Soil Pollut. 2012, 223, 5143–5154. [Google Scholar] [CrossRef]
  78. Zielinska, B.; Sagebiel, J.; McDonald, J.D.; Whitney, K.; Lawson, D.R. Emission Rates and Comparative Chemical Composition from Selected In-Use Diesel and Gasoline-Fueled Vehicles. J. Air Waste Manag. Assoc. 2004, 54, 1138–1150. [Google Scholar] [CrossRef] [PubMed]
  79. El Haddad, I.; Marchand, N.; Dron, J.; Temime-Roussel, B.; Quivet, E.; Wortham, H.; Jaffrezo, J.L.; Baduel, C.; Voisin, D.; Besombes, J.L.; et al. Comprehensive Primary Particulate Organic Characterization of Vehicular Exhaust Emissions in France. Atmos. Environ. 2009, 43, 6190–6198. [Google Scholar] [CrossRef]
  80. Michalski, M.-C.; Michel, F.; Sainmont, D.; Briard, V. Apparent ζ-Potential as a Tool to Assess Mechanical Damages to the Milk Fat Globule Membrane. Colloids Surf. B Biointerfaces 2002, 23, 23–30. [Google Scholar] [CrossRef]
  81. Evangelos, K. The Impact of Vegetation on Ohe Characteristics of the Flow in an Inclined Open Channel Using the Piv Method. J. Water Resour. Ocean Sci. 2012, 1, 1. [Google Scholar] [CrossRef]
  82. Falkowska, L.; Lewandowska, A. Aerosols and Gases in the Earth’s Atmosphere-Global Changes; University of Gdańsk: Gdańsk, Poland, 2009; ISBN 978-83-7326-624-7. [Google Scholar]
Figure 1. Location of the measuring station along with the surrounding traffic routes.
Atmosphere 12 01005 g001
Figure 2. Location of the measuring station along with the surrounding schools.
Atmosphere 12 01005 g002
Figure 3. Statistical characteristics of the concentration of (a) PAH5, (b) nitrate and sulphate ions, (c) and OC and EC in the morning and afternoon rush hours in the atmosphere over Gdynia during the holiday season of 2015.
Atmosphere 12 01005 g003
Figure 4. Statistical characteristics of the concentration of: (a) PAHs, (b) nitrate and sulphate ions, (c) and OC and EC in the morning and afternoon rush hours in the atmosphere over Gdynia during the school period in 2015.
Atmosphere 12 01005 g004
Figure 5. Dominant wind direction in the morning (a) and the afternoon (b) and the dominant air masses (c) on 16 July 2015 in Gdynia.
Atmosphere 12 01005 g005
Figure 6. Dominant wind direction (a) and dominant air masses (b) on 20 July 2015 in Gdynia.
Atmosphere 12 01005 g006
Figure 7. Dominant wind direction in the morning (a) and the afternoon (b) and dominant air masses (c) on 16 September 2015 in Gdynia.
Atmosphere 12 01005 g007
Table 1. Statistical characteristics of meteorological data during the research conducted in Gdynia in 2015.
Holiday Period
(13–21 July 2015)
School Period
(14–30 July 2015)
7:00–9:00 a.m.
Average
(Min–Max)
3:00–5:00 p.m.
Average
(Min–Max)
7:00–9:00 a.m.
Average
(Min–Max)
3:00–5:00 p.m.
Average
(Min–Max)
T [°C]18.9 ± 1.2
(15.3–21.3)
19. 4 ± 2.2
(16.8–26.8)
15.9 ± 2.4
(12.4–20.7)
16.8 ± 2.3
(11.5–20.0)
Rh [%]54 ± 8
(31–72)
55 ± 7
(39–77)
64 ± 9
(44–78)
60 ± 8
(41–83)
Vw [m/s]3.5 ± 0.8
(0.6–9.8)
2.8 ± 1.2
(0.2–8.5)
2.1 ± 0.9
(0.1–6.5)
1.9 ± 0.9
(0.3–6.4)
P [hPa]1007 ± 4
(1001–1012)
1008 ± 3
(1003–1012)
1015 ± 13
(1002–1033)
1015 ± 14
(999–1033)
∑ precipitation
[mm]
835
Wind Direction Atmosphere 12 01005 i001
7:00–9:00 a.m.
Atmosphere 12 01005 i002
3:00–5:00 p.m.
Atmosphere 12 01005 i003
7:00–9:00 a.m.
Atmosphere 12 01005 i004
3:00–5:00 p.m.
Table 2. Statistical characteristics of PAHs, OC, and EC concentrations and selected ionic aerosol components during the morning and afternoon traffic peak during school and holiday periods.
ParameterAerosol Size
[µm]
Holiday Period
(13–21 July 2015)
School Period
(14–30 September 2015)
7:00–9:00 a.m.
Average
(Min–Max)
3:00–5:00 p.m.
Average
(Min–Max)
7:00–9:00 a.m.
Average
(Min–Max)
3:00–5:00 p.m.
Average
(Min–Max)
ΣPAH5 [ng∙m−3]<315.44 ± 9.15
(3.12–26.66)
13.68 ± 8.21
(3.54–25.61)
11.04 ± 4.99
(5.77–18.42)
7.96 ± 4.67
(4.28–17.81)
3–106.24 ± 6.88
(0.74–19.90)
5.46 ± 3.98
(0.52–10.55)
20.15 ± 22.9
(0.64–57.71)
4.95 ± 3.58
(0.38–8.90)
Benzo(a)anthracene B(a)A [ng∙m−3]<30.04 ± 0.02
(0.02–0.06)
0.04 ± 0.06
(LD-0.14)
0.03 ± 0.02
(0.01–0.1)
0.02 ± 0.01
(0.01–0.02)
3–100.02 ± 0.03
(LD-0.06)
0.03 ± 0.02
(LD-0.06)
0.14 ± 0.07
(0.09–0.20)
0.02 ± 0.01
(0.01–0.03)
Benzo(a)pyrene
B(a)P [ng∙m−3]
<30.04 ± 0.04
(0.01–0.11)
0.03 ± 0.02
(LD-0.07)
0.02 ± 0.01
(0.01–0.03)
0.02 ± 0.01
(0.02–0.03)
3–100.01 ± 0.01
(LD-0.03)
0.01 ± 0.01
(LD-0.02)
0.08 ± 0.00
(0.08–0.08)
0.07 ± 0.01
(0.06–0.10)
Chrysen
CHR [ng∙m−3]
<30.12 ± 0.06
(0.07–0.23)
0.10 ± 0.05
(0.05–0.20)
0.09 ± 0.03
(0.06–0.14)
0.04 ± 0.02
(0.01–0.07)
3–100.04 ± 0.04
(0.01–0.11)
0.08 ± 0.06
(0.03–0.20)
0.11 ± 0.11
(0.02–0.39)
0.04 ± 0.02
(0.02–0.07)
Fluoranthene
FLU [ng∙m−3]
<315.17 ± 9.06
(2.96–26.27)
13.41 ± 8.05
(3.45–25.03)
10.87 ± 4.94
(5.56–18.12)
4.87 ± 3.53
(0.34–8.75)
3–106.13 ± 6.75
(0.71–19.52)
5.29 ± 4.00
(0.19–10.37)
19.89 ± 22.13
(0.61–57.03)
7.83 ± 4.62
(4.19–17.59)
Pyrene
PYR [ng∙m−3]
<30.08 ± 0.03
(0.05–0.13)
0.11 ± 0.08
(0.03–0.24)
0.05 ± 0.02
(0.04–0.09)
0.02 ± 0.01
(0.01–0.04)
3–100.05 ± 0.06
(0.01–0.17)
0.06 ± 0.05
(0.01–0.16)
0.07 ± 0.06
(0.01–0.17)
0.02 ± 0.01
(0.01–0.04)
Nitrates
NO3 [µg∙m−3]
<30.7 ± 0.5
(LD-1.5)
0.5 ± 0.5
(0.1–1.4)
2.0 ± 2.1
(0.5–5.8)
2.5 ± 0.7
(1.8–3.3)
3–100.2 ± 0.1
(LD-0.2)
0.1 ± 0.2
(LD-0.2)
1.0 ± 0.4
(LD-1.4)
1.1 ± 1.2
(0.1–3.1)
Sulphates
SO42− [µg∙m−3]
<30.6 ± 0.3
(0.3–1.1)
0.6 ± 0.4
(0.2–1.2)
2.5 ± 2.0
(0.7–5.4)
2.2 ± 1.0
(1.0–4.0)
3–100.1 ± 0.0
(LD-0.1)
0.1 ± 0.1
(LD-0.2)
1.4 ± 1.1
(LD-3.2)
2.1 ± 3.3
(LD-9.3)
OC [µg∙m−3]<34.6 ± 0.7
(3.6–5.6)
4.3 ± 1.3
(2.8–6.0)
3.3 ± 0.8
(1.8–3.9)
2.7 ± 0.6
(1.8–3.4)
3–101.7 ± 0.5
(1.2–2.6)
1.6 ± 0.3
(1.1–2.1)
1.2 ± 0.2
(0.9–1.6)
1.3 ± 0.5
(0.8–2.0)
EC [µg∙m−3]<30.5 ± 0.2
(LD-0.7)
0.3 ± 0.1
(LD-0.5)
0.6 ± 0.2
(LD-0.9)
0.4 ± 0.4
(LD-1.0)
3–100.2 ± 0.0
(LD-0.2)
0.2 ± 0.2
(LD-0.7)
0.4 ± 0.3
(LD-0.7)
0.3 ± 0.1
(LD-0.4)
Publisher’s Note: MDPI stays neutral with regard to jurisdictional claims in published maps and institutional affiliations.

