
The Impact of Smog Pollution on Audit Quality: Evidence from China


1
School of Economics and Management, Beijing University of Chemical Technology, Beijing 100029, China
2
School of Government, Peking University, Beijing 100871, China
*
Author to whom correspondence should be addressed.
Atmosphere 2021, 12(8), 1015; https://0-doi-org.brum.beds.ac.uk/10.3390/atmos12081015
Submission received: 6 July 2021
/
Revised: 4 August 2021
/
Accepted: 6 August 2021
/
Published: 7 August 2021
(This article belongs to the Special Issue Aerosol Pollution in Asia)
Abstract
:Audit quality usually refers to the quality that the auditing services accounting firm auditors provide to an enterprise in the form of an audit report. This study empirically analyzes the impact mechanism of smog pollution on audit quality, based on the data of A-share listed companies in the Shanghai and Shenzhen Stock Exchanges during the period 2013 to 2017 and the air quality monitoring data released by the China National Environmental Monitoring Centre covering the period 2013 to 2018. First, the empirical results show that smog pollution can lead to a decline in audit quality. Second, audit time plays a partial mediating role in the relationship between smog pollution and audit quality. Further analysis indicates that the negative impact of smog pollution on audit quality and the intermediary role played by audit time are only significant in the sample of “top 10” accounting firms. Third, the enterprise′s internal control level positively moderates the mediating effect of audit time on smog pollution and audit quality.
1. Introduction
Severe smog has appeared frequently in the past few years in China, making air pollution one of the most important environmental issues for residents. In 2017, President Xi Jinping’s proposal to “make our skies blue again” reflected the government’s determination to control smog pollution. Despite the success of China’s air pollution prevention and control work in recent years, the country’s current air pollution situation is still grim, and much work remains to be done to win the Blue Sky Defense War. In view of the severity of smog pollution, extensive academic research has been conducted to study its effects. These studies address the effects of smog pollution not only on physical health [1,2], emotions [3,4], and investor trading behavior [5,6], but also on corporate debt financing capacity [7], firm-level total factor productivity [8], corporate cash holdings [9,10], and market value [11]. In particular, the impact of smog pollution on audit quality has also attracted scholarly attention.
One groundbreaking study tests the influence of air quality on auditor’s professional judgments using air quality data from 2013 to 2015 in China and finds that air pollution exposure of the client’s headquarter during fieldwork days has a negative impact on the auditor’s professional judgments through the audit effort [12]. By contrast, another study uses a sample of Chinese public firms for the period 2013 to 2018 to examine the effects of air pollution on audit quality and finds that auditors exposed to higher levels of air pollution are more likely to put more effort into their audits, resulting in higher audit quality [13]. This apparent contradiction suggests that further exploration of the relationship between air pollution and audit quality is necessary and meaningful.
Audit quality, as an important concept in the accounting and auditing field, usually refers to the quality of the auditing services that accounting firm auditors provide to enterprises in the form of the audit report. Audit quality reflects the effect of audit work [14] and is equal to the joint probability of the auditor discovering and reporting the audited entity’s misstatement and underreporting problems [15]. Some studies on the factors affecting audit quality mainly examine the topic on the company level [16], the accounting firm level [17,18], and the individual auditor level [19,20,21]. Since the individual auditor, the auditee (company), and the external audit environment are all affected by smog pollution, the weather phenomenon, as suggested in the above literature [12,13], may also affect auditors’ audit quality. Audit time reflects the audit investment to a certain extent, thereby affecting the auditor’s ability to find misreporting fraud. We speculate that audit time may play a role in the relationship between smog pollution and audit quality. Audit quality is affected by audit risk. The greater the audit risk, the more difficult the audit, and the more challenging it is to maintain the audit quality. The enterprise’s internal controls affect audit risk to a certain extent, so we assume that internal control level may moderate the relation between smog pollution and audit quality.
Based on the above analysis, this study uses the data of A-share listed companies in China’s Shanghai and Shenzhen Stock Exchanges during the period 2013 to 2017 and the air quality monitoring data released by the China National Environmental Monitoring Centre for the period 2013 to 2018 to study the impact of smog pollution on audit quality. Empirical analysis results show that smog pollution damages audit quality by negatively affecting audit time; that is, audit time plays a partial intermediary role between smog pollution and audit quality. Further analysis finds that the above effects are significant only for “top 10” accounting firms. The enterprise’s internal control level positively moderates the mediating effect of audit time; that is, the higher the enterprise’s internal control level, the stronger the positive relationship between audit time and audit quality, and the stronger the mediating role played by audit time between smog pollution and audit quality.
Compared with the existing literature, this paper’s incremental contribution lies in the following. First, unlike most previous literature on the factors affecting audit quality at the company, accounting firm, and auditor levels, in this study, smog pollution, as an external natural environmental change phenomenon, is included in the analysis framework of the factors affecting audit quality; this inclusion enriches research in this area. Second, this study confirms the intermediary effect of audit time on smog pollution and audit quality and reveals the mechanism by which smog pollution affects audit quality. Third, this study uses the smog pollution data from November to April of the following year to improve the matching accuracy of smog pollution and the actual working time of auditors at the headquarters of the audited enterprises, which is conducive to estimating the impact of smog pollution on audit quality more reasonably. Finally, this study takes accounting firms that are special capital market information intermediaries as the research object, which further enriches the research on the economic consequences of smog pollution with regard to the effects on microeconomic entities.
2. Literature Review and Hypotheses Development
2.1. The Impact of Smog Pollution on Audit Quality
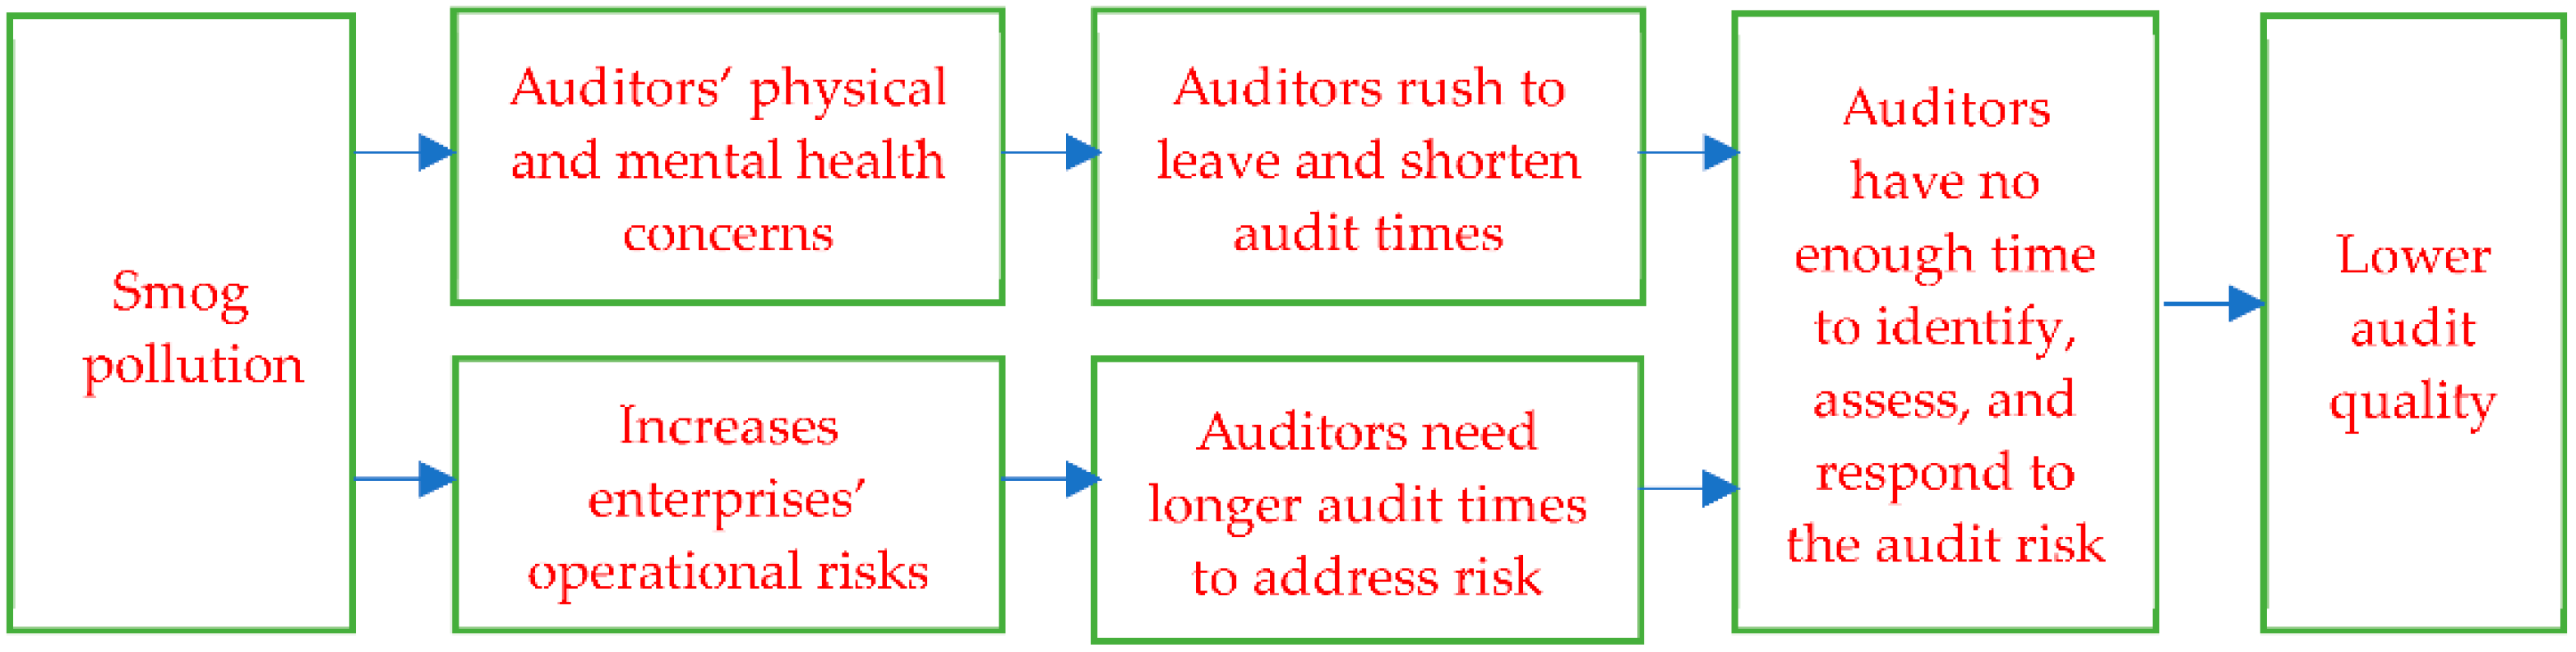
Audit time can reflect an auditor’s audit input level to a certain extent [22], and increased audit input leads to improved audit output [23,24]. The longer the audit time, the higher the auditor’s audit investment, the larger the sampling range, and the more sufficient the audit evidence the auditor collects, the more likely the auditor is to detect and respond to the risk of the audited entity’s material misstatement, thus ensuring higher audit quality. Furthermore, the longer the audit time, the more efficient the communication between the auditor and the audited entity’s management, which helps the auditor gain a full understanding of the company’s situation and judge its audit risk more clearly, and then quickly implement countermeasures, which results in improved audit quality. Smog pollution not only leads to the decrease of audit time that auditors are willing to provide, but also leads to the increase of audit time required for the auditors to complete the audit work well. This leads to a hastier audit process and lowers audit quality from two aspects. The influence mechanism can be illustrated by the following schematic Figure 1.
On the one hand, smog pollution causes serious damage to human health; awareness of this fact prompts auditors to rush to leave areas where the air is heavily polluted, leading to shortened audit time. First, smog pollution can damage the human respiratory system [25,26,27] and the nervous system [28,29], and cause cardiovascular and cerebrovascular harm [30]. In sum, smog pollution can cause various physiological diseases and even lead to death [31,32,33]. Second, severe smog pollution also increases proneness to negative emotions such as anxiety, irritability, depression, pessimism, panic, and other emotions [34,35,36,37], and could even lead to depression [38]; hence, smog pollution seriously affects people’s mental health. Therefore, auditors shorten audit time to reduce the damage smog pollution wreaks on their physical and mental health.
On the other hand, smog pollution increases enterprises’ operational risks, and auditors need longer audit time to identify, assess, and respond to the risk of material misstatement on financial statements. First, smog pollution affects enterprises’ productivity [39,40,41], employee turnover [42], and the employee attendance rate [2] by damaging employees’ physical and mental health. These effects, in turn, adversely impact companies’ production and operation, lower the domestic value-added ratio (DVAR) in exports [43]. Second, enterprises may need to adopt a variety of energy-saving and emission-reduction measures during their business operations, such as developing environmentally-friendly technologies, purchasing pollution-cleaning equipment, paying environmental taxes, implementing various compensations, and even increases corporate social responsibility(CSR) performance [44]. These measures will increase business costs. Moreover, public attention and stricter environmental regulations can lead to an increase in business risks, which will, in turn, increase uncertainty in financial reporting, thus increasing the risk of material misstatement. Auditors have to devote more time and energy to making appropriate assessments [45].
However, as smog becomes more serious, auditors refrain from increasing audit time to ensure the quality of the audit work; rather, they shorten audit time to reduce the extent of smog pollution-induced damage to their own health. Therefore, it is difficult for auditors to devote sufficient time and effort to completing audit projects. To complete the audit work in a shorter period of time, the auditor may narrow the scope of substantive testing and abandon some audit procedures, thus failing to obtain adequate and appropriate audit evidence. The auditor may also reduce the time required to obtain audit evidence through computational processing as well as the time allocated to communicating with the audited entity’s management, and may make inappropriate judgments [12], resulting in lower audit quality.
Thus, the first hypothesis is:
Hypotheses 1 (H1).
Smog pollution has a negative effect on audit quality by reducing audit time; that is, audit time is a mediator variable that affects audit quality due to smog pollution.
2.2. The Moderating Effect of Internal Controls
An enterprise’s internal controls not only reduce the risk of unintentional misstatement caused by employees’ negligence in preparing financial statements, but also internally suppress the possibility of enterprise managers’ opportunistic accounting choices through power checks and balances, while reducing the risk of fraud on financial reports. Therefore, according to the requirements of risk-oriented auditing, auditors should first understand the enterprise’s internal controls when formulating an audit plan. When doing audit work, internal control risk should be further evaluated and tested, and the quality and quantity of the audit evidence to be collected should be determined based on the control test results. The higher the quality of the enterprise’s internal controls, the higher the reliability and degree of availability of the audit evidence; therefore, auditors can obtain sufficient and appropriate audit evidence with less audit investment, which can guarantee audit quality within a limited time.
First, sound and effective internal company controls can reasonably guarantee the quality of financial statement information [46,47,48]. This provides a good foundation for audit work, as it helps the auditor to improve audit efficiency and optimize the audit time investment. Good internal control is the basic guarantee for quality enterprise information, which can effectively suppress major misstatements and fraud and reduce errors. Therefore, sound internal company controls can reduce audit work, allowing the auditor to focus attention and audit resources on financial statement items that may pose significant risks. Auditors have additional time to implement more stringent audit procedures in order to judge whether the enterprise’s accounting information is objective and fair, so as to disclose more useful information in the audit report and ultimately provide a more reliable report. Good internal controls also help auditors integrate resources to audit more effectively and improve audit efficiency.
Second, good internal controls improve communication efficiency and collaboration between management and auditors, management and employees, and among employees [49,50]. This makes it more effective for auditors to increase their audit time in order to improve audit quality. Good internal company controls help auditors communicate thoroughly with management, so that the auditor can better understand the enterprise’s real situation and more clearly identify the risk items that may exist. The auditor can also communicate major issues identified during the audit to management in a timely manner. Furthermore, companies with good internal controls are more likely to actively cooperate with external audit work, discuss related issues, and adopt various recommendations from the auditor to further enhance the positive impact of audit time on audit quality.
Therefore, we speculate that the output effect of audit time is affected by a company’s internal control level. Enterprise internal control has a positive moderating effect on audit time and audit quality. The sounder the enterprise’s internal control, the stronger the positive impact of audit time on audit quality, and vice versa. Enterprise internal control has an impact on the mediating role of audit time between smog pollution and audit quality by moderating the positive impact of audit time on audit quality.
Thus, the second hypothesis is:
Hypotheses 2 (H2).
An enterprise’s internal control level has a positive moderating effect on the mediation role of audit time between smog pollution and audit quality; that is, the higher the enterprise’s internal control level, the greater the mediating effect of audit time between smog pollution and audit quality.
3. Methods
3.1. Data Source and Sample Selection
This study uses A-share listed companies from the Shanghai and Shenzhen Stock Exchanges in China during the period 2013 to 2017 as the research sample. Among them, listed companies’ financial statements for 2013 to 2017 are from the China Stock Market Accounting Research Database (CSMAR). Smog pollution data were obtained from 74 key Chinese cities’ air quality monitoring data for the period 2013 to 2018; these data were issued by the China National Environmental Monitoring Centre. The internal control information disclosure index was derived from the DIB Internal Control and Risk Management Database, which is the first famous Chinese database with internal control and risk management as its main business direction. In China, auditors usually audit listed companies’ annual reports in November of the same year and issue an audit report before 30 April of the following year. Therefore, the fine particulate matter (PM2.5) concentration data in this paper are the average of the PM2.5 concentration data for a total of 6 months, from November of the current year to April of the following year.
To suit this paper’s needs, the samples were selected as follows: first, we excluded observations of listed companies in the financial industry (because such companies are significantly different than listed companies in the non-financial industry in terms of business scope, business model, and financial statement structure); second, we excluded observations of ST listed companies and *ST listed companies (ST means Special Treatment, due to ST companies having suffered losses for 2 consecutive years, and *ST companies having suffered losses for 3 consecutive years, triggering early warning of delisting; such companies’ financial status or other conditions are abnormal, so such listed companies were deleted); third, we eliminated missing observations from the relevant indicators needed to calculate PM2.5; fourth, we eliminated missing observations from the relevant indicators needed to calculate audit quality; fifth, we eliminated missing observations from the relevant indicators needed to calculate audit time; sixth, we eliminated missing observations from the internal control-related indicators; seventh, we eliminated missing observations from the relevant variables among the control variables. After applying the above conditions, the final sample contained 7744 observations. To avoid the effects of extreme values, all continuous variables were winsorized to 1%.
3.2. Variable Definition
Smog pollution (PM2.5i,t) represents the degree of smog pollution in the city where enterprise i is located in year t. We calculated average PM2.5 concentration data based on 74 key cities’ monthly air quality reports from November of the current year to April of the following year. These data were released by the China National Environmental Monitoring Centre.
Given that it is difficult to measure audit quality directly, it is usually measured by the absolute value of discretionary accruals, which is calculated using the modified Jones model [51]; the higher the absolute value of discretionary accruals, the worse the audit quality. That is, in audited financial reports, the less profit an enterprise can manipulate at will, the higher the audit quality will be. Since the absolute value of discretionary accruals is relatively small and is an inverse index, in order to show the relationship between smog pollution and audit quality better and intuitively, the absolute value of discretionary accruals is multiplied by −100 to measure the audit quality of company i in year t (Qualityi,t).
Audit time (Timei,t) is measured as the number of days between the balance sheet date and the audit report date. Internal control level (ICi,t) is measured using the internal control information disclosure index in the DIB internal control and risk management database. The larger the value, the higher the internal control level.
With reference to the relevant literature [18,52,53], we control some variables that reflect the characteristics of company i. The natural logarithm of a company’s total assets is a measure of a firm’s size (Sizei,t). The ratio of accounts receivable to total assets (Reci,t) and the ratio of inventory to total assets (Invi,t) measure the complexity of business operations. The gearing ratio (Levi,t) and current ratio (Currenti,t) reflect the company’s solvency. Return on total assets (Roai,t) reflects the company’s profitability. Loss (Lossi,t) and book-to-market ratio (Btmi,t) reflect the company’s motive to manipulate earnings. The operating income growth rate reflects a company’s growth (Growthi,t). The largest shareholder’s shareholding ratio (Shrcr1i,t), the proportion of independent directors on the board of directors (Indirectori,t), and whether the chairman is also the general manager (Duali,t) reflect the company’s governance. These also control the nature of the business (Soei,t) and the company’s listing age (Agei,t), and determine whether additional shares (AIi,t) should be issued in the current year. Referencing related literature [17,54,55], we control for some variables that reflect accounting firms’ characteristics. We control whether the enterprise’s annual audit is performed by a “top 10” accounting firm (Big_10i,t) and whether the company had an audit firm replacement (Switchi,t) in the current year. The auditor’s judgment may be influenced by the previous year’s audit opinion, so the type of audit opinion in the previous year (L_opinioni,t) is included among the control variables. The level of economic development (Locai,t) at the company’s location may have an impact on the audit process, so we incorporate it into the control variables. Locai,t is a dummy variable that equals 1 when the company is registered in Beijing, Shanghai, Tianjin, Guangzhou, or Shenzhen; otherwise, it takes 0. The aforementioned five cities’ total gross domestic product (GDP) in 2019 ranked in the top five. In addition, we control for year effects and industry effects.
The variables are as defined in Table 1.
3.3. Empirical Model
3.3.1. The Audit Time Mediation Effect Test between Smog Pollution and Audit Quality
To test the mediating effect of audit time on smog pollution and audit quality (H1), we constructed the following empirical model, with reference to the Baron and Kenny mediation model test method [56]:
The audit time mediation effect test between smog pollution and audit quality is performed as follows. First, we check whether the coefficient (α1) of PM2.5 in Model (1) is significant. If it is not significant, we stop the mediation effect analysis. If it is significant, we continue the test by proceeding to the following step. Second, we check whether the coefficient (β1) of PM2.5 in Model (2) and the coefficient (γ1) of time in Model (3) are significant. If they are significant, there is a mediating effect. If at least one is not significant, then the Sobel test is performed. If the Sobel test is significant, there is a mediating effect; otherwise, there is no mediating effect. Finally, if the coefficient (δ1) of PM2.5 in Model (4) is not significant, there is a complete mediating effect; otherwise, it is a partial mediating effect.
3.3.2. The Internal Control Moderating Effect Test
In order to test the moderating effect of internal control (H2), we add internal control (IC), its interaction item, and audit time (Time × IC) based on Model (4).
In this model, we focus on the sign and significance of the coefficients () of the interaction item (Time × IC). We anticipate that internal control plays a positive moderating role. Therefore, it (φ4) should be significantly positive.
4. Results
4.1. Descriptive Statistics
Table 2 lists the descriptive statistics for the relevant variables. The mean value of audit quality (Quality) is −9.227, and the maximum and minimum values are −0.061 and −133.757, respectively. There is a big difference between different enterprises’ audit quality. According to the pollutant concentration limit per the air quality standard, the primary and secondary standard annual average limits of PM2.5 are 15 μg/m3 and 35 μg/m3, respectively. The average PM2.5 concentration is 63.173 μg/m3, which does not meet the secondary standard. The minimum value is 29.166 μg/m3, which meets the secondary but not the primary standard. The maximum value is 122.263 μg/m3, and the degree of air pollution is serious. The standard deviation of PM2.5 is large; that is, there are different degrees of smog pollution in different cities. The mean audit time (Time) is 135.655, and the maximum and minimum values are 148.000 and 64.000, respectively. The average internal company control level (IC) is 35.895.
4.2. Pearson Correlation Coefficient Matrix
In this study, Pearson correlation analysis was carried out on the variables (limited to length; the variables’ Pearson correlation coefficient table is not shown). Correlation analysis shows that smog pollution (PM2.5) is significantly negatively correlated with audit quality (quality) at the 1% level. Smog pollution (PM2.5) and audit time (time) are significantly negatively correlated at the 1% level. Audit time (time) is positively correlated with audit quality (quality), but it is not significant. The signs of these variables are expected to be consistent with H1. This indicates that smog pollution may affect audit quality by affecting audit time, initially verifying H1. Given the correlation coefficient between control variables such as company and accounting firm characteristics and smog pollution (PM2.5), there is no significant multicollinearity problem between variables, and multiple regression analysis can be performed.
4.3. Regression Results
The regression results are shown in Table 3. Table 3 shows that the coefficient (α1) of PM2.5 in Model (1) is negative and significant at the 5% level, indicating that the more serious the smog pollution, the larger the absolute value of the enterprise’s discretionary accruals and the lower the quality of the audit service provided by the auditor. The coefficient (β1) of PM2.5 in Model (2) and the coefficient (γ1) of time in Model (3) are significant, indicating that smog pollution (PM2.5) has an impact on audit quality (Quality) through audit time (Time), and there is a mediating effect. In Model (4), the coefficient (δ1) of PM2.5 is significant, indicating that audit time partially mediates the relationship between smog pollution and audit quality. Therefore, the more serious the smog pollution, the shorter the audit time, and the lower the audit quality. The sample data support H1.
The correlation coefficient (φ4) of Time × IC is positive and significant at the 5% level, indicating that enterprise internal control level positively moderates the relationship between audit time and audit quality, thus positively moderating the mediating role of audit time between smog pollution and audit quality. The sample data also support H2. Since audit time (Time) and internal control (IC) have separate items and interaction items in regression Model (5), the impact of audit time (time) on the audit quality and internal control (IC) pair cannot only be based on the regression coefficient of individual items; it should be further calculated by seeking partial bias. According to further calculations, the marginal impact effect of audit time (time) is 0.0595, and audit time has a positive impact on audit quality. The marginal impact of internal control (IC) is 0.0237, and internal control also has a positive impact on audit quality. (The marginal influence of Time on Quality = φ2 + φ4 × = −0.2190 + 0.00776 × 35.895 = 0.0595. The marginal influence of IC on Quality = φ3 + φ4 × = −1.0290 + 0.00776 × 135.655 = 0.0237.)
4.4. Further Analysis
This study further applies an accounting firm group test to reveal the heterogeneity of smog pollution’s impact on audit behavior.
The auditing market in which our accounting firms are located is highly competitive. Auditors are affected by the accounting firm to which they belong. In the face of audit risk and personal health risks, there may be differences in decision-making behavior. Among firms that are not in the “top 10,” risk resistance is weaker and survival pressure is greater. Hence, auditing behavior may be more cautious when considering audit risk. Auditors who do not belong to “top 10” accounting firms are less motivated to rush to leave smog-polluted areas during the audit process in the hope of improving their efforts, ensuring audit quality, improving their firm’s reputation, enhancing their competitiveness, and gaining market approval. Therefore, we speculate that the negative impact of smog pollution on audit quality and the mediating effect of audit time between smog pollution and audit quality are only significant in the sample of “top 10” accounting firms.
This study conducts a group test according to whether the accounting firm belongs to the “top 10.” The regression results are shown in Table 4. The study’s results indicate that H1 is well-established in the “top 10” sample. The negative impact of smog pollution on audit quality is not established in the sample of non-”top 10” accounting firms.
4.5. Robustness Test
4.5.1. Using Extreme Weather
Generally, the human body has certain tolerances and immunity. Only when smog pollution reaches a certain level will it significantly affect human health and business activities which will, in turn, significantly affect auditors’ work. Therefore, this study analyzes the impact of extreme weather, namely mild, moderate, and severe pollution, on audit quality.
According to the air quality sub-index grading scheme specified in the Environmental Air Quality Index Technical Regulations (HJ633-2012) issued by the Ministry of Environmental Protection of the People’s Republic of China in 2012, an average 24 h PM2.5 concentration in the range of 0–35 μg/m3, 35–75 μg/m3, 75–115 μg/m3, 115–150 μg/m3, 150–250 μg/m3, or 250 μg/m3 and above is classified as an air quality grade of “excellent,” “good,” “light pollution,” “moderate pollution,” “heavy pollution,” or “serious pollution,” respectively. Daily PM2.5 concentration data during the sample period were obtained from the China National Environmental Monitoring Centre’s official data. In this study, missing PM2.5 values and PM2.5 values below 0 were excluded.
Extreme weather uses the sum of light, moderate, severe, and serious pollution days from November of the current year to April of the following year. The proportion is equal to the sum of extreme weather divided by the sum of the total number of days with statistical data; it is defined as the variable Extrweather. Models (1), (2), (3), (4), and (5) were regressed after replacing PM2.5 with Extrweather. The regression results are shown in Table 5.
The regression results show that the coefficient (α1) of Extrweather in Model (1), shown in Table 5, is negative and significant at the 5% level. The coefficient (β1) of Extrweather in Model (2) is significant at the 5% level, and the coefficient (γ1) of time in Model (3) is significant at the 1% level. The coefficient (δ1) of Extrweather in the Model (4) is significant at the 5% level. The coefficient (φ4) of Time × IC in Model (5) is significant at the 5% level. The previous conclusions are valid.
4.5.2. Replacement of the Smog Pollution Measurement Indicator
In addition to PM2.5, smog pollution also includes other pollutants, such as PM10, SO2, and NO2. Therefore, this study also uses the Air Quality Composite Index (AQI) instead of PM2.5 as an independent variable. The China National Environmental Monitoring Centre releases the comprehensive index of ambient air quality to the public every month as a description of the urban environment’s quality, taking into account the concentrations of six pollutants: SO2, NO2, PM10, PM2.5, CO, and O3. The larger the comprehensive index of ambient air quality, the more serious the degree of air pollution. Models (1), (2), (3), (4), and (5) were regressed after replacing PM2.5 with AQI, and the regression results are shown in Table 6.
The regression results show that the coefficient (α1) of AQI in Model (1), shown in Table 6, is significantly negative, indicating that smog pollution has a negative impact on audit quality. The coefficient (β1) of AQI in Model (2) and the coefficient (γ1) of time in Model (3) are significant. The coefficient (δ1) of AQI in Model (4) is significant at the 5% level. The coefficient (φ4) of Time × IC in Model (5) is significant at the 5% level. The previous conclusions remain unchanged.
5. Summary and Discussion
This study uses the data of A-share listed companies in the Shanghai and Shenzhen Stock Exchanges for the period 2013–2017 and the China National Environmental Monitoring Centre’s air quality monitoring data for 74 key Chinese cities for the period 2013–2018 to examine the mediating effect of audit time between smog pollution and audit quality, and the moderating effect of internal control in the mediation process.
The results show that after controlling for the influence of other factors, smog pollution has a negative impact on audit quality. Audit time is a mediator between smog pollution and audit quality, and smog pollution reduces audit quality by reducing audit time. Further analysis finds that the impact of smog pollution on audit quality and the mediating effect of audit time on smog pollution and audit quality are only significantly established among “top 10” accounting firms, revealing the heterogeneity of the impact of smog pollution on audit behavior. The intermediary role of audit time is stronger in enterprises with high internal control levels.
Under more rigorous model settings, the results of this study support the earlier view that air pollution is negatively correlated with audit quality through audit effort [12]. We also note that the conclusions of this paper are not consistent with another paper, which believes air pollution is positively correlated with audit quality [13]. The potential possibility lies in the former using the ordinary least squares model for regression and failing to separate out the fixed effects of industries and regions.
The policy implications of this research conclusion are as follows. First, the relevant authorities should consider the impact of smog pollution when supervising audit quality in the audit market. Second, enterprises should take appropriate measures to reduce the risks associated with smog pollution and its adverse effects on enterprises.
Author Contributions
Conceptualization, B.L.; methodology, B.L. and Y.Z.; software, Y.Z.; validation, Y.L.; formal analysis, B.L. and Y.Z.; investigation, Y.Z. and Y.L.; resources, Y.Z. and T.Z.; data curation, Y.Z. and T.Z.; writing—original draft preparation, Y.Z.; writing—review and editing, B.L. and T.Z.; visualization, Y.Z.; supervision, Y.L.; project administration, B.L.; funding acquisition, B.L. All authors have read and agreed to the published version of the manuscript.
Funding
This work was supported by the Fundamental Research Funds for the Central Universities (Grant No. BUCTRC201808), and the Beijing University of Chemical Technology′s funds for first-class discipline construction (XK1802-5).
Institutional Review Board Statement
Not applicable.
Informed Consent Statement
Not applicable.
Data Availability Statement
Publicly available datasets were analyzed in this study.
Conflicts of Interest
The authors declare no conflict of interest.
References
- Brunekreef, B.; Holgate, S.T. Air Pollution and Health. Lancet 2002, 360, 1233–1242. [Google Scholar] [CrossRef]
- Moretti, E.; Neidell, M. Pollution, Health, and Avoidance Behavior: Evidence from the Ports of los Angeles. J. Hum. Resour. 2011, 46, 154–175. [Google Scholar] [CrossRef]
- Lundberg, A. Psychiatric Aspects of Air Pollution. Otolaryngol. Head Neck Surg. 1996, 114, 227–231. [Google Scholar] [CrossRef]
- Yang, W.; Mu, L.; Shen, Y. Effect of Climate and Seasonality on Depressed Mood among Twitter Users. Appl. Geogr. 2015, 63, 184–191. [Google Scholar] [CrossRef]
- Levy, T.; Yagil, J. Air Pollution and Stock Returns in the US. J. Econ. Psychol. 2011, 32, 374–383. [Google Scholar] [CrossRef]
- Guo, M.; Wei, M.; Huang, L. Does Air Pollution Influence Investor Trading Behavior? Evidence from China. Emerg. Mark. Rev. 2021, 100822, in press. [Google Scholar] [CrossRef]
- Li, B.; Guo, P.; Zeng, Y. The Impact of Haze on the Availability of Company Debt Financing: Evidence for Sustainability of Chinese Listed Companies. Sustainability 2019, 11, 806. [Google Scholar] [CrossRef] [Green Version]
- Li, B.; Shi, S.; Zeng, Y. The Impact of Haze Pollution on Firm-Level TFP in China: Test of a Mediation Model of Labor Productivity. Sustainability 2020, 12, 8446. [Google Scholar] [CrossRef]
- Li, B.; He, M.; Gao, F.; Zeng, Y. The Impact of Air Pollution on Corporate Cash Holdings. Borsa Istanb. Rev. 2021, 21, S90–S98. [Google Scholar] [CrossRef]
- Tan, J.; Tan, Z.; Chan, K.C. Does Air Pollution Affect a Firm’s Cash Holdings? Pac. Basin Financ. J. 2021, 67, 101549. [Google Scholar] [CrossRef]
- Peng, M.; Zeng, Y.; Yang, D.C.; Li, B. The Role of Smog in Firm Valuation. Emerg. Mark. Financ. Trade 2021. [Google Scholar] [CrossRef]
- Song, Y.; Song, Y. Are Auditor’s Professional Judgments Influenced by Air Quality? China J. Account. Stud. 2018, 6, 555–582. [Google Scholar] [CrossRef]
- Chen, H.; Tan, X.; Cao, Q. Air pollution, Auditors’ Pessimistic Bias and Audit Quality: Evidence from China. Sustain. Account. Manag. 2021, 12, 74–104. [Google Scholar] [CrossRef]
- Defond, M.L.; Zhang, J. A Review of Archival Auditing Research. J. Account. Econ. 2014, 58, 275–326. [Google Scholar] [CrossRef] [Green Version]
- Watts, R.L.; Zimmerman, J.L. Agency Problems, Auditing, and the Theory of the Firm: Some Evidence. J. Law Econ. 1983, 26, 613–633. [Google Scholar] [CrossRef]
- Carcello, J.V.; Neal, T.L. Audit Committee Composition and Auditor Reporting. Account. Rev. 2000, 75, 453–467. [Google Scholar] [CrossRef]
- Palmrose, Z.V. Competitive Manuscript Co-Winner: An Analysis of Auditor Litigation and Audit Service Quality. Account. Rev. 1988, 63, 55–73. [Google Scholar]
- Teoh, S.H.; Wong, T.J. Perceived Auditor Quality and the Earnings Response Coefficient. Account. Rev. 1993, 68, 346–366. [Google Scholar]
- DeFond, M.L.; Francis, J.R. Audit Research after sarbanes-oxley. Aud. J. Pract. Theory 2005, 24, 5–30. [Google Scholar] [CrossRef]
- Gul, F.A.; Wu, D.; Yang, Z. Do Individual Auditors Affect Audit Quality? Evidence from Archival Data. Account. Rev. 2013, 88, 1993–2023. [Google Scholar] [CrossRef]
- Francis, J.R.; Yu, M.D. Big 4 Office Size and Audit Quality. Account. Rev. 2009, 84, 1521–1552. [Google Scholar] [CrossRef]
- Knechel, W.R.; Rouse, P.; Schelleman, C. A Modified Audit Production Framework: Evaluating the Relative Efficiency of Audit Engagements. Account. Rev. 2009, 84, 1607–1638. [Google Scholar] [CrossRef]
- Lobo, G.J.; Zhao, Y. Relation between Audit Effort and Financial Report Misstatements: Evidence from Quarterly and Annual Restatements. Account. Rev. 2013, 88, 1385–1412. [Google Scholar] [CrossRef]
- Francis, J.R. A Framework for Understanding and Researching Audit Quality. Audit. J. Pract. Theory 2011, 30, 125–152. [Google Scholar] [CrossRef] [Green Version]
- Zhang, Z.; Wang, J.; Chen, L.; Chen, X.; Sun, G.; Zhong, N.; Kan, H.; Lu, W. Impact of Haze and Air Pollution-Related Hazards on Hospital Admissions in Guangzhou, China. Environ. Sci. Pollut. Res. Int. 2014, 21, 4236–4244. [Google Scholar] [CrossRef] [PubMed]
- Gehring, U.; Gruzieva, O.; Agius, R.M.; Beelen, R.; Custovic, A.; Cyrys, J.; Eeftens, M.; Flexeder, C.; Fuertes, E.; Heinrich, J.; et al. Air Pollution Exposure and Lung Function in Children: The Escape Project. Environ. Health Perspect. 2013, 121, 1357–1364. [Google Scholar] [CrossRef] [PubMed] [Green Version]
- Wang, C.; Cai, J.; Chen, R.; Shi, J.; Yang, C.; Li, H.; Lin, Z.; Meng, X.; Liu, C.; Niu, Y.; et al. Personal Exposure to Fine Particulate Matter, Lung Function and Serum Club Cell Secretory Protein (Clara). Environ. Pollut. 2017, 225, 450–455. [Google Scholar] [CrossRef] [Green Version]
- Weiss, B. Behavior as an Early Indicator of Pesticide Toxicity. Toxicol. Ind. Health 1988, 4, 351–360. [Google Scholar] [CrossRef] [PubMed]
- Li, M.; Zhang, L.H. Haze in China: Current and Future Challenges. Environ. Pollut. 2014, 189, 85–86. [Google Scholar] [CrossRef]
- Cesaroni, G.; Forastiere, F.; Stafoggia, M.; Andersen, Z.J.; Badaloni, C.; Beelen, R.; Caracciolo, B.; de Faire, U.; Erbel, R.; Eriksen, K.T.; et al. Long Term Exposure to Ambient Air Pollution and Incidence of Acute Coronary Events: Prospective Cohort Study and Meta-Analysis in 11 European Cohorts from the Escape Project. BMJ 2014, 348, f7412. [Google Scholar] [CrossRef] [Green Version]
- Pascal, M.; Falq, G.; Wagner, V.; Chatignoux, E.; Corso, M.; Blanchard, M.; Host, S.; Pascal, L.; Larrieu, S. Short-Term Impacts of Particulate Matter (PM10, PM10−2.5, PM2.5) on Mortality in Nine French Cities. Atmos. Environ. 2014, 95, 175–184. [Google Scholar] [CrossRef]
- Lu, F.; Xu, D.; Cheng, Y.; Dong, S.; Guo, C.; Jiang, X.; Zheng, X. Systematic Review and Meta-Analysis of the Adverse Health Effects of Ambient PM2.5 and PM10 Pollution in the Chinese Population. Environ. Res. 2015, 136, 196–204. [Google Scholar] [CrossRef] [PubMed]
- Chen, X.; Shao, S.; Tian, Z.; Xie, Z.; Yin, P. Impacts of Air Pollution and Its Spatial Spillover Effect on Public Health Based on China’s Big Data Sample. J. Clean. Prod. 2017, 142, 915–925. [Google Scholar] [CrossRef]
- Bullinger, M. Environmental Stress: Effects of Air Pollution on Mood, Neuropsychological Function and Physical State. Psychobiol. Stress 1990, 54, 241–250. [Google Scholar] [CrossRef]
- Cunsolo Willox, A.C.; Harper, S.L.; Ford, J.D.; Landman, K.; Houle, K.; Edge, V.L. ‘From this place and of this place:’ Climate Change, Sense of Place, and Health in Nunatsiavut, Canada. Soc. Sci. Med. 2012, 75, 538–547. [Google Scholar] [CrossRef] [PubMed]
- Neria, Y.; Shultz, J.M. Mental Health Effects of Hurricane Sandy: Characteristics, Potential Aftermath, and Response. JAMA 2012, 308, 2571–2572. [Google Scholar] [CrossRef] [PubMed] [Green Version]
- Evans, G.W.; Jacobs, S.V.; Dooley, D.; Catalano, R. The Interaction of Stressful Life Events and Chronic Strains on Community Mental Health. Am. J. Community Psychol. 1987, 15, 23–34. [Google Scholar] [CrossRef]
- Lim, Y.H.; Kim, H.; Kim, J.H.; Bae, S.; Park, H.Y.; Hong, Y.C. Air Pollution and Symptoms of Depression in Elderly Adults. Environ. Health Perspect. 2012, 120, 1023–1028. [Google Scholar] [CrossRef] [Green Version]
- Zivin, J.G.; Neidell, M. The Impact of Pollution on Worker Productivity. Am. Econ. Rev. 2012, 102, 3652–3673. [Google Scholar] [CrossRef] [Green Version]
- Chang, T.; Graff Zivin, J.; Gross, T.; Neidell, M. Particulate Pollution and the Productivity of Pear Packers. Am. Econ. J. Econ. Policy 2016, 8, 141–169. [Google Scholar] [CrossRef] [Green Version]
- Fu, S.; Zhang, P. Air Quality and Manufacturing Firm Productivity: Comprehensive Evidence from China. SSRN J. 2017. [Google Scholar] [CrossRef] [Green Version]
- Plaisier, I.; Beekman, A.T.F.; De Graaf, R.; Smit, J.H.; Van Dyck, R.; Penninx, B.W.J.H. Work Functioning in Persons with Depressive and Anxiety Disorders: The Role of Specific Psychopathological Characteristics. J. Affect. Disord. 2010, 125, 198–206. [Google Scholar] [CrossRef] [PubMed]
- Yu, L.; Ying, R.; Zhang, B. How Air Pollution Lowers the Domestic Value-added Ratio in Exports: An Empirical Study of China. Environ. Sci. Pollut. Res. 2021. ahead of print. [Google Scholar] [CrossRef] [PubMed]
- Wang, Y.; Lu, T.; Qiao, Y. The Effect of Air Pollution on Corporate Social Responsibility Performance in High Energy-consumption Industry: Evidence from Chinese Listed Companies. J. Clean. Prod. 2021, 280, 124345. [Google Scholar] [CrossRef]
- Bell, T.B.; Doogar, R.; Solomon, I. Audit Labor Usage and Fees under Business Risk Auditing. J. Account. Res. 2008, 46, 729–760. [Google Scholar] [CrossRef]
- Hermanson, H.M. An Analysis of the Demand for Reporting on Internal Control. Account. Horiz. 2000, 14, 325–341. [Google Scholar] [CrossRef]
- Doyle, J.T.; Ge, W.; Mcvay, S. Accruals Quality and Internal Control over Financial Reporting. Account. Rev. 2007, 82, 1141–1170. [Google Scholar] [CrossRef]
- Carter, M.E.; Lynch, L.J.; Zechman, S.L.C. Changes in Bonus Contracts in the Post-sarbanes–oxley Era. Rev. Account. Stud. 2009, 14, 480–506. [Google Scholar] [CrossRef]
- Feng, M.; Li, C.; McVay, S. Internal Control and Management Guidance. J. Account. Econ. 2009, 48, 190–209. [Google Scholar] [CrossRef]
- Cheng, Q.; Goh, B.W.; Kim, J.B. Internal Control and Operational Efficiency. Contemp. Account. Res. 2018, 35, 1102–1139. [Google Scholar] [CrossRef]
- Dechow, P.M.; Sloan, R.G.; Sweeney, A.P. Detecting Earnings Management. Account. Rev. 1995, 70, 193–225. [Google Scholar]
- Defond, M.L.; Wong, T.J.; Li, S. The Impact of Improved Auditor Independence on Audit Market Concentration in China. J. Account. Econ. 1999, 28, 269–305. [Google Scholar] [CrossRef]
- Chen, G.; Firth, M.; Gao, D.N.; Rui, O.M. Ownership Structure, Corporate Governance, and Fraud: Evidence from China. J. Corp. Financ. 2006, 12, 424–448. [Google Scholar] [CrossRef]
- Gassen, J.; Skaife, H.A. Can Audit Reforms Affect the Information Role of Audits? Evidence from the German Market. Contemp. Account. Res. 2009, 26, 867–898. [Google Scholar] [CrossRef]
- DeFond, M.; Subramanyam, K. Restrictions to Accounting Choice: Evidence from Auditor Realignment; Working Paper; University of Southern California: Los Angeles, CA, USA, 1997. [Google Scholar]
- Baron, R.M.; Kenny, D.A. The Moderator-Mediator Variable Distinction in Social Psychological Research: Conceptual, Strategic, and Statistical Considerations. J. Personal. Soc. Psychol. 1986, 51, 1173–1182. [Google Scholar] [CrossRef]
Figure 1.
Mechanism of smog pollution affecting audit quality.


Table 1.
Variable definitions.
| Variable Sign | Variable Name | Variable Description |
|---|---|---|
| Qualityi,t | Audit quality | The absolute value of discretionary accruals calculated using the modified Jones model [51]; multiplied by −100 to measure audit quality |
| Timei,t | Audit time | Measured by the number of days between the balance sheet date and the audit report date |
| ICi,t | Internal control | Measured by the internal control information disclosure index in the DIB Internal Control and Risk Management Database |
| PM2.5i,t | Smog pollution | The average of the PM2.5 concentration data in monthly air quality reports from November of the current year to April of the following year |
| Sizei,t | Firm size | The natural logarithm of total assets |
| Reci,t | Ratio of accounts receivable to total assets | Accounts receivable/total assets |
| Invi,t | Ratio of inventory to total assets | Inventory/total assets |
| Levi,t | Ratio of total liability to total assets | Total liability/total assets |
| Currenti,t | Current ratio | Current assets/current liability |
| Roai,t | Return on total assets | (total profit + financial expenses)/total assets |
| Lossi,t | Whether the firm experienced a loss in the current year | A dummy variable that takes 1 if the net profit is less than 0; otherwise, it is 0 |
| Btmi,t | Book-to-market ratio | |
| Growthi,t | Growth rate | Amount of increased revenue in current year /amount of revenue in previous year |
| Shrcr1i,t | Largest shareholder’s shareholding ratio | The largest shareholder’s shareholding ratio |
| Indirectori,t | Proportion of independent directors on the board of directors | Number of independent directors/number of board members |
| Duali,t | Whether the chairman is also the general manager | A dummy variable that takes 1 if the chairman is also the general manager; otherwise, it takes 0 |
| Soei,t | Whether the enterprise is a state-owned holding | A dummy variable that takes 1 if the enterprise is state-owned; otherwise, it takes 0 |
| Agei,t | Company’s listing age | The company’s listing age |
| AIi,t | Whether to issue additional shares | A dummy variable that takes 1 if stock is issued in the current year; otherwise, it takes 0 |
| Big_10i,t | Whether the enterprise’s annual audit is performed by a “top 10” accounting firm | A dummy variable that takes 1 if the accounting firm belongs to the “top 10;” otherwise, it takes 0 (The Chinese Institute of Certified Public Accountants publishes the top 100 accounting firms’ annual business income) |
| Switchi,t | Whether the company had an audit firm replacement in the current year | A dummy variable that takes 1 if the enterprise underwent audit firm replacement in the current year; otherwise, it takes 0 |
| L_opinioni,t | Type of audit opinion in the previous year | A dummy variable that takes 1 if a non-standard audit opinion was obtained in the previous year; otherwise, it takes 0 |
| Locai,t | Level of economic development at the company’s location | A dummy variable that takes 1 if the company is registered in Beijing, Shanghai, Tianjin, Guangzhou, or Shenzhen; otherwise, it takes 0 |
| Industryi,t | Industry | Industry dummy variable |
| Yeari,t | Year | Year dummy variable |
Table 2.
Descriptive statistics.
| Variable | N | Mean | Std. Dev. | Min. | Median | Max. |
|---|---|---|---|---|---|---|
| Quality | 7744 | −9.227 | 19.661 | −133.757 | −2.883 | −0.061 |
| PM2.5 | 7744 | 63.173 | 21.234 | 29.166 | 59.912 | 122.263 |
| Time | 7744 | 135.655 | 18.346 | 64.000 | 127.000 | 148.000 |
| IC | 7744 | 35.895 | 6.072 | 18.070 | 36.541 | 47.885 |
| Size | 7744 | 22.208 | 1.260 | 19.903 | 22.048 | 26.069 |
| Rec | 7744 | 0.126 | 0.107 | 0.000 | 0.104 | 0.477 |
| Inv | 7744 | 0.150 | 0.147 | 0.000 | 0.110 | 0.747 |
| Lev | 7744 | 0.426 | 0.207 | 0.052 | 0.418 | 0.872 |
| Current | 7744 | 2.494 | 2.526 | 0.297 | 1.683 | 16.556 |
| Roa | 7744 | 0.044 | 0.050 | −0.159 | 0.042 | 0.192 |
| Loss | 7744 | 0.073 | 0.260 | 0.000 | 0.000 | 1.000 |
| Btm | 7744 | 0.825 | 0.867 | 0.083 | 0.530 | 4.854 |
| Growth | 7744 | 0.216 | 0.491 | −0.511 | 0.118 | 3.216 |
| Shrcr1 | 7744 | 0.361 | 0.152 | 0.092 | 0.342 | 0.750 |
| Indirector | 7744 | 0.376 | 0.053 | 0.333 | 0.364 | 0.571 |
| Dual | 7744 | 0.267 | 0.442 | 0.000 | 0.000 | 1.000 |
| Soe | 7744 | 0.342 | 0.474 | 0.000 | 0.000 | 1.000 |
| Age | 7744 | 10.209 | 7.000 | 1.000 | 8.000 | 24.000 |
| AI | 7744 | 0.178 | 0.382 | 0.000 | 0.000 | 1.000 |
| Big_10 | 7744 | 0.646 | 0.478 | 0.000 | 1.000 | 1.000 |
| Switch | 7744 | 0.143 | 0.350 | 0.000 | 0.000 | 1.000 |
| L_opinion | 7744 | 0.034 | 0.182 | 0.000 | 0.000 | 1.000 |
| Loca | 7744 | 0.379 | 0.485 | 0.000 | 0.000 | 1.000 |
Table 3.
Regression results.
| Variable | Quality (1) | Time (2) | Quality (3) | Quality (4) | Quality (5) |
|---|---|---|---|---|---|
| PM2.5 | −0.0416 ** | −0.0217 ** | −0.0404 ** | −0.0404 ** | |
| (−2.09) | (−2.06) | (−2.03) | (−2.03) | ||
| Time | 0.0575 *** | 0.0564 *** | −0.2190 * | ||
| (2.66) | (2.62) | (−1.81) | |||
| IC | −1.0290 ** | ||||
| (−2.41) | |||||
| Time × IC | 0.00776 ** | ||||
| (2.30) | |||||
| Size | −7.7750 *** | 0.8150 *** | −7.8560 *** | −7.8210 *** | −7.7480 *** |
| (−15.58) | (3.09) | (−15.75) | (−15.67) | (−15.34) | |
| Rec | 8.0900 * | 6.9960 *** | 7.4510 * | 7.6950 * | 7.9560 * |
| (1.91) | (3.13) | (1.76) | (1.82) | (1.88) | |
| Inv | 3.1610 | 0.1330 | 3.2610 | 3.1540 | 3.2560 |
| (0.94) | (0.07) | (0.97) | (0.94) | (0.97) | |
| Lev | 15.5900 *** | 0.7200 | 15.6600 *** | 15.5500 *** | 15.3600 *** |
| (4.63) | (0.41) | (4.66) | (4.62) | (4.56) | |
| Current | 0.1370 | 0.0481 | 0.1240 | 0.1340 | 0.1240 |
| (0.66) | (0.44) | (0.59) | (0.64) | (0.59) | |
| Roa | 12.1400 | −26.4000 *** | 13.5500 | 13.6300 | 13.9800 |
| (1.15) | (−4.72) | (1.28) | (1.29) | (1.32) | |
| Loss | −1.9480 | −1.3330 | −1.9450 | −1.8720 | −1.8480 |
| (−1.01) | (−1.31) | (−1.01) | (−0.97) | (−0.96) | |
| Btm | −9.1120 *** | 0.6080 | −9.2070 *** | −9.1460 *** | −9.1620 *** |
| (−11.97) | (1.51) | (−12.10) | (−12.01) | (−12.04) | |
| Growth | 0.3310 | −1.5060 *** | 0.4020 | 0.4160 | 0.3490 |
| (0.40) | (−3.41) | (0.48) | (0.50) | (0.42) | |
| Shrcr1 | −4.7090 * | −1.4100 | −4.7750 * | −4.6290 * | −4.6770 * |
| (−1.69) | (−0.96) | (−1.72) | (−1.67) | (−1.68) | |
| Indiretor | −32.7300 *** | −4.2120 | −31.7100 *** | −32.4900 *** | −32.1600 *** |
| (−4.41) | (−1.07) | (−4.28) | (−4.38) | (−4.33) | |
| Dual | −1.6490 * | 0.2350 | −1.5880 * | −1.6620 * | −1.7270 * |
| (−1.77) | (0.48) | (−1.71) | (−1.79) | (−1.85) | |
| Soe | −0.9390 | −2.9600 *** | −0.9970 | −0.7720 | −0.6700 |
| (−0.90) | (−5.36) | (−0.96) | (−0.74) | (−0.64) | |
| Age | 0.2170 *** | −0.0965 ** | 0.2300 *** | 0.2220 *** | 0.2180 *** |
| (2.91) | (−2.45) | (3.09) | (2.98) | (2.92) | |
| AI | 2.0300 * | 0.6690 | 2.0110 * | 1.9920 * | 1.9760 * |
| (1.86) | (1.16) | (1.84) | (1.82) | (1.81) | |
| Big_10 | −1.5250 * | 0.0240 | −1.3890 * | −1.5260 * | −1.5310 * |
| (−1.85) | (0.06) | (−1.69) | (−1.85) | (−1.86) | |
| Switch | 1.5220 | 0.3330 | 1.5380 | 1.5030 | 1.5320 |
| (1.36) | (0.57) | (1.38) | (1.35) | (1.37) | |
| L_opinion | 0.2620 | 2.5110 ** | 0.1030 | 0.1200 | 0.1290 |
| (0.12) | (2.18) | (0.05) | (0.05) | (0.06) | |
| Loca | −4.2710 *** | −0.0052 | −3.9830 *** | −4.2710 *** | −4.1990 *** |
| (−5.04) | (−0.01) | (−4.77) | (−5.04) | (−4.95) | |
| Cons | 187.6000 *** | 114.9000 ** | 178.3000 *** | 181.1000 *** | 216.0000 *** |
| (16.57) | (19.23) | (15.50) | (15.63) | (11.45) | |
| Industry | control | control | control | control | control |
| Year | control | control | control | control | control |
| N | 7744 | 7744 | 7744 | 7744 | 7744 |
| Adj R2 | 0.246 | 0.039 | 0.246 | 0.246 | 0.246 |
Note. ***, **, and * indicate significance at the 1%, 5%, and 10% levels, respectively, and t values are in parentheses.
Table 4.
Group test regression results.
| Variable | Quality (1) | Quality (1) | Time (2) | Quality (3) | Quality (4) |
|---|---|---|---|---|---|
| Non-“Top 10” | “Top 10” | “Top 10” | “Top 10” | “Top 10” | |
| PM2.5 | 0.00198 | −0.0681 ** | −0.0323 ** | −0.0658 ** | |
| (0.16) | (−2.19) | (−2.40) | (−2.12) | ||
| Time | 0.0756 ** | 0.0733 ** | |||
| (2.31) | (2.24) | ||||
| Size | −4.2100 *** | −8.8410 *** | 0.6080 * | −8.9590 *** | −8.8860 *** |
| (−11.46) | (−12.34) | (1.96) | (−12.51) | (−12.40) | |
| Rec | 4.9680 * | 8.3930 | 10.6500 *** | 7.0830 | 7.6120 |
| (1.74) | (1.33) | (3.89) | (1.12) | (1.20) | |
| Inv | 2.6910 | 2.1080 | 3.8890 * | 2.1300 | 1.8230 |
| (1.25) | (0.40) | (1.72) | (0.41) | (0.35) | |
| Lev | −3.7870 * | 27.2100 *** | −1.2280 | 27.5400 *** | 27.3000 *** |
| (−1.69) | (5.39) | (−0.56) | (5.45) | (5.41) | |
| Current | −0.2490 * | 0.4550 | 0.1260 | 0.4340 | 0.4460 |
| (−1.75) | (1.48) | (0.94) | (1.41) | (1.45) | |
| Roa | −17.0400 ** | 23.3900 | −31.2400 *** | 25.5500 * | 25.6800 * |
| (−2.31) | (1.51) | (−4.67) | (1.65) | (1.66) | |
| Loss | −3.2600 ** | −1.7860 | −2.3650 * | −1.7020 | −1.6130 |
| (−2.56) | (−0.62) | (−1.88) | (−0.59) | (−0.56) | |
| Btm | −1.8840 *** | −12.3400 *** | 0.3380 | −12.4700 *** | −12.3700 *** |
| (−3.41) | (−11.21) | (0.71) | (−11.33) | (−11.23) | |
| Growth | −0.0380 | 0.2410 | −1.0980 ** | 0.2470 | 0.3220 |
| (−0.07) | (0.19) | (−2.01) | (0.20) | (0.25) | |
| Shrcr1 | 1.4560 | −8.0760 ** | −2.4690 | −8.0820 ** | −7.8950 * |
| (0.77) | (−1.96) | (−1.39) | (−1.96) | (−1.92) | |
| Indiretor | 5.2980 | −44.5500 *** | −4.3840 | −43.5900 *** | −44.2200 *** |
| (1.00) | (−4.13) | (−0.94) | (−4.05) | (−4.10) | |
| Dual | −1.7620 *** | −1.9700 | 0.2560 | −1.8980 | −1.9890 |
| (−2.76) | (−1.43) | (0.43) | (−1.38) | (−1.45) | |
| Soe | −0.3190 | −0.9770 | −2.7030 *** | −1.1540 | −0.7780 |
| (−0.47) | (−0.61) | (−3.92) | (−0.73) | (−0.49) | |
| Age | 0.00226 | 0.2900 *** | −0.0579 | 0.3120 *** | 0.2940 *** |
| (0.04) | (2.63) | (−1.21) | (2.83) | (2.66) | |
| AI | 0.6590 | 2.1540 | 1.0260 | 2.1090 | 2.0780 |
| (0.91) | (1.31) | (1.44) | (1.28) | (1.27) | |
| Switch | 0.1110 | 2.3380 | −0.0524 | 2.3820 | 2.3420 |
| (0.15) | (1.40) | (−0.07) | (1.42) | (1.40) | |
| L_opinion | 1.7240 | 0.2040 | 2.8470 ** | −0.0709 | −0.00417 |
| (1.18) | (0.06) | (2.02) | (−0.02) | (−0.00) | |
| Loca | 0.7830 | −6.9000 *** | −0.4460 | −6.3470 *** | −6.8670 *** |
| (1.33) | (−5.53) | (−0.82) | (−5.18) | (−5.50) | |
| Cons | 92.1300 *** | 214.5000 *** | 122.8000 *** | 201.8000 *** | 205.5000 *** |
| (11.05) | (13.07) | (17.27) | (12.01) | (12.17) | |
| Industry | control | control | control | control | control |
| Year | control | control | control | control | control |
| N | 2743 | 5001 | 5001 | 5001 | 5001 |
| Adj R2 | 0.416 | 0.250 | 0.043 | 0.250 | 0.250 |
Note. ***, **, and * indicate significance at the 1%, 5%, and 10% levels, respectively, and t values are in parentheses.
Table 5.
Regression results using Extrweather.
| Variable | Quality (1) | Time (2) | Quality (3) | Quality (4) | Quality (5) |
|---|---|---|---|---|---|
| Extrweather | −5.6050 ** | −2.6840 ** | −5.4540 ** | −5.4690 ** | |
| (−2.29) | (−2.08) | (−2.23) | (−2.23) | ||
| Time | 0.0575 *** | 0.0563 *** | −0.2190 * | ||
| (2.66) | (2.61) | (−1.80) | |||
| IC | −1.0280 ** | ||||
| (−2.41) | |||||
| Time × IC | 0.00775 ** | ||||
| (2.29) | |||||
| Size | −7.7710 *** | 0.8150 *** | −7.8560 *** | −7.8170 *** | −7.7430 *** |
| (−15.58) | (3.09) | (−15.75) | (−15.66) | (−15.33) | |
| Rec | 8.1430 * | 7.0120 *** | 7.4510 * | 7.7480 * | 8.0130 * |
| (1.92) | (3.13) | (1.76) | (1.83) | (1.89) | |
| Inv | 3.1710 | 0.1420 | 3.2610 | 3.1630 | 3.2670 |
| (0.94) | (0.08) | (0.97) | (0.94) | (0.97) | |
| Lev | 15.5800 *** | 0.7180 | 15.6600 *** | 15.5400 *** | 15.3400 *** |
| (4.63) | (0.40) | (4.66) | (4.62) | (4.55) | |
| Current | 0.1370 | 0.0479 | 0.1240 | 0.1340 | 0.1240 |
| (0.66) | (0.44) | (0.59) | (0.65) | (0.60) | |
| Roa | 12.2100 | −26.3700 *** | 13.5500 | 13.7000 | 14.0600 |
| (1.15) | (−4.72) | (1.28) | (1.29) | (1.33) | |
| Loss | −1.9500 | −1.3380 | −1.9450 | −1.8750 | −1.8520 |
| (−1.01) | (−1.32) | (−1.01) | (−0.97) | (−0.96) | |
| Btm | −9.1220 *** | 0.6010 | −9.2070 *** | −9.1560 *** | −9.1720 *** |
| (−11.98) | (1.50) | (−12.10) | (−12.03) | (−12.05) | |
| Growth | 0.3240 | −1.5100 *** | 0.4020 | 0.4090 | 0.3420 |
| (0.39) | (−3.42) | (0.48) | (0.49) | (0.41) | |
| Shrcr1 | −4.6610 * | −1.3940 | −4.7750 * | −4.5830 * | −4.6300 * |
| (−1.68) | (−0.95) | (−1.72) | (−1.65) | (−1.67) | |
| Indiretor | −32.9000 *** | −4.2630 | −31.7100 *** | −32.6600 *** | −32.3300 *** |
| (−4.43) | (−1.09) | (−4.28) | (−4.40) | (−4.35) | |
| Dual | −1.6600 * | 0.2330 | −1.5880 * | −1.6730 * | −1.7400* |
| (−1.79) | (0.47) | (−1.71) | (−1.80) | (−1.87) | |
| Soe | −0.9190 | −2.9600 *** | −0.9970 | −0.7520 | −0.6480 |
| (−0.88) | (−5.36) | (−0.96) | (−0.72) | (−0.62) | |
| Age | 0.2170 *** | −0.0958 ** | 0.2300 *** | 0.2230 *** | 0.2180 *** |
| (2.92) | (−2.44) | (3.09) | (2.99) | (2.93) | |
| AI | 2.0260 * | 0.6670 | 2.0110 * | 1.9880 * | 1.9710 * |
| (1.85) | (1.16) | (1.84) | (1.82) | (1.80) | |
| Big_10 | −1.5140 * | 0.0353 | −1.3890 * | −1.5160 * | −1.5210 * |
| (−1.84) | (0.08) | (−1.69) | (−1.84) | (−1.85) | |
| Switch | 1.4950 | 0.3220 | 1.5380 | 1.4770 | 1.5050 |
| (1.34) | (0.55) | (1.38) | (1.32) | (1.35) | |
| L_opinion | 0.2640 | 2.5120 ** | 0.1030 | 0.1220 | 0.1280 |
| (0.12) | (2.18) | (0.05) | (0.06) | (0.06) | |
| Loca | −4.3890 *** | −0.0492 | −3.9830 *** | −4.3860 *** | −4.3150 *** |
| (−5.13) | (−0.11) | (−4.77) | (−5.13) | (−5.05) | |
| Cons | 186.9000 *** | 114.5000 *** | 178.3000 *** | 180.4000 *** | 215.3000 *** |
| (16.57) | (19.23) | (15.50) | (15.63) | (11.42) | |
| Industry | control | control | control | control | control |
| Year | control | control | control | control | control |
| N | 7744 | 7744 | 7744 | 7744 | 7744 |
| Adj R2 | 0.246 | 0.039 | 0.246 | 0.246 | 0.247 |
Note. ***, **, and * indicate significance at the 1%, 5%, and 10% levels, respectively, and t values are in parentheses.
Table 6.
Regression results using AQI.
| Variable | Quality (1) | Time (2) | Quality (3) | Quality (4) | Quality(5) |
|---|---|---|---|---|---|
| AQI | −0.6330 ** | −0.3130 * | −0.6150 ** | −0.6150 ** | |
| (−2.09) | (−1.95) | (−2.03) | (−2.03) | ||
| Time | 0.0575 *** | 0.0565 *** | −0.2190 * | ||
| (2.66) | (2.62) | (−1.80) | |||
| IC | −1.0280 ** | ||||
| (−2.41) | |||||
| Time × IC | 0.00775 ** | ||||
| (2.29) | |||||
| Size | −7.7880 *** | 0.8070 *** | −7.8560 *** | −7.8330 *** | −7.7610 *** |
| (−15.61) | (3.07) | (−15.75) | (−15.70) | (−15.37) | |
| Rec | 8.0920 * | 6.9910 *** | 7.4510 * | 7.6970 * | 7.9580 * |
| (1.91) | (3.12) | (1.76) | (1.82) | (1.88) | |
| Inv | 3.1900 | 0.1510 | 3.2610 | 3.1820 | 3.2840 |
| (0.95) | (0.08) | (0.97) | (0.94) | (0.97) | |
| Lev | 15.6500 *** | 0.7530 | 15.6600 *** | 15.6100 *** | 15.4200 *** |
| (4.65) | (0.42) | (4.66) | (4.64) | (4.58) | |
| Current | 0.1360 | 0.0476 | 0.1240 | 0.1330 | 0.1230 |
| (0.65) | (0.43) | (0.59) | (0.64) | (0.59) | |
| Roa | 12.080 | −26.4400 *** | 13.5500 | 13.5700 | 13.9200 |
| (1.14) | (−4.73) | (1.28) | (1.28) | (1.31) | |
| Loss | −1.9660 | −1.3440 | −1.9450 | −1.8900 | −1.8660 |
| (−1.02) | (−1.32) | (−1.01) | (−0.98) | (−0.97) | |
| Btm | −9.11600 *** | 0.6050 | −9.2070 *** | −9.1500 *** | −9.1660 *** |
| (−11.97) | (1.50) | (−12.10) | (−12.02) | (−12.04) | |
| Growth | 0.3240 | −1.5100 *** | 0.4020 | 0.4090 | 0.3430 |
| (0.39) | (−3.42) | (0.48) | (0.49) | (0.41) | |
| Shrcr1 | −4.6790 * | −1.3990 | −4.7750 * | −4.6000 * | −4.6470 * |
| (−1.68) | (−0.95) | (−1.72) | (−1.65) | (−1.67) | |
| Indiretor | −32.7700 *** | −4.2130 | −31.7100 *** | −32.5400 *** | −32.2000 *** |
| (−4.41) | (−1.07) | (−4.28) | (−4.38) | (−4.34) | |
| Dual | −1.6680 * | 0.2270 | −1.5880 * | −1.6810 * | −1.7460 * |
| (−1.79) | (0.46) | (−1.71) | (−1.81) | (−1.87) | |
| Soe | −0.9290 | −2.9610 *** | −0.9970 | −0.7620 | −0.6600 |
| (−0.89) | (−5.36) | (−0.96) | (−0.73) | (−0.63) | |
| Age | 0.2180 *** | −0.0956 ** | 0.2300 *** | 0.2230 *** | 0.2190 *** |
| (2.93) | (−2.43) | (3.09) | (3.00) | (2.94) | |
| AI | 2.037 * | 0.6730 | 2.0110 * | 1.9990 * | 1.9820 * |
| (1.86) | (1.16) | (1.84) | (1.83) | (1.81) | |
| Big_10 | −1.5270 * | 0.0266 | −1.3890 * | −1.5290 * | −1.5330 * |
| (−1.86) | (0.06) | (−1.69) | (−1.86) | (−1.86) | |
| Switch | 1.5260 | 0.3360 | 1.5380 | 1.5070 | 1.5360 |
| (1.37) | (0.57) | (1.38) | (1.35) | (1.38) | |
| L_opinion | 0.2840 | 2.5220 ** | 0.1030 | 0.1420 | 0.1500 |
| (0.13) | (2.19) | (0.05) | (0.06) | (0.07) | |
| Loca | −4.2920 *** | −0.00746 | −3.9830 *** | −4.2910 *** | −4.2190 *** |
| (−5.05) | (−0.02) | (−4.77) | (−5.06) | (−4.97) | |
| Cons | 188.4000 *** | 115.3000 *** | 178.3000 *** | 181.9000 *** | 216.8000 *** |
| (16.57) | (19.20) | (15.50) | (15.63) | (11.47) | |
| Industry | control | control | control | control | control |
| Year | control | control | control | control | control |
| N | 7744 | 7744 | 7744 | 7744 | 7744 |
| Adj R2 | 0.246 | 0.039 | 0.246 | 0.246 | 0.246 |
Note. ***, **, and * indicate significance at the 1%, 5%, and 10% levels, respectively, and t values are in parentheses.
Publisher’s Note: MDPI stays neutral with regard to jurisdictional claims in published maps and institutional affiliations. |
© 2021 by the authors. Licensee MDPI, Basel, Switzerland. This article is an open access article distributed under the terms and conditions of the Creative Commons Attribution (CC BY) license (https://creativecommons.org/licenses/by/4.0/).
Share and Cite
MDPI and ACS Style
Li, B.; Zhou, Y.; Zhang, T.; Liu, Y. The Impact of Smog Pollution on Audit Quality: Evidence from China. Atmosphere 2021, 12, 1015. https://0-doi-org.brum.beds.ac.uk/10.3390/atmos12081015
AMA Style
Li B, Zhou Y, Zhang T, Liu Y. The Impact of Smog Pollution on Audit Quality: Evidence from China. Atmosphere. 2021; 12(8):1015. https://0-doi-org.brum.beds.ac.uk/10.3390/atmos12081015
Chicago/Turabian StyleLi, Bin, Ying Zhou, Tingyu Zhang, and Yang Liu. 2021. "The Impact of Smog Pollution on Audit Quality: Evidence from China" Atmosphere 12, no. 8: 1015. https://0-doi-org.brum.beds.ac.uk/10.3390/atmos12081015
Note that from the first issue of 2016, this journal uses article numbers instead of page numbers. See further details here.