1. Introduction
Nowadays, one of the global challenges is the careful and efficient use of natural resources. In particular, a practically significant problem that we are facing is the reduction of power consumption. Thus, it becomes necessary to carry out research on modeling, predicting, and controlling the efficiency of resource exploitation during the operation of various objects associated with human activities. In such studies, the data use on both the objects under study and the environment is required. Especially, the collection and analysis of meteorological data (cloudiness, solar radiation, temperature, etc.) play here an important role since such atmospheric parameters significantly affect power consumption.
The present state in developing computation and telecommunication technologies provides the ability to quickly receive, digitize, and efficiently analyze big data. Often, such data are generated in processes of functioning or modeling complex systems in various spheres of human activity. A new form of studying similar systems, based on the use of current and retrospective data, is the so-called Digital Twin (DT) [
1]. Generally, DT is a virtual software entity that reflects the most important components of the studied object in its life cycle. Within DT, available physical and virtual data of the object are applied. Simulation modeling is still the main tool for studying with DT [
2].
One of the important directions of the DT use is the support of decision-making in managing socio-economic territories and infrastructure objects located on them [
3], emphasizing the use of environmentally friendly technologies and equipment [
4]. As a rule, equipment components are placed in a distributed environment and controlled by various subjects representing the object.
Simulation modeling is a promising direction in implementing DTs for studying infrastructure objects. It is widely used as one of the main decision-making support tools in managing various technical, economic, cultural, social, and other systems [
5]. Within such management, a wide range of practical problems is solved. These problems include strategic decision-making, planning, controlling, improving business processes, and introducing new technologies [
6], including environmentally friendly technologies [
7].
Simulation modeling makes it possible to obtain information about the execution of business processes in various infrastructures with different configurations. For example, analyzing their performance and efficiency are practically significant information [
8]. Therefore, it often allows us to figure out the best options for infrastructure operations.
Nowadays, users, who prepare and carry out large-scale experiments with applying simulation modeling, need tools that support the following main capabilities:
Distributed computing, including the multi-cloud environment use;
Creating and launching virtual machines (VMs) to support the usage of resources with different administrative policies (for example, the public or private, dedicated or non-dedicated, and virtualized or non-virtualized resource);
One-criterion and multi-criteria optimization;
Parameter Sweep Computing (PSC);
Workflow-based scientific applications that include sets of computational tasks linked via control and data dependencies and joined into the united computing process (workflow).
Moreover, Fortino et al. [
9] believe that an agent-based technique is an effective and expressive approach to simulation modeling in distributed environments. Generally, an agent is a software entity characterized by the specific behavior for autonomously operating on behalf of its user to achieve stated goals within a certain area of the user’s activities. In this case, such modeling allows us to take into account the key characteristics of the current state of the studied objects represented by agents.
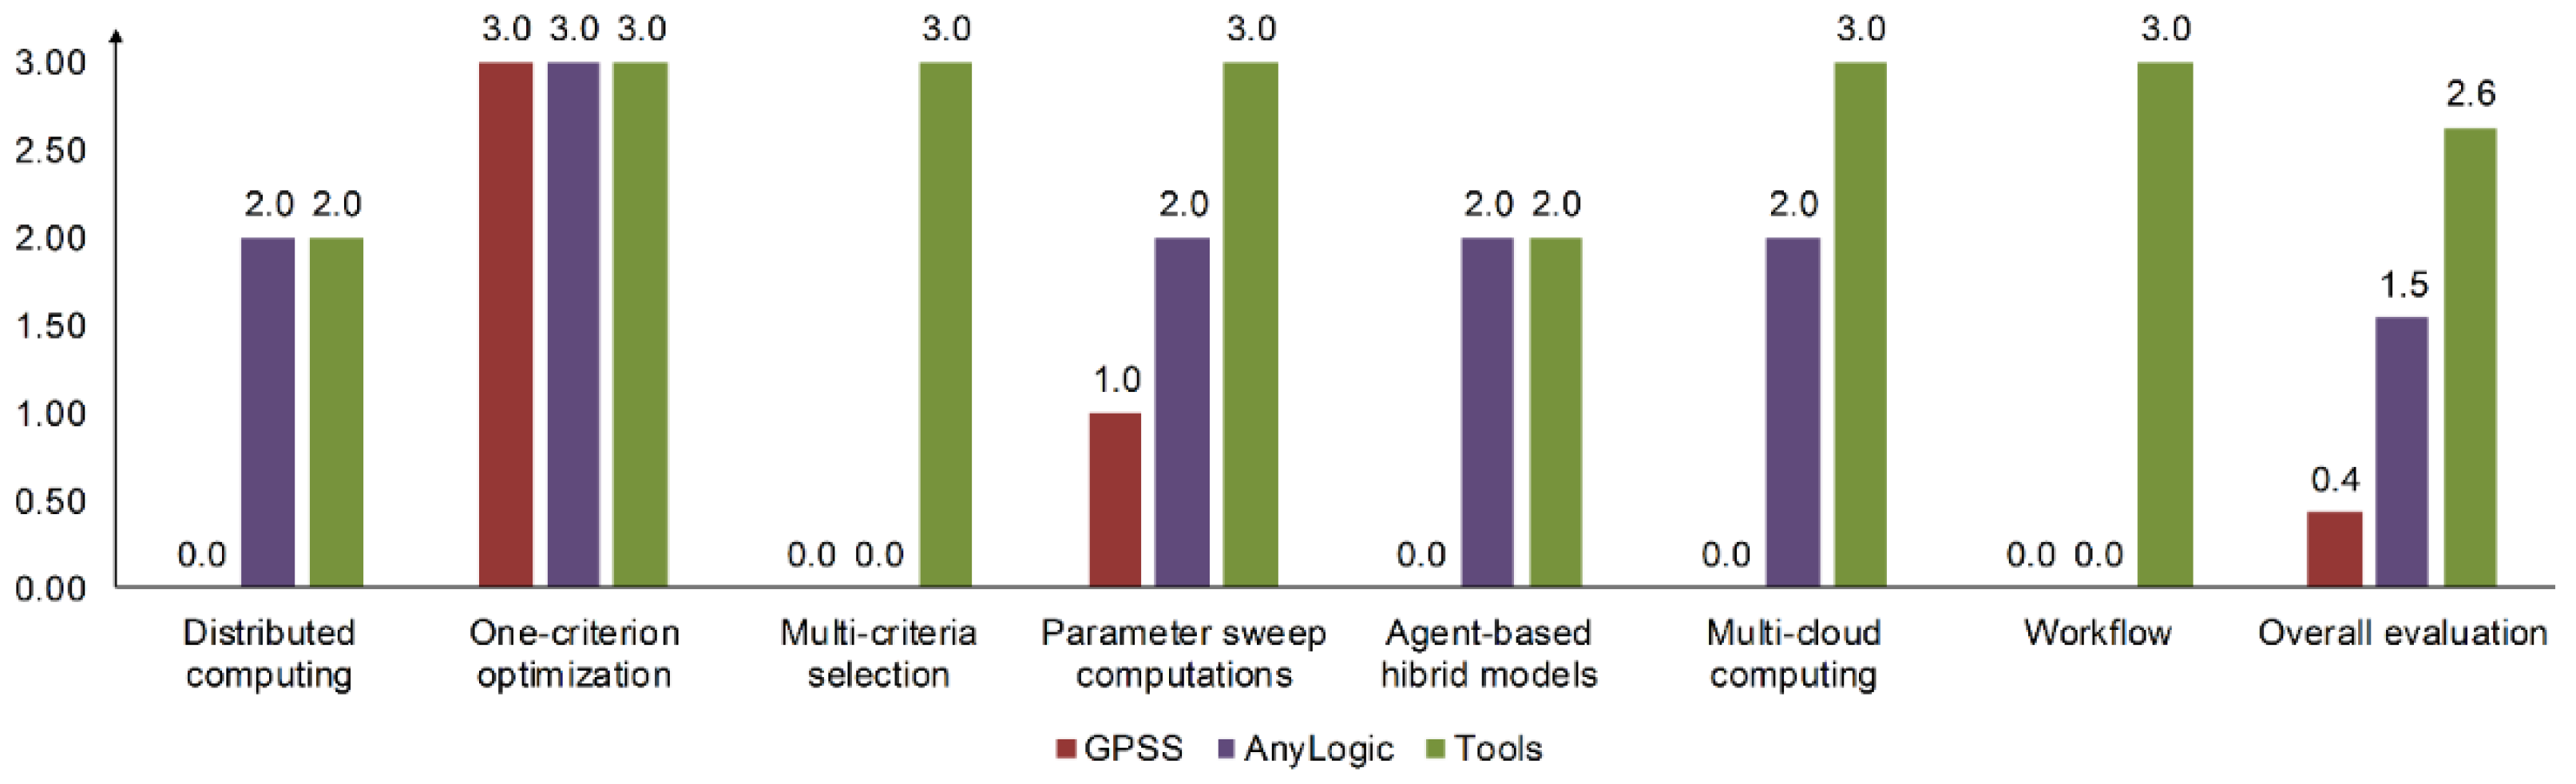
We briefly consider supporting the aforementioned capabilities in two of the most popular simulation modeling systems: General Purpose Simulation System (GPSS) [
10] and AnyLogic (available online:
https://www.anylogic.com, accessed on 10 September 2021). GPSS runs under Windows operating system only. One of the disadvantages of GPSS is the inability to perform computations in multi-threaded mode. Nevertheless, GPSS enables batch mode execution. Therefore, we have the ability to run several instances of GPSS with different versions of the input data for models on different environment nodes by means of the operating system. It means that parallel execution of GPSS instances can be carried out in any distributed computing environment. For example, the automatic launch of GPSS models is possible through the Cygwin Windows shell, which can be accessed over the Secure Shell (SSH) protocol. At the same time, parallel computing in AnyLogic is possible in its own cloud only. Both systems support only one-criterion optimization.
Within PSC [
11], users adjust the parameter values by their sweep in the predefined ranges. Such a technique provides a simple method to determine the optimal output parameters of a model by means varying its inputs. At the same time, the parameter sweep introduces a great computational complexity and leads to the need for high-performance computing (HPC). It is obvious that the number
of initial data variants can increase exponentially with a rise in the number of model inputs and extension of a range for varying their values. For calculating
, the following formula is used:
where
is a number of varying values for the
th parameter,
,
is a number of parameters. So, for example, for 8 parameters, each of which has 6 different values, we form more than 1.67 × 10
6 initial data variants. As a rule, simulation models applied in practice are more complicated. Therefore, they can use more parameters and their varied values. Besides, model users need to run it for the specified number of times with each variant. This is due to the need to achieve the necessary veracity of the obtained results that have stochastic nature. GPSS and AnyLogic support PSC to varying degrees.
The use of flexible tools for developing and applying simulation models is one of the most important aspects related to the above-mentioned systems [
12]. In this regard, the widespread growth in the role of microservices in managing complex systems should be noted. Microservices implement business operations of systems. They significantly simplify the interaction with a system and clarify the logic of its functioning. Their composition can represent the implementation of interconnection with a separate subsystem. Thus, due to applying microservices, a system can acquire additional competitive advantages [
13].
Well-known simulation standards such as distributed interactive simulation (DIS) [
14] and high-level architecture (HLA) [
15] are still widely used. However, their architectures and concepts are based on technologies that have evolved to varying degrees over the past several decades. Therefore, they often reach the limits of their capabilities when applied in the conditions of modern digitalization of the infrastructure objects under study. Thence, the development of new tools for simulation modeling is extremely needed [
16]. In addition, special attention should be paid to the development and implementation of tools for supporting the multi-criteria analysis of the computation results [
17].
Analysis of the results for object operation modeling can significantly improve its main parameters. Unfortunately, there are several problems in modern simulation tools [
18]. Among them are the complexity in developing models, their parallel execution, support for convenient user access to preparing, and carrying out large-scale experiments, etc. Moreover, big data processing in a heterogeneous environment is still a challenge [
19].
To this end, our study aims to develop new service-oriented tools for preparing and carrying out large-scale scientific experiments with simulation models for infrastructure objects of the Baikal natural territory together with the coast of the Irkutsk reservoir. Nowadays, the ecology of the Baikal territory as a unique natural object attracts close attention from the scientific community. In the past decade, an increase in anthropogenic load on this territory has been observed. The use of environmentally friendly equipment on infrastructure objects located on the coast of Lake Baikal reduces the negative consequences of such a load. In this regard, we choose this lake as a case of our study.
We apply GPSS for the model development. Therefore, we named our tools as Web-Based Services for GPSS (WBS-GPSS). Provided experiments are based on PSC with future multi-criteria analysis of the modeling results. Automation of developing and configuring microservices is implemented using a special model specification.
The features of the proposed approach are discussed in
Section 2. The computational experiment with respect to infrastructure objects of the Baikal natural territory is provided in
Section 3. In addition, we give a brief comparative analysis of the selected aspects of modeling in distributed environments for WBS-GPSS and other popular general-purpose simulation systems in
Section 4.
Section 5 discusses the study results and highlights their practical relevance. The last section concludes the paper.
2. Materials and Methods
Developers of complex systems models need various specialized methods and tools for supporting the following operations [
20,
21,
22]:
Partial automation in constructing models;
Verification and validation of models;
Adjustment of models for specific subject domains;
Implementation of hybrid modeling;
Collection and processing of poorly structured data;
Converting data into structures used by models;
Multi-criteria optimization analysis of the modeling results;
Web interface for the operations.
Moreover, since simulation leads to large time and resource consumption, it is required to use the HPC technologies. At the same time, access to the HPC should be convenient and flexible for users. The service-oriented programming paradigm makes it possible to successfully implement such a service.
The aforementioned methods and tools have been realized within the Orlando Tools (OT) [
23] and SIRIUS III [
24] frameworks. In [
23,
24], aspects of constructing simulation models are considered in detail on the example of solving warehouse logistics problems in the heterogeneous distributed computing environment. In this section, we discuss the new means provided by the developed parent services and important aspects of their implementation. These means allow us to efficiently adjust, compose, and apply the realized methods and tools to the new subject domain.
2.1. Web Interface and Parent Services
For the features of the proposed approach, we have designed parent services and special tools to support the DT development including a service-oriented web interface. The development process consists of the following main operations:
Creating a new experiment project;
Parsing a model specification;
Loading a model and its input data;
Generating data variants and VM-Based Jobs (VMBJs) for their processing within PSC;
Launching, queueing, and executing VMBJs;
Collecting and analyzing simulation results.
A VMBJ describes requirements for the computing environment for launching and executing VM with one of the model modules and a specific variant of the values of its input data. Thus, such a VM includes the input data files, executable file (a model module), additional applied program libraries, and the required system software.
As part of a new project of an experiment, DT inherits all capabilities from the parent services. This makes DT a full-fledged inherited service or a composition of services. The implementation of parent services is based on the REST approach [
25]. Operations of each parent service are realized as microservices. An application designed with Node.js (JavaScript runtime outside a browser) [
26] is hosted on the server-side. It accepts requests over the HTTP protocol. For the interaction of users with the parent services, we have developed a web interface, which supports their personal accounts.
In accordance with the requests, special scripts in the BASH language are executed on behalf of an unprivileged user. These scripts launch VMBJs in a queue of a local resource manager (LRM). When a resource becomes free, LRM starts the simulation modeling. This technique allows us to run VMBJs on any resource in a heterogeneous distributed computing environment. Resources used can be public or private, dedicated or non-dedicated, and virtualized or non-virtualized.
Table 1 shows the implementation tools and operations of the developed web interface and parent services. Parent service operations are implemented by microservices. The parent service for processing a model specification forms and adjusts the component of the web interface for selecting a model and determining input data values. As evidently shown in [
27], a microservice architecture allows us to flexibly embed and use each parent service in other applications.
2.2. Model Specification
In addition, a special model specification has been developed in the JSON format [
28]. It enables both to describe a new model and supports storing, transferring, and setting parameter values for each variant of the input data within every experiment. The developed specification describes the following conceptual objects: model parameters, methods of their generation, their sources, and resource requirements. Listing 1 shows the specification fragment that includes keys for their description without values. The keys are provided with comments.
| Listing 1 Model specification fragment. |
- 1:
{ - 2:
“id”: ““, //Unique model identifier - 3:
“name”: ““, //Model instance name - 4:
“model”: ““, //Base model name - 5:
“title”: ““, //Short description of the model instance - 6:
“description”: ““, //Description of the model instance - 7:
“resources”: [ //List of computing resources - 8:
{ - 9:
“id”: ““, //Unique resource identifier - 10:
“name”: ““,//Resource name - 11:
“address”: ““//Resource IP-address - 12:
}, - 13:
… ], - 14:
“parameters”: { //List of model parameters - 15:
“inputFile”: ““, //Path to the external module (file) of the model - 16:
“dataPath”: “, //Model root directory - 17:
“input”: [ //List of input parameters - 18:
{ - 19:
“type”: ““, //Parameter type (string, number, path) - 20:
“name”: ““, //Parameter name in the model - 21:
“gpssName”: ““, //Parameter name in the GPSS - 22:
“title”: ““, //Short parameter description - 23:
“value”: ““, //Parameter value - 24:
}, - 25:
… ], - 26:
“output”: [ //List of output parameters - 27:
{ - 28:
“type”: ““, //Parameter type (string, number, path) - 29:
“name”: ““, //Parameter name in the model - 30:
“gpssName”: ““, //Parameter name in the GPSS - 31:
“title”: ““, //Short parameter description - 32:
“value”: ““, //Parameter value - 33:
}, - 34:
… ], - 35:
… - 36:
}, - 37:
“commands”: { //Console commands - 38:
“start”: ““ //Executable console command - 39:
… - 40:
}
|
2.3. Microservices
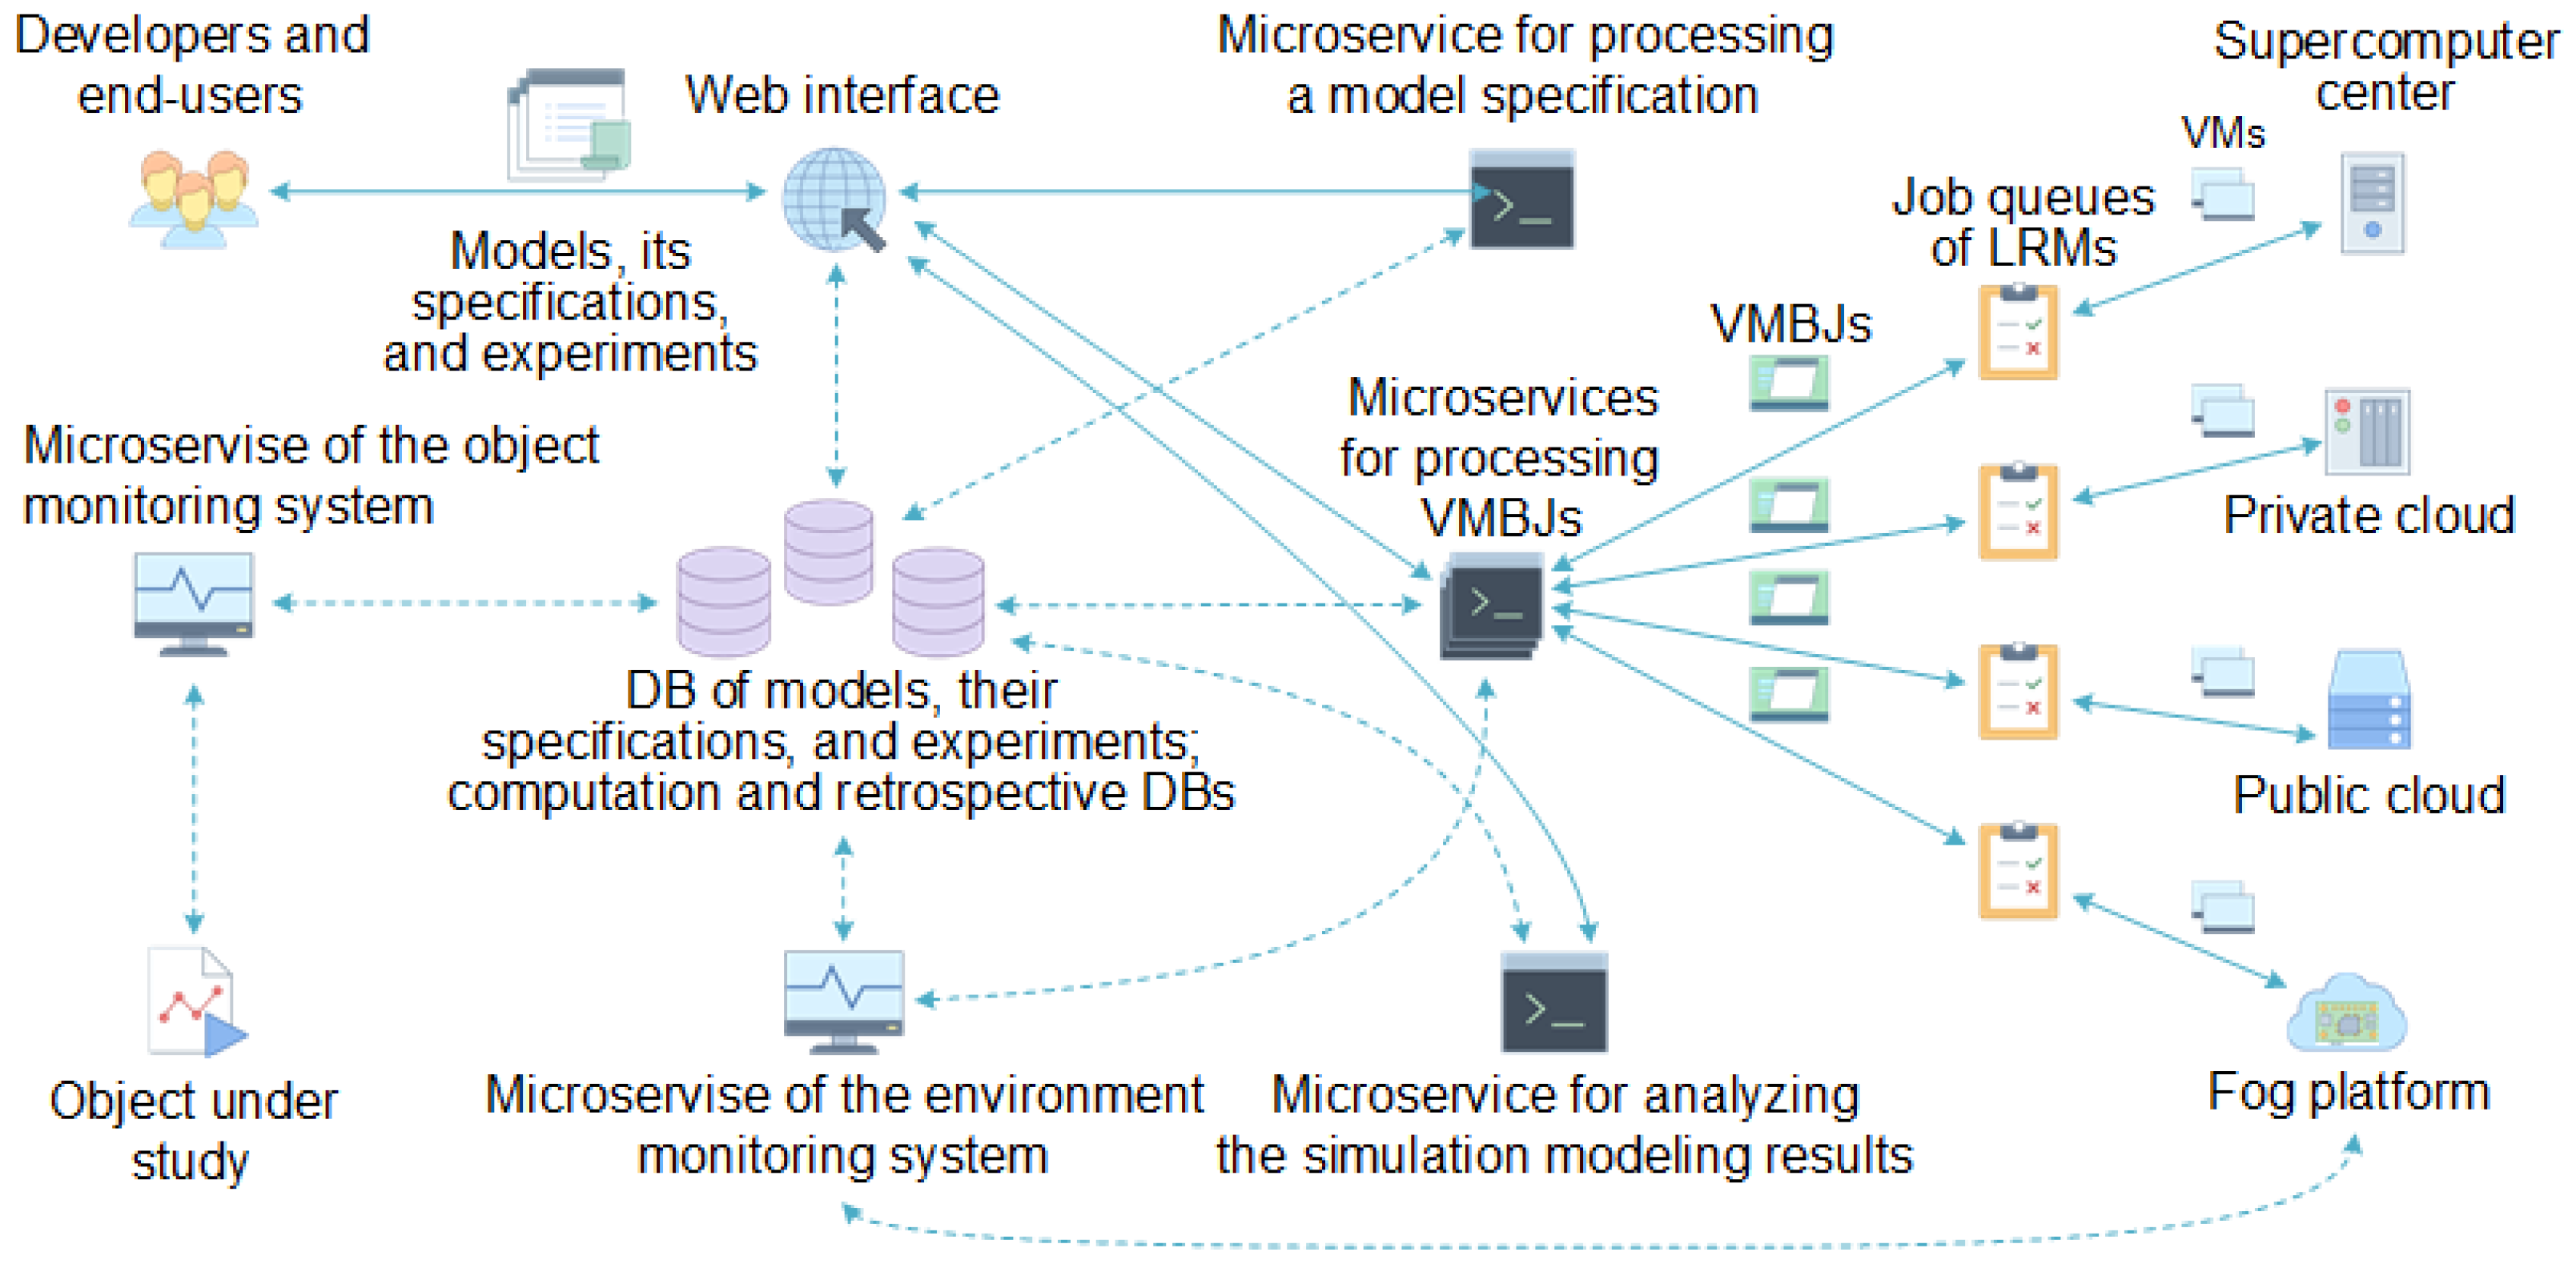
Developers design simulation model in GPSS, form their specifications, and load them into the corresponding DB. End-users select required models from the available ones. Then, they prepare and carry out experiments. Both these categories of specialists use the web interface (
Figure 1). A number of web interface functions are implemented by the microservices inherited from the above-considered parent services.
Two microservices inherit the parent service of the monitoring system. They are applied to obtain information about the object under study and computing environment. These microservices differ by the used APIs, data formats, and DBs.
Microservice for processing a specification parses specification of the selected model. Based on the parsing results, it creates and configures the web forms for filling model parameter values. In addition, this microservice extracts the required data from a retrospective DB and converts them into a target format for computing.
The monitoring system microservice transfers the current data of the object under study including information of its equipment on request from other microservices. In addition, it replenishes the retrospective DB by these data.
The microservices for processing VMBJs generate variants of the input data using the predetermined ranges and steps. Next, they create VMBJs for the variants of data and send these jobs to LRMs selected by end-users in preparing experiments.
LRMs launch the required number of VMs on resources and manage their execution. The GPSS model instances with the corresponding data variants are passed over SSH for launching into VMs running under Windows.
The microservices for processing VMBJs apply a special agent-based hypervisor shell for allocating heterogeneous resources to run the GPSS model instances within PSC [
29]. It configures VMs and provides interaction with both the various hypervisors (ESXi, KVM, QEMU, XEN, etc.,) and different container management systems (Docker, LXC, etc.,). The preliminary VM configuration is performed using the Ansible configuration management system (available online:
https://www.ansible.com, accessed on 10 September 2021). The required information about resource and system software is provided by the monitoring system microservice of the computing environment [
30]. Thus, we use various resources of public access supercomputer centers, private and public clouds, and fog platforms represented by the shell agents. At discrete moments in time, this shell predicts possible states of the environment in order to make a decision in allocating its resources. It applies a hybrid simulation model that queries resource agents. Generally, the fog platform shown in
Figure 1 is used for preprocessing and accumulating the data received from the equipment. Then, in discrete times, these data are portioned transferred to cloud resources for further deeper processing.
GPSS is run in batch mode. The Cygwin system is also running on VMs. It enables us to execute commands remotely using the SSH protocol and transfer data files using the SFTP protocol. After the modeling completion, VMs are destroyed. The microservices for processing VMBJs collect the experiment results (the GPSS standard reports) and save them in the computation DB.
Finally, the microservice for analyzing the simulation modeling results extracts the obtained values of observed variables from the computation DB for each variant of the input data. Next, it converts the extracted data into the target format and applies the predefined methods of multi-criteria optimization to the converted data.
2.4. Interaction and Composition of Microservices
We have developed the REST-based API to provide microservice interactions. Unlike SOAP services, the REST service responses to requests are more compact. They are presented in any format including XML used by the SOAP services. Moreover, the JSON format is efficient for the REST services in the data exchange. Each of REST services exchanges data with other services over local and global networks via the GET and POST requests. WebSockets are used to increase the performance of the API data exchange.
In the proposed approach, requests are created applying both the special system tools (for example, the GNU utilities wget or curl) and standard tools of various programming languages. Thus, model developers and end-users interact with microservices through the web interface, command line, or their applications.
The developer loads simulation models and their specifications using the web interface of DT. He can share models for different groups of end-users. In the context of the proposed approach, a model can be regarded as a new project. It receives a unique identifier. In addition, based on the usage of the parent service for processing a specification, the loaded model inherits the developed API. This allows us to quickly create new microservices for implementing the DT operations.
For supporting the automated composition, the model specification provides special keys for determining data files and links to the microservice APIs. They allow us to specify both the sets of variable values and paths to DBs or data files (text files with sets of input parameter values and the CSV or XLS files). For the XLS files, it is possible to perform calculations in MS Excel.
API of another microservice can be specified as a data source for model inputs. In this case, the following additional information about these parameters is required in the specification: data type (the key “type”), API access address (the key “apiPath”), authorization token (the key “token”), parameter whose value is required (the key “apiParamName”), and its value (the key “getApi”) (Listing 2).
| Listing 2 Model specification fragment with the additional information. |
- 1:
: “param”: { - 2:
“type”: “API_number”, - 3:
- 4:
“token”: “a456-5f9da4c4de739”, - 5:
“apiParamName”: “par_TRI”, - 6:
“name”: “TransactionReceiptInterval”, - 7:
“value”: “getApi”, - 8:
“apiPostData”: “data.json”, - 9:
“title”: “Transaction receipt interval”, - 10:
“variable”: “false”}
|
The key “apiPostData” is intended to determine the initial data to the requested microservice. These data are transferred via the POST request. Thus, the composition of the required microservices is determined based on the relations between their inputs and outputs. Relations are described in the model specifications. To designate the service and its parameters, allow us to use the following notation:
where
s is a microservice,
and
are its inputs and outputs.
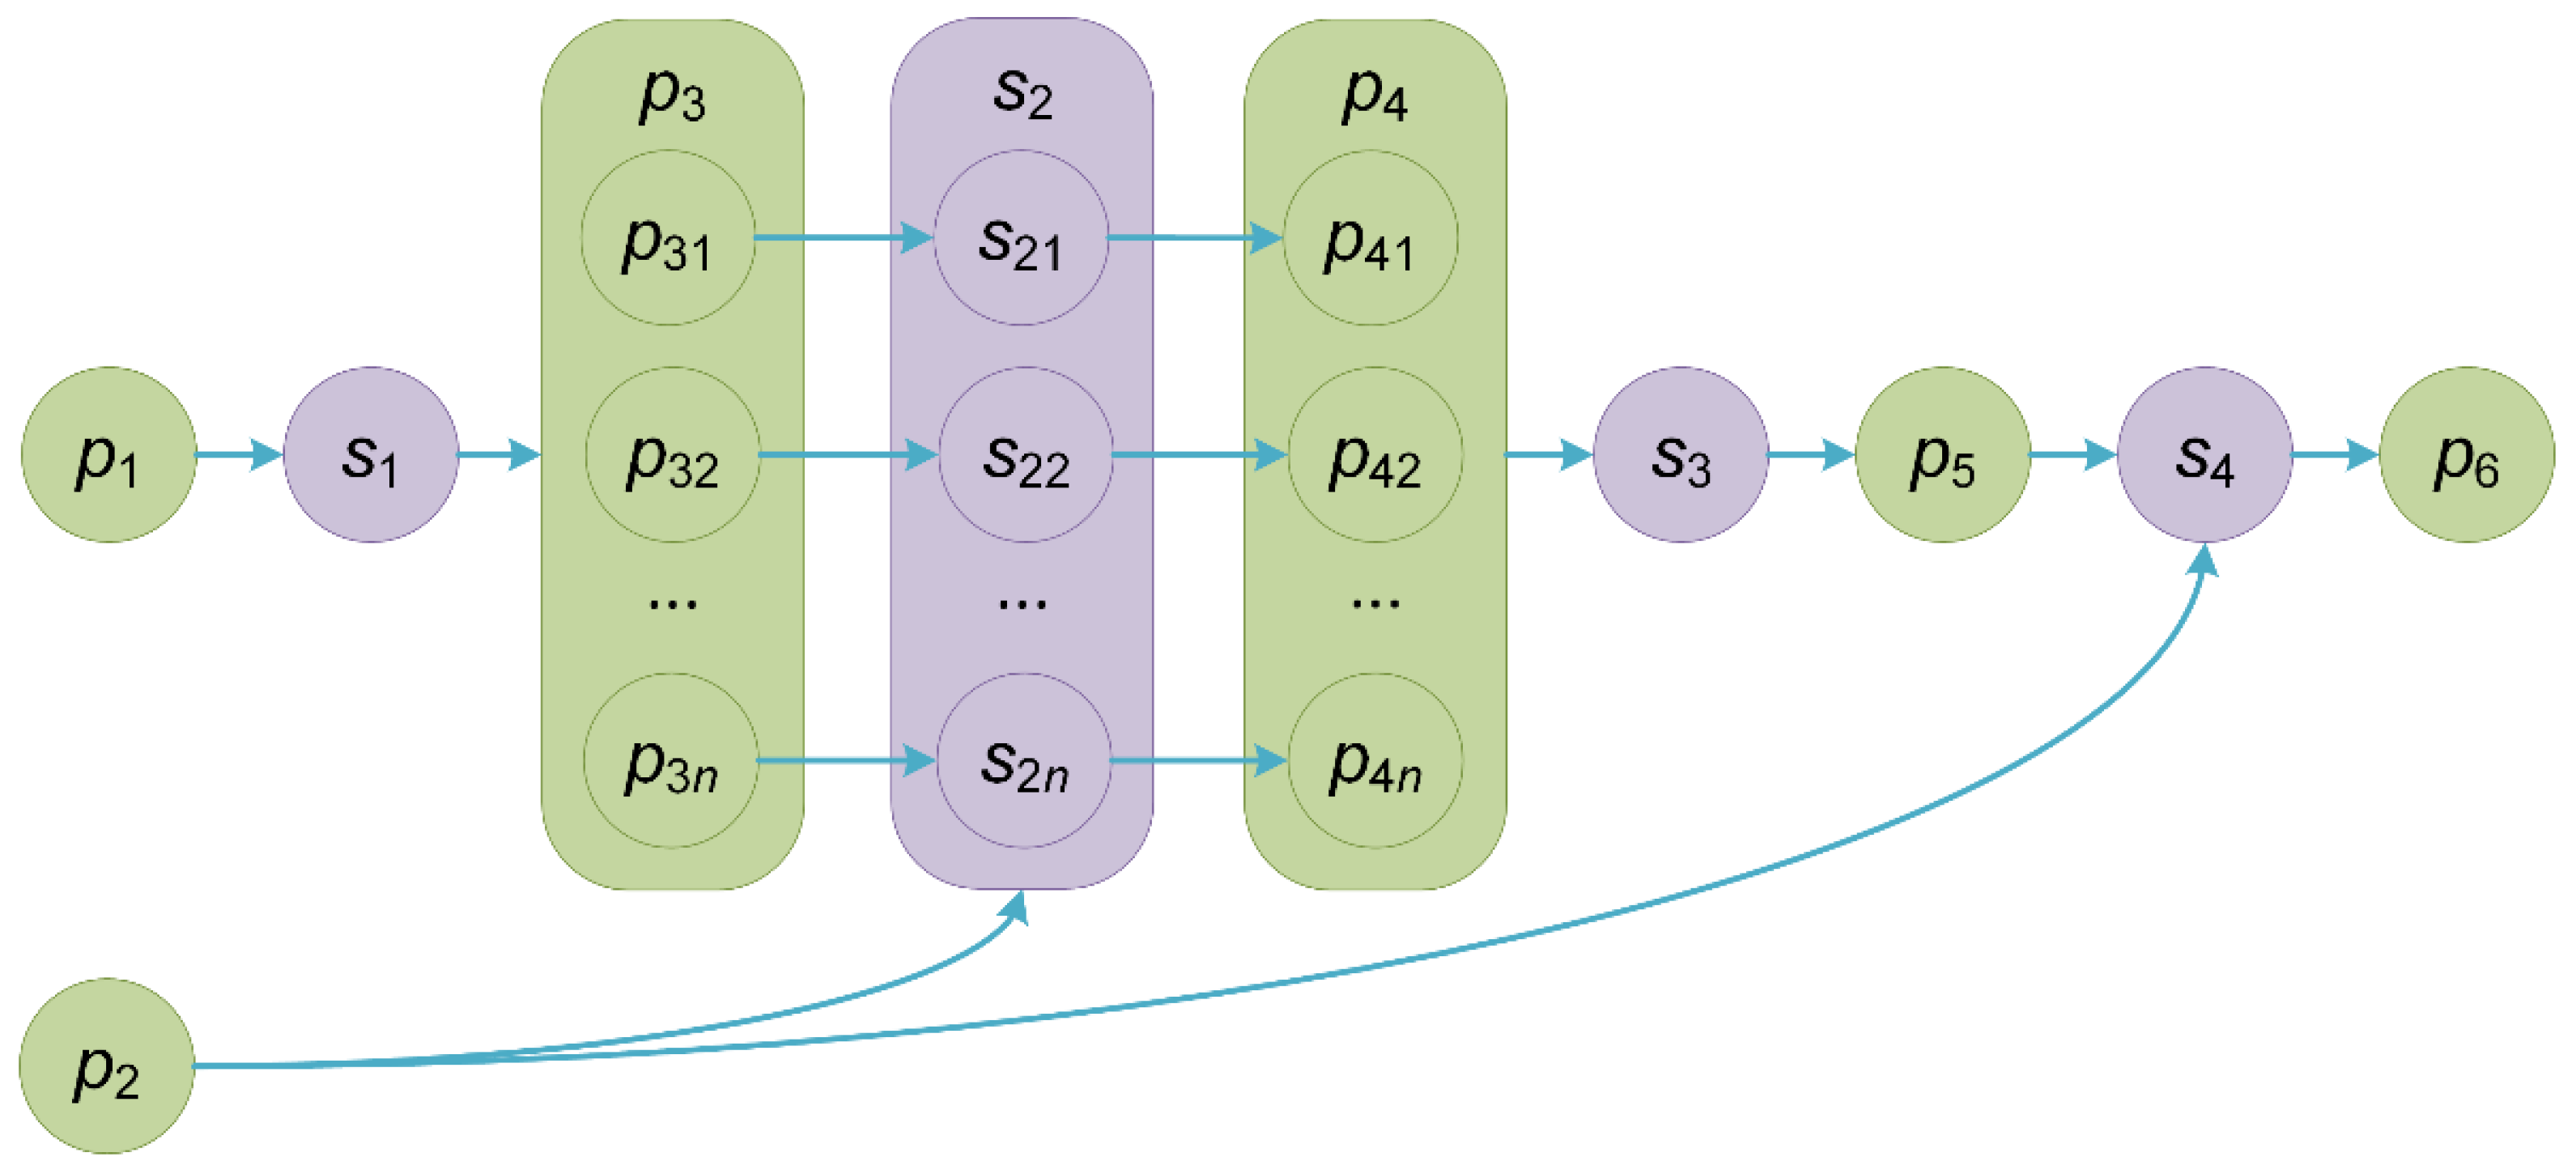
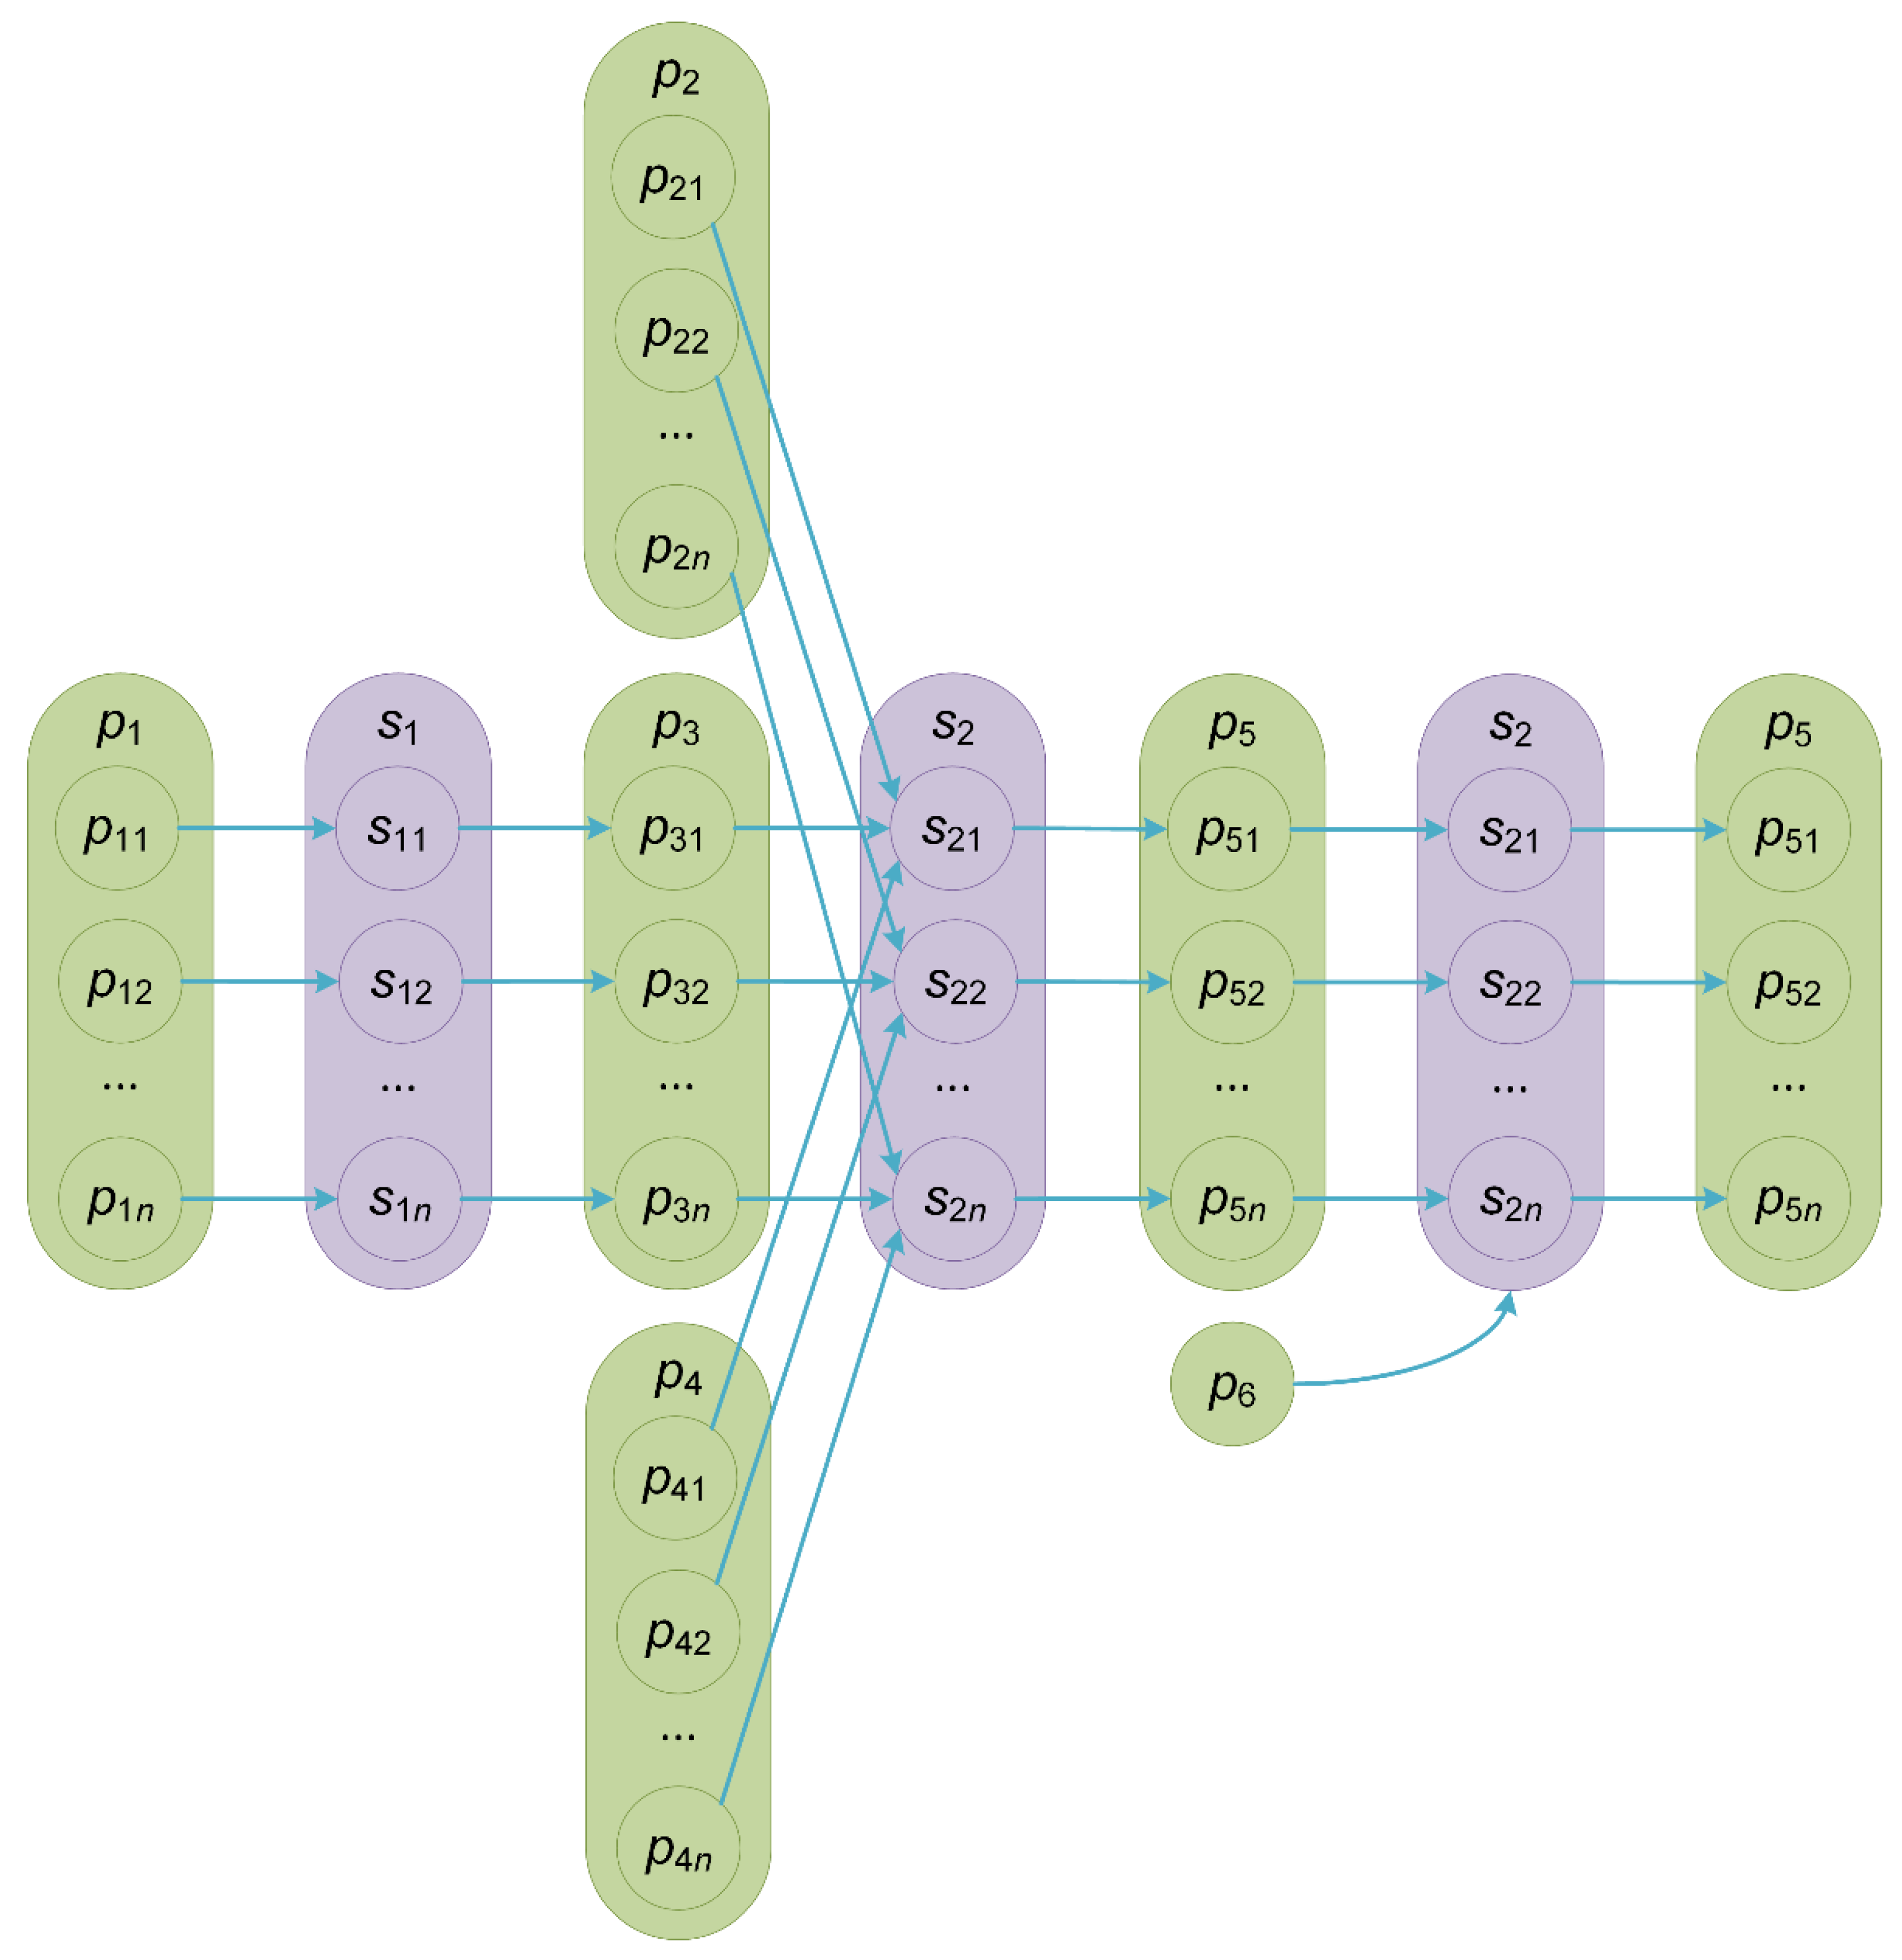
Figure 2 shows the composition scheme of four microservices represented in this notation:
,
, and
,
.
Generally, the composition of microservices represents a web-based scientific workflow [
31].
Figure 2 shows an example of such a workflow. In
Figure 2, the parameters
and
are inputs of the workflow. The parameter
is the output by this workflow. The instances
of the microservice
implement PSC (a run of simulation model instances). Data variants are swept values
of the parameter
. The instances
are executed in parallel on environment resources. Based on the outcomes for the data variants.
, the microservices
and
can perform their postprocessing, multi-criteria optimization, and visualization. Scalars, vectors, matrices, and complex data structures represent parameters. Their values are transferred between microservices as text files.
We developed a constructor of the microservice composition. It provides parsing specifications of models included in the composition, determining relations between them, and applying the microservice for processing VMBJs. Models and their instances are run in parallel in accordance with the previously determined relations.
In the GPSS model, user variables and matrices of stored cells present input parameters. The matrices store data arrays transferred through the computation DBs. Output parameters (observable variables) are implemented by stored cells. These outcomes are the objects of multi-criteria analysis. The intermediate results can be represented by both the stored cells and matrices of stored cells. They are transferred to the DBs.
2.5. Meteorological Data
Meteorological data play an important role in simulating environmentally friendly equipment of infrastructure objects. In such modeling, we use multi-year meteorological data with a one-hour discrete step considered in this process [
32]. Initial data are extracted from the open source “Reliable prognosis. Weather in the world” (available online:
https://rp5.ru/Weather_in_the_world, accessed on 10 September 2021). It then is automatically converted to hourly data in the formats FM 12 Synop and METAR (available online:
https://metaf2xml.sourceforge.io/#Data, accessed on 10 September 2021). At the same time, the automatic correction for erroneous measurements and elimination in time gaps in measurements of multi-year meteorological data sets are performed. Moreover, such datasets obtained take into account the correlation with each other.
Meteorological data used in this research include information about the following atmospheric parameters: direct, diffuse, and total solar radiation (
); air temperature (
); wind speed and direction (
); ozone layer thickness (
); characteristics of clouds of the low, middle, and high levels (
); coverage by clouds (
); pressure (
).
Table 2 shows the examples of the data with a one-hour discrete step. In
Table 2, the parameter
can be equal to the following values: 1 (calm); 2 (north wind); 3 (northwest wind); 4 (north-east wind); 5 (south wind); 6 (southwest wind); 7 (southeast wind); 8 (west wind); 9 (east wind). Values of the parameter
are interpreted as the follows: 1 (medium to powerful cumulus clouds with bases at the same level with other types of clouds); 2 (cumulonimbus filamentous clouds, possibly accompanied by other types of clouds); 3 (stratocumulus clouds formed from cumulus ones); 4 (cumulonimbus bald clouds, possibly accompanied by other types of clouds); 5 (ruptured stratus or cumulus clouds of the bad weather); 6 (cumulus flat and (or) cumulus ruptured clouds that are not related to the bad weather); 7 (cumulus and stratocumulus clouds with bases at different levels); 8 (the sky is not visible due to fog and/or other meteorological phenomena). Next, the parameter
can take the following values: 1 (altocumulus translucidus at one level); 2 (highly layered translucent clouds); 3 (altocumulus formed from cumulus ones); 4 (altocumulus translucidus or dense clouds at two or more levels); 5 (altocumulus translucidus clouds spread across the sky in stripes); 6 (altocumulus tower-shaped or flocculent clouds); 7 (shreds of altocumulus translucidus clouds at one or more levels with continually changing); 8 (the sky is not visible due to fog and/or other meteorological phenomena). Finally, there are the following values of the parameter.
: 1 (cirrus filamentous clouds); 2 (prevalence of cirrocumulus clouds); 3 (cirrus and cirrostratus clouds); 4 (cirrus dense or flocculent clouds); 5 (the sky is not visible due to fog and/or other meteorological phenomena).
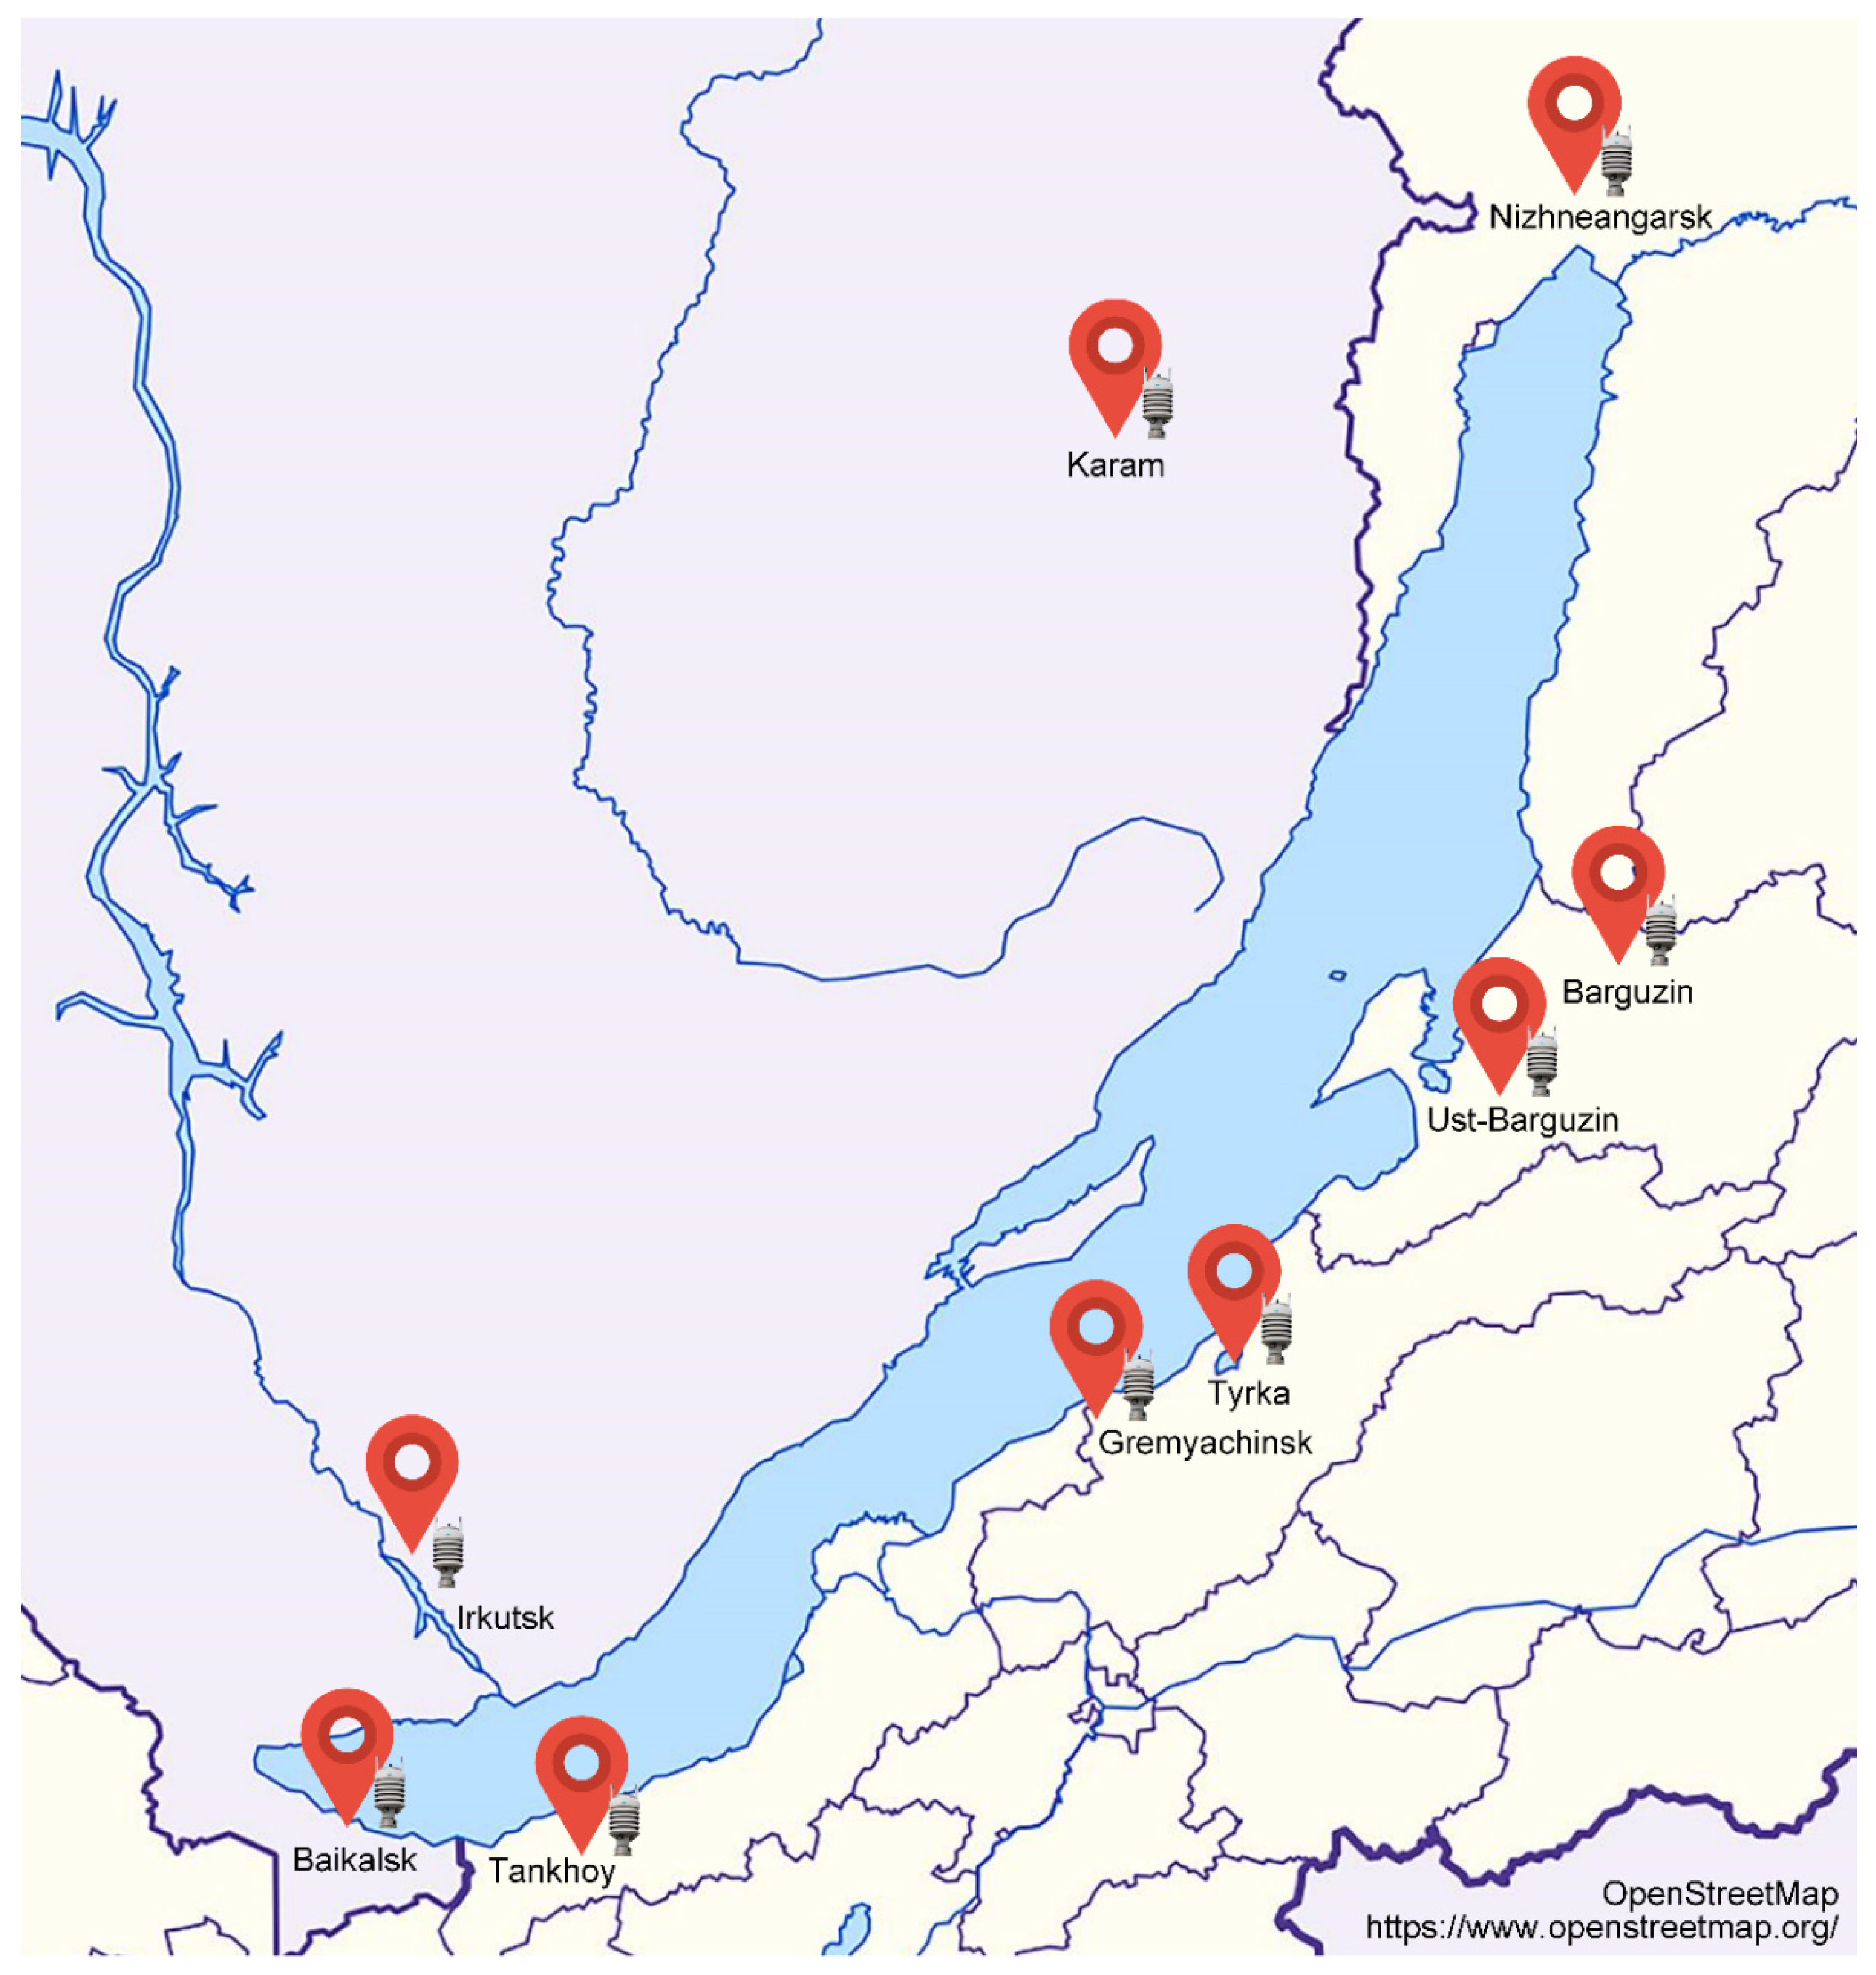
Within our study, we use thus prepared data for the last eight years obtained from nine different weather stations whose meteorological information is applied at the Baikal coast (
Figure 3).
Meteorological data are needed for the correct determination of the start and end dates of the heating period, heat and electricity consumption prediction, equipment operation simulation, etc. Thus, we apply them for the following main purposes:
Determination of models and laws for air temperature changes in specific locations of the studied objects;
Calculation of the possible heat loss of buildings included in the infrastructure of objects and required heat and power energy consumption;
Verification and validation of the processes for predicting the air temperature in models of object operations.
Within the simulating modeling, a near-real-time weather prediction is provided [
33]. It is necessary for quick decision-making based on stochastic weather characteristics and situational analysis [
34].
For example, in the housing and utilities sector of Russia, the heating period officially begins or ends on the day following the day of the end of the five-day period during which, respectively, the average daily outside temperature was below or above 8 °C. The heads of the administrative districts set the official dates for the heating period. The actual duration of the heating period in different locations in districts may differ from the official ones, depending on the weather conditions and the sequence of stages in preparing the beginning and end of the heating period.
Moreover, the owners of objects with an individual heating system can independently set the beginning and end of a heating period. This is important because the rational duration of the heating period can sometimes differ significantly from the official ones in practice.
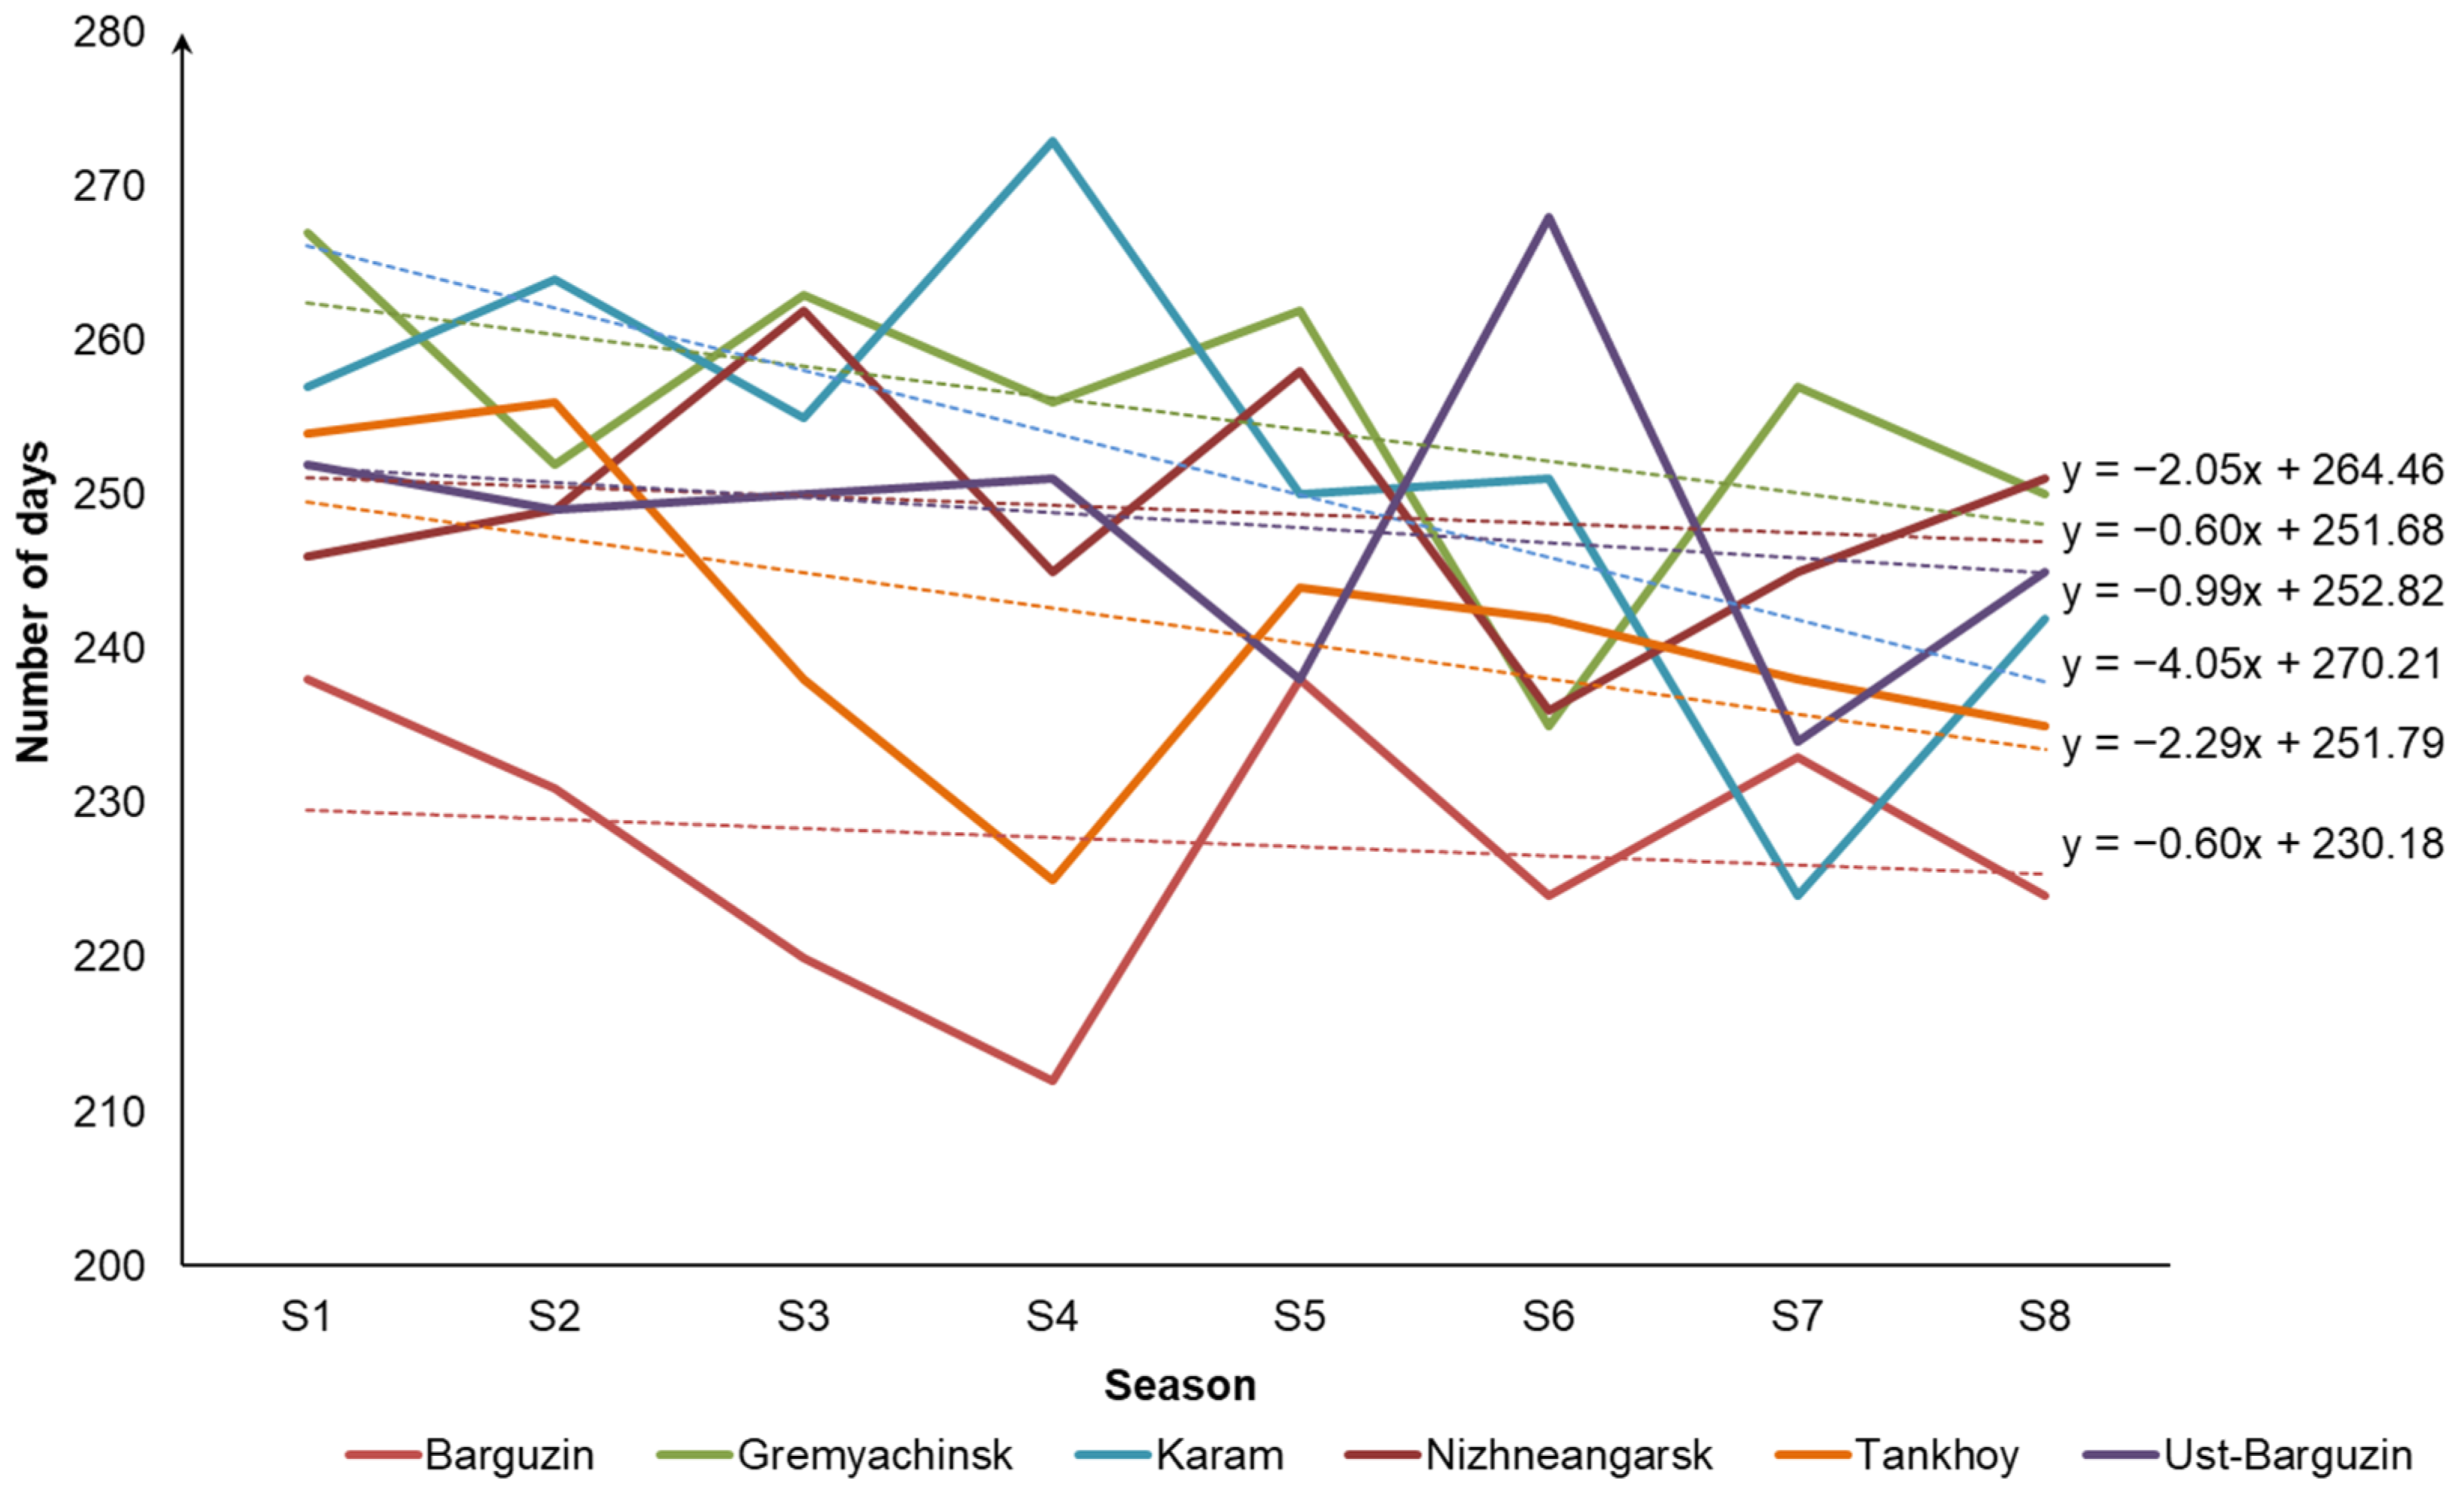
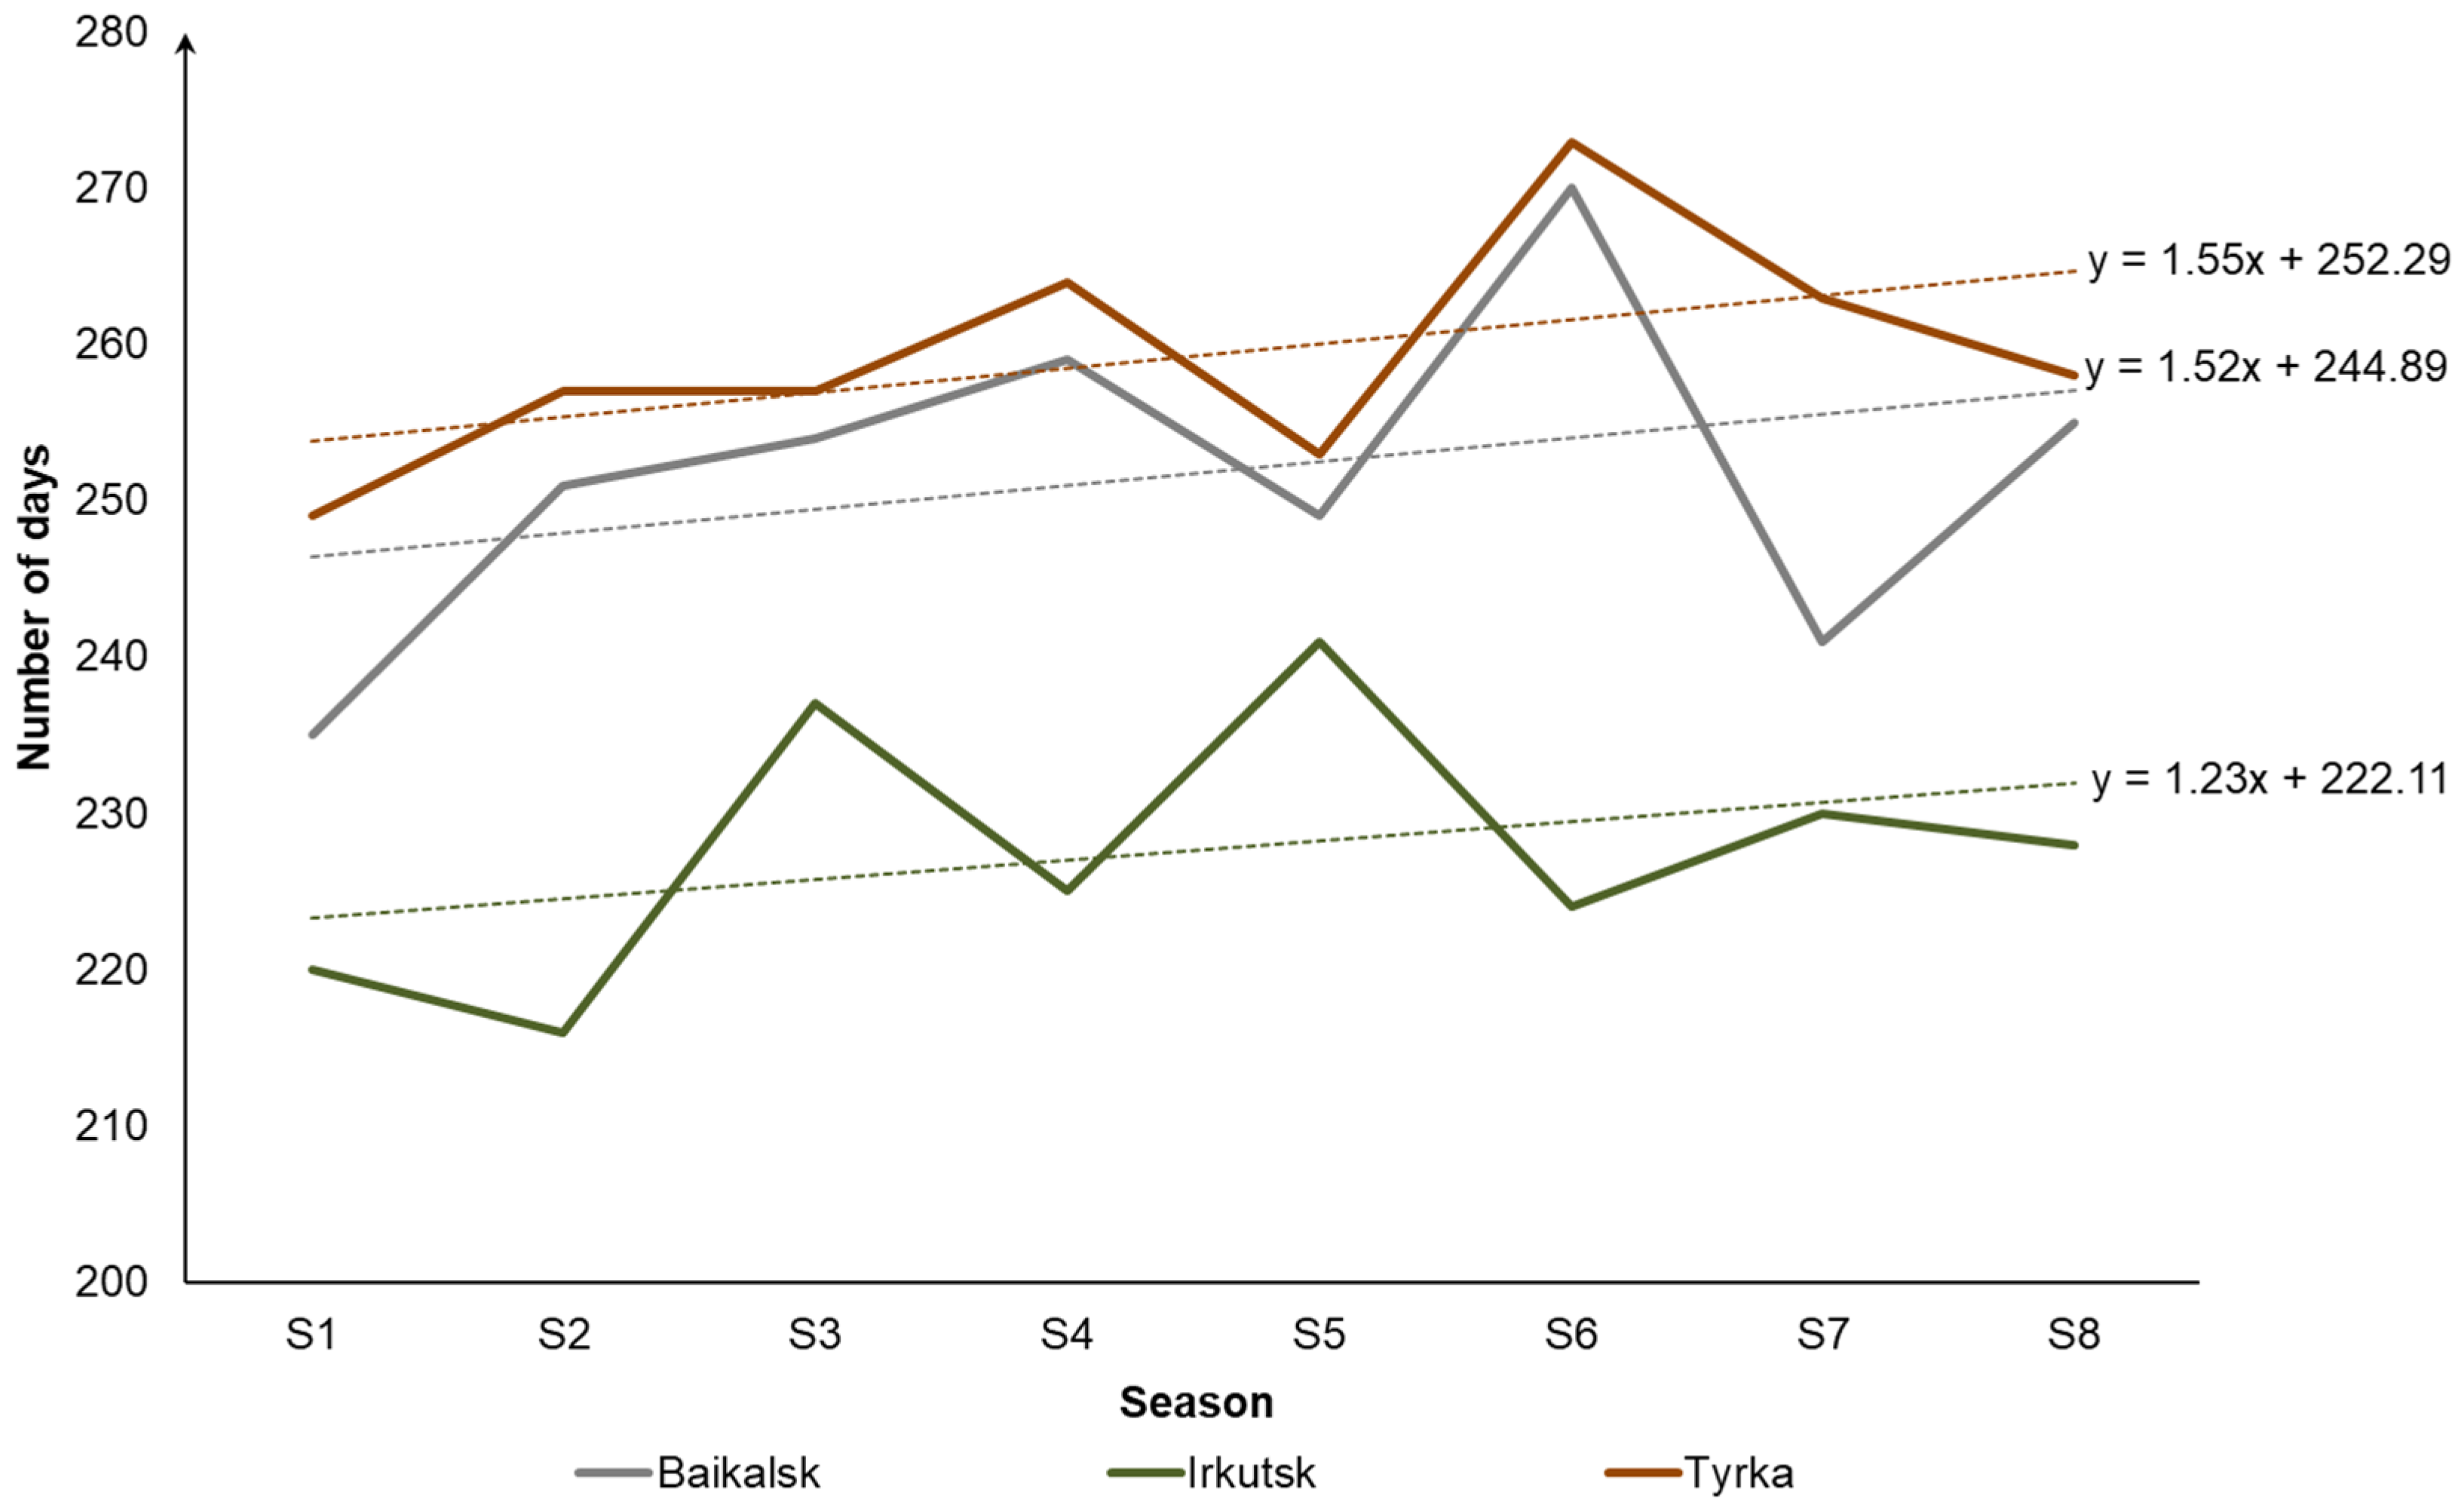
In particular, in many locations on the coast of Lake Baikal, there is a tendency toward a reduction in the heating period (
Figure 4). It is associated with global temperature increase [
35]. In
Figure 4, solid lines show changes in the heating period for 8 seasons from 2012–2013 until 2019–2020 (S1–S8). Dotted lines represent linear trends corresponding to them. The heating periods for different seasons are determined from the retrospective data based on the aforementioned definition of the heating period duration.
At the same time, in other locations, we can see linear trends differ from the above-considered ones (
Figure 5). This is owing to the topography, soil state, presence of vegetation, proximity of water bodies, and other natural and climatic conditions typical for these locations. In
Figure 5, the solid and dotted lines have the same meaning as the corresponding lines in
Figure 4.
In both cases, the observations presented in
Figure 4 and
Figure 5 clearly indicate the need to optimize district and domestic heating systems in considered locations taking into account the reduction or increase of the heating period, respectively. For example, selecting efficient equipment helps optimize the heating system.
3. Results
Practice shows that the usage of heat pumps makes it possible to transfer heat rather efficiently from a low-temperature source to a heat consumer. At the same time, power is used to ensure the operation of the heat pumps. Unlike the devices designed for directly transforming electricity into heat, heat pump equipment can significantly reduce the electricity consumption. In addition, the replacement of boilers burned fossil fuels with heat pump equipment allows reducing the fuel consumption and harmful emissions. As a result, it improves the quality of the environmental conditions.
In cold climates, the differences in outdoor air temperatures in some days of the winter period can be a very large range. Therefore, heat pumps are often used in combination with additional equipment (for example, back-up electric boilers). When heating provided by a pump is not enough, a boiler switches on automatically and balances it taking into account the required indoor and outside temperature.
As an example of applying the developed service-oriented tools, we consider a set of inherited microservices representing DT as a whole. They implement the methodology for evaluating the economic efficiency in environmentally friendly heat supplying a typical recreation tourist center [
36]. In summer, the center provides servicing until 60–90 tourists. In winter, the number of holidaymakers is reduced to 20–30 ones. The general pump functioning scheme is presented in [
37].
The microservice-based workflow for evaluating the economic efficiency in heat supplying was created using the above-considered constructor. This workflow is shown in
Figure 6. Three microservices
implement the operation processes of equipment and evaluation of efficiency in its functioning. Two microservices
and
inherit from the parent service for processing VMBJs. The third microservice inherits from the parent service for analyzing the simulation modeling results.
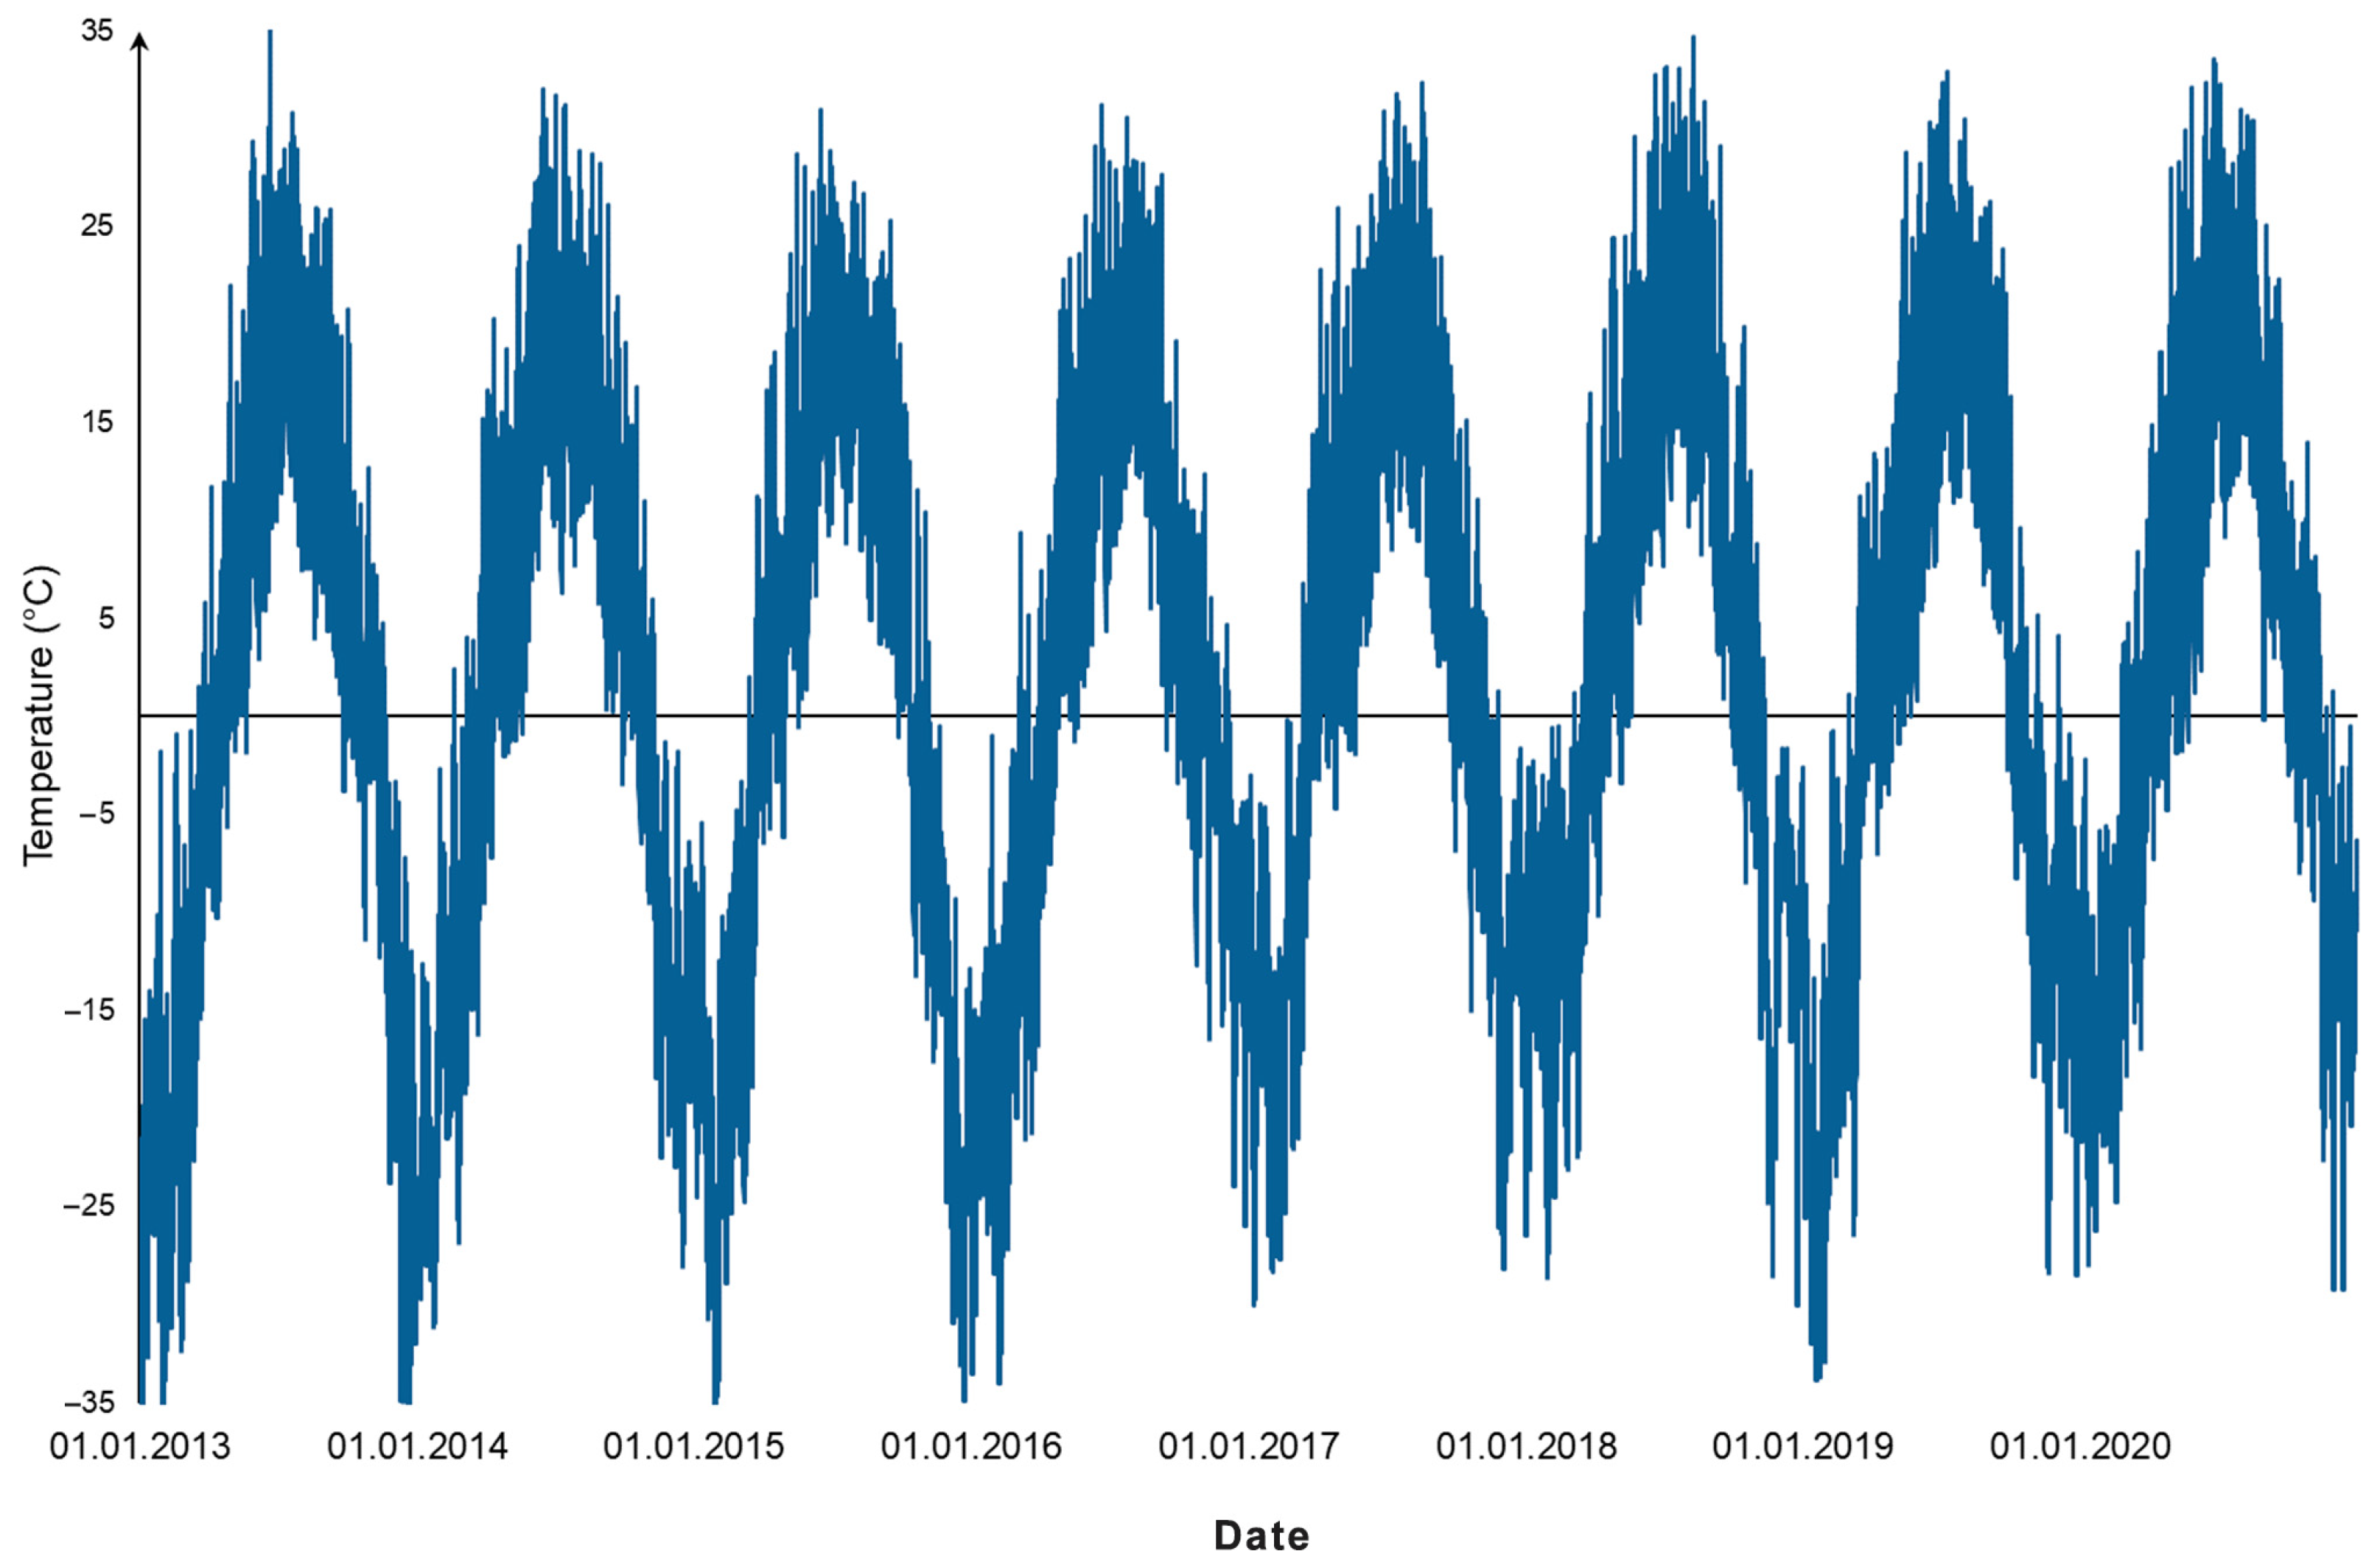
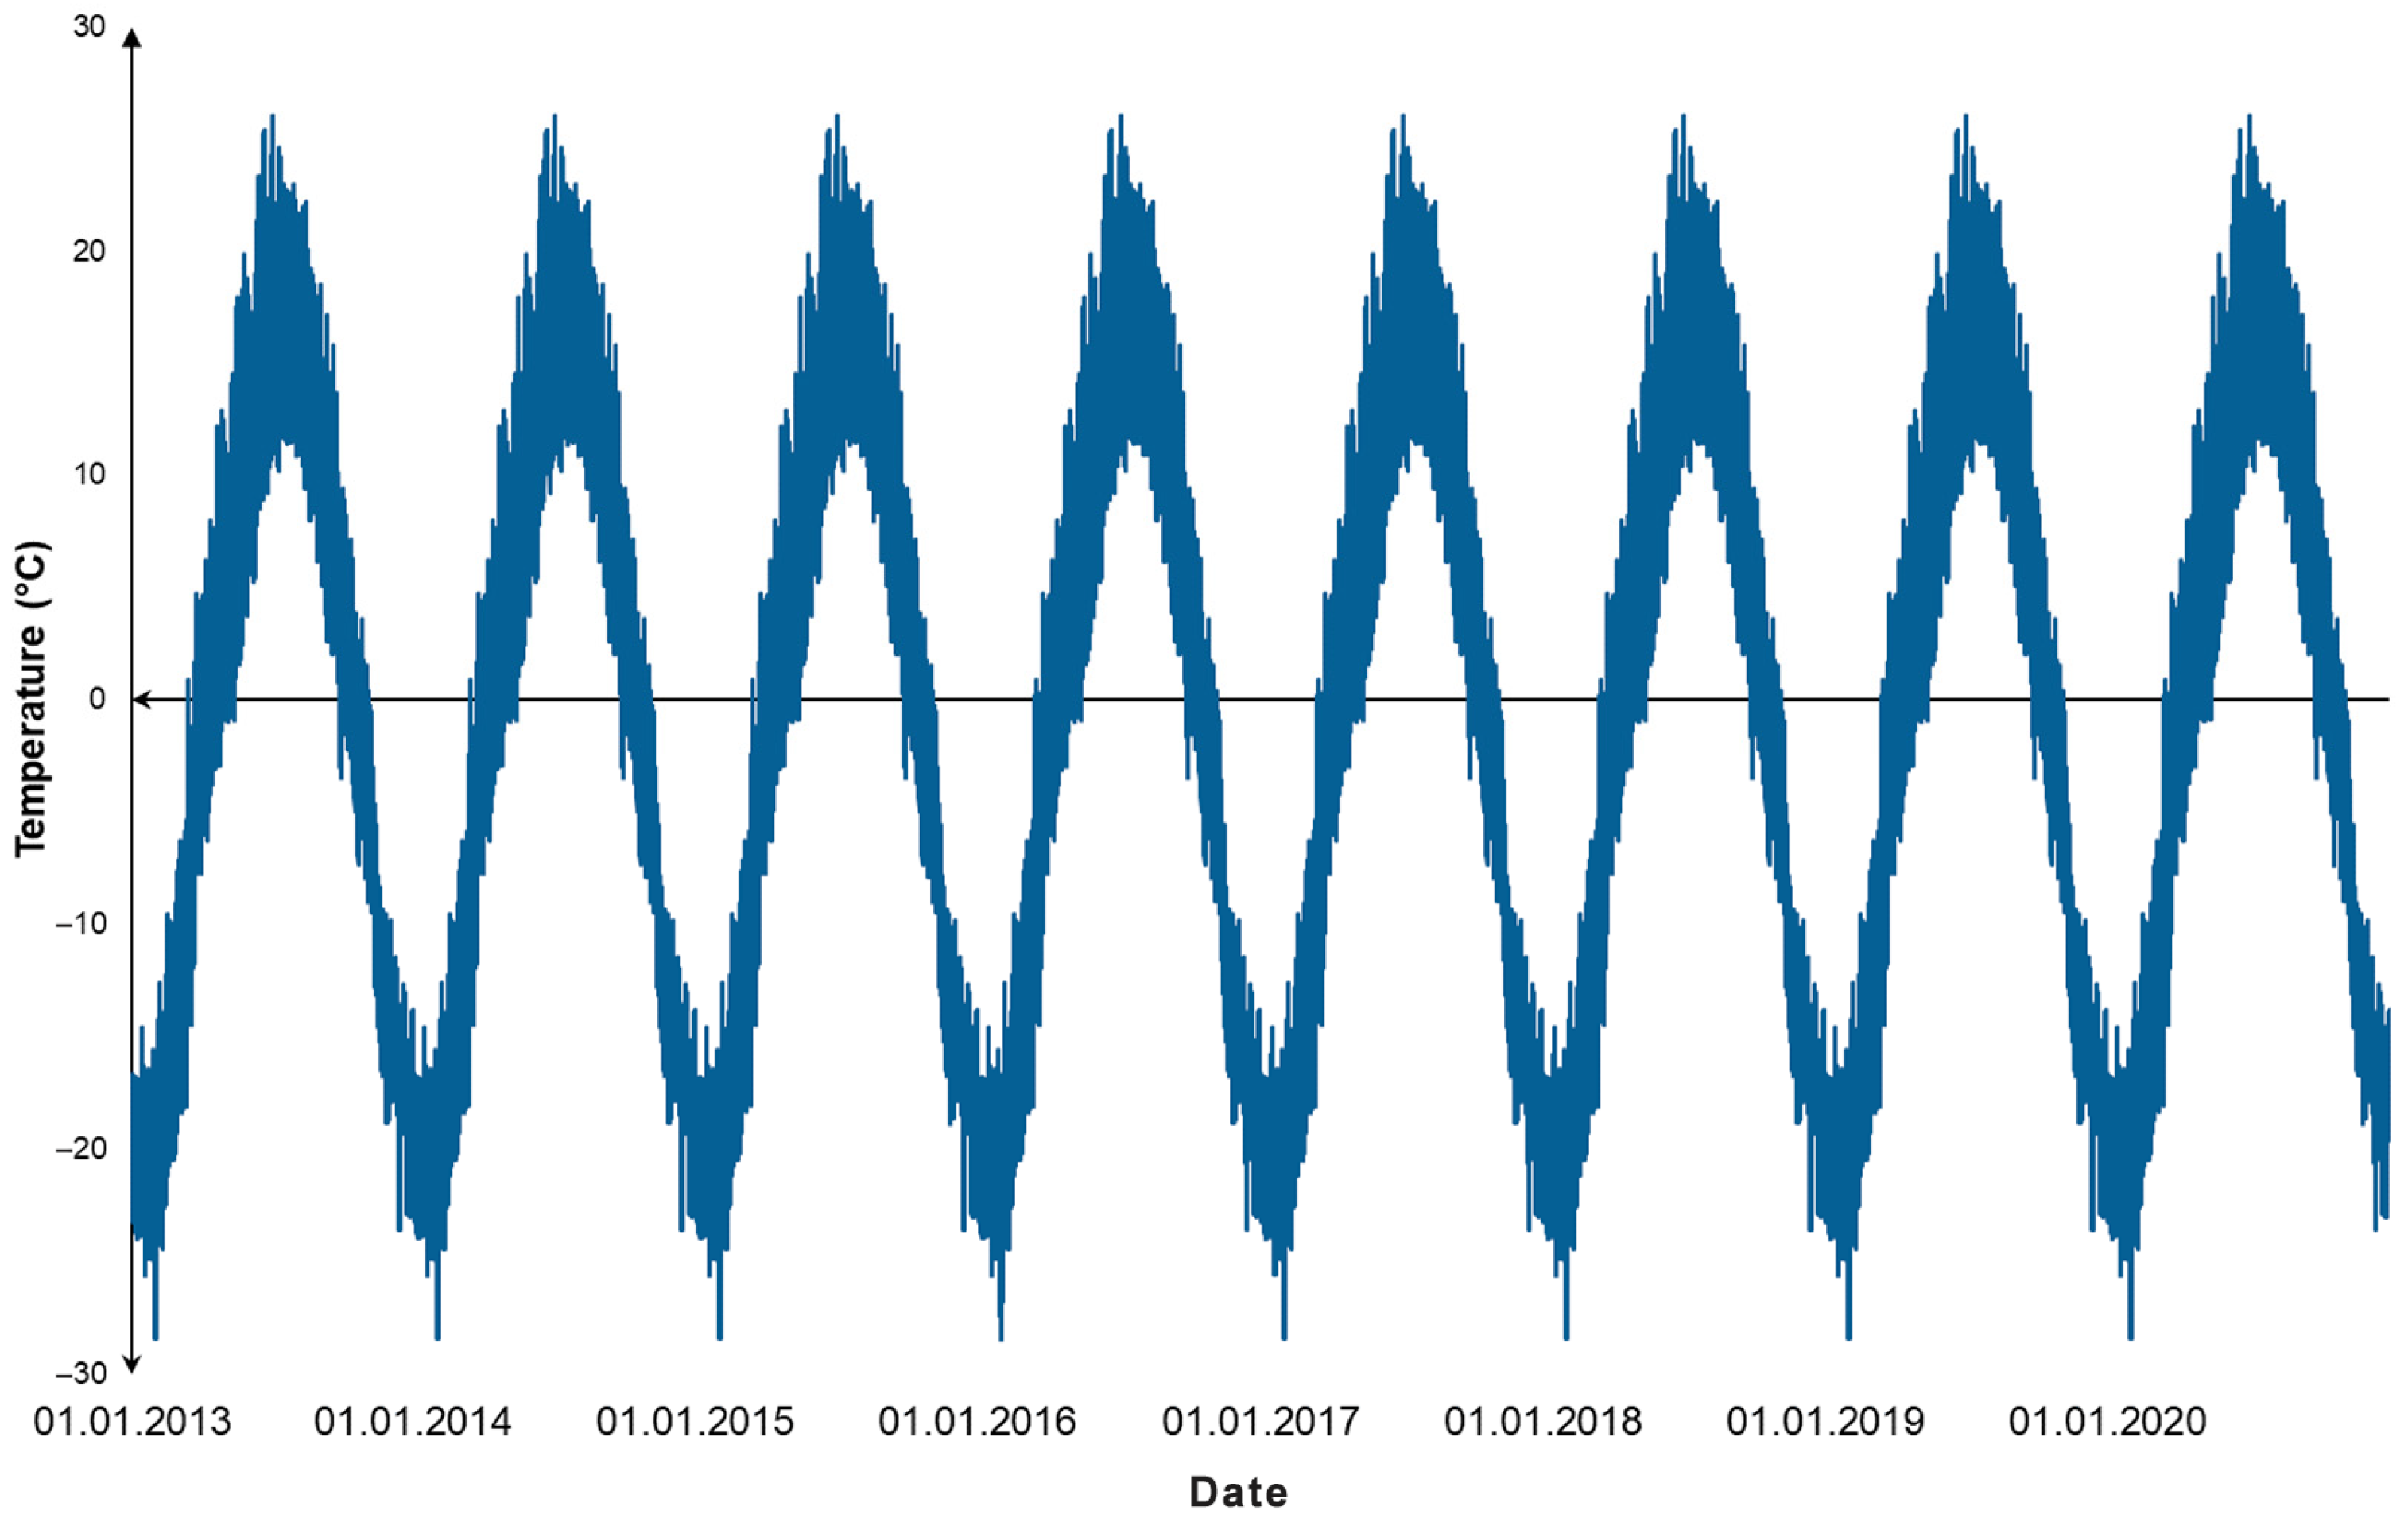
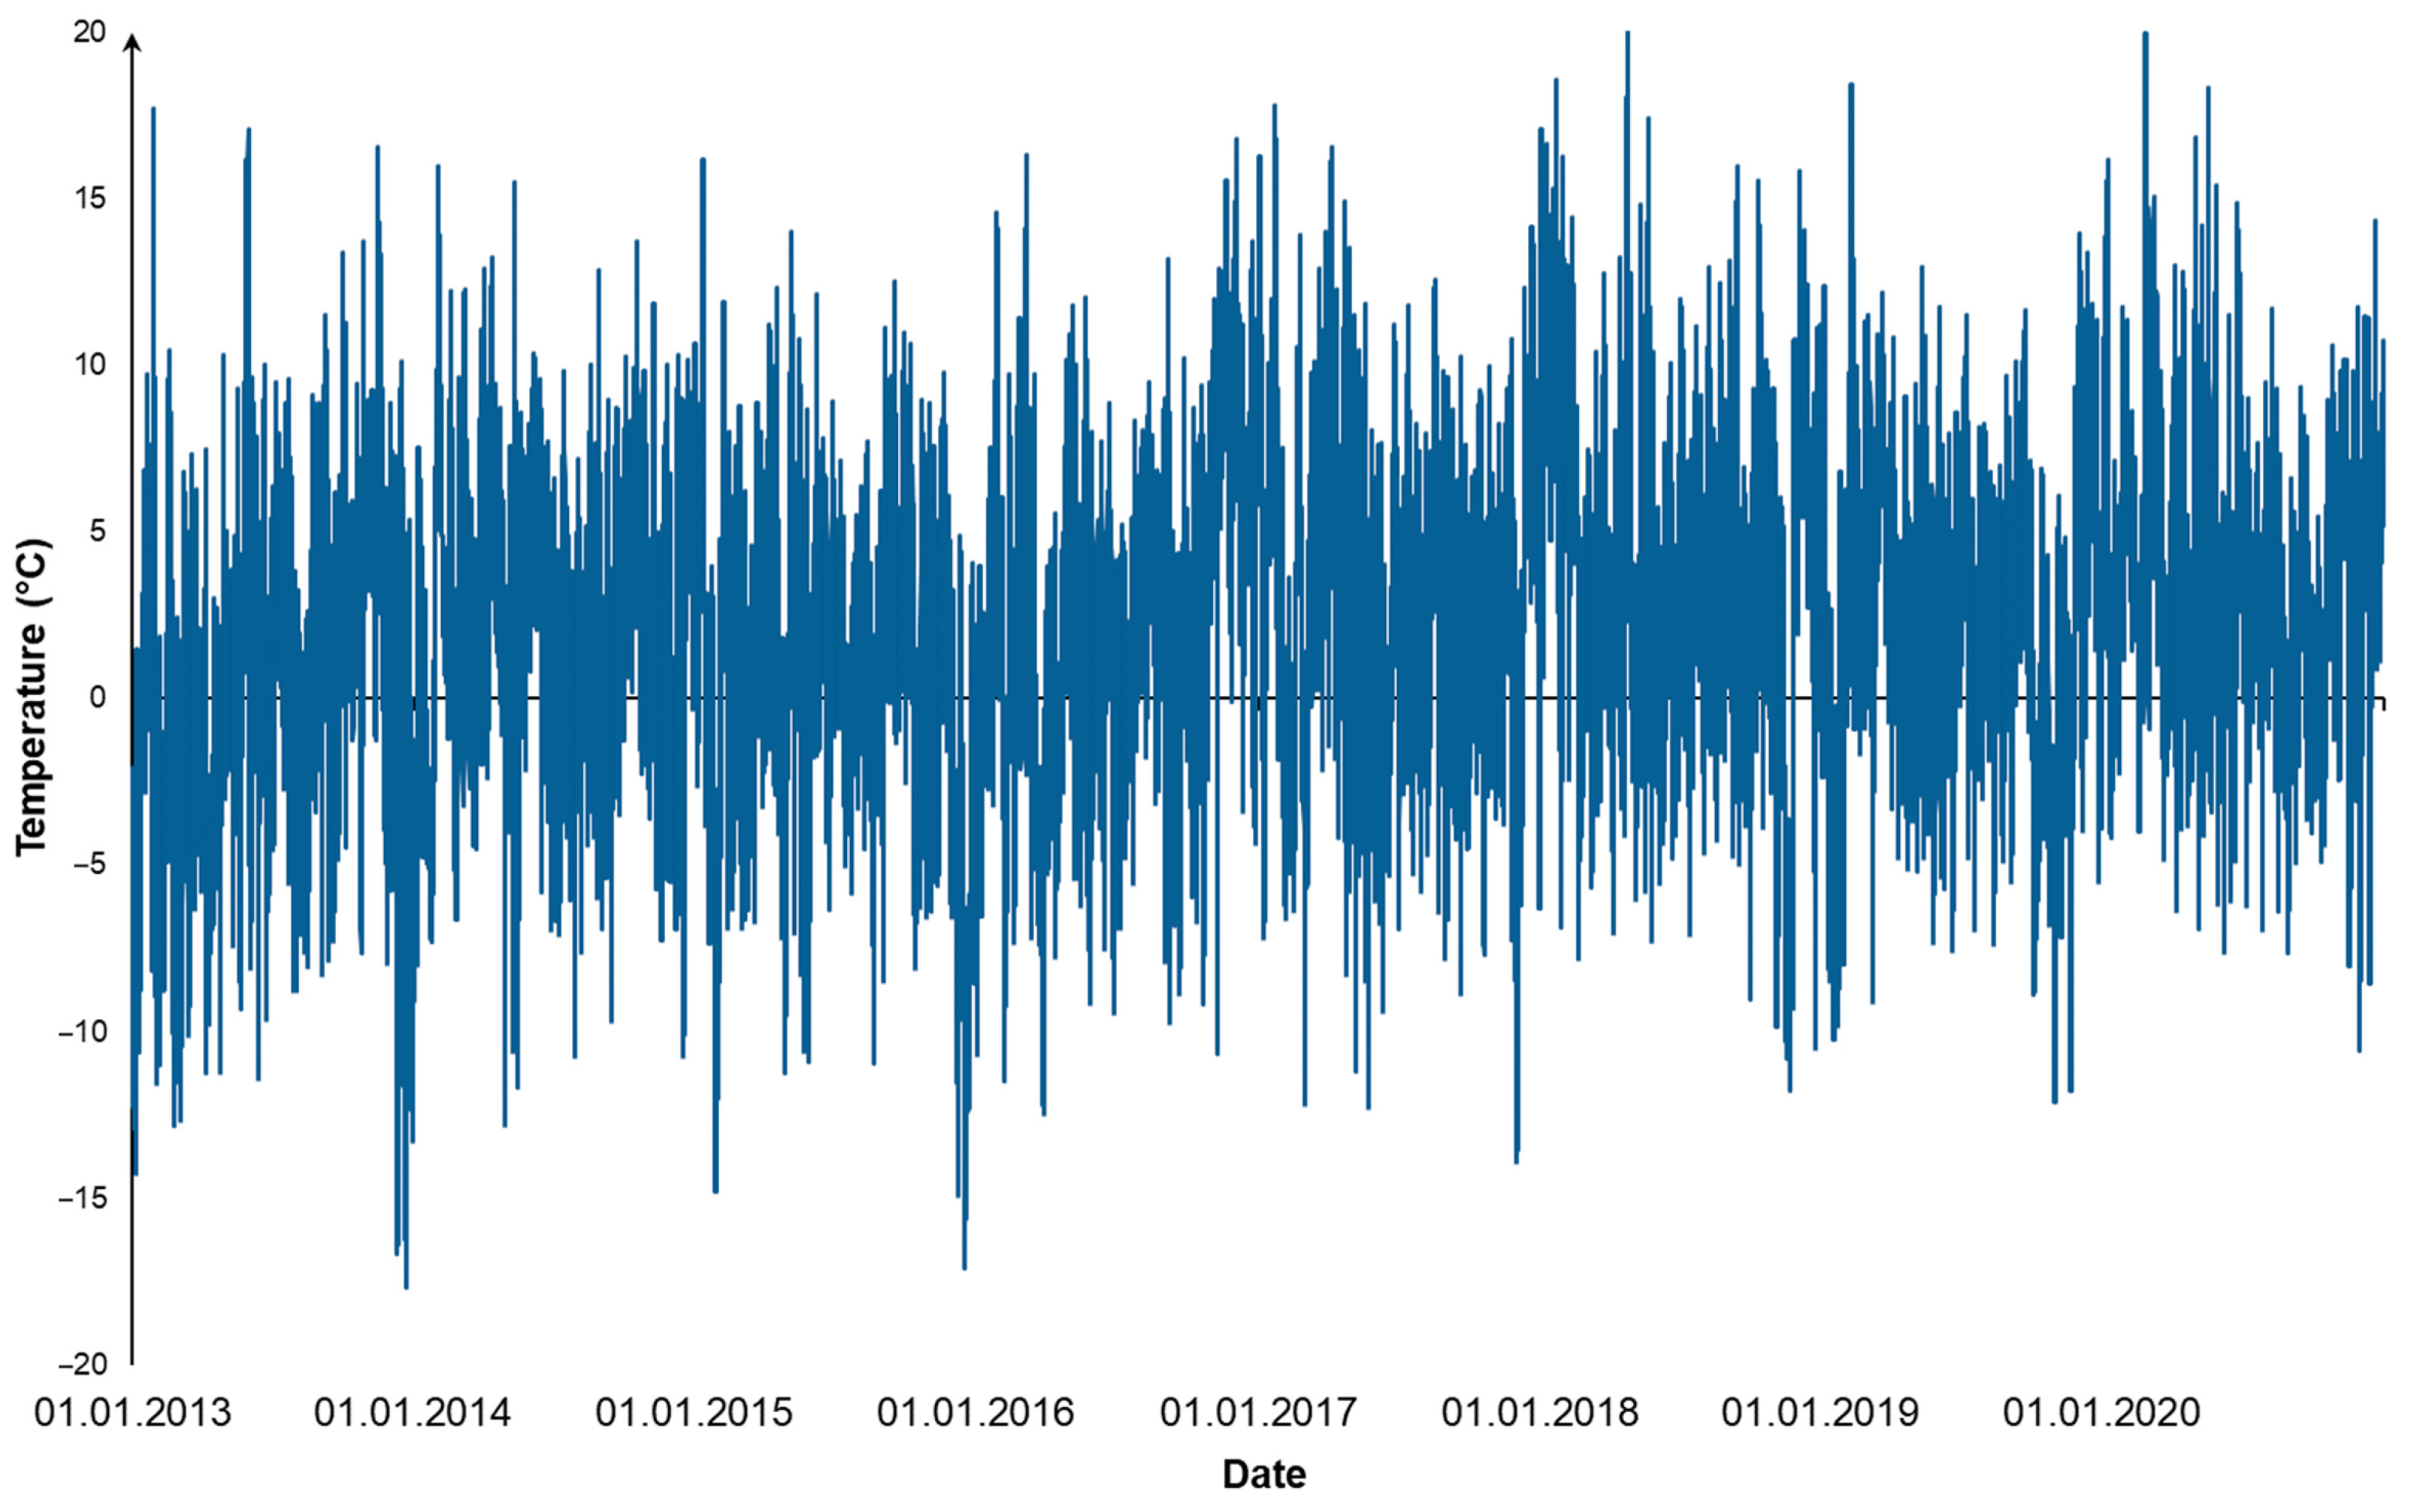
The first microservice provides the ability to carry out regular mass computations to identify and predict trends, regular fluctuations, and random deviations in the dynamics of changes in meteorological data (the parameter ). It determines the trend, seasonal, cyclical, and irregular components of the data time series and converting them into the target data format for the microservice (the parameter ). The parameter elements and correspond to the meteorological data and results of their analysis in th location, .
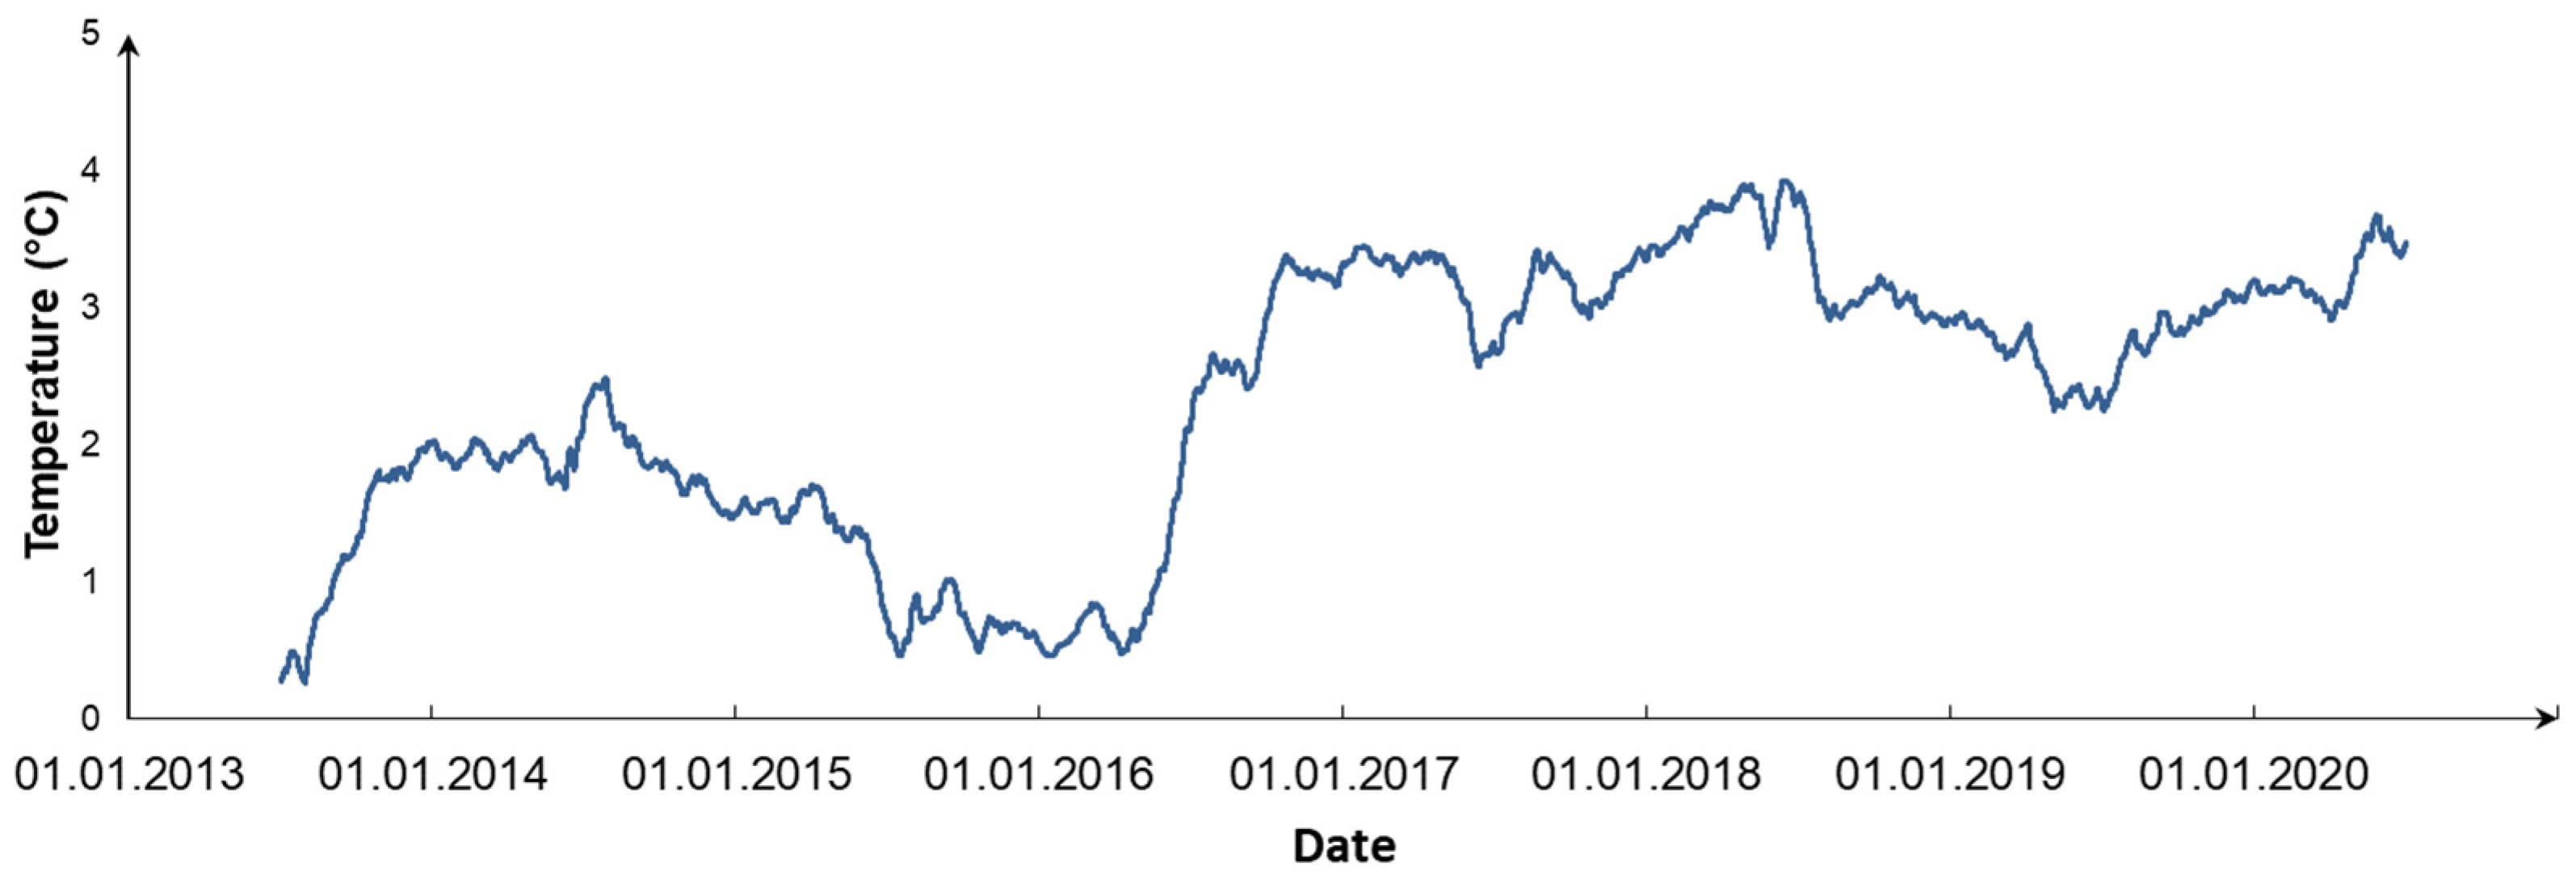
Figure 7 shows the initial time series of meteorological data collected by the weather station for the center of the coastal territory of Lake Baikal near Listvyanka village for the last eight years. The results in the decomposition of the time series into trend, seasonal, and random components for the additive form are shown in
Figure 8,
Figure 9 and
Figure 10, respectively.
In addition, this microservice determines the following equation for calculating hourly temperature changes:
where
is the error based on the random component and
is the hour number.
The second microservice implements a methodology for analyzing the efficiency of heat supply [
23]. We analyze the benefits of potentially replacing fossil fuel heat sources with more environmentally friendly heat pumps. The usage of small-scale coal-fired boilers is the most common for objects at the Baikal natural territory [
38]. Unfortunately, most of them are in extremely worn condition. Therefore, equipping them with equipment that reduces harmful emissions is not expedient. In this regard, consideration of the issue of replacing them with environmentally friendly heat sources is extremely relevant. The Baikal Museum of the Irkutsk Scientific Center of the Siberian Branch of the Russian Academy of Sciences in Listvyanka (available online:
http://bm.isc.irk.ru/, accessed on 10 September 2021) and Visit-center Baikal Reserved in Tankhoy (available online:
https://baikalecotourism.ru/baikalreserved, accessed on 10 September 2021) are examples of successful heating buildings using heat pumps.
The elements of the parameter are structures that include the swept model inputs for this microservice. At the same time, the structured parameter consists of non-swept initial data. The inputs , and are processed by the instance. Since each input is a set of parameters, a separate sub-instances is launched to perform combinations of their values. Each th instance returns as a set of standard GPSS reports generated on the base of all combinations of parameter values for the th location. To achieve the reliability of the modeling results (variants of the observed variables represented by the elements ), each sub-instance ran the model about 50,000 times with the corresponding variant of the inputs within the Monte Carlo method.
In the GPSS model used by the corresponding microservice, two scenarios are implemented to controlling and monitoring equipment: modeling these processes and interacting with agents placed on the real equipment. These agents distinguish between real and model equipment operations. Interaction with agents is carried out using their APIs. The deployment of software on equipment and technology of its monitoring, as well as issues of collecting, processing, and storing the current and retrospective data are given in [
30]. In the process of interaction, agents are guided by the determined restrictions and criteria of optimality for the functioning of heat pump equipment and building operation.
To simplify the illustrative example, we have fixed the values of a number of the swept parameters. Among them are the type of heat supply object, its properties, and the characteristics of the heat supply system. In particular, the comparison of heat pumps and the selection of the optimal pump sample is carried out for constructing an insulated building with administrative, office, and living quarters. The building has a heating system that is equipped with radiators of hot water as a coolant. The sources of heat are coal-fired boilers. It is planned to replace the heat source with a water source heat pump. The required temperature inside the building is 20 °C. The thermodynamic parameters of the coolant and the thermal energy supply are determined by the existing regulations and standards defined in the district of the object location.
There are many types of harmful emissions from fossil fuels [
39,
40]. It is worth noting that specialists in the field of ecology pay special attention to the carbon dioxide (CO
2) emissions from fuel combustion [
41]. Therefore, we focus on CO
2 emissions exclusively and use a methodology for their evaluation presented in [
42]. Thus, one of the practical goals of modeling the possible replacement of a heat source is to evaluate the reduction in CO
2 emissions from diesel or coal combustion. Another important factor is the cost of heat pump equipment.
Based on the typical scheme presented in [
36], the heat supply system consists of two independent circuits and a heat exchanger with a compressor between them. The heating system inside the building is a closed-loop. The coolant circulates from the water heater throughout the building and gives off heat, returning cooled. The water heater (electric boiler) is complemented by a heat exchanger with a compressor. The source of heat in the compressor is another coolant of the second closed-loop, which receives energy from the ground or natural reservoirs. The coolant in the second circuit is heated from a natural energy source. The heat exchanger cools it by an average of 2 °C, transferring the received energy through the heat exchanger to the primary circuit. The turnover of coolants in both circuits is independent.
An open second circuit, in which water from a natural reservoir is continuously circulated through the second circuit, can serve as a particular case of an energy source. In this case, water is taken at a certain depth, where a consistently low temperature of about 4 °C is ensured. The chilled water is discharged back into the reservoir. The use of natural reservoirs makes it possible to avoid drilling and reduce the cost of introducing heat pumps. At the same time, additional work is needed to avoid problems associated with freezing, corrosion, and pollution of the heating network. When using groundwater and geothermal energy sources, drilling is indispensable. In this case, it is necessary to locate the piping system underground, sufficient to heat the water and the temperature enough to exploit the heat pump. Therefore, we are considering two options for introducing a heat pump: with and without drilling.
We have selected two heat pump samples from each of the three considered Russian manufacturers. The pump samples meet the heating needs for typical tourist recreation centers for 80–130 persons. For comparison, we took centers for 60 and 80 people.
Table 3 shows the main characteristics of the compared heat pump samples: sample, its information source, heating capacity, power input, coefficient of performance (COP) that reflects the transformation of electrical energy into heat one, and price.
Thus,
is a set of the following swept parameters: heat pump sample (
), the need for drilling (
), and center service capacity (
). As mentioned above, the part of the swept parameters is fixed. The reduction in the CO
2 emission (
) and capital investments (
) are the observable variables (criteria). Optimal conditions for each criterion are shown in brackets.
Table 4 demonstrates the modeling results for one object at the considered location. Obviously, an increase in the number of the swept parameters and the number of their values leads to an exponential growth in the number of variants.
The third microservice implements one of the methods for the discrete multi-criteria selection: Lexicographic, Majority, and Pareto-optimal [
43]. The Lexicographic method for solving multi-criteria problems consists of sequential ap-plying criteria sorted by their importance to compared values. Selecting a solution containing the largest number of criteria with the best values is implemented out within the majority method. Finally, for the Pareto-optimal set, we select variants, for each of which the following conditions are satisfied:
There is no other variant in which the values of all criteria are greater than or equal to the criteria values of the variant included in the set;
At the same time, values of at least one criterion in compared variants are not equal.
The implementation feature of the aforementioned methods is by calculating and comparing the proximity estimates for the values of the criteria to their optimality conditions instead of analyzing the values themselves. If there are many solutions, we compare each of such a variant with the ideal one that includes the best evaluations of the criteria. To calculate the distance between the compared variants and the ideal one, we use the Euclidean metric.
The microservice automatically extracts, aggregates, and processes the required information from the GPSS reports. If it is necessary to find a single solution, the Euclidean metric is applied with respect to the ideal variant of the observed variables. The parameter
determines the required method and aforementioned optimality conditions of criteria. The optimal variants of the observed model variables and the corresponding inputs based on
are represented by the elements
of the parameter
.
Table 5 shows the outcomes of multi-criteria selection using three different methods.
Let us apply the ordering of
and
given in
Table 4. Then the result of the lexicographic selection method is the Corsa 70 pump. This result applies to all center service capacities (see the variants, no. 22 for
and no. 10 for
and
). The selected pump provides the maximum reduction of harmful emissions into the atmosphere. At the same time, the Corsa 55 pump becomes the best option when the criteria are given in reverse order. This option is the most attractive from an economic point of view. Using the majority method, we select Corsa 55 for 60 or 80 persons (see the variants, no. 9 and no. 21) and Corsa 70 for 60–80 ones (see the variant, no. 10). The latter capacity option is more versatile. For example, it is interesting when the center is expected to expand in the future. In all three cases of the center service capacity, the MOTEN-18D 70 pump is the Pareto-optimal selection (see the variants, no. 24 for
and no. 12 for
and
). Modeling the use of the considered pump samples in other locations with different meteorological conditions showed similar results. This is because the COP value played the most important role in the multi-criteria selection.
5. Discussion
Baikal territory is the unique natural zone characterized by rapidly changing meteorological conditions [
47]. Moreover, they can differ to varying degrees in different locations. Such changes are very important to take into account when operating infrastructure objects. This is especially critical for environmentally friendly equipment. In this regard, it is a good idea to apply simulation modeling within DT.
One of the causes for the wide using meteorological data in simulation models for studying the objects and their components is the relative availability of the required data [
48]. This is true for both the current and retrospective data. Often, an analysis of retrospective meteorological data aims to provide weather prediction in the DT models. However, the meteorological service quality depends on the number of available weather stations and the completeness of the observed data.
Therefore, the implementation of such an analysis requires the development of special tools for collecting, saving, processing, numerical modeling, and transferring data that allows us to adjust it to specific locations. In each case under study, this is a challenge since it is necessary to take into account the contextual conditions for functioning the object under study, for example, the start and end of the heating period.
In this regard, the development, setup, and configuration of both applied software that implements mathematical models and system software for supporting the data processing in distributed environments are obviously required [
24]. At the same time, an important component is providing service-oriented access to software for carrying out experiments.
However, there are no ready-made solutions for each specific case in this field. That is why our research focuses on designing a new approach to simulating heating with pumps. The authors hope that this work will contribute to the extremely complex and very important topic with respect to modeling environmentally friendly equipment of the objects at the Baikal natural territory taking into account the meteorological data. The obtained results can be used as recommendations for specialists in operating equipment.
We developed our tools using the practice experience in studying the heat equipment operation in the Baikal Museum where two heat pumps NT-60 and NT-70 are used [
30]. These pumps are the main source for heating the museum. They use the deep waters of Lake Baikal. As a result of our study, the proposed simulation models and the collected data on the pump operations have been used to analyze the current state of the pumps and develop recommendations for its improvement. In addition, an analysis of energy consumption using renewable energy sources and taking into account the heating system was carried out for the two infrastructure objects. These objects are tourist recreation center at the Zavorotnaya Bay coast and children’s camp at the Mandarkhan Bay coast in the Olkhonsky district of the Irkutsk Region) [
49]. The modeling results of our study have shown that, in certain locations, renewable sources can provide more than 80% of the energy demand for each object.
Nowadays, ensuring a harmonious and rational balance between socio-economic development and environmental conservation objectives within the Baikal natural territory actualizes applying the results of such studies to the design, construction, and modernization of infrastructure objects. Our approach provides an integrated use of traditional models and methods of analytical modeling with simulation modeling of various scenarios for the object operations. In addition, it allows for an intelligent analysis of climatic, environmental, technological, and operational data obtained during the operation of simulated and real objects with environmentally friendly equipment in different locations of the considered territory.


