1. Introduction
Precipitation is essential for society and the ecosystem, and it is part of the water cycle linking evaporation, moisture transport, clouds, and precipitation. This cycle is also intimately linked with energy exchanges among the atmosphere, ocean, and land through evaporation cooling and the latent heat release from condensation, driving the mean circulation, determining the Earth’s climate, and causing much of the natural climate variability [
1]. The total energy transport from ocean to land is almost entirely made up of the moisture transport [
2,
3,
4], and the above link puts fundamental constraints on the climatology and evolution of the global hydrological cycle, and hence the precipitation change [
2,
5,
6,
7] not only on the global but also the regional scales. It is of utmost importance to understand changes in the components of the water cycle, in order to have a further understanding of the climate change impacts on precipitation [
8,
9]. Both theory and observations have confirmed the increase in water vapor (or moisture) content in the atmosphere with the rise in global mean surface temperature [
10,
11,
12,
13], and the wet area is becoming wetter and the dry area is becoming drier [
1,
5,
14,
15,
16]. These are connected to the changes in water vapor transport from one place to another, particularly from ocean to land [
17], as the ocean contains 97% of the Earth’s water [
18] and is the main source providing water vapor for land precipitation. Water vapor transport may contribute to 60% of the land precipitation [
17,
19].
Many investigations on the change in the hydrological cycle have been conducted using model simulations [
20,
21,
22,
23], as general circulation models (GCMs) are the only tools capable of isolating the responses of the hydrological cycle components to climate change. A detailed study of the physical processes in the hydrological cycle can lead to improved rainfall forecasts, particularly the extremes, and to providing physical evidence for future projections of climate change [
2,
9,
24]. Models generally show more intense hydrological cycles compared to reanalyses and observations due to excess surface shortwave radiation, which is a common bias in GCMs. As the resolution increases, precipitation decreases over the ocean and increases over the land, associated with an increase in atmospheric moisture transport from ocean to land, and the results start to converge at a 60 km resolution [
1]. Observations have been used to verify model simulations, in order to test the robustness of the hydrological cycle representations in models and understand the uncertainty in projections [
7]. However, due to the change in the observing system, coverage limitation, uncertainty in the calibration of instruments, and the precision of the measurements, it is difficult to ensure a closure of the water budget both globally and regionally from observations, because ocean evaporation differences from various datasets are still large in both means and trends [
25,
26].
The atmospheric reanalysis assimilates a large amount of observational data to a weather forecast model to provide global gridded representations of atmospheric states. The relations between variables are physically constrained and they are expected to produce, in principle, optimal consistent datasets. Using earlier atmospheric reanalyses and observations, Trenberth and Fasullo [
2] found that the ocean to land moisture transport varies dramatically between different datasets and showed an upward trend in moisture transport. The observed that climatological moisture transport is about 0.7 mm day
−1 using river discharge data from Dai et al. [
27]. Mayer et al. [
4] found that this observed moisture transport has a better agreement with that derived from the latest ERA5 than from the earlier reanalysis of ERA-Interim. They also found that the global ocean to land moisture transports in the ERA5 data agree well with the continental freshwater flux and the terms of the moisture budget in ERA5 are temporally more stable than those from ERA-Interim.
Similar studies have also been applied to various regions. Using ERAI and JRA55 (Japanese 55-year reanalysis) reanalyses, Xu et al. [
28] found that the Tibetan Plateau (TP) is a water vapor convergence area, where the convergence was enhanced from 1979 to 2018. The water vapor contribution to the TP from the mid-latitude westerlies (west side of TP) increases, while the transport from the Indian Ocean (south side of TP) decreases. Using the precipitation from the GPCP (Global Precipitation Climatology Project) and the water vapor convergence from the earlier ECMWF reanalysis (ERA-40), Arraut and Satyamurty [
29] studied the December–March climatological pattern of precipitation in the Southern Hemisphere, and they used the vertically integrated water vapor transport to detect the important pathways of moisture to high-rainfall regions and, in some cases, to infer the source regions of the moisture. Yang et al. [
30] studied quantitatively the water vapor transport over the arid and semi-arid Central Asia and examined the spatiotemporal variation in precipitation in Central Asia from 1979 to 2017 based on the GPCP precipitation and circulation reanalysis data from ERA-Interim. They confirmed that the precipitation and water vapor transport in Central Asia are closely related to the seasonal adjustment of the general circulation system.
Some recent studies have used the Lagrangian model to quantify the moisture transport and the origin of the moisture leading to regional continental precipitation extremes [
31,
32,
33,
34], in order to better understand the underlying mechanisms for such extreme precipitation events. They found that both terrestrial and oceanic moisture transports played important roles in driving precipitation extremes over the continental regions. These insights into moisture sources and pathways could potentially improve the accuracy of predictions of regional precipitation extremes [
32] and benefit natural resource managers in the region.
In this study, changes in moisture transport over seven continents, including Eurasia, Africa, North America, South America, Antarctic, Australia, and Greenland, are revisited using the ERA5 dataset with high spatial and temporal resolutions. The evaporation (
E), precipitation (
P), vertically integrated moisture convergence (VIMC), and moisture transport are used to study the moisture transport contribution to the continental precipitation. The moisture transport across the continental boundaries are investigated and the inflow sections are identified. This paper is arranged as follows. The data and methods are described in
Section 2, the moisture transport integrated along the continental boundaries is shown in
Section 3, and the discussion and conclusions are shown in
Section 4.
2. Data and Methods
The precipitation, evaporation, vertically integrated eastward and northward moisture fluxes, and the moisture convergence from ERA5 atmospheric reanalysis are used in this study. The selected period is from 1988 to 2020 (33 years), because the satellite observations assimilated into ERA5 over this period are microwave products that are more reliable than the earlier product based on the infrared retrieval [
15]. The anomaly is calculated relative to the period from 2001 to 2013.
There are seven continents under investigation and they are Eurasia, Africa, North America, South America, Antarctic, Australia, and Greenland. Unless stated otherwise, the trend of the anomaly time series is tested by the two-sided Wald Test with the t-distribution at a significance level of 0.1, and the significance of the correlation coefficient is tested using the two-tailed test and Pearson critical values at the 0.01 significance level.
Based on the method deployed by [
4,
35,
36], the moisture budget in the atmospheric column can be written as
where
g is the gravitational acceleration,
ps is the surface pressure,
q is the specific humidity,
is the horizontal wind vector,
p is the pressure, and
E and
P are the evaporation and precipitation, respectively, and are in units of kg m
−2 s
−1. Both upward
E and downward
P are defined as positive. This equation shows that the increase in the moisture in the atmospheric column (
, also called moisture tendency) is balanced by the vertically integrated moisture convergence (
, denoted as VIMC hereafter), surface evaporation, and precipitation.
The moisture transport can be expressed as
According to [
4], the moisture transport is mainly contributed by the advection term
, and the wind divergence term
only has a small contribution; therefore, the mass imbalance resulting from the assimilation of three-dimensional winds and surface pressure
ps has negligible influence on the moisture transport in ERA5, and the moisture transport in ERA5 is reliable and can be used directly in this study.
The variability in the main climate modes, such as the NAO (North Atlantic Oscillation), ENSO (El Niño–Southern Oscillation), and IOD (Indian Ocean Dipole), are also employed to investigate their impacts on the moisture transport. The NAO index is based on the sea level pressure difference between the Subtropical (Azores) High and the Subpolar Low. The positive phase of the NAO reflects the below normal height and pressure across the high latitudes of the North Atlantic and the above normal height and pressure over the central North Atlantic, the eastern United States, and western Europe. The negative phase reflects an opposite pattern of height and pressure anomalies over these regions. The ENSO index is represented by the ONI (Ocean Niño index), which is the three-month running mean of the area-mean SST (sea surface temperature) anomalies in the Niño 3.4 region (5° N–5° S, 120°–170° W). The IOD is represented by an anomalous SST gradient between the western equatorial Indian Ocean (50°–70° E, 10° S–10° N) and the southeastern equatorial Indian Ocean (90°–110° E, 10° S–0°). This gradient is named as the DMI (Dipole Mode Index). When the DMI is positive, the phenomenon is referred to as the positive IOD and when it is negative, it is referred to as the negative IOD.
3. Moisture Transport to the Continents
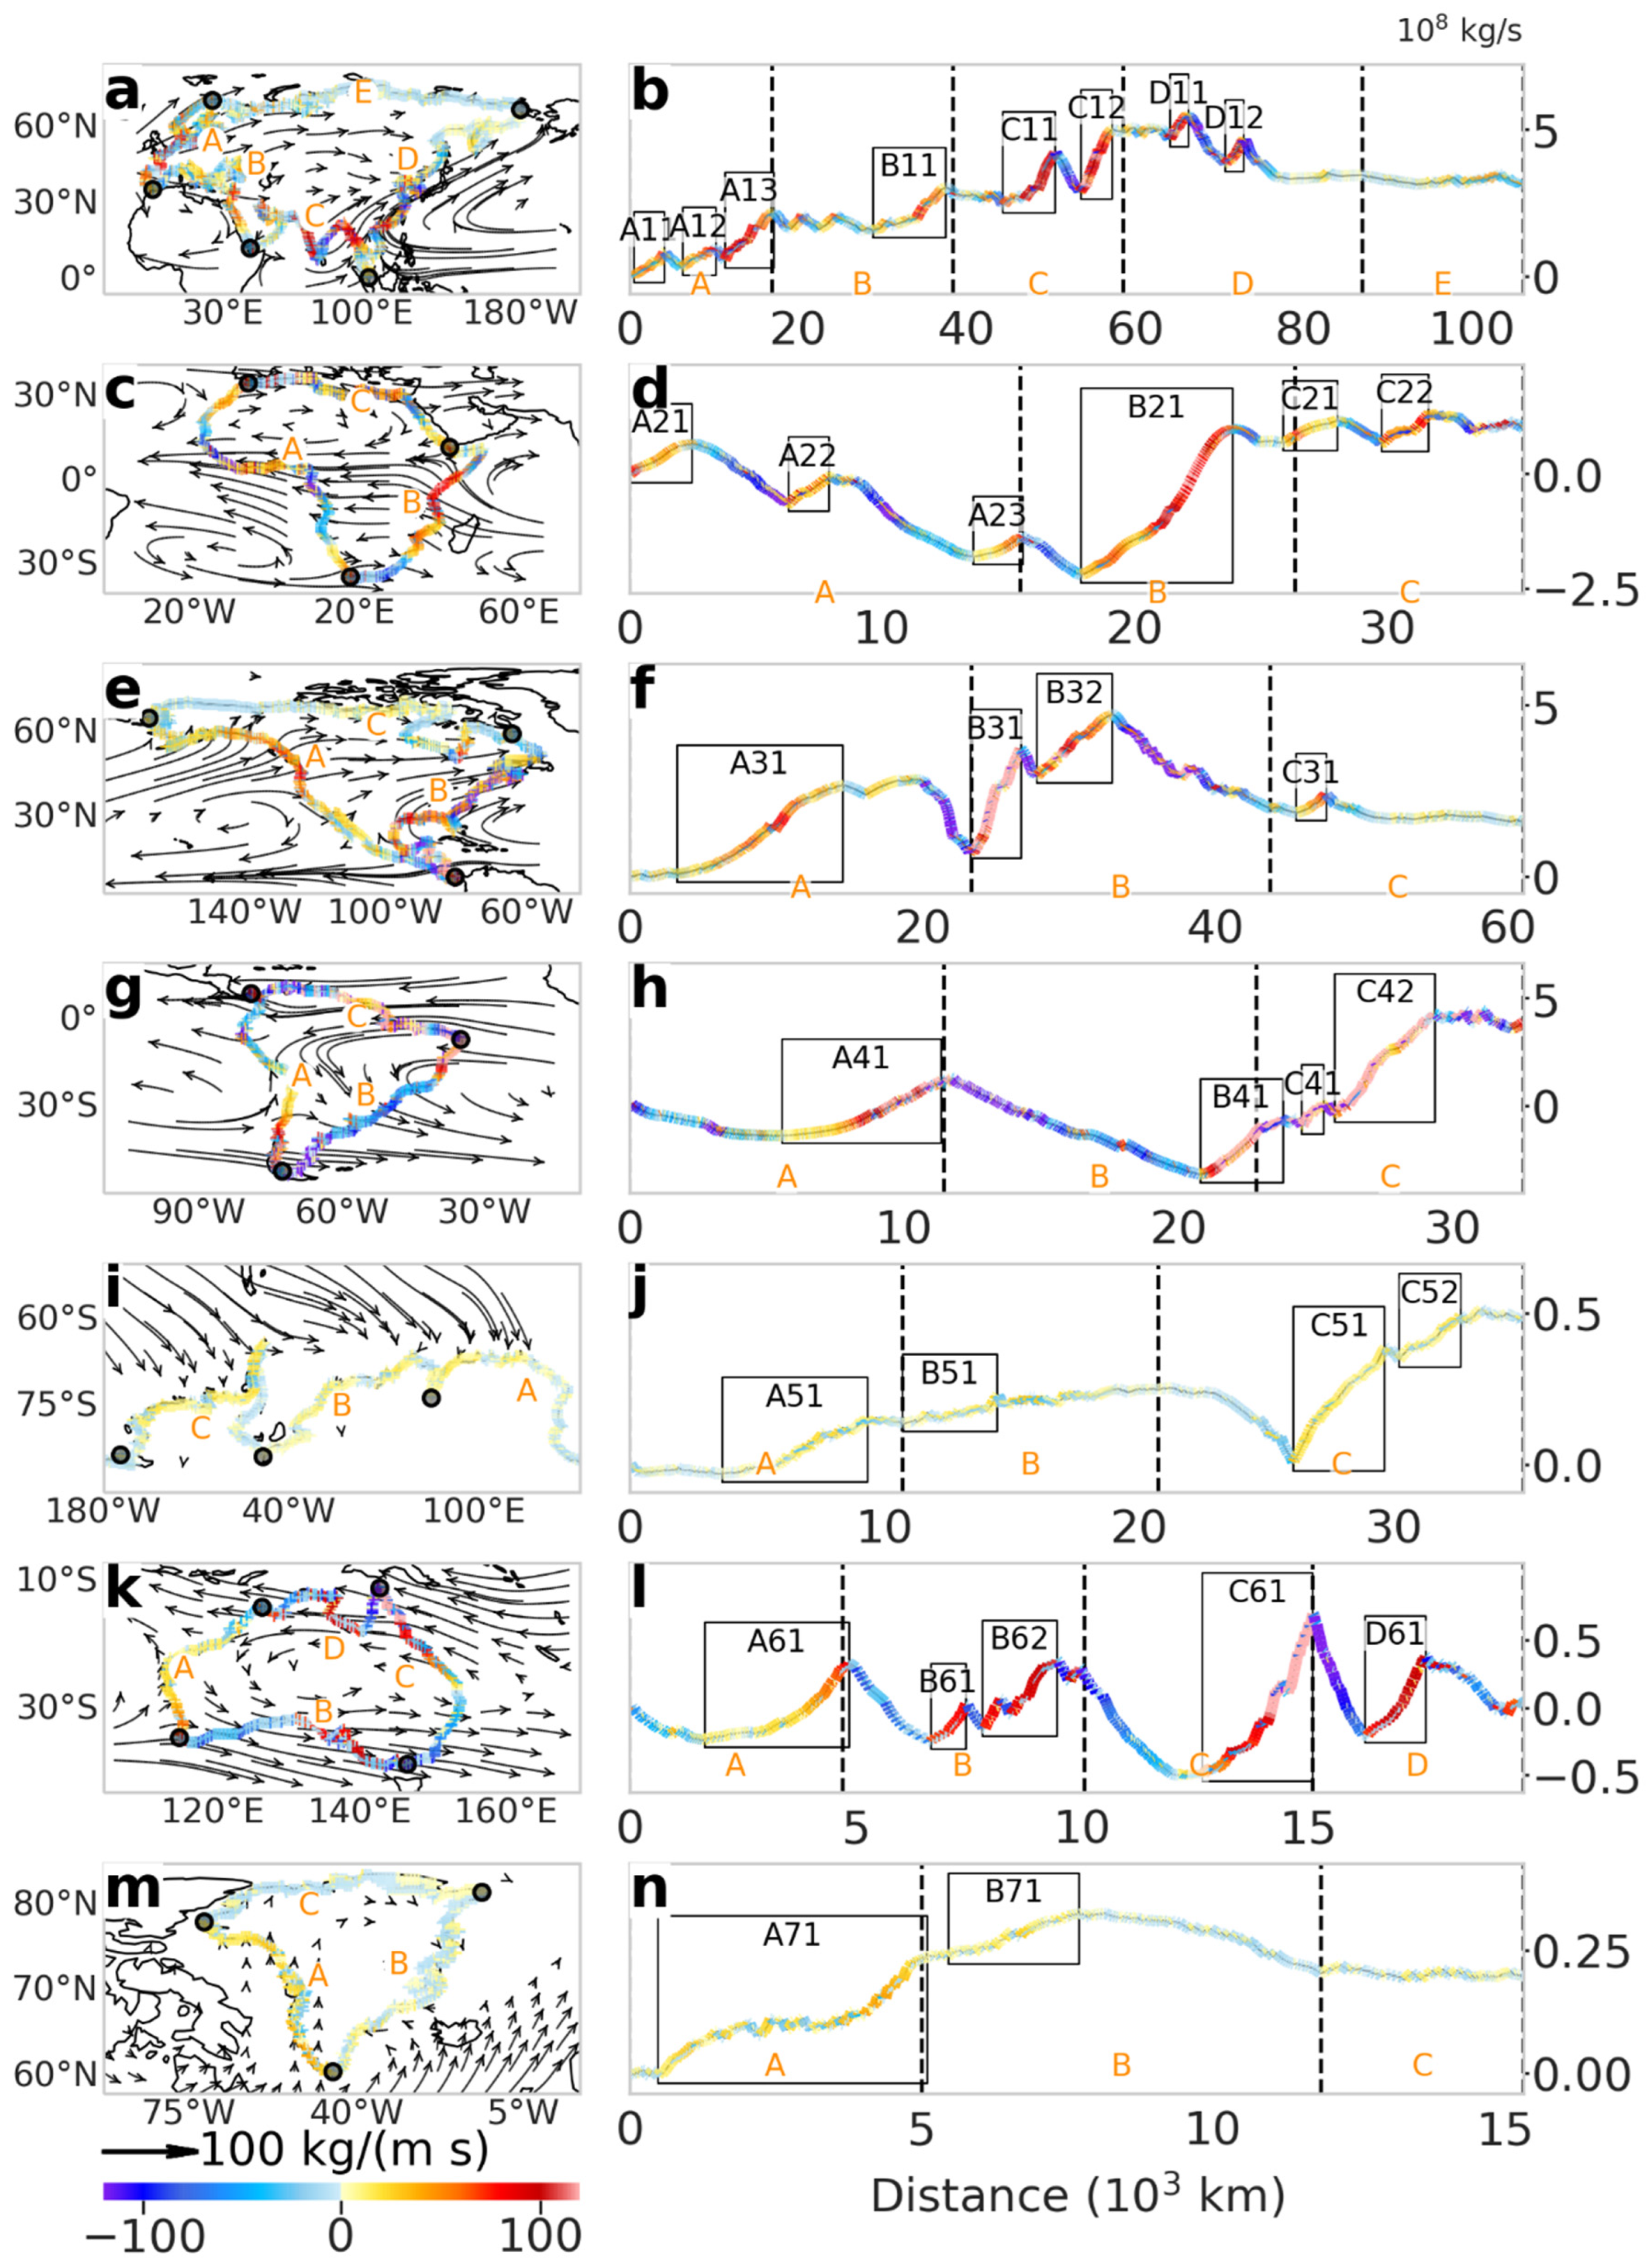
First, the moisture transports through the continent boundaries are investigated, and the column-integrated fluxes along the boundary and their trends are investigated for seven continental areas. The moisture transport through the boundaries of each continent is plotted in
Figure 1. The left column of
Figure 1 is the multiannual means (1988–2020) showing the moisture flux magnitude and transport direction (arrow), and the color along the boundary indicates the flux density in kg m
−1 s
−1. The warm color indicates the inflow of moisture to the area and the cold color indicates the outflow of moisture. The boundary is divided into several sections mainly based on the boundary orientation, and sections are marked by capital letters and separated by black circles. The moisture transport is then integrated along the boundary anticlockwise from the starting point of section A, as shown in the second column, together with the color representing the slope (in kg m
−1 s
−1) of the curve. A positive slope means the inflow of moisture to the region and a negative slope means the outflow, which share the same meaning and scale as the first column. Some rising sections are marked in the right column of
Figure 1 and their seasonal climatology and interannual time series are further investigated in
Figure 2.
For the Eurasian continent (
Figure 1a), the average moisture inflows along sections A, B, and C are 221.02 × 10
6, 67.42 × 10
6, and 203.23 × 10
6 kg s
−1, and the moisture outflows from sections D and E are −144.58 × 10
6 and −34.32 × 10
6 kg s
−1, respectively. The intense moisture inflow is mainly from the Atlantic in section A, the west coast of the Mediterranean Sea, and the Red Sea in section B. The most intense inflow in section C is from the Somali jet traveling through the Arabian Sea and reaching the west coast of India (section C11), contributing to the Indian monsoon [
6] and east Asia monsoon, and the integrated moisture inflow along this section is about 202.23 × 10
6 kg s
−1. However, after precipitating over India, the remaining moisture flows out from the east coast and crosses the Bay of Bengal to reach the south coast of Asia. The moisture inflow along the Bay of Bengal (section C12) contributes the most and the quantity is about 200 × 10
6 kg s
−1. It is also noticed there are two intense inflow sections in boundary D; one is along the coast of the South China Sea (section D11) and another one is along the west coast of the Korean Peninsula (section D12). The integrated inflows along sections D11 and D12 are 85.76 × 10
6 and 76.58 × 10
6 kg s
−1, respectively. The net moisture transport to the Eurasian continent is about 311.78 × 10
6 kg s
−1.
Along the African continent boundary (
Figure 1c), the average moisture inflow is 217.07 × 10
6 in section B and 20.15 × 10
6 kg s
−1 in section C. It is worth noting that the water vapor inflow in section C has a significant increase trend (5.89 × 10
6 kg s
−1 decade
−1), and the moisture outflow along section A is −131.65 × 10
6 kg s
−1 and also has a significant trend of 8.54 × 10
6 kg s
−1 decade
−1. The net moisture transport to the African continent is about 105.57 × 10
6 kg s
−1.
The general feature of the moisture flow along the Africa boundary is the inflow from the east coast and the outflow from the west coast of Africa, and the contribution from the north boundary is small (
Figure 1d). The southeast coast is very distinct and the major moisture sources are from the tropical and subtropical Western Indian Ocean (0–30° S) mainly in the summer. The dense moisture inflow from the east coast is partly associated with the cutoff lows [
8] and the tropical storms/cyclones around Mozambique, Madagascar, and Mauritius [
7]. The outstanding feature is the continued accumulation of moisture from the east coast (section B21 in
Figure 1d) and the amount is about 300 × 10
6 kg s
−1. It is related to both the ARs (Atmospheric River) and LLJs (low-level jets). The increasing part of section A22 is also related to the AR [
37]. The precipitation seasonal variability in Africa is dominated by the ITCZ (Intertropical Convergence Zone) movement and monsoons. The tropical precipitation associated with the ITCZ is not as strong as those over other longitudes, partly due to its long traveling path of ITCZ [
9]. However, the ITCZ has complicated location and changes, which needs to be further investigated. The mean flow in
Figure 1c cannot reflect the west African monsoon well, as the moisture inflow from the south boundary of west Africa is mainly from the southwesterly of the west African monsoon, which cannot be seen from the mean flow. This is further studied in
Figure 2.
Over the North America continent, the average moisture inflow is 81.84 × 10
6 kg s
−1 along the west coast (section A in
Figure 1e) and 114.77 × 10
6 kg s
−1 along the east coast (section B in
Figure 1e), and the moisture outflow along the north coast (section C) is −35.41 × 10
6 kg s
−1. The net moisture inflow to North America is 161.20 × 10
6 kg s
−1, and the increase trend of 12.98 × 10
6 kg s
−1 decade
−1 is statistically significant. The moisture flux along the cost of South America has very distinct features. There are outflows along the northwest coast and inflows along the southwest coast, but there is a net inflow of 105.74 × 10
6 kg s
−1 along section A (
Figure 1g). There are continuous outflows along most parts of section B (
Figure 1g,h) and the net outflow is −230.47 × 10
6 kg s
−1. In section C, most parts have inflows and the net inflow is 504.37 × 10
6 kg s
−1. The net inflow to South America is 379.64 × 10
6 kg s
−1. The South America coastal jet (SACJ) dominates the inflow and outflow over the southern part of the South America continent [
38].
For the Australian continent (
Figure 1k), the easterly crosses the northern area, so there is a rapid increase in moisture inflow from sections C61 and D61. The westerly crosses the southern part of Australia, causing the outflow along the first half of section A and the inflows in sections A61, B61, and B62. There are net inflows of 37.49 × 10
6 kg s
−1 and 36.19 × 10
6 kg s
−1 along the west and east coasts, respectively. The outflows are −6.20 × 10
6 kg s
−1 and −69.01 × 10
6 kg s
−1 along the south and north coasts, respectively, and there is a small net outflow of −1.54 × 10
6 kg s
−1 to the Australian continent. It is noticed that as this net flow is small, it is sensitive to the integration method along the boundary and time period selected. There is an insignificant positive trend in the outflow, implying that the moisture budget is toward to balance over Australia.
For Antarctic, the northwesterly wind blows moisture to the cold continent, causing moisture inflows along most parts of the coast, except that around the Ross Sea where the coastline is inside the bay. There is a net moisture inflow of 47.40 × 10
6 kg s
−1 to the Antarctic. Similarly, the southwesterly wind blows the moisture to Greenland, leading to the moisture inflow along section A and first half of section B, and an outflow along section C and the second half of section B. There is also a net inflow of 19.69 × 10
6 kg s
−1 to Greenland. All mean moisture transports and trends from different sections of each continent are listed in
Table 1.
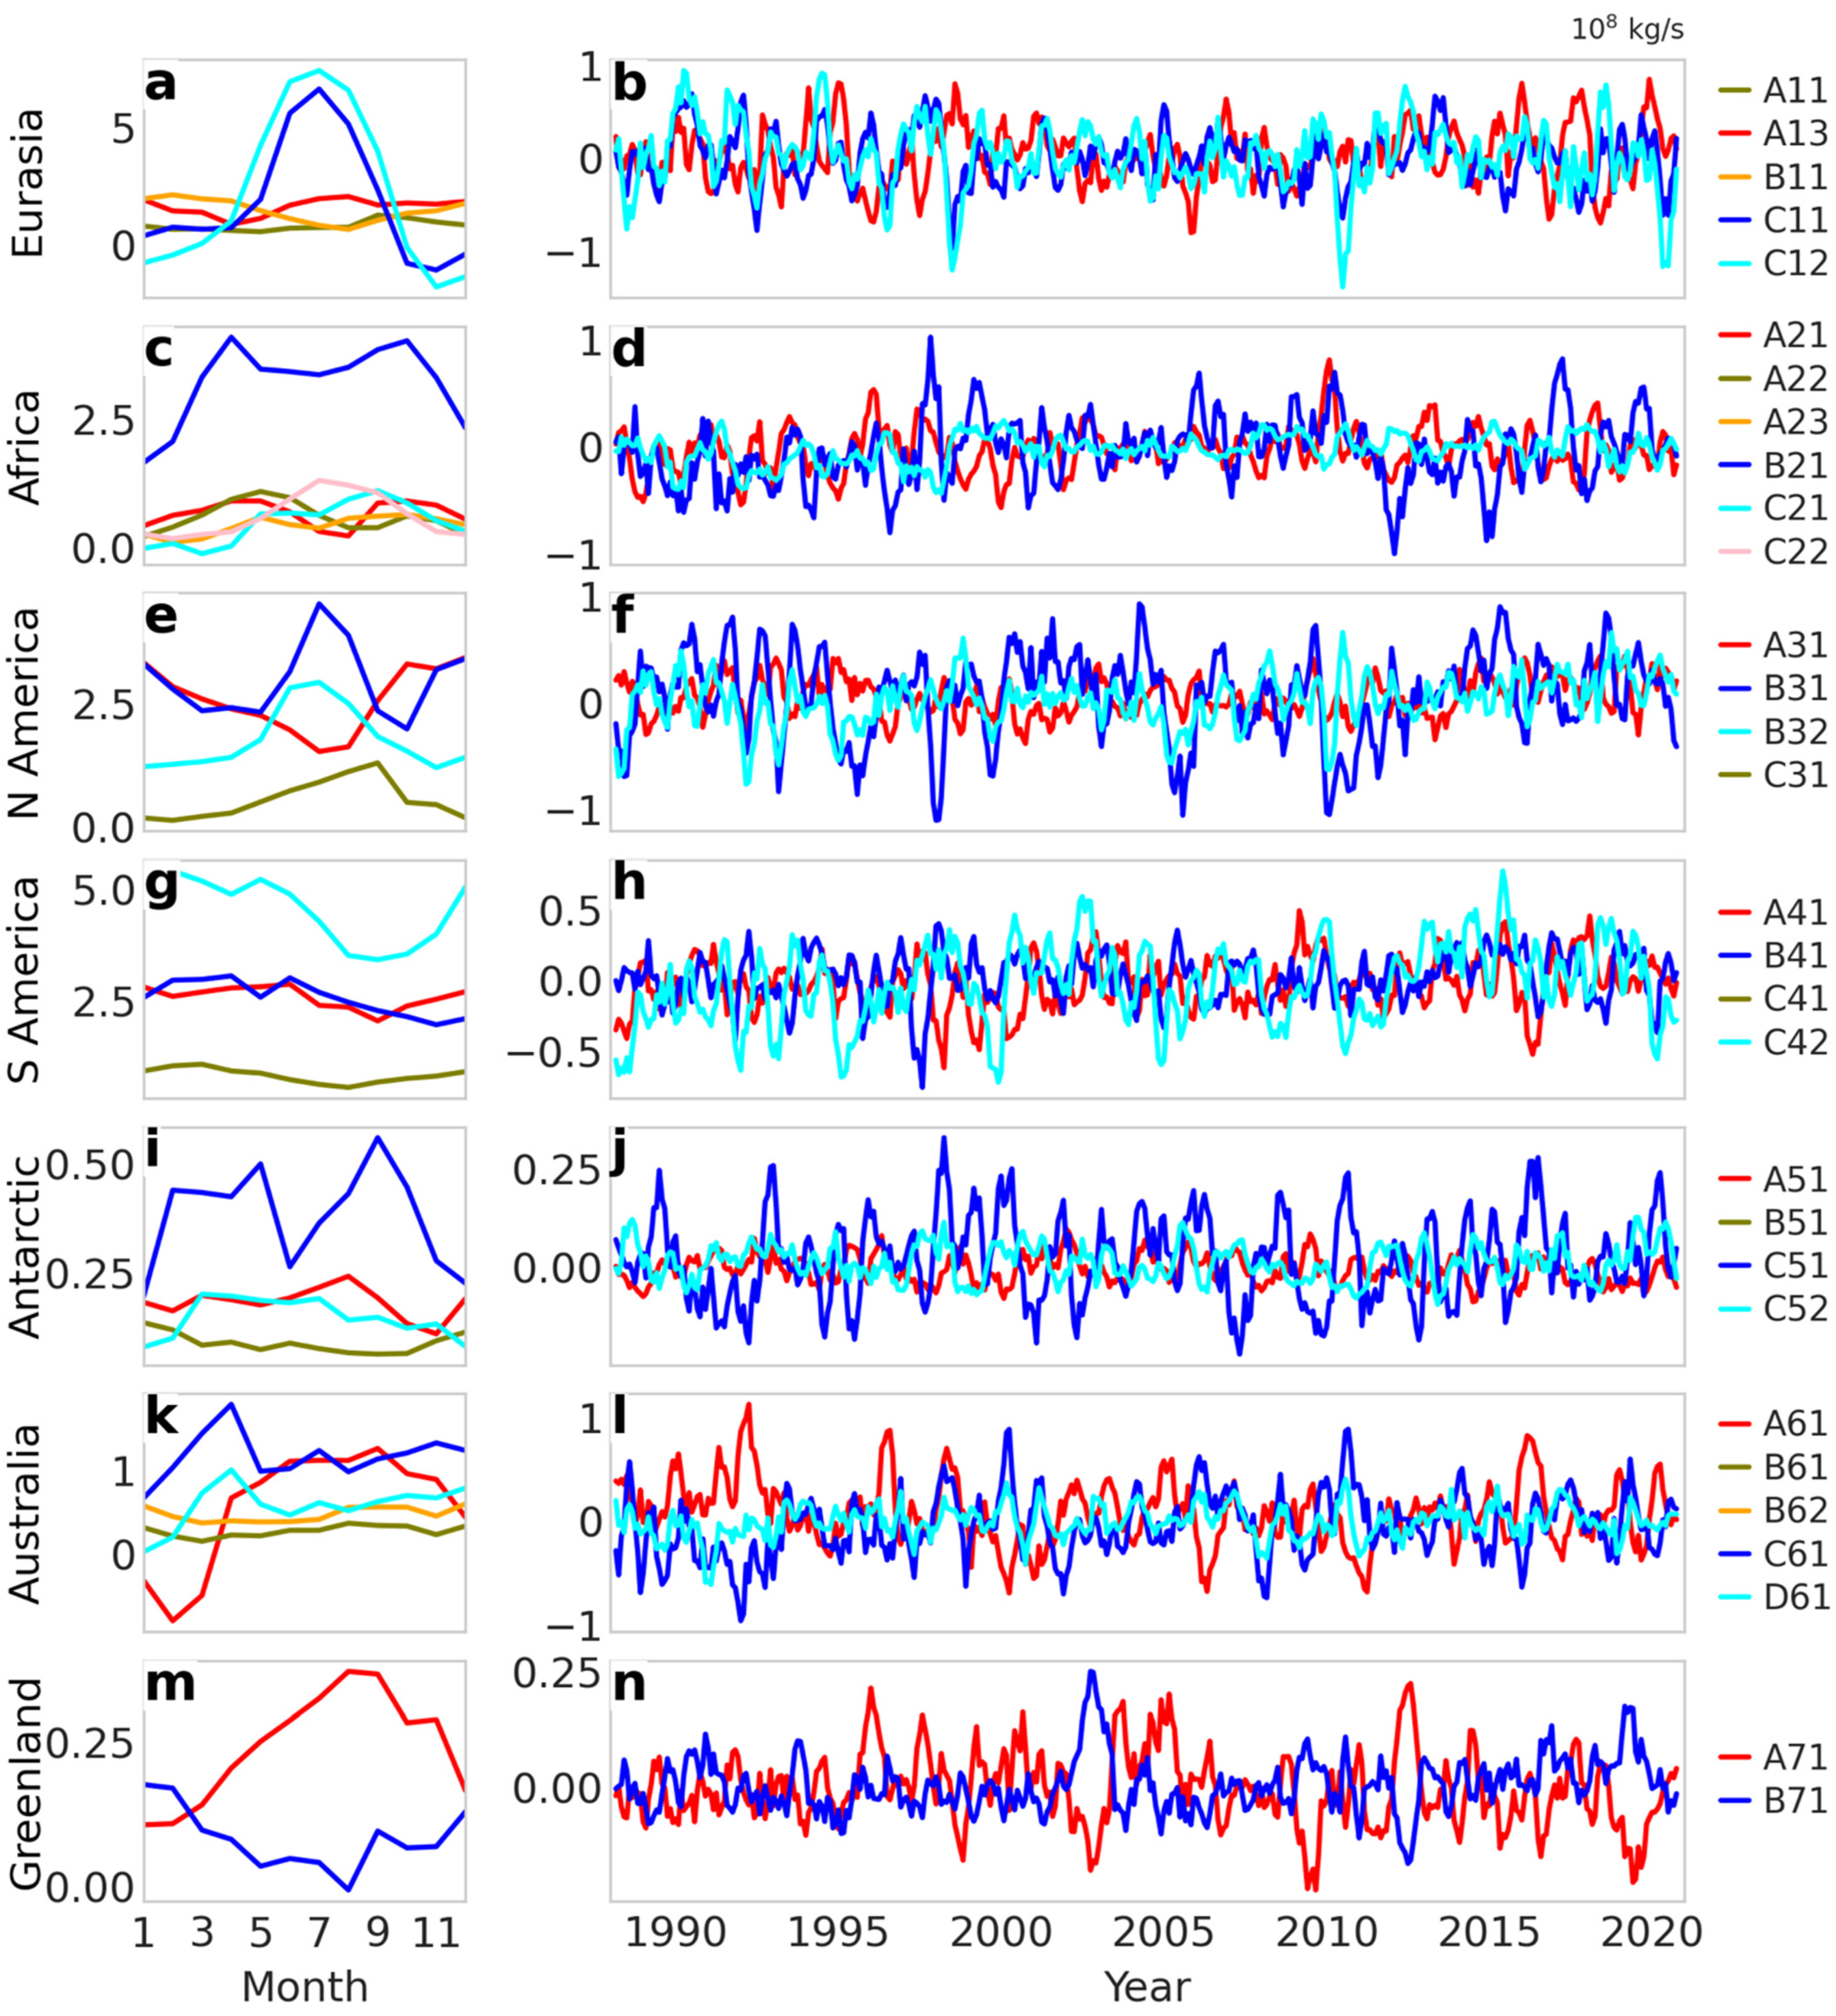
Some of the rising sections in the right column of
Figure 1 are selected to investigate the seasonal variability and trends of the moisture transport. The results are plotted in
Figure 2 and the corresponding multiannual mean and trends are listed in
Table 2.
Figure 2a,b indicate that moisture transports along sections C11 and C12 have similar seasonal and interannual variabilities. The seasonal variation corresponds to the onset and end times of the Indian monsoon. The correlation coefficient
r = 0.68 between their anomaly time series is significant at a significance level of 0.01. The mean transport of other sections, such as A11, A13, and B11, have small seasonal variations. The seasonal variability in the transport in
Figure 2c shows the onset and finish months of the African monsoon, and the bimodal distribution of the moisture inflow from sections A21, A22, and B21 is consistent with the seasonal variation in the area-mean Africa precipitation (
Figure 3c). The moisture inflows over B21 and C21 have significant trends of 5.58 × 10
6 kg s
−1 decade
−1 and 4.56 × 10
6 kg s
−1 decade
−1, respectively.
For North America, the two rising sections B31 and B32 along the east coast have similar seasonal and interannual variability and the correlation coefficient between them is r = 0.40, which is significant at a significance level of 0.01. It is also noticed that the seasonal transport of A31 has opposite variability with B31 and B32 from May to November, meriting further investigation. Three of four selected sections (A31, B31, and B32) have positive trends of the moisture inflow and the trend of 7.71 × 10⁶ kg s−1 decade−1 for B32 is significant, while the trend of −1.71 × 10⁶ kg s−1 decade−1 in C31 is negative but insignificant. For South America, three out of four selected sections (A41, C41, and C42) have a significant positive trend of moisture transport and the values are 3.88 × 10⁶ kg s−1 decade−1, 2.00 × 10⁶ kg s−1 decade−1, and 9.68 × 10⁶ kg s−1 decade−1, respectively.
For the Australian continent, four of the five selected sections have significant changes (see
Table 2 for details), while B61, B62, and C61 have significant positive trends and A61 has a significant negative trend. The correlation coefficient between C61 and D61 is 0.71. Sections A71 and B71 in Greenland show opposite seasonal and interannual variabilities and the correlation coefficient between their anomaly time series is −0.54.
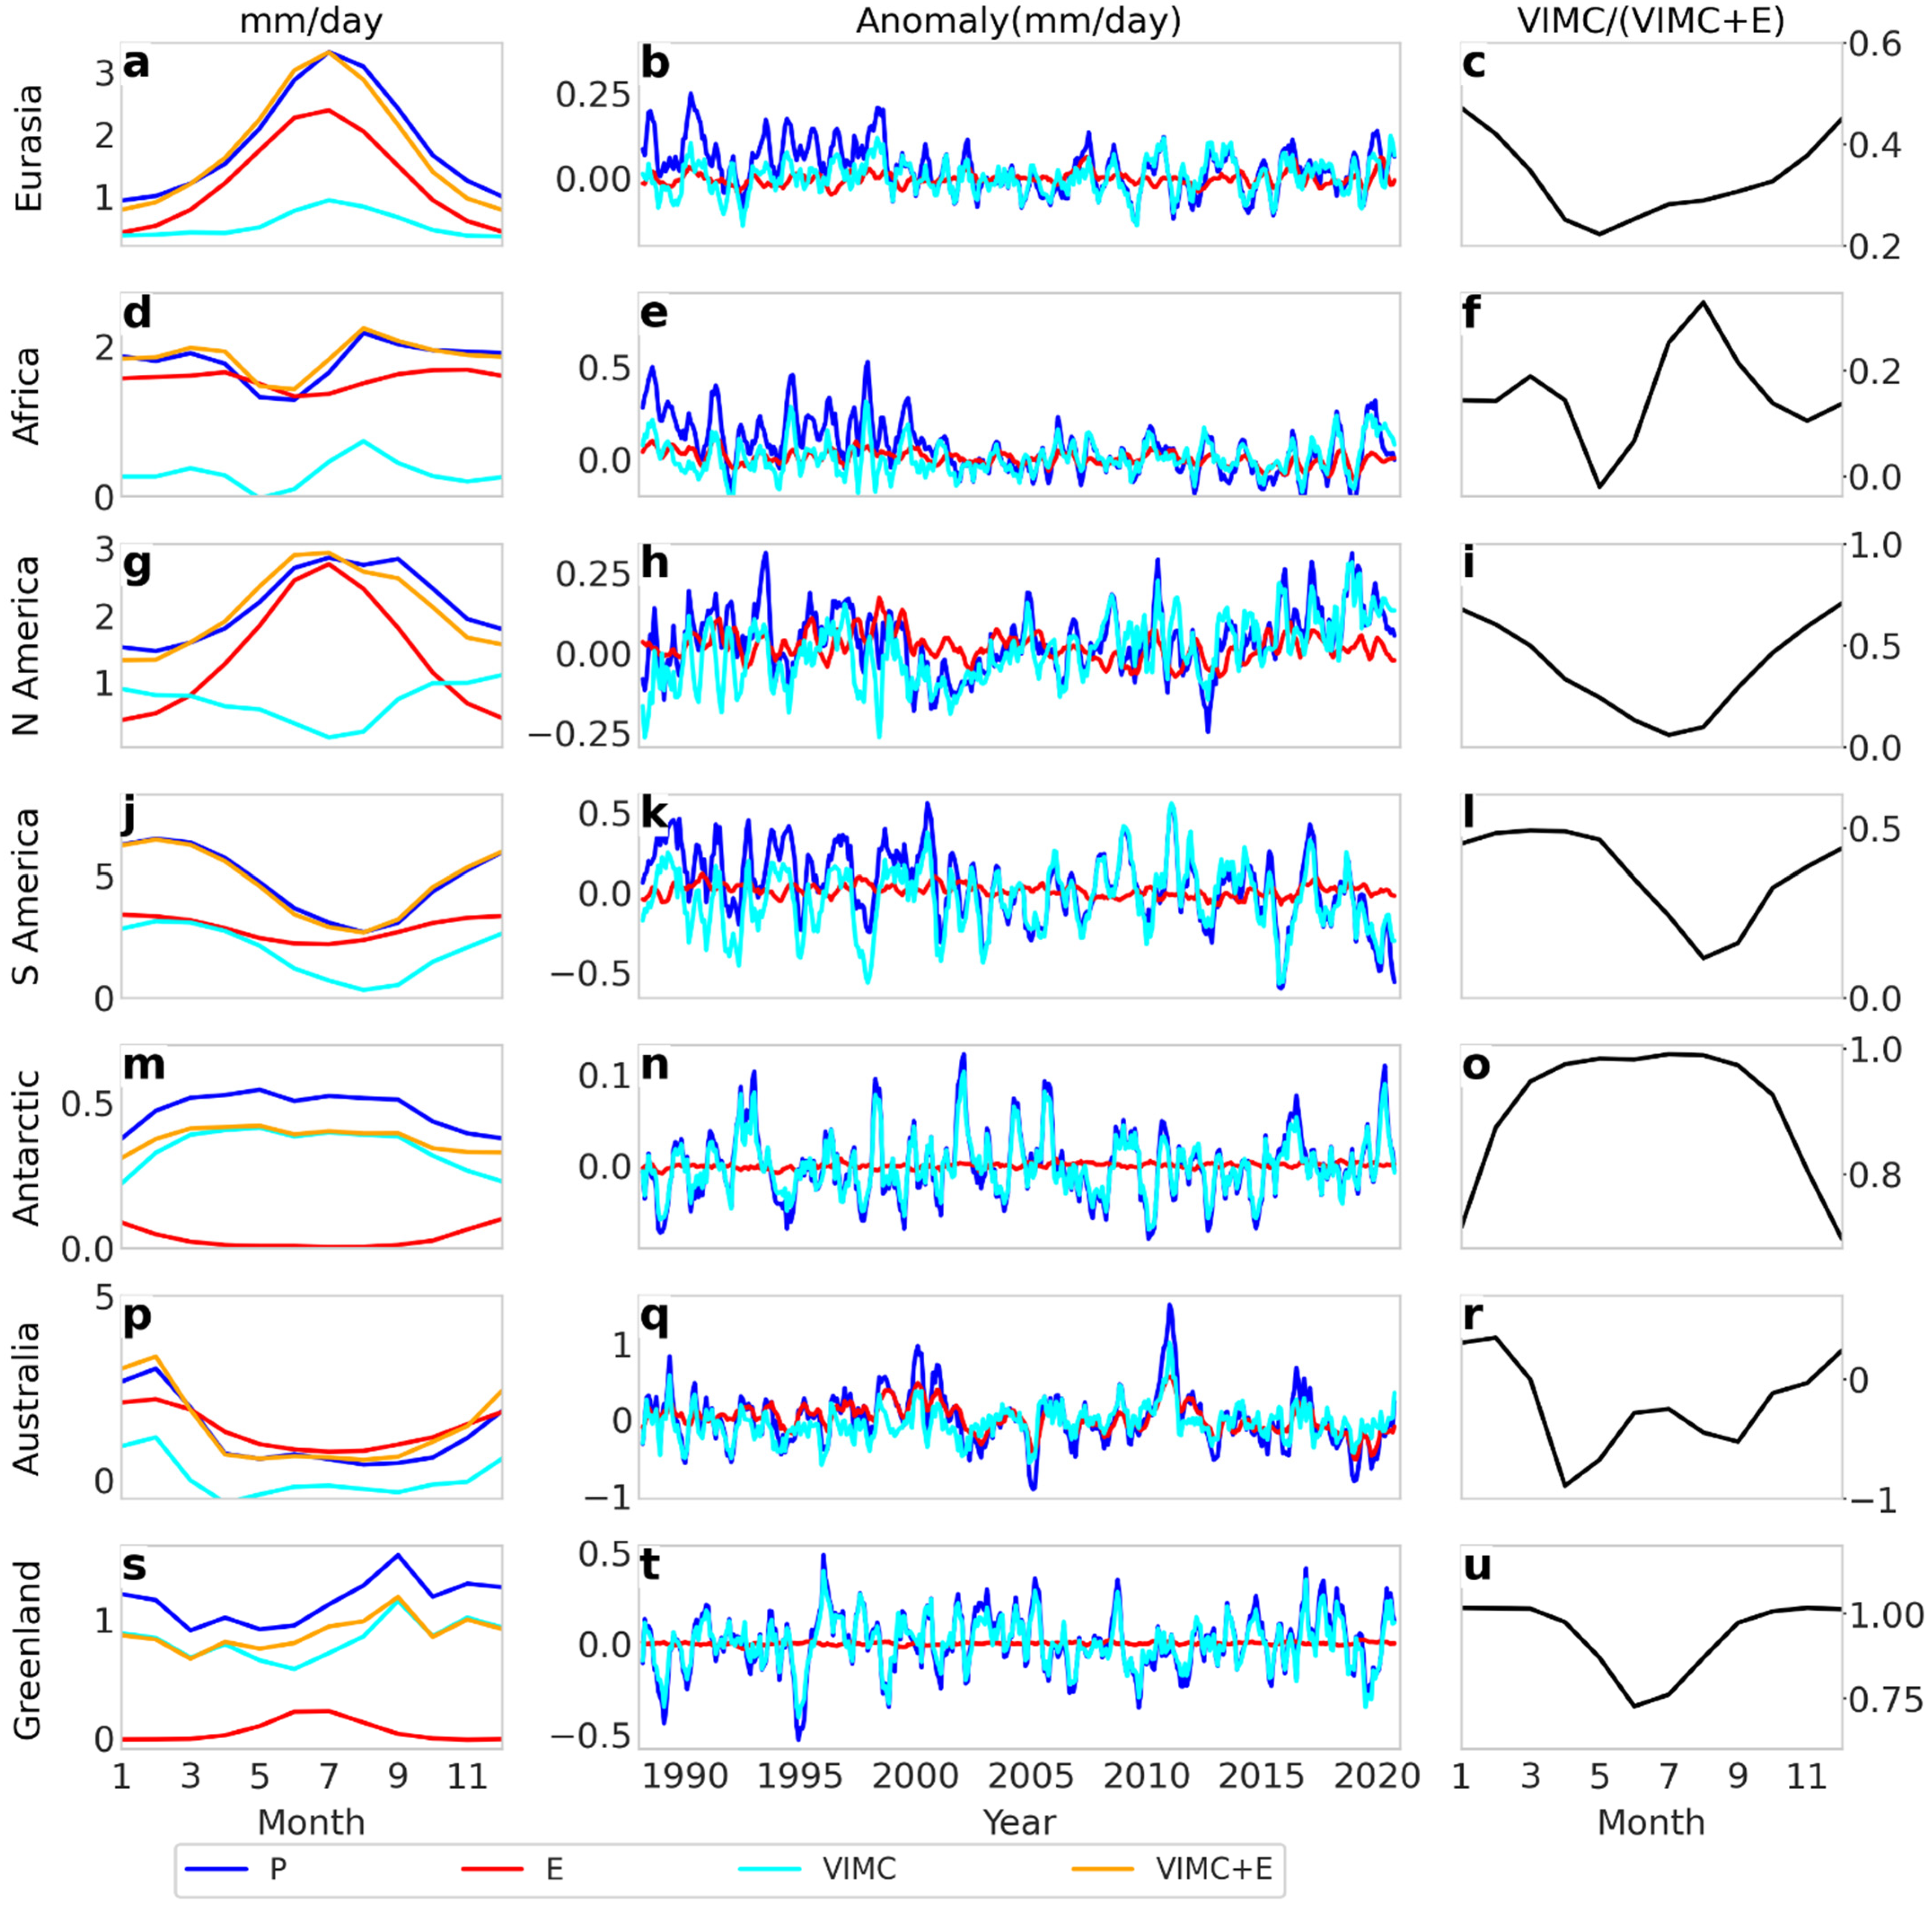
4. Moisture Transport Contribution to the Continental Precipitation
In order to study the moisture transport contribution to the continental precipitation, the seasonal changes and anomaly time series of precipitation (P), evaporation (E), and Vertically Integrated Moisture Convergence (VIMC) for each continent over 1988–2020 are plotted in
Figure 3. The seasonal variability in VIMC+E is also plotted in the left column and the ratio between VIMC and VIMC+E is plotted in the right column. It can be seen from the left column that the contribution of VIMC to precipitation varies with continents. The evaporation contributes more in quantity to precipitation than VIMC over the land at middle and low latitudes, while the VIMC has more contribution to P in Antarctic and Greenland. However, the amplitude of the evaporation anomaly is smaller than those of P and VIMC. The time series of precipitation and VIMC are significantly positively correlated, and their correlation coefficients are 0.82 (Eurasia), 0.80 (Africa), 0.85 (North America), 0.85 (South America), 0.99 (Antarctic), 0.85 (Australia), and 0.98 (Greenland) (
Table 3), implying the dominance of the moisture transport in the precipitation variability.
Both evaporation and moisture convergence (or transport) contribute to the continental precipitation. The VIMC+E and P are well balanced over Eurasia, Africa, North America, South America, and Australia (
Figure 3a,d,g,j,p), but VIMC+E is systematically lower than P over Antarctic and Greenland (
Figure 3m,s). The last column shows the ratio between the VIMC and VIMC+E. For consistency, VIMC+E is used here to estimate the contribution of VIMC to P because it is equivalent to P at middle and low latitudes. The contribution percentage has strong seasonal variability. The VIMC contribution is less than 50% in the Eurasian continent, and less than 35% in Africa. It contributes less in the northern hemisphere summer and more in winter over both South and North America. The precipitation over Antarctic is mainly from the VIMC contributing more than 70% throughout the year and more than 95% from March to September. The VIMC also contributes more than 70% to the precipitation over Greenland due to very small evaporation. The VIMC contribution is small in Australia (
Figure 3p,r).
To further understand the changes in the moisture transport, the influence of the main modes of climate variability such as the NAO, ONI (ENSO), and IOD on the moisture transport is investigated. The correlation coefficients between the VIMC and NAO, ONI, and IOD are calculated and listed in
Table 4. It is noticed that there is a significant negative correlation coefficient of −0.37 between VIMC and ONI in South America, which can be associated with the change in the cross-equator wind direction due to the hemispheric surface temperature gradient [
39]. The moisture convergence in Africa has a significant positive correlation coefficient of 0.236 with IOD and a negative correlation coefficient of −0.15 with NAO, indicating the combined effect of these two climate modes on the moisture convergence over Africa. However, the correlation coefficient only shows the possible influence, and it does not mean a casual relationship between them. The change in moisture transport is closely linked to the change in the atmospheric circulation, which is complicated and beyond the scope of this study. Further research, such as the variability in the moisture source regions and a full evaluation of the moisture transported by low-level jets and atmospheric rivers [
40], is needed to understand the drivers of the changes in moisture transport [
31].
5. Discussion and Conclusions
The hydrological cycle change in the warming climate is an important research topic, as it has a profound impact on economics and society. The previous studies showed large uncertainties in the ocean evaporation and moisture transport from ocean to land [
2,
25,
26], which not only affect the water budget but also influence the energy budget, as the total energy transport from ocean to land is almost entirely made up of the moisture transport [
2,
3,
4].
In this study, the latest ERA5 atmospheric reanalysis data from 1988–2020 are employed to revisit the moisture transport from ocean to land, in order to confirm the moisture transport variability and trends over seven continents, including Eurasia, Africa, South America, North America, Antarctic, Australia, and Greenland. The important sections dominating the moisture inflow to each continent along the boundaries are identified and their intensity and trends are investigated and listed in
Table 1 and
Table 2. Except Australia where the net moisture convergence is small and its sign (inflow or outflow) strongly depends on the integration method along the continent boundary and the time period selected, the other six continents have a net moisture inflow, with the largest net inflow of 379.64 × 10
6 kg s
−1 over South America and the smallest inflow of 19.69 × 10
6 kg s
−1 over Greenland. Furthermore, their net inflow trends are generally positive except for the negative trend of −0.59 × 10
6 kg s
−1 decade
−1 for South America, but the only significant trend is 12.98 × 10
6 kg s
−1 decade
−1 for North America at a 0.1 significance level.
Both evaporation and moisture convergence (or transport) contribute to the continental precipitation. The VIMC+E and P are well balanced over Eurasia, Africa, North America, South America, and Australia (
Figure 3a,d,g,j,p), but P is systematically more than VIMC+E over Antarctic and Greenland (
Figure 3m,s). Although contributions of VIMC to P vary with continents and seasons, there are high correlations between the VIMC and P anomaly time series. The corresponding correlation coefficients are 0.82 (Eurasia), 0.80 (Africa), 0.85 (North America), 0.85 (South America), 0.99 (Antarctic), 0.85 (Australia), and 0.98 (Greenland) (
Table 3), and they are all significant at the 0.01 significance level, implying the dominance of the moisture transport in the precipitation variability; even the evaporation has a large-magnitude contribution to P over some continents. The high correlations between VIMC and P indicate the possible high influences of moisture transport on the precipitation, particularly on the extremes. The affected regions by the moisture transport across the identified inflow/outflow sections and the dynamic mechanisms for the change in moisture transport should be further investigated using the Lagrangian model, in order to provide more useful knowledge for stakeholders and weather forecasters to help reduce the adverse impacts from extreme weather.
The significant increase trend of moisture convergence over North America is shown in
Table 1 and
Table 3 and
Figure 3, implying more possible precipitation extremes over this area, but the link between the moisture convergence and the extreme precipitation is still unknown and merits further investigation. Although the global mean precipitation shows an increase trend [
13], the precipitation trend in each continent shows a difference. The precipitation in Eurasia, Africa, and South America shows a significant decrease trend (see
Table 3), while all VIMC trends are positive except that over South America. These results need to be further verified using different datasets and time periods, and the reason for the regional precipitation change needs to be further investigated.
The data used in this study are only from the ERA5 atmospheric reanalysis, and it is planned to combine them with observations to validate our results. It is also useful to check the moisture transports from ocean to land using AMIP6 model simulations and compare them with our results and observations in a future study.

 ,
, 


