
Exposure Assessment of Air Pollution in Lungs


1
Department of Applied Mechanics, Motilal Nehru National Institute of Technology Allahabad, Prayagraj 211004, India
2
School of Mechanical and Mechatronic Engineering, Faculty of Engineering and Information Technology, University of Technology Sydney, Sydney, NSW 2007, Australia
*
Author to whom correspondence should be addressed.
Atmosphere 2022, 13(11), 1767; https://0-doi-org.brum.beds.ac.uk/10.3390/atmos13111767
Submission received: 22 September 2022
/
Revised: 19 October 2022
/
Accepted: 22 October 2022
/
Published: 27 October 2022
(This article belongs to the Special Issue Feature Papers in Air Quality)
Abstract
:In this article, a comprehensive literature survey on air pollution and its effects on the human respiratory system is carried out. Based on the knowledge gaps, a computational assessment is proposed to find the impact of air quality on respiratory suspended particulate matter (RSPM) deposition in the human airways. A realistic 3D geometric model of the human airway was constructed to study the airflow characteristics and RSPM (PM2.5 and PM10) transport and deposition in it for normal and moderate inhalation patterns (corresponding to natural breathing) of air having an unhealthy air quality index (AQI). The results identify inertial impact as the primary mechanism of particle deposition in the human airways. They also reveals the significant differences in the deposition patterns of PM2.5 and PM10 in the right and left bronchial airways.
1. Introduction
The human airway is a complex system involving a large surface area from the nasal openings (nostrils) to the alveoli. The human respiratory system handles over 10,000 L of ambient air on daily basis [1], and is thereby exposed to a high risk of deposition of the respirable suspended particulate matter (RSPM) that is present in the atmosphere due to various anthropogenic activities, viz., vehicles, industry, construction, etc. Depending upon the concentration of the RSPM and prolonged exposure to the polluted environment, these micron-sized particles slowly percolate to the bloodstream, as the alveoli walls are too thin. The particles eventually reach various organs of the body, reducing the functioning of the organs, namely the kidney, and can cause acute and chronic health effects [2]. The increase of particulate matter (especially PM2.5) and ozone in the ambient air not only increases the rate of mortality, but also has adverse impact on agricultural production and the climate [3].
Researchers [4,5] thoroughly investigated the effects of exposure to indoor pollutants on respiratory health and found that tobacco smoke, nitrogen dioxide and particulate matter (PM) emerged as the most important risk factors for chronic lung diseases such as asthma, bronchitis and COPD. A few researchers [6,7] examined the effect of long-term exposure of three air pollutants (PM2.5, nitrogen oxide and ozone) present in the residential area in an urban set-up on the risk of lung cancer. The results revealed a strong relationship between the exposure to PM2.5 and nitrogen oxide and the increased lung cancer incidence, even if the subject is exposed to a low-level concentration of these pollutants over a long term. Gupta and Elumalai [8] studied the relationship between size-segregated particulate matter with deposition doses in the lungs and found that exposure to particulate matter (PM1) during outdoor exercise increases the risk of its deposition to as far as the alveolar region of the lungs. Ching and Kazino [9] used a particle-resolved aerosol model to find the deposition efficiency of inhaled particulate matter (in the form of aerosols) in the lungs, taking the aerosol mixing state into consideration. The authors claimed to predict the soot particle deposition in the lungs using the aerosol mixing state index as it affects air quality and human health in an urban ambience. Milanzi et al. [10] examined the effects of air pollutants on lung functions and revealed that higher air pollution due to residential concentrations of NO2 and particulate matter might lead to the blockage of airways, but not necessarily to reduced lung volume during adolescence. Xu et al. [11] used an in vitro lung-on-chip model to assess the complex responses associated with PM2.5 exposure to the alveolar region. The results revealed that the low particulate concentration causes partial cytotoxicity to the internal layers of alveoli, but a higher concentration (>200 μg/mL) might notably increase inflammation and apoptosis in the alveolar region.
2. Particle Pollution and Health
The micro-size particles (≤10 µm) present in the air are called respirable suspended particulate matter (RSPM). They are a mixture of solid particles and liquid droplets of water floating into the surrounding air. These particles spread directly from a specific source, such as industries and motor vehicles, etc., or form of complex chemical reactions in the atmosphere. They are so small in size that they can easily enter the lungs with breath and cause severe respiratory diseases. Therefore, people suffering from respiratory diseases have most likely been exposed to particle pollution even for a brief period in the past at any age. Among the particulate matter (PM), PM10 describes any inhalable suspended particle present in the air with a size of 10 µm or less in diameter. The big-sized particles are generally filtered through the nasal cavity and throat. PM2.5 is a respiratory pollutant of size 2.5 µm in diameter or below present in the air. Due to their size, PM2.5 particles can penetrate deeper into the alveolar region of the lungs as well as to the blood stream, and may cause severe heart diseases and even kidney failure.
3. Airflow and Particle Deposition in Human Airways
Researchers reported the results of air pollution, especially PM2.5, on mice [12]. However, recent findings [13,14] suggest the need for the rigorous study of the effects of PM2.5 on human health. The airflow traverses through different segments of human airways up to the alveoli region, but it is quite challenging to reconstruct the complete airways from the nostrils to the alveoli region for experimental and/or computational studies. Therefore, in the beginning, researchers used the simplified model as described by Weibel [15] since the early 1980s to predict the characteristics of airflow and two-phase flows with particle PM2.5, and PM10 and their deposition inside the respiratory tract under different of boundary conditions. However, these studies with simplified airway models ignored the intricate anatomical features (such as cartilaginous rings around the trachea) and their effects on airflows and particle deposition [16].
In recent times, researchers have focused their study on the fluid flow in the CT-scan-based respiratory tract model incorporating important anatomical features. Different researchers used different segments of the human respiratory tract, for example, nasal cavity, oral cavity, trachea and different generations of bronchi for analysing air flow physics and particle deposition experimentally. A particle image velocimetry (PIV) test was performed by Kim and Chung [17] to visualize the flow in a CT-scan-based model from the nasal cavity to the second-generation bronchi. The results showed that the main airstream went through the posterior of the larynx during inhalation, while it was shifted towards the anterior side during exhalation under cyclic flow. During peak exhalation of the flow (200 L/min), different turbulence models were tested with experimental results. Under very high airflow rates, results with the k-ω turbulence model were found to be more stable in a simplified model. Im et al. [18] performed experimental as well as computational work. Several physiological functions, such as warming the inspired air, the filtration of air, humidification and olfaction, were used to analyse the airflow pattern in the nasal cavity, and it was found that these operations influenced airflow patterns in the nasal cavity and the flow characteristics of breath. Therefore, rigorous CFD analysis and its validation are essential for the correct prediction of airflow physics. Li et al. [19] validated the computational technique by the experimental results and found that the laminar model was in good agreement with the experimental results at a flow rate of 180 mL/s; however, the k-ɛ turbulence model offered better results for higher flow rates with curved-shaped geometrical models.
Researchers conducted experiments on the human airway model with two-phase flows as well. Oldham [20] experimented with airflow laden with 1 to 10 µm particles in a simplified third-generation airway model made of silicon rubber. The deposition efficiency was found to be up to 81% in the tracheo-bronchial airway. While anatomical features dominate the particle deposition in the airways, 2.5% more deposition efficiency was observed in the left lung as compared with the right lung. Similarly, another study was published by Gurman et al. [21] on the human airways under constant and cyclic airflow patterns, which revealed that the deposition efficiency was higher at a cyclic flow. Phuong and Ito [22] conducted a PIV experiment to find the deposition pattern of particles inside human airways during inhalation, and the experimental results were compared with the CFD results. It was observed that the experimental methods provided regional information on particle-laden airflow and its deposition in the lungs. However, CFD analysis provided detailed information about the breathing and transport pattern of inspired particles, which is helpful in locating the hot spot (where the origin of diseases is likely to occur due to toxic particle deposition) for better medical diagnosis.
A higher air quality index (AQI) score represents higher concentrations of PM2.5 and PM10 in the air. Inhaling high AQI air without a filter for a long time might lead to a higher deposition of RSPM and respiratory problems. Computational studies were conducted by several researchers to investigate the transport and deposition of these particles in the human airways. The fine particles move more toward the right bronchus of airways as compared with the left bronchus, and very few particles cross the conductive zone of the airway [23,24]. Agarwal et al. [25], Naseri et al. [26] and Wen et al. [27] predicted the deposition fraction of the particles in the specific region of the human airways under unsteady airflows. The inter-subject variability and airflow rate were found to have a big influence on drug delivery and airborne toxic particle deposition [28,29]. The tracheo-bronchial airways model has complex flow vortices, affecting the deposition of aerosol such as PM2.5 in the human airways [30,31].
Inthavong et al. [32] studied particle spray deposition in human airways. They observed that the nasal cavity’s structure influences the deposition. The large micro-size particle sizes greater than 10 μm in diameter under a flow rate of 333 mL/s greatly impacted particle deposition efficiency. Lin et al. [33] explained the deposition of micro-size particles in the nasal cavity using two types of inlet velocity profiles; one is the uniform inlet velocity, and the other the real velocity that includes the facial features. The results revealed that the effect of the facial features is small. The realistic flow boundary conditions lead to active flow vortices in the nasal cavity. Devdatta et al. [34] studied particle deposition in the asthmatic human airway. They noticed a relatively smaller deposition fraction for a low Reynolds number flow compared with a higher Reynolds number flow. Cui et al. [31] studied the impact of flow characteristics on particle deposition in diseased airways. They noticed a strong relation between airflow patterns and particle deposition. The deposition efficiency of the micro-size particles in the whole lung model varies according to particle size and respiration rate. Therefore, the particles of a smaller size were found to deposit uniformly, while the particles of a larger size were found to deposit at the bifurcation junctions.
Shang et al. [35] discussed the wall shear stress and particle deposition in CT-scan-based nasal cavities. The high wall shear occurred in the left cavity, which may lead to a mechano-physical response of the epithelium surface. The maximum number of particles in the nasal cavity was initially deposited within an one second. Luo and Liu [36] explained the particle deposition in CT-scan-based sixth-generation bronchi using a LES model with different types of microparticles (1, 5, and 10 µm) and nanoparticles (1, 5, 20 and 100 nm). The numerical results show the effects of nostrils on the transposition of different sizes of particles. The deposition efficiency of the micron size particle was much higher than the nanoparticles. For the deposition of nanoparticles, the sizes of the particles did not play a significant role. More particles were deposited in the nasal cavity and the bronchi region.
Chen et al. [37] investigated the deposition of 1 to 7 µm particles in the third bifurcation tracheo-bronchial airways model under flow rates of 15 to 120 L/min. They identified that the sedimentation governed the deposition of small particles. In another study, Chen et al. [38] investigated the deposition of 2.5 µm sized particles in normal and diseased (asthmatic) airway models and found higher depositions in the asthmatic airway. Naseri et al. [26] studied the particle deposition under cyclic breathing and compared the results with that of the steady-state airflow. They observed noticeable differences between steady and unsteady results. However, it was found that the complete airway geometry was important during transient flow analysis to predict the correct particle deposition fraction in the nasal cavity.
Pirhadi et al. [39] and Tohidi et al. [40] studied inhaled droplets. They identified phase-change in the nasal cavity during cyclic breathing. The numerical results showed that a steady-state simulation did not find an accurate estimation of the deposition and evaporation of water droplets in the nasal cavity. Calmet et al. [41] discussed the flow characteristics and particle deposition during sneezing. Due to the heavy inertia of the particles, a large deposition efficiency was observed in the nasal cavity. The results showed that the micro-size particles of 1 and 5 μm size with low inertia reached the distal region. The small-size particles were deposited more uniformly as compared with the large particles. Dong et al. [42] studied the exposure of humans to toxic particles during inhalation. The exposure to inspired nanoparticle was closely influenced by the shapes and flow rate. Furthermore, the vestibule notch was found to be mainly responsible for depositing the particles in the nasal cavity.
Predicting flow characteristics inside the human airway under natural breathing conditions is always a challenging task due to its complex structure. The deposition of micro-sized particles (PM2.5 and PM10) causes an excessive mucus secretion and narrowing (stenosis) of the airway passage due to inflammation. The excessive deposition of PM2.5 particles leads to damage to the epithelium layer, causing severe tissue injuries, and becomes a cause of tumours and/or COPD. It is clearly seen from the preceding discussion that the majority of respiratory diseases happen due to the low quality of air which has toxic/dust particles. The WHO recognized in 2015 that air pollution is a critical global risk factor for respiratory illnesses. A report by the Health Effects Institute [43] estimated that 5.9–7.5 million premature deaths occur worldwide due to air pollution, and two-thirds of these are attributed to the increased presence of PM2.5 and ozone in the atmosphere. Therefore, the accurate prediction of the regional deposition of these toxic particles in the human respiratory tract helps in identifying the most promising regions of hot-spots and provides useful information for the diagnosis and prognosis of respiratory diseases due to RSPM. Hence, there is a need to understand airflow and the deposition of RSPM in healthy, as well as in diseased, human airways under natural breathing. This will help researchers and doctors to understand the air and particle flow physics and relate them to pathological aspects. The following section discusses the computational strategies adopted for the present work.
4. Computational Methodology
The numerical methodologies adopted in the present study are elaborated in the subsequent sub-sections.
4.1. Reconstruction of Human Airways
A computer-tomography (CT) scan-based physiologically realistic human respiratory tract (HRT) model was developed in the first decade of twenty-first century. The drug depositions in these models considering different generations (i.e., the bifurcation of the tracheo-bronchial tree) were discussed by many researchers [44,45]. The effects of anatomical structures (namely the larynx and cartilaginous rings) was found to be prominent in drug deposition as they affect the airflow pattern. Hence, a seven-generation human airway was reconstructed from CT-scan images of a 70 year old subject for the study, as is shown in Figure 1. The figure shows the translocatory pathway of RSPM. This reconstructed three-dimensional airway model was used for the numerical grid generation.
4.2. Grid Generation
The polyhedral cells were chosen for the numerical grid generation inside the complete flow domain of the human airway geometry (Figure 2). The polyhedral grid cells are less sensitive against stretching, and hence provide an improved mesh quality, even at a reduced cell count [46,47]. Grid/mesh refinement [48] and the selection of numerical schemes [49] are equally important in capturing wall turbulence and flow phenomena in the realistic HRT model. Therefore, the mesh adaptation technique was used as a constructive mesh refinement in the CFD solver to accurately capture the flow features of the human airway. The adaptation increases the number of elements in the region of interest. The mesh count considered in the present analysis were around 6.89 million elements, because the airway surface was relatively less smooth to capture intricate anatomical features.
4.3. Governing Equations
For the airflow analysis of the human airway, the continuity and momentum equations employed were presented as follows:
Continuity Equation:
Momentum Equation:
where ui and uj (i, j = 1, 2, 3) are the airflow velocity components in the x, y and z directions.
Particle Transport Model
In the discrete-phase model (DPM), the flow of the discrete phase was set-up to satisfy the continuum. The particle transport trajectory of the inspired particles transported with the air was solved using the Lagrangian approach. The force-balance equations were written as in Equation (3):
where up = the velocity of a particle, ρp = the density of a particle, dp = the diameter of a particle and the drag force per unit of the inhaled mass is
It is worthwhile to note that gx in Equation (3) is the gravitational force, while Re in Equation (4) is the relative Reynolds number defined as below.
The drag coefficient CD can be described as
where a1, a2 and a3 are the constants, applicable to a wide range of relative Reynolds numbers for spherical-shaped respiratory suspended particles.
In the present study, different micro-sized particles (2.5 and 10 μm) were injected into human airways corresponding to an unhealthy AQI (300 µg/m3). The injected particles were likely to be deposited in the respiration passage as per the aerodynamic parameters of the injected particles and the geometrical configurations of the airways. There are four mechanisms of particle deposition, namely interception, impaction, sedimentation and diffusion, which are discussed in Tiwari et al. [50]. In this study, two mechanisms, namely inertial impaction and sedimentation, were considered for particle deposition in the human airways. Using the DPM model, it is possible to obtain both local and regional deposition patterns throughout the passage. Therefore, the DPM was used to determine the deposition fraction of the inspired particulate matter in this study.
4.4. Turbulence Model
The shear stress transport (SST) k-ω turbulence model with a low Reynolds number correction was used to simulate particle transport in human airways. The SST k-ω turbulence model is a hybrid method that performs well under the wall-bounded condition and free shear flow in the HRT. The results of the k-ω turbulence model are much more sensitive and accurate near the flow wall with adverse pressure gradients, while the standard k-ε is normally used for the fully turbulent region far from the wall. Thus, a blending function was used to transform the k-ε turbulence model in the centre of the passage into the standard k-ω turbulence model near-wall region. The blending function was designated as 1 near the wall region, which activates the standard k-ω turbulence model, and was equated as 0 away from the surface, which activated the transformed k-ε turbulence model. The transport equations for k (turbulent kinetic energy) and ω (specific turbulent dissipation rate) are described below in the Equations (7) and (8).
k-equation:
ω-equation:
where , and are the kinetic molecular viscosity, turbulence viscosity of the fluid and Reynolds stress tensor, respectively. The turbulence viscosity of the fluid is expressed as
where , RT = k/µω, whereas µ is the dynamic molecular viscosity of the fluid. The model constants values are given as , , , , and .
4.5. Boundary Conditions
The literature suggests that particle transport in human airways can be estimated for healthy [51], as well as diseased (tumorous), human airways [52]. However, the results often vary due to non-compliance with biological conditions in the airway walls, commonly known as boundary conditions in CFD. Hence, the physical properties of HRT walls, namely complaint airways with fluid-structure interaction [53], age-specific airways [54,55], diseased airways [54,56], stenosis airways [57], mucociliary clearance [58], heat-transfer effects [59] and even artificial barriers such as face masks [60] have so far been considered in the numerical studies of human airways.
Due to the presence of the mucosa and cilia, the respirable suspended particulate matter (RSPM) reaching the inside wall of human airways is trapped and deposited. The deposition of RSPM at different regions of the CT scan-based three-dimensional upper airways model was obtained computationally by applying the trap boundary condition on the wall to model the RSPM deposition.
4.6. CFD Solver Settings
The Mach number corresponding to the flow velocity was very low (around 0.2). Therefore, the flow was treated as incompressible. Thus, the pressure-based CFD solver was selected for unsteady, incompressible flow in the human airway. A higher-order discretization scheme, namely the quadratic upstream interpolation for convective kinematics (QUICK) scheme, was used. It reduces the computational effort due to improved convergence, and hence has been implemented successfully in various complex CFD problems. The CFD solution was set to attain convergence when the value of normalized maximum residuals went below 10−5 for all flow parameters. It was necessary to select a time-based CFD solver io solve the transient flow problem. Due to the fact that the estimation of the correct time step size for the entire calculation is quite tricky for any unsteady/transient simulation, the adaptive time method was used where the time step size varied depending upon the truncation error. If the error was smaller than the described tolerance, the flow time step size was increased, and vice versa. Therefore, for such a kind of complex study, this method was proven to be more suitable and efficient.
5. Results & Discussion
In this section, the results of RSPM transport (PM2.5 and PM10) corresponding to an unhealthy AQI score of 300 μg/m3 and deposition in the different regions of the human airway models at asymmetric (normal and moderate) inhalation for different time instants are presented and discussed. The regional deposition fractions (RDF) in the airway model are presented in separate subsections to show the data clearly, as the order of magnitude differs in two parts (upper and lower).
5.1. Computational Validation
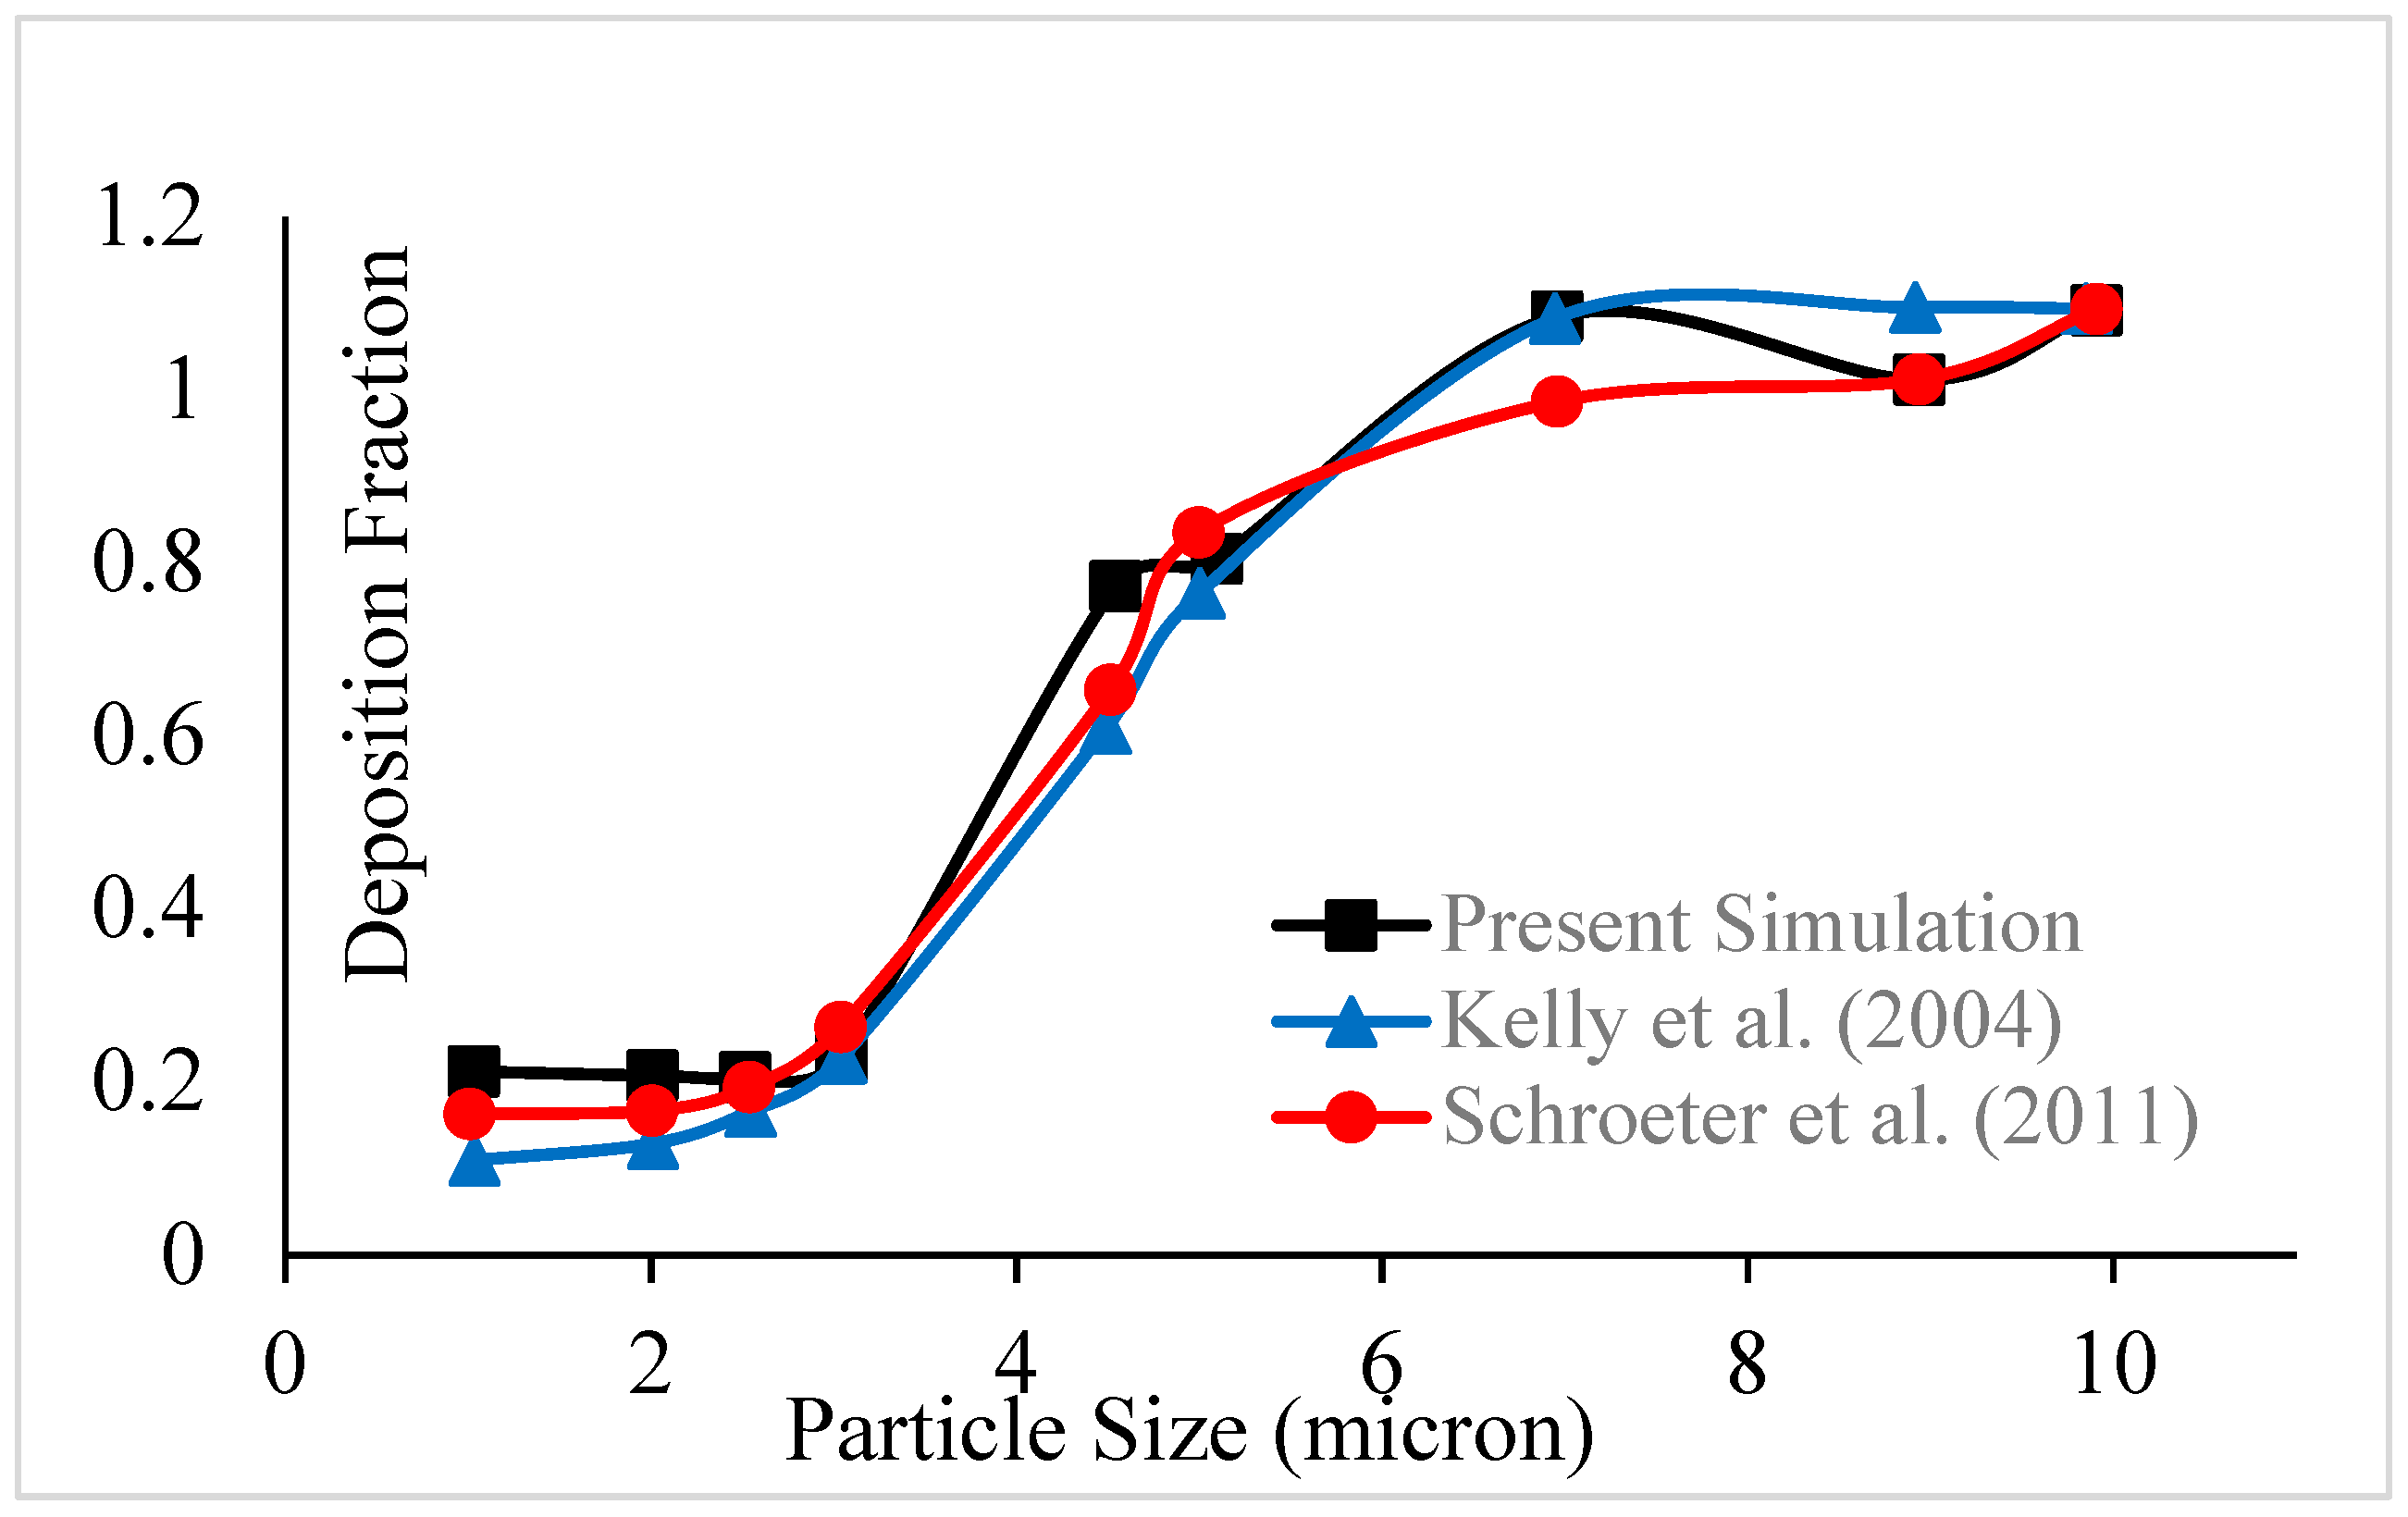
The deposition efficiency of respirable suspended particulate matter (RSPM) in HRT was investigated using a discrete phase model (DPM) along with continuity and momentum equations of airflow. The validation of the present computational model was performed by comparing the deposition efficiency of RSPMs of different sizes in the nasal cavity at the constant inspiration of 30 L/min with the corresponding experimental results reported by Kelly et al. [61] in Figure 3. The results were in reasonable agreement because the nasal cavity models belonged to different subjects, and the experimental model may have variable surface roughness as it was fabricated using the SLA technique as confirmed by Schroeter et al. [62]. After validation, all of the cases of the present work are discussed in the following subsections.
5.2. Particle Transport in Human Airways
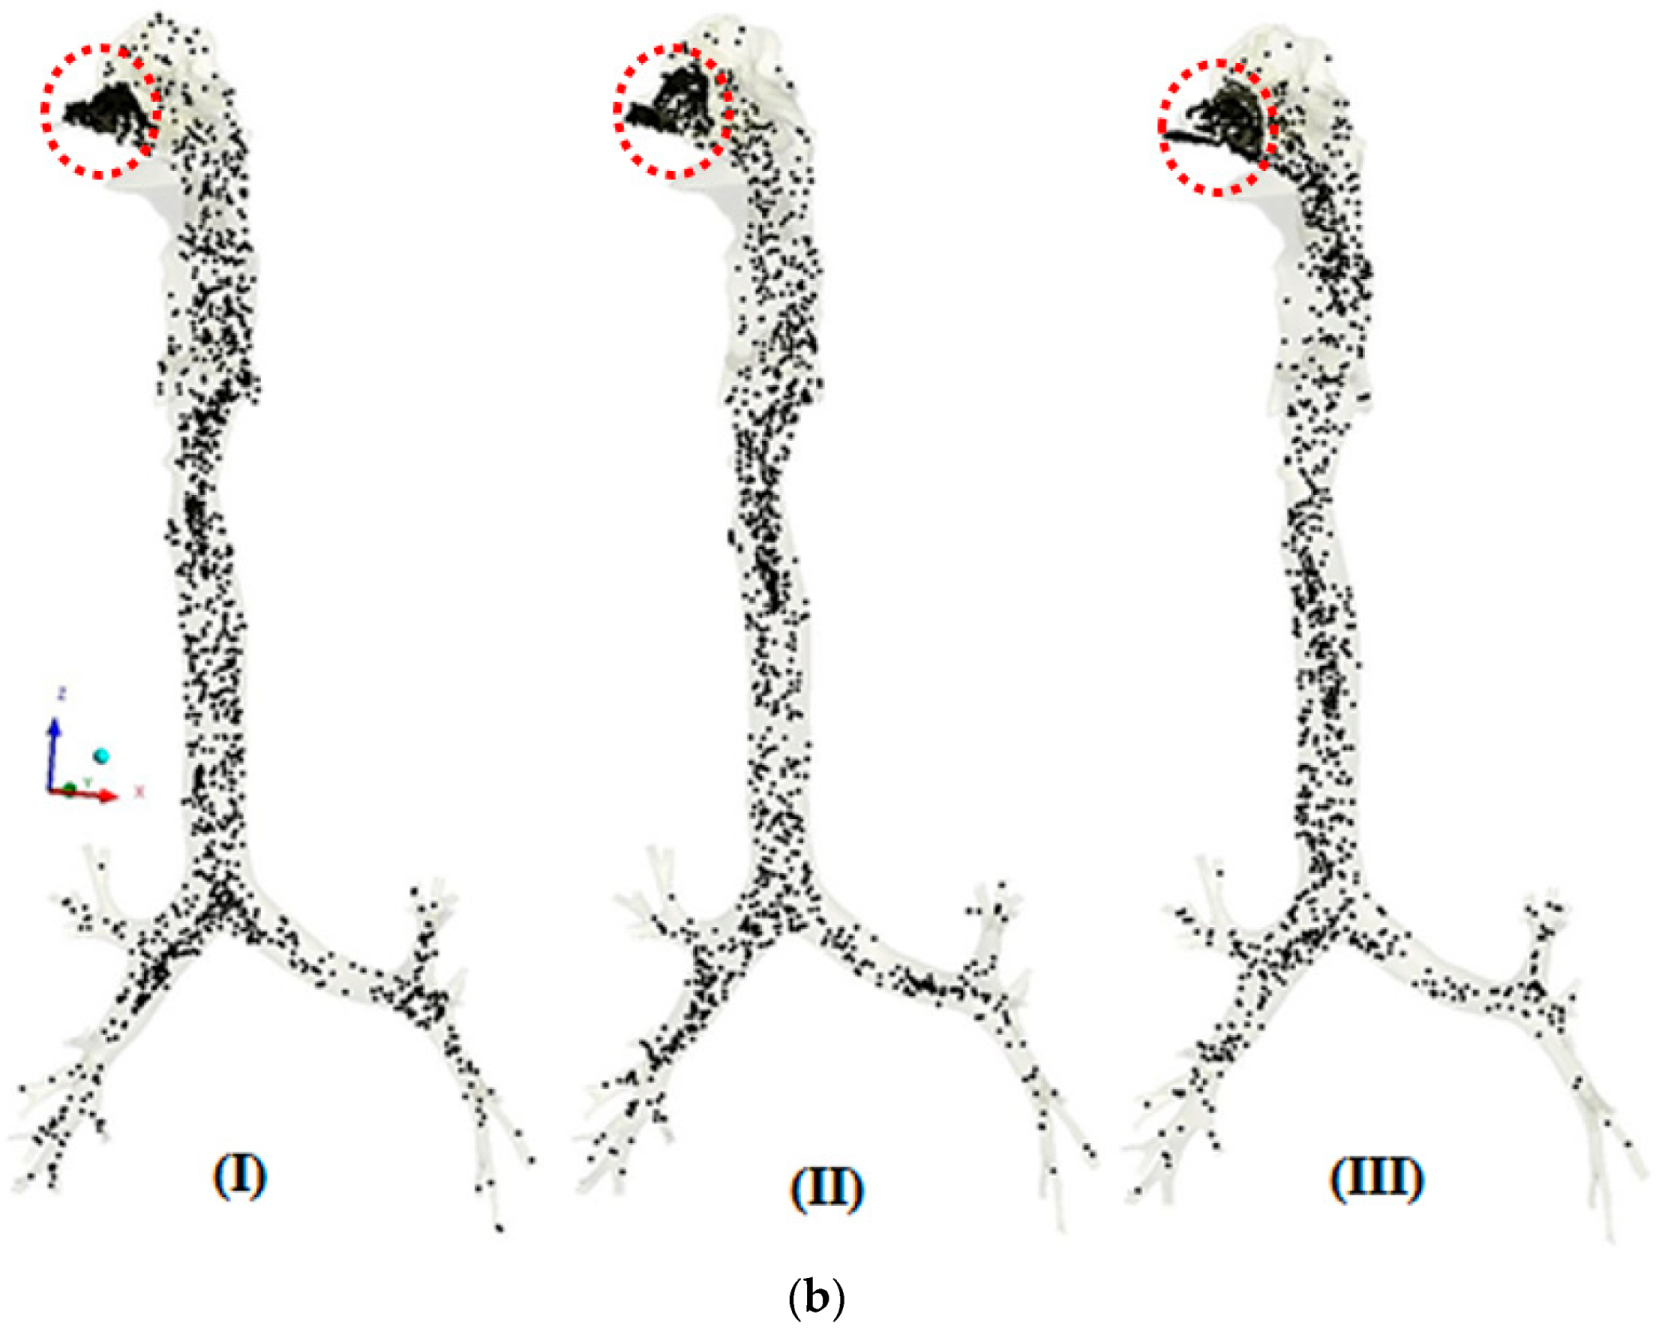
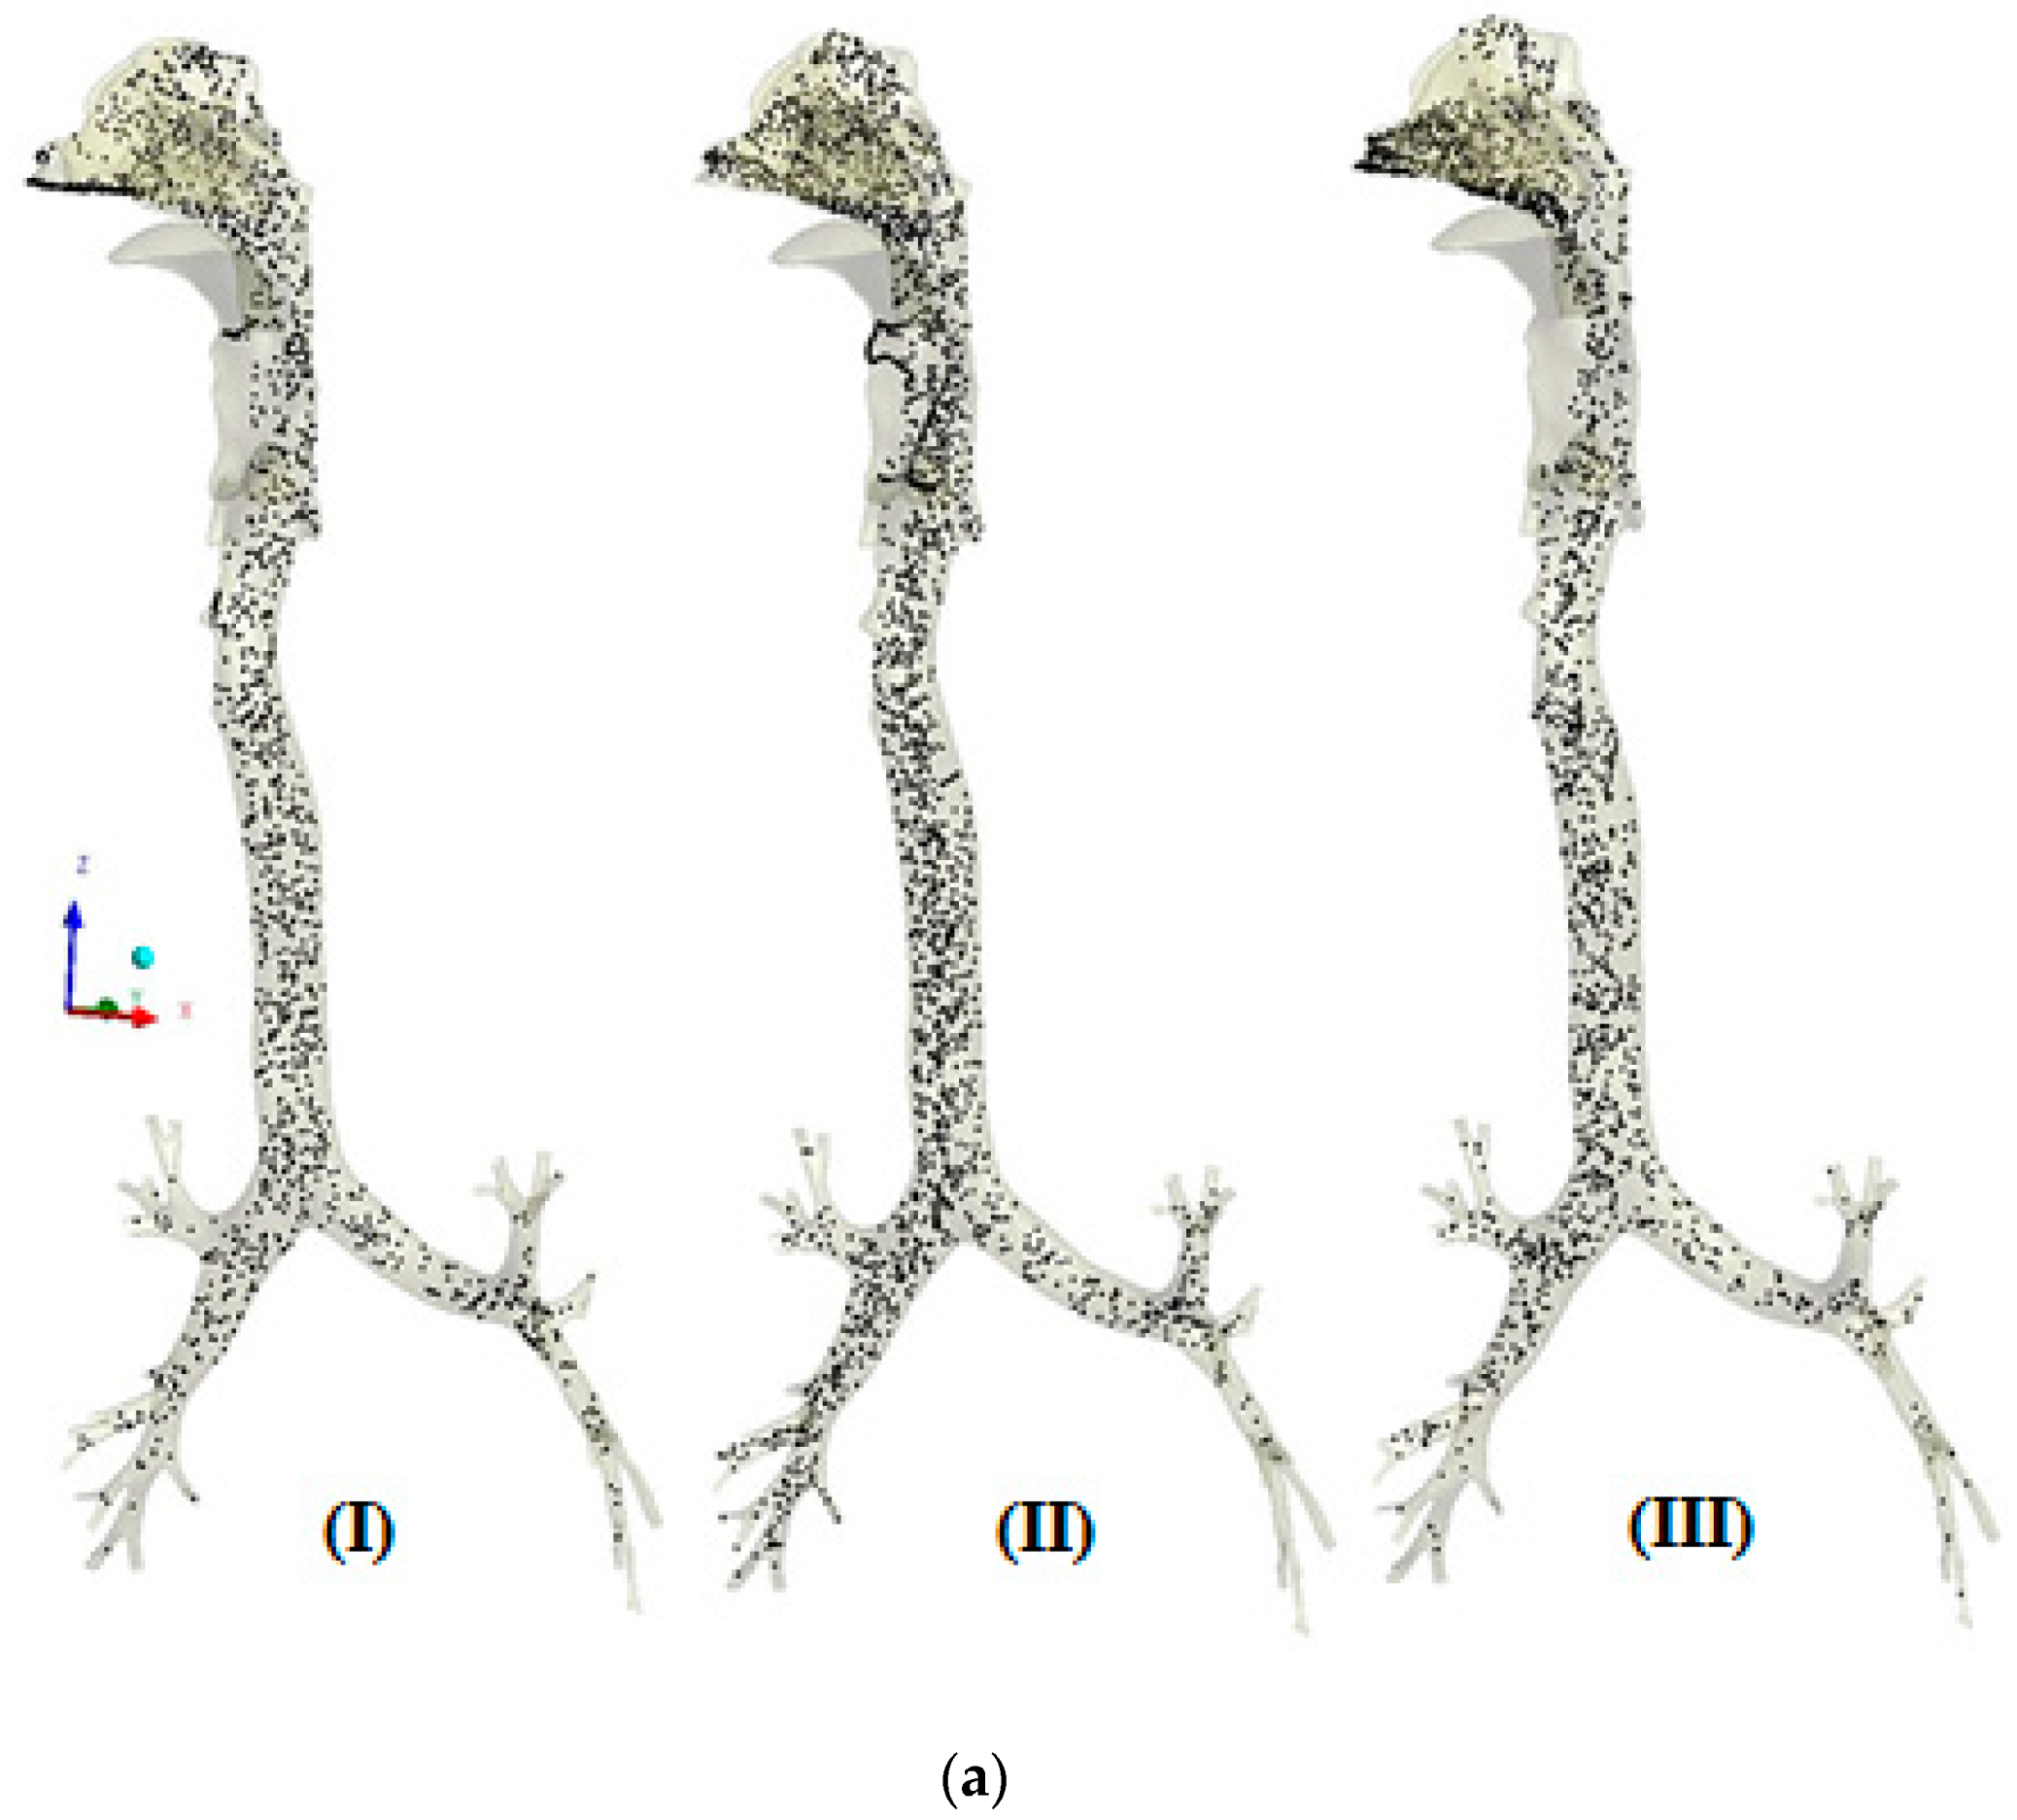
The transport patterns of RSPM (PM2.5 and PM10) inside the human respiratory tract model during normal and moderate inspirations are shown in Figure 4 and Figure 5, respectively. An animation of particle transport was made over the complete inhalation for each case. However, in the present section, three frames of particle transport are presented that are pre-peak (I), peak (II) and post-peak (III), to obtain an idea of particle transport over the inhalation time.
Figure 4a,b shows the transport patterns of PM2.5 and PM10 at three different times during normal inspiration. Figure 4a (I) shows a uniform transport of PM2.5 during the initial stage of inhalation. Figure 4a (II) shows a denser PM2.5 because of the higher carrying capacities of the particles at peak inhalation. It is also observed that the transport of the PM2.5 in the right airways is more than in the left airways because more air enters the right airways, that being straight as compared with the left one. The concentration of PM2.5 is more on the anterior side as compared with the posterior in the trachea because of the skewed air profile towards the anterior side. At post-peak in Figure 4a (III), more concentration of PM2.5 is observed in the lower nasal cavity because of the accumulation of particles due to decreasing inhalation velocity. These patterns of PM2.5 are attributed to the velocity profile in the airways, as PM2.5, being finer particles, follow the air profile that depends upon the anatomical feature. It is also seen that the concentration of PM2.5 is reduced from the nasal cavity to the bronchi tree as lesser particles are carried with the reducing velocity in higher generations of bronchi.
Figure 4b shows the transport pattern of PM10 during normal breathing. The maximum concentration of PM10 is observed before the nasal valve because the nasal valve acts as a filter to prevent relatively larger particles from entering the airways. The difference in patterns of PM10 transport from PM2.5 transport is attributed to two reasons. Firstly, the number of particles for PM10 is far less than that of PM2.5 at the same AQI (concentration) due to the size difference. Due to the fact that PM10 has larger inertia than PM2.5, it may not follow the air profile fully during normal breathing.
In Figure 5a, the higher velocity pushes the inspired mass of particles. Therefore, a higher mass of PM2.5 particles is pushed towards the lower airways. Furthermore, the chance accumulation of particles is observed in the nasal cavity and pharynx larynx region. Moreover, similar trends of particle transport are observed under moderate breathing. It is evident in Figure 5b that the nasal valve could not stop the entry of PM10 because of moderate breathing as compared with normal breathing. However, the respiration region acts as a barrier at peak inspiration.
The study of RSPM transport reveals that the nasal cavity acts as a prime defence mechanism against inspired particles and filters the air during respiration. The thick mucus and cilia layers in respiration or the middle region of the nasal cavity trap the RSPM.
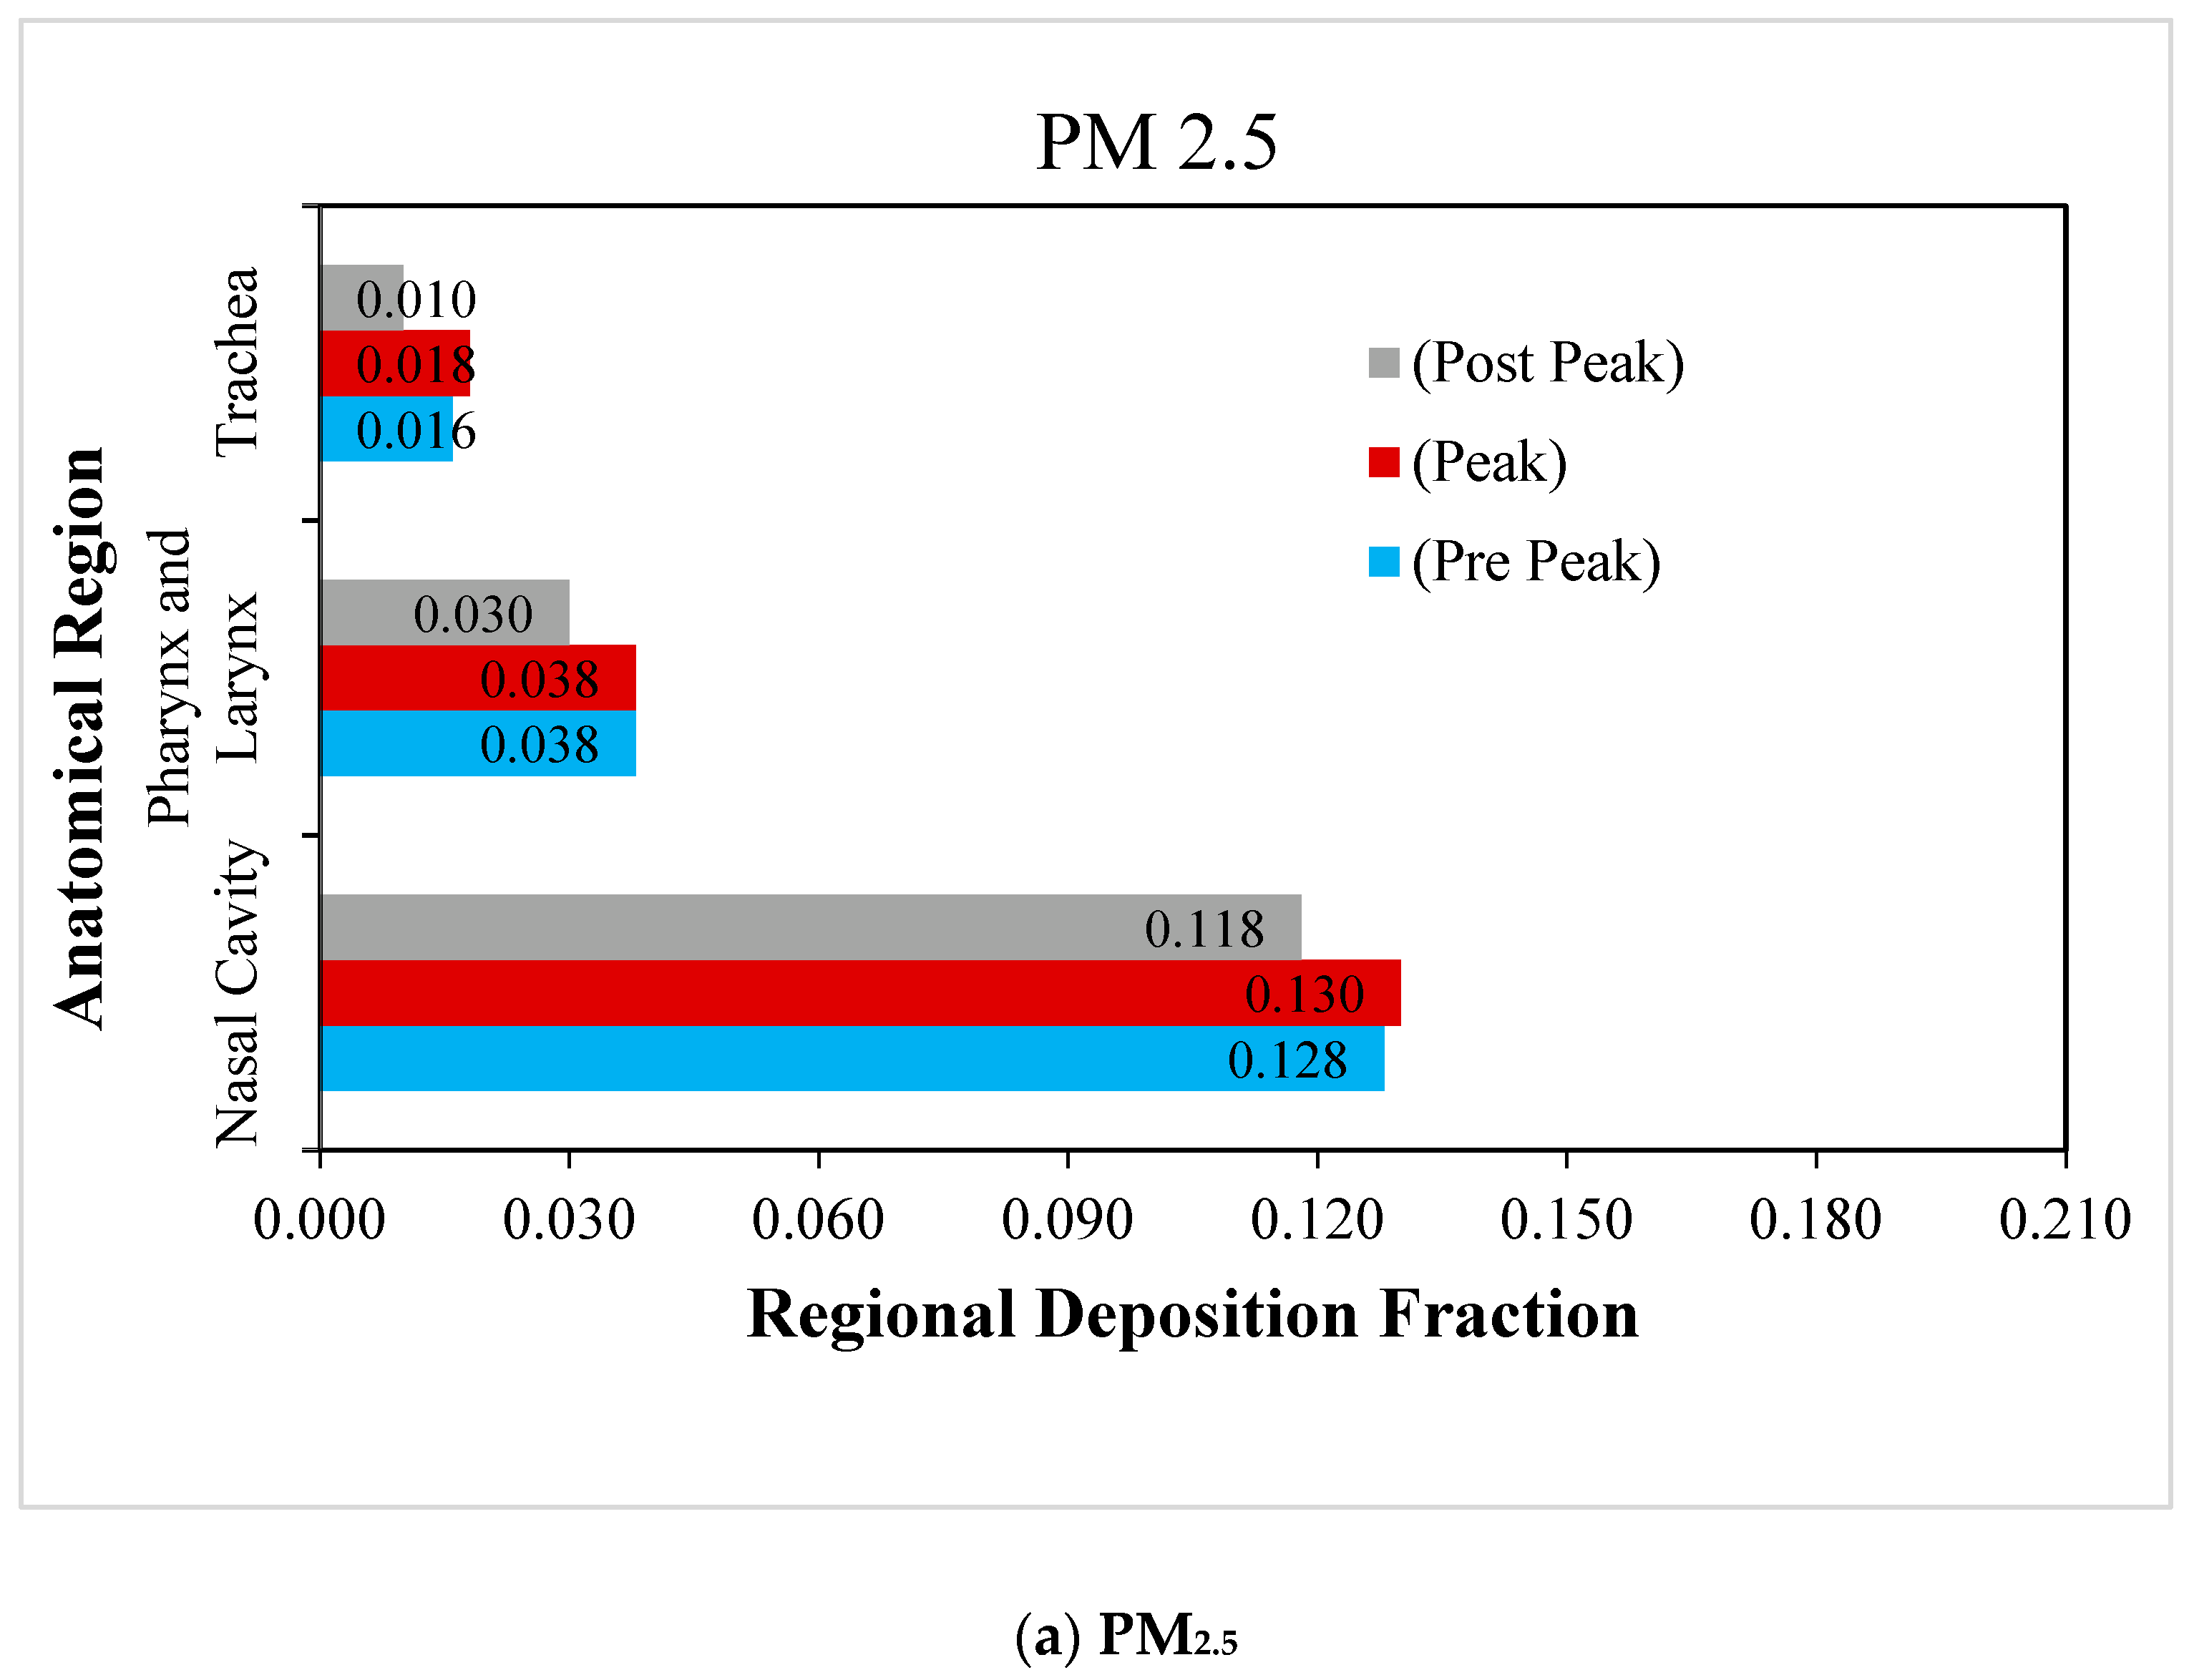
5.3. Regional Deposition of RSPM in Upper Airways
The regional deposition fraction (RDF) is the ratio of the number of particles deposited in a particular region to the total number of particles inhaled. The RDF of RSPM in different regions of upper airways, namely the nasal cavity, pharyngeal and trachea, is presented during normal and moderate inspiration in Figure 6 and Figure 7, respectively. The size of the nasal cavity is the smallest region, and that of the trachea is the largest. Moreover, the nasal cavity is the most complex region anatomically, and the trachea is the simplest.
The regional deposition fraction of PM2.5 and PM10 under normal inspiration are compared in Figure 6a,b. It is observed that the maximum deposition of RSPM at a particular region is obtained at peak inhalation, as anticipated. It is also depicted that the maximum RSPM is deposited in the nasal cavity, due to its complex anatomical features. It acts as a filter and offers the primary defence against the RSPM to protect the lungs. It is found that the deposition of RSPM in the subsequent regions keeps on reducing. The pharyngeal region is curved, having intricate parts compared with a relatively straighter trachea. Therefore, more particles are deposited in the pharyngeal region as compared with the trachea. It is observed that the regional deposition fraction of PM10 is higher than that of PM2.5 in these regions under normal inspiration because of inertia.
The deposition of RSPM (PM2.5 and PM10) in the upper human airways under moderate inspiration are compared in Figure 7a,b. Similar trends are observed in the case of normal inspiration, but the magnitudes are higher than at normal breathing. However, the impact of the variation of particle size is found to be greater on particle deposition as compared with that of the inspiration rate. Due to the fact that the RSPM deposit results from the inertial impaction and follows the impaction parameter (d2Q), it is obvious that the size of the RSPM has a greater influence on its deposition than the inhalation rate, as is revealed in the study.
The deposition fraction of PM10 at the nasal cavity is much higher than that of PM2.5 under moderate inspiration due to the higher inertia of PM10 and the complex flow path in the nasal cavities. Due to the fact that more PM2.5 could escape the nasal region at moderate inhalation, more PM2.5 are found to be deposited than PM10 in pharyngeal and trachea regions.
5.4. Regional Deposition of RSPM in Tracheo-Bronchial Airways
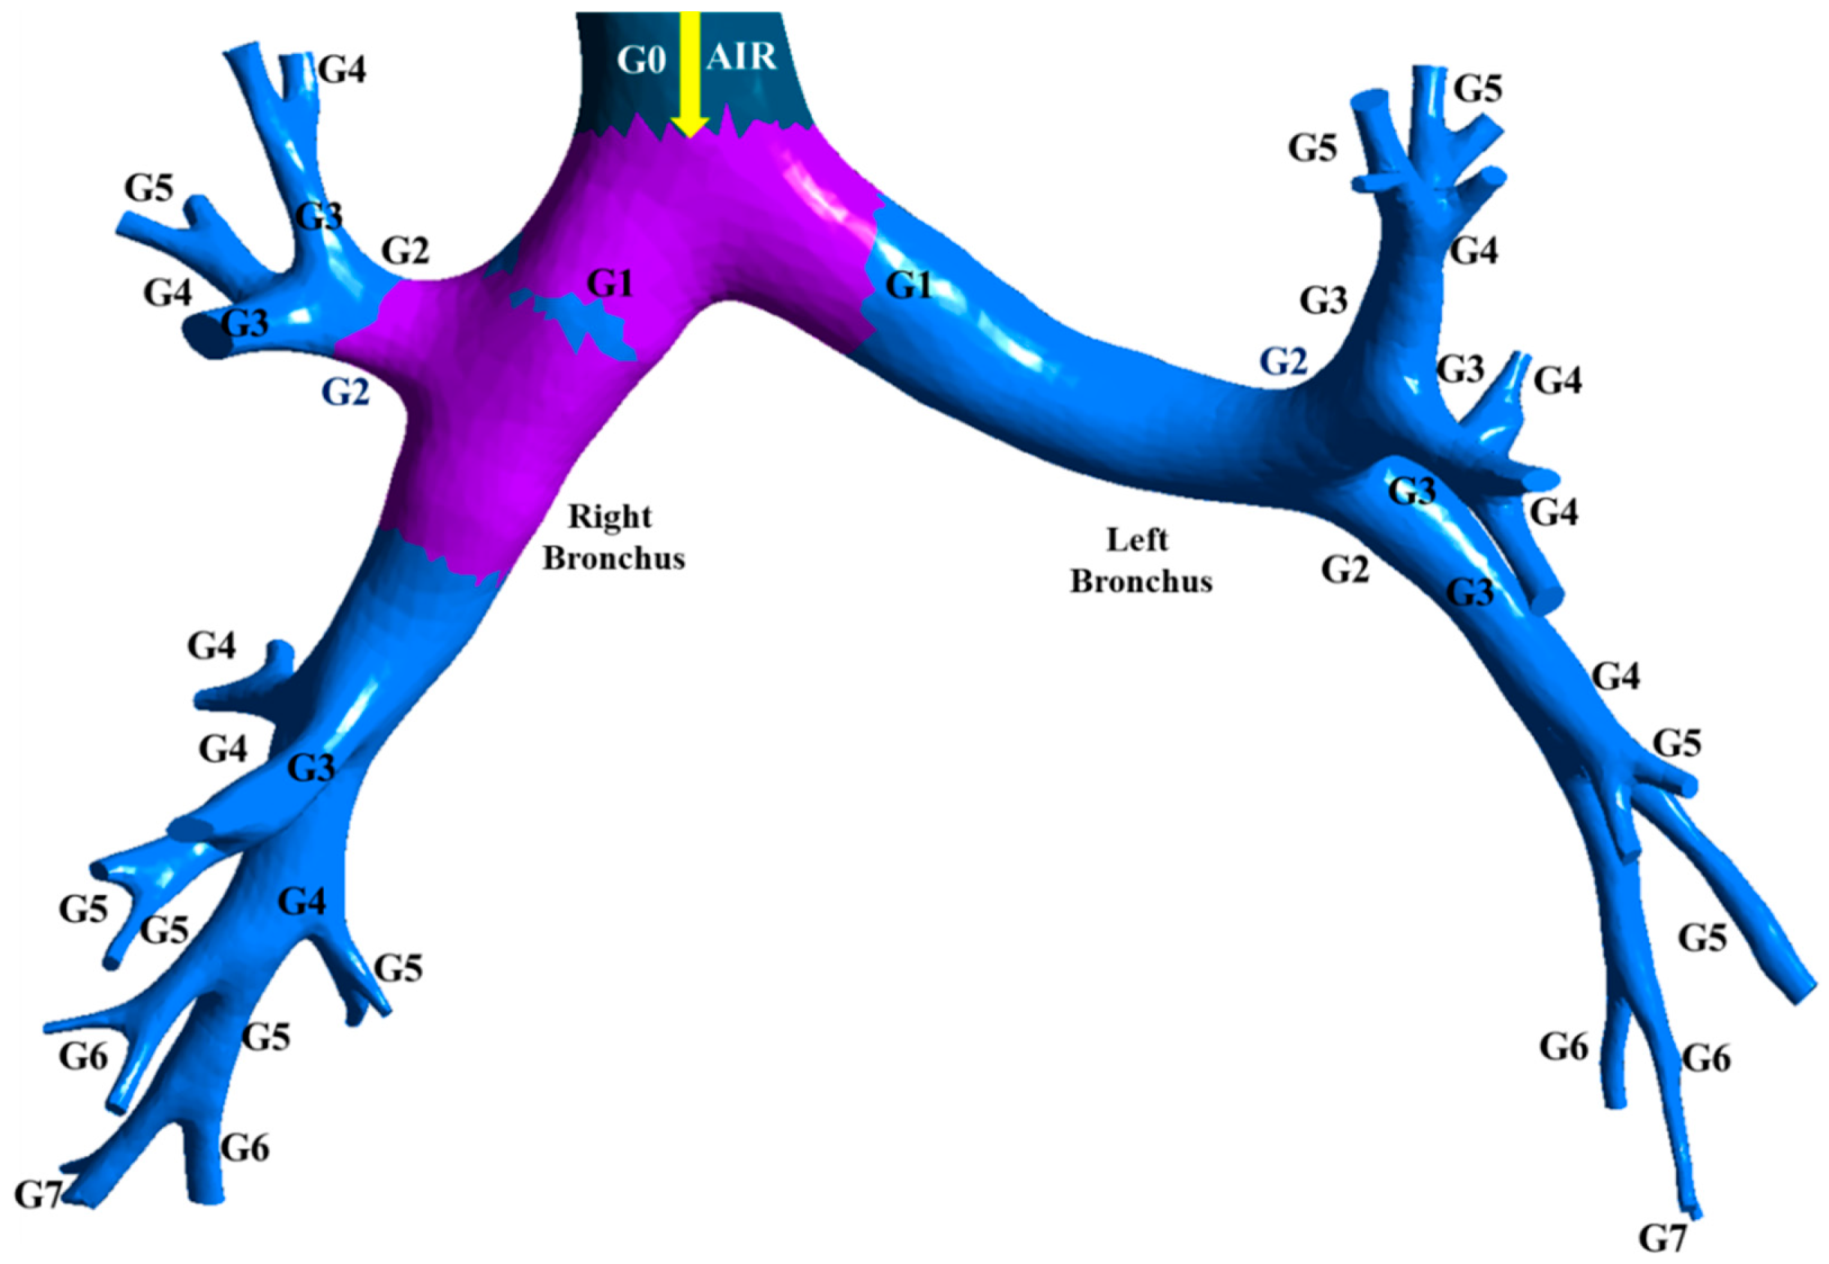
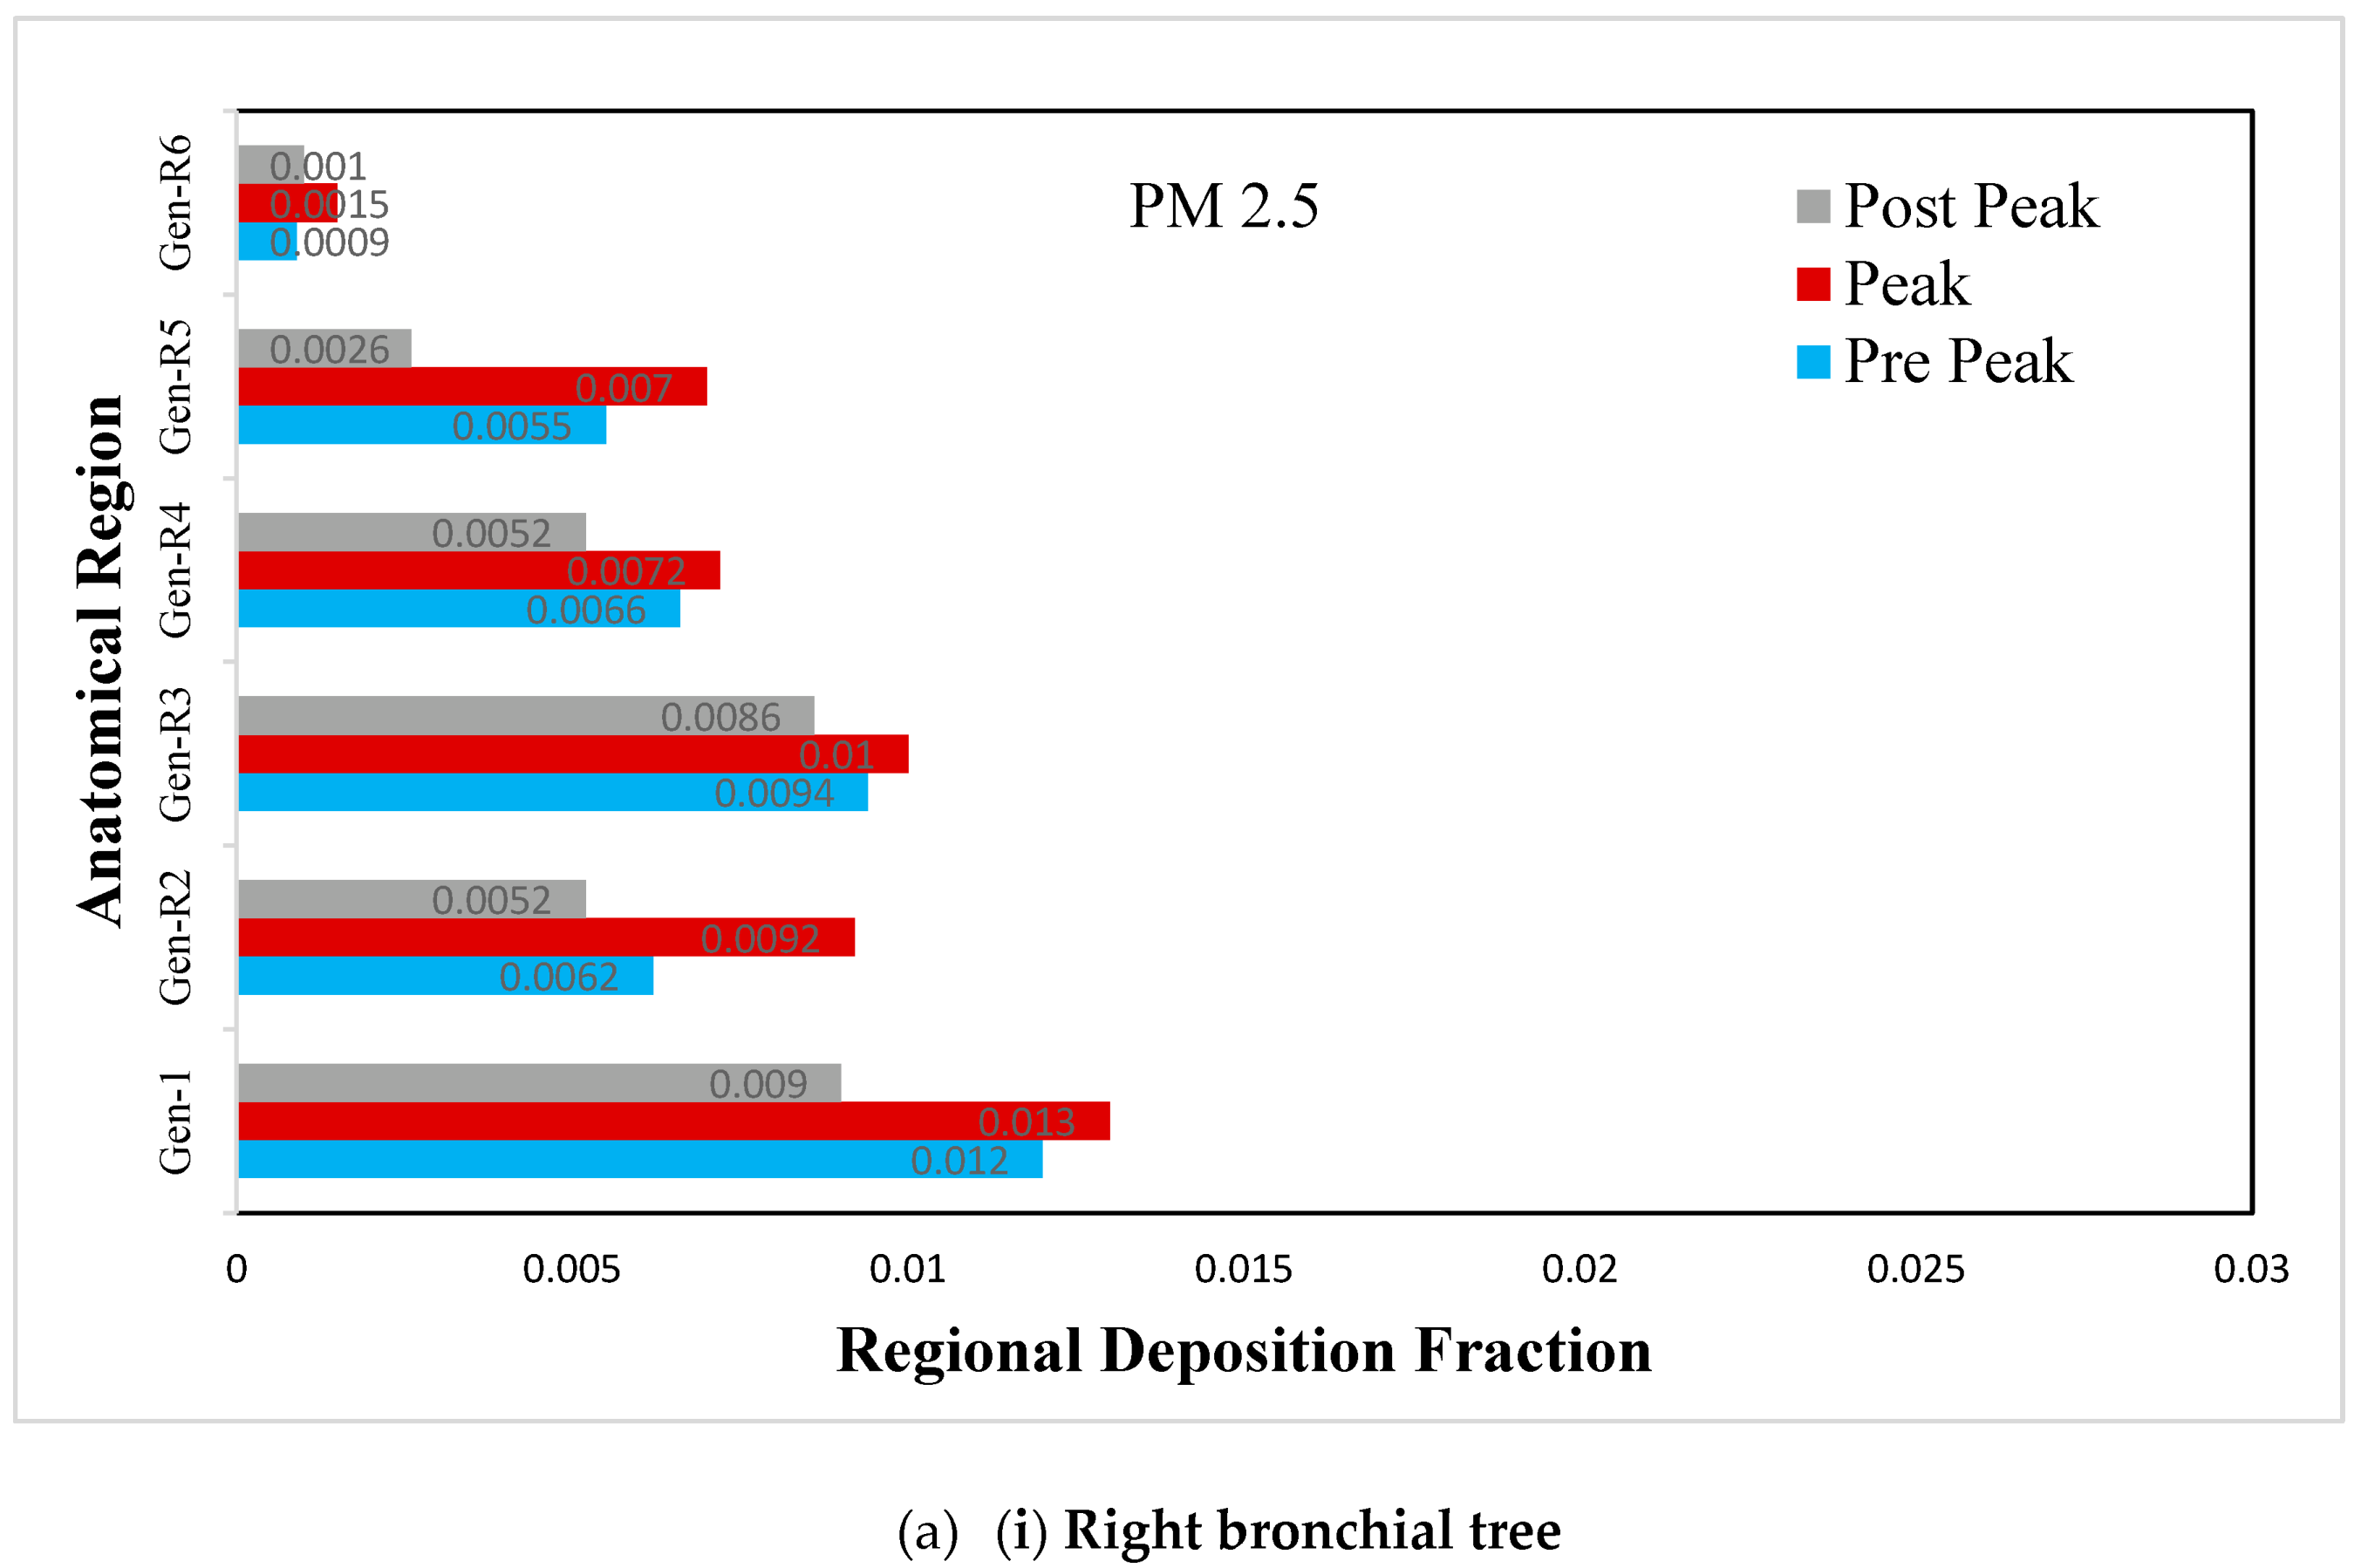
The three-dimensional tracheo-bronchial airways model marked with various sections is shown in Figure 8. The regional deposition fraction of RSPM (PM2.5 and PM10) in the left and right bronchial trees under light and moderate inspirations are presented in Figure 9 and Figure 10.
The deposition fraction of PM2.5 at different junction zones in the right and left bronchial trees during normal inspiration are presented in Figure 9a. A larger deposition is observed at peak inhalation than off-peak inhalation, depending upon the inhalation velocity. The difference in the RDF pattern between the left and right bronchial trees occurs because of asymmetry.
The deposition fraction of PM2.5 at different junction zones in the right and left bronchial trees during moderate inspiration is presented in Figure 9b. The RDF at subsequent junction zones reduces continuously in the right and left bronchial trees. Furthermore, a larger deposition is observed at peak inhalation compared with off-peak inhalation, depending upon the inhalation velocity at that time.
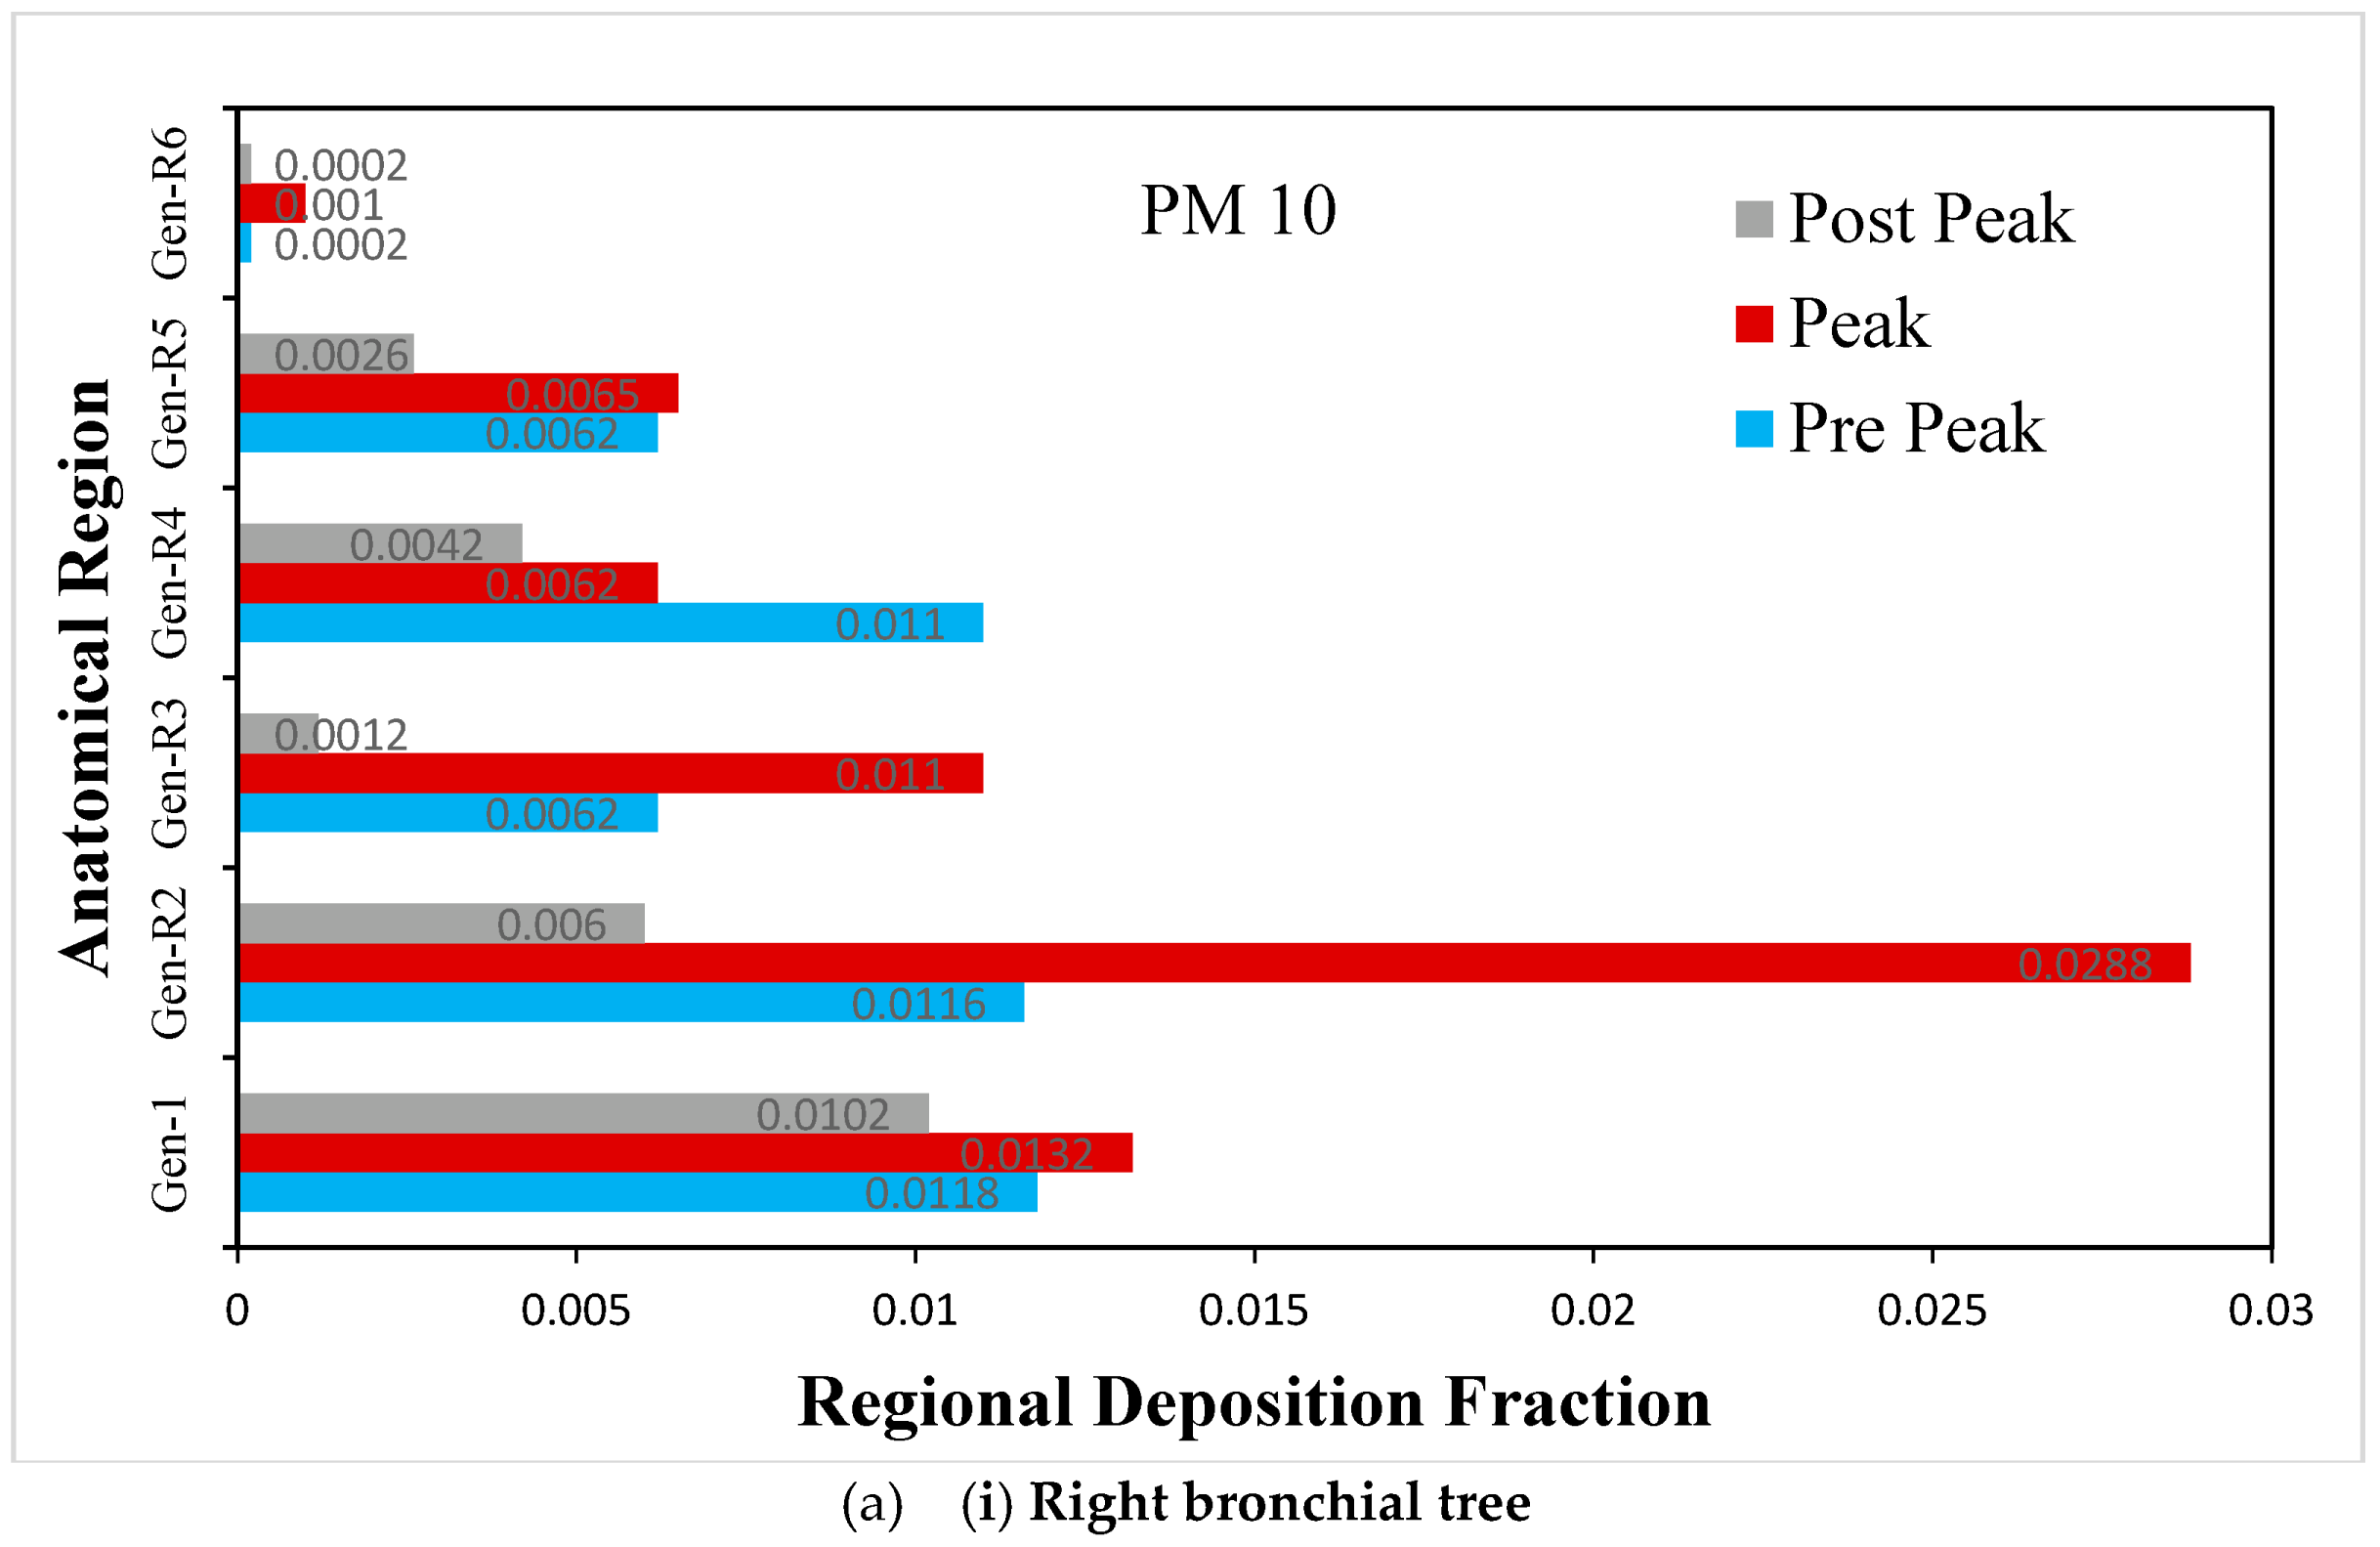
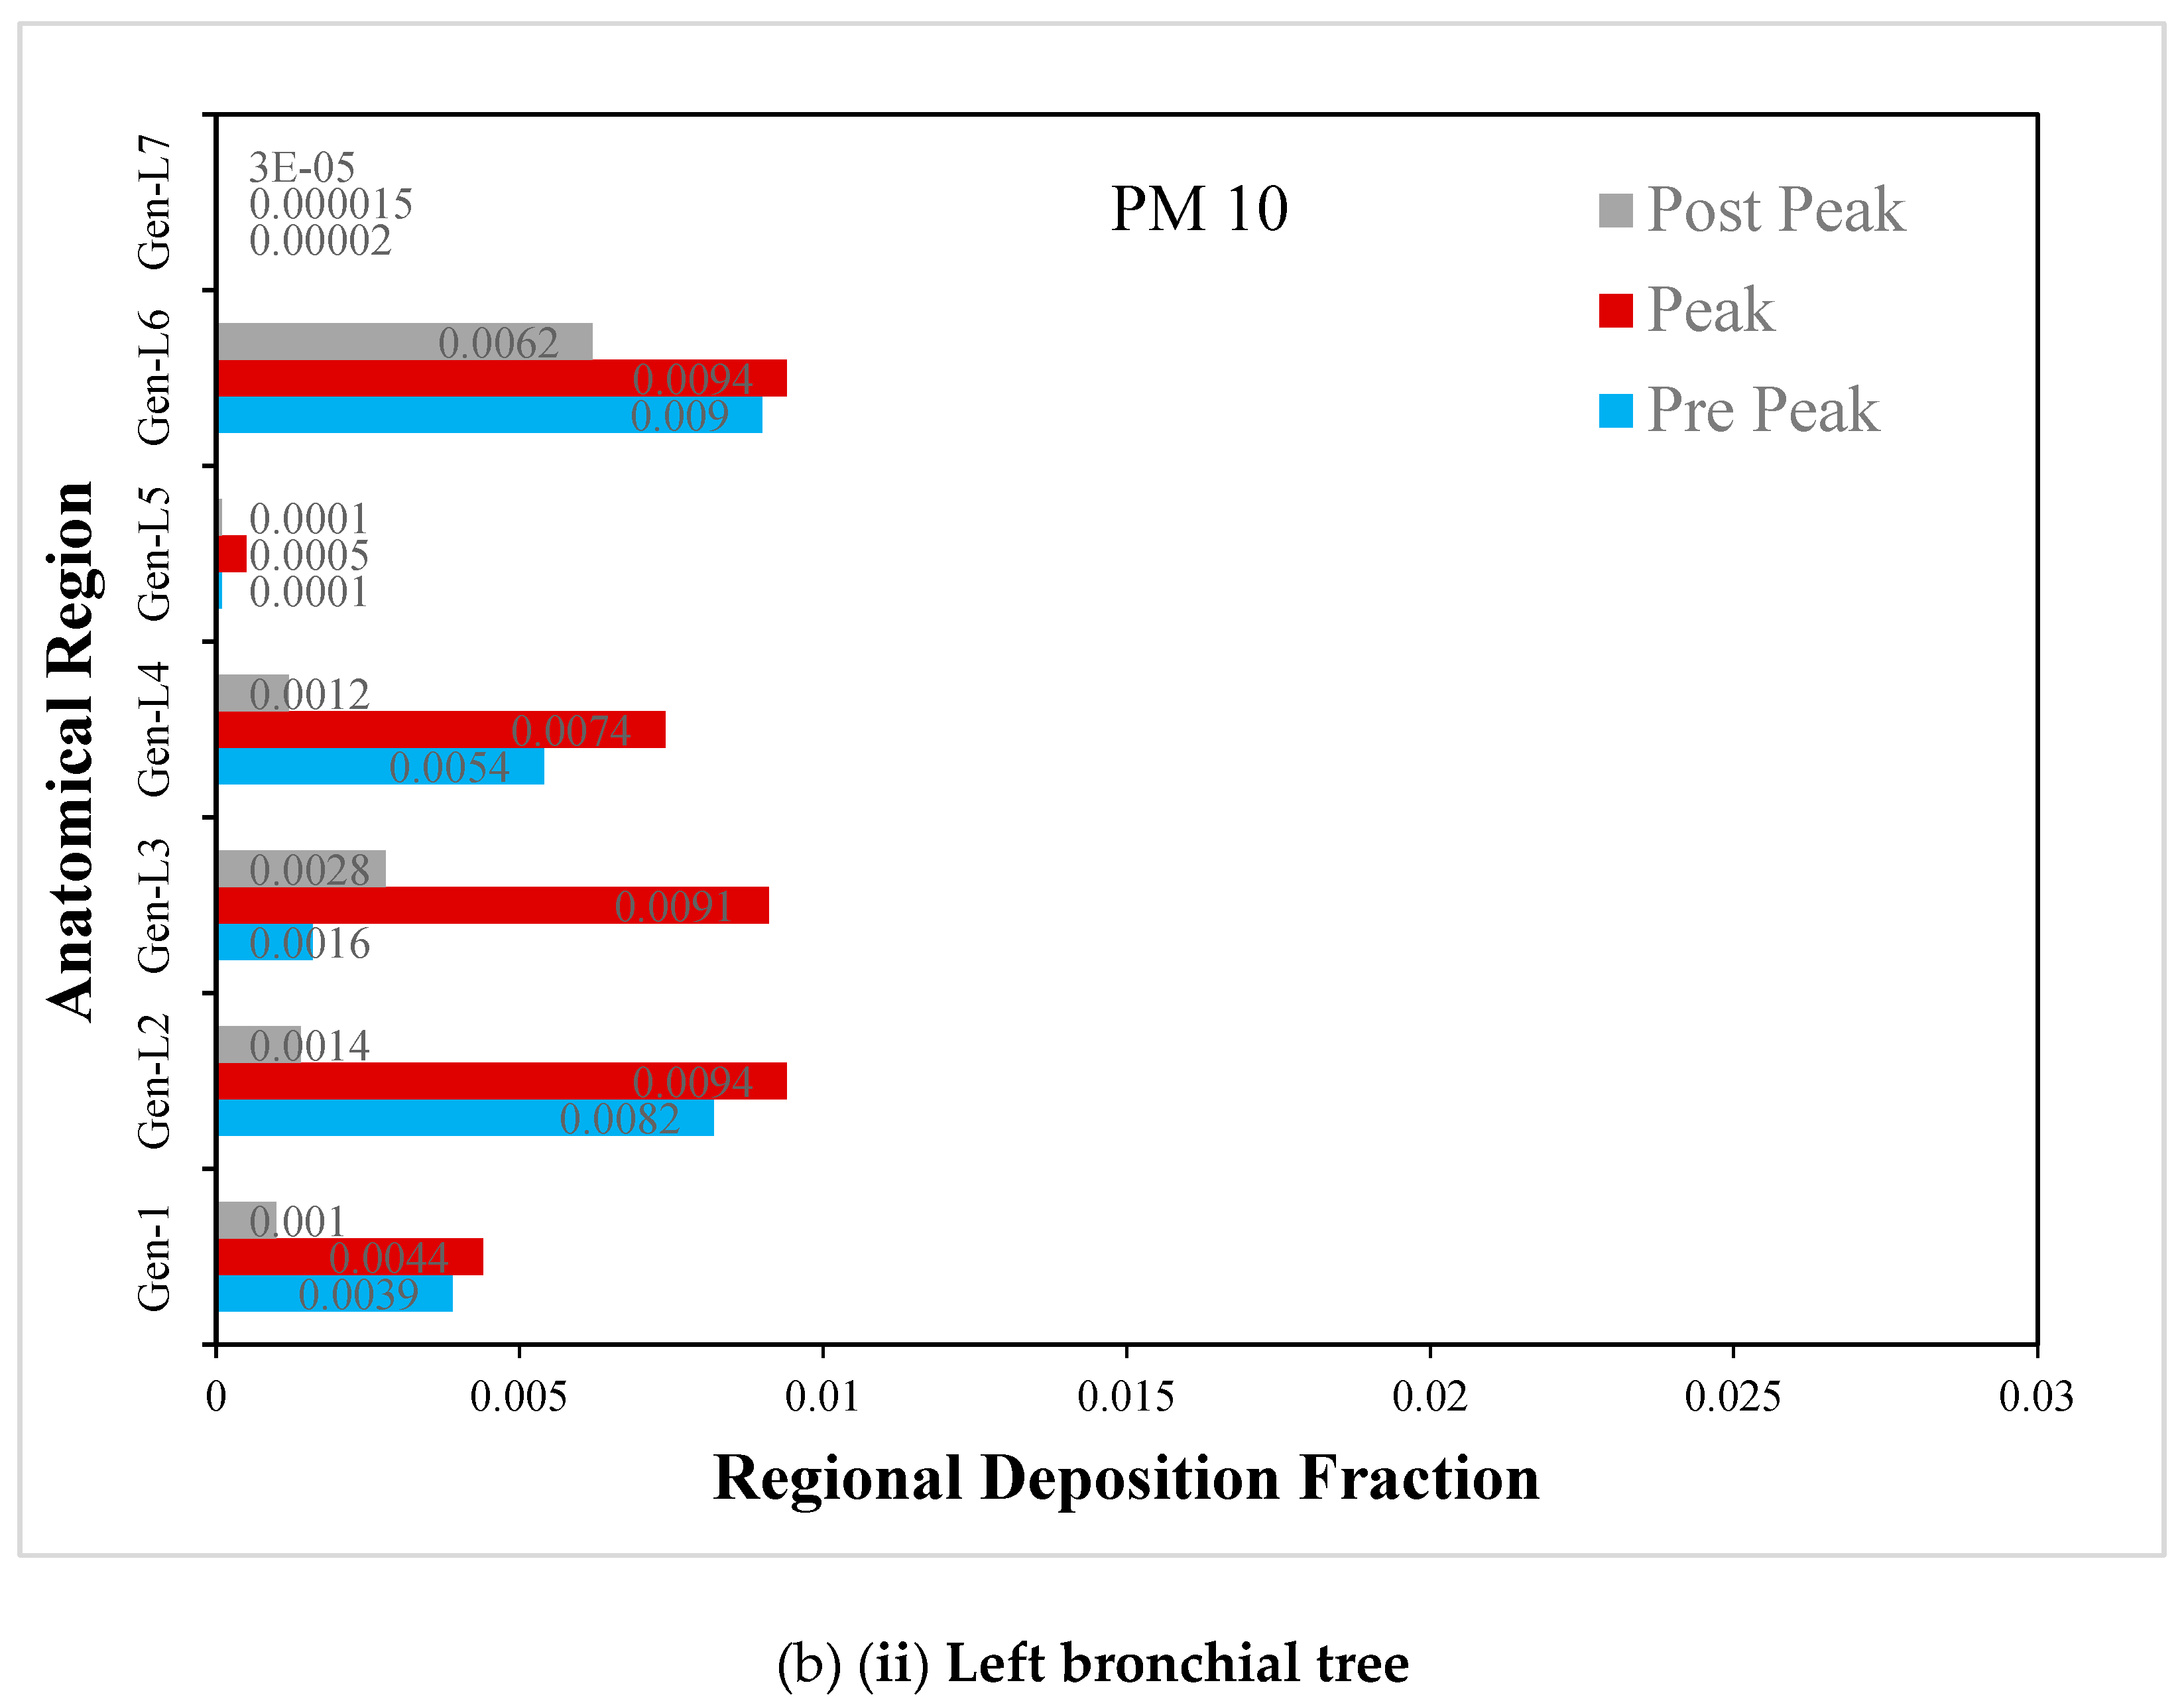
The deposition fraction of PM10 at different junction zones in the right and left bronchial trees during normal inspiration is presented in Figure 10a. The larger deposition is observed at peak inhalation as compared with off-peak inhalation, depending upon the inhalation velocity at that time
The deposition fraction of PM10 at different junction zones in the right and left bronchial trees during moderate inspiration is presented in Figure 10b. The larger deposition is observed at peak inhalation compared with off-peak inhalation, depending on the inhalation velocity at that time.
The numerical results show the significant influence of the breathing rate, the anatomical structure of the human airways and the sizes of the inspired particles on RSPM deposition.
6. Conclusions
A realistic human airway model was considered to study respiratory suspended particulate matter (PM2.5 and PM10) transport and deposition for natural air breathing with RSPM corresponding to an unhealthy AQI (300 μg/m3). The conclusions drawn from the computational results are summarized as follows.
- The RSPM transport analysis shows the presence of a large number of PM10 before the nasal valve, revealing that the nasal valve acts effectively as a prime defence mechanism against PM10 during normal breathing. However, it fails to do so effectively for PM2.5 and PM10 at moderate breathing.
- The RSPM deposition results reveal that the nasal cavity is quite effective in depositing PM10 and preventing it from entering the respiratory system. Significant differences were observed in the transport and deposition patterns of PM2.5 and PM10. Significant differences were also observed in the RSPM transport and deposition patterns in the right and left bronchial airways.
- The primary mechanism of particle deposition is attributed to inertial impact. Therefore, it is primarily governed by the particle size (particle diameter-d) and then by the airflow velocity (or volumetric flow rate-Q), according to the impaction parameter (d2Q).
- The present CFD study was not extended to computationally capture the deposition of PM2.5 and PM10 beyond seventh generation bronchi and the subsequent penetration of these particles in the blood stream through alveoli region of the human lungs due to the fact that it requires molecular dynamics simulation, and hence is beyond the scope of present study. The interested authors may however refer to the related literature [63,64].
Author Contributions
Conceptualization, A.R.P. and A.J.; methodology, A.R.P. and S.C.S.; software, A.R.P. and S.C.S.; validation, A.R.P.; formal analysis, A.R.P. and A.J.; investigation, A.R.P.; writing—original draft preparation, A.R.P.; writing—review and editing, S.C.S. and A.J.; visualization, A.R.P.; project administration, S.C.S. and A.R.P. All authors have read and agreed to the published version of the manuscript.
Funding
This research received no external funding.
Institutional Review Board Statement
Not applicable.
Data Availability Statement
All data produced from the simulations are used in the manuscript.
Conflicts of Interest
The authors declare no conflict of interest.
References
- Schlesinger, B. Biological Disposition of Airborne Particles: Basic Principles and Application to Vehicular Emissions. In Air Pollution, the Automobile, and Public Health; Watson, A.Y., Bates, R.R., Kennedy, D., Eds.; National Academy Press: Washington, DC, USA, 1988; ISBN 0-309-56826-9. [Google Scholar]
- National Research Council. Committee on the Epidemiology of Air Pollutants. In Epidemiology and Air Pollution; National Academy Press: Washington, DC, USA, 1985; p. 224. [Google Scholar]
- Belis, C.A.; Dingenen, R.V.; Klimont, Z.; Dentener, F. Scenario analysis of PM2.5 and ozone impacts on health, crops and climate with TM5-FASST: A case study in the Western Balkans. J. Environ. Manag. 2022, 319, 115738. [Google Scholar] [CrossRef] [PubMed]
- Hulin, M.; Simoni, M.; Viegi, G.; Annesi-Maesano, I. Respiratory health and indoor air pollutants based on quantitative exposure assessments. Eur. Respir. J. 2012, 40, 1033–1045. [Google Scholar] [CrossRef] [PubMed] [Green Version]
- Paul, A.R.; Khan, F.; Jain, A.; Saha, S.C. Deposition of smoke particles in human airways with realistic waveform, Special issue on Heat Wave, Bush Fire and Air-Quality: Impacts on Respiratory Health. Atmosphere 2021, 12, 912. [Google Scholar] [CrossRef]
- Hystad, P.; Demers, P.A.; Johnson, K.C.; Carpiano, R.M.; Brauer, M. Long-term residential exposure to air pollution and lung cancer risk. Epidemiology 2013, 24, 762–772. [Google Scholar] [CrossRef] [PubMed]
- Hvidtfeldt, U.A.; Severi, G.; Andersen, Z.J.; Atkinson, R.; Bauwelinck, M.; Bellander, T.; Boutron-Ruault, M.-C.; Brandt, J.; Brunekreef, B.; Cesaroni, G.; et al. Long-term low-level ambient air pollution exposure and risk of lung cancer—A pooled analysis of 7 European cohorts. Environ. Int. 2021, 146, 106249. [Google Scholar] [CrossRef]
- Gupta, S.K.; Elumalai, S.P. Size-segregated particulate matter and its association with respiratory deposition doses among outdoor exercisers in Dhanbad City, India. J. Air Waste Manag. Assoc. 2017, 67, 1137–1145. [Google Scholar] [CrossRef]
- Ching, J.; Kajino, M. Aerosol mixing state matters for particles deposition in human respiratory system. Sci. Rep. 2018, 8, 8864. [Google Scholar] [CrossRef] [Green Version]
- Milanzi, E.B.; Koppelman, G.H.; Smit, H.A.; Wijga, A.H.; Oldenwening, M.; Vonk, J.M.; Brunekreef, B.; Gehring, U. Air pollution exposure and lung function until age 16 years: The PIAMA birth cohort study. Eur. Respir. J. 2018, 52, 1800218. [Google Scholar] [CrossRef] [Green Version]
- Xu, C.; Zhang, M.; Chen, W.; Jiang, L.; Chen, C.; Qin, J. Assessment of Air Pollutant PM2.5 Pulmonary Exposure Using a 3D Lung-on-Chip Model. ACS Biomater. Sci. Eng. 2020, 6, 3081–3090. [Google Scholar] [CrossRef]
- Yang, Z.; Liu, Q.; Liu, Y.; Guo, Q.; Shan, Y.; Cheng, Z.; Zhong, Z. The Effects of Indoor Air Filter on Reductions in PM2.5 Associated Health Risks of Respiratory Function in Mouse. Atmosphere 2022, 13, 1005. [Google Scholar] [CrossRef]
- Miller, L.; Xu, X. Ambient PM2.5 Human Health Effects—Findings in China and Research Directions. Atmosphere 2018, 9, 424. [Google Scholar] [CrossRef] [Green Version]
- Ratajczak, A.; Badyda, A.; Czechowski, P.O.; Czarnecki, A.; Dubrawski, M.; Feleszko, W. Air Pollution Increases the Incidence of Upper Respiratory Tract Symptoms among Polish Children. J. Clin. Med. 2021, 10, 2150. [Google Scholar] [CrossRef] [PubMed]
- Weibel, E.R. Morphometry of the Human Lung; Academic Press: New York, NY, USA, 1963. [Google Scholar]
- Srivastav, V.K.; Jain, A.; Paul, A.R.; Joshi, S. CFD Modelling of Airflow in Human Respiratory System. In Proceedings of the 9th International Conference on Mechanical Engineering (ICME-2011), Dhaka, Bangladesh, 18–20 December 2011. Paper Code: ICME11-FL-09. [Google Scholar]
- Kim, S.K.; Chung, S.K. Investigation on the respiratory airflow in human airway by PIV. J. Vis. 2009, 12, 259–266. [Google Scholar] [CrossRef]
- Im, S.; Heo, G.E.; Jeon, Y.J.; Sung, H.J.; Kim, S.K. Tomographic PIV measurements of flow patterns in a nasal cavity with geometry acquisition. Exp. Fluids 2014, 55, 1644. [Google Scholar] [CrossRef]
- Li, C.; Jiang, J.; Dong, H.; Zhao, K. Computational modeling and validation of human nasal airflow under various breathing conditions. J. Biomech. 2017, 64, 59–68. [Google Scholar] [CrossRef]
- Oldham, M.J. Computational fluid dynamic predictions and experimental results for particle deposition in an airway model. Aerosol Sci. Technol. 2000, 32, 61–71. [Google Scholar] [CrossRef]
- Gurman, J.L.; Lippmann, M.; Schlesinger, R. Particle deposition in replicate casts of the human upper tracheobronchial tree under constant and cyclic inspiratory flow, I. Experimental. Aerosol Sci. Technol. 1984, 3, 245–252. [Google Scholar] [CrossRef]
- Phuong, N.L.; Ito, K. Investigation of flow pattern in upper human airway including oral and nasal inhalation by PIV and CFD. J. Build. Environ. 2015, 94, 504–515. [Google Scholar] [CrossRef]
- Mishra, A.; Hicky, A.J.; Rossi, C.; Borchard, G.; Terada, M.; Makino, K.; Fourie, P.B.; Colombo, P. Inhaled drug therapy for treatment of Tuberculosis. J. Tuberc. 2011, 91, 71–81. [Google Scholar] [CrossRef]
- Gorji, M.R.; Pourmehran, O.; Bandpy, M.G.; Gorji, T.B. CFD simulation of airflow behavior and particle transport and deposition in different breathing conditions through the realistic model of human airways. J. Mol. Liq. 2015, 209, 121–133. [Google Scholar] [CrossRef]
- Agarwal, R.; Katiyar, V.K.; Pradhan, P. A mathematical modelling of particle flow in carotid a tree bifurcation. Int. J. Eng. Sci. 2008, 46, 1147–1156. [Google Scholar] [CrossRef]
- Naseri, A.; Shaghaghian, S.; Aboualia, O.; Ahmadi, G. Numerical investigation of transient transport and deposition of micro-particles under unsteady inspiratory flow in human upper airways. J. Respir. Physiol. Neurobiol. 2017, 244, 56–72. [Google Scholar] [CrossRef]
- Wen, J.; Gu, X.; Wang, M.; Jian, G.; Wang, S.; Zheng, G. The effects of injection modes on instantaneous particle deposition in a realistic human nasal cavity. Int. J. Numer. Methods Biomed. Eng. 2017, 33, e02802. [Google Scholar] [CrossRef] [PubMed]
- Vedantan, S.; Patnaik, B.S.V. Efficient numerical algorithm for multiphase field simulation. J. Phys. Rev. 2006, 73, 106–703. [Google Scholar]
- Feng, Y.; Kleinstreuer, C. Micron-particle transport, interactions and deposition in triple lung-airway bifurcations using a novel modeling approach. J. Aerosol Sci. 2014, 71, 1–15. [Google Scholar] [CrossRef]
- Zhang, Z.; Kleinstreuer, C. Transient airflow structures and particle transport in a sequentially branching lung airway model. Phys. Fluids 2002, 14, 862–880. [Google Scholar] [CrossRef]
- Cui, X.; Wu, W.; Gutheilc, E. Numerical study of the airflow structures in an idealized mouth-throat under light and heavy breathing intensities using large eddy simulation. Respir. Physiol. Neurobiol. 2018, 248, 1–9. [Google Scholar] [CrossRef]
- Inthavong, K.; Tian, Z.F.; Li, H.F.; Tu, J.W.; Yang, W.; Xue, C.L.; Li, C.L. A Numerical Study of Spray Particle Deposition in a Human Nasal Cavity. Aerosol Sci. Technol. 2006, 40, 1034–1045. [Google Scholar] [CrossRef]
- Lin, J.; Hu, G.L.; Fan, J.R.; Pan, D. Study on airflow and inhaled particle deposition within realistic human upper respiratory tract. J. Phys. Conf. Ser. 2011, 147, 012067. [Google Scholar] [CrossRef]
- Devdatta, V.K.; Pratibha, S. Numerical simulation of flow structure and deposition of particles in asthmatic airway bifurcation. Int. J. Enhanc. Res. Sci. Technol. Eng. 2012, 1, 1–8. [Google Scholar]
- Shang, Y.D.; Inthavong, K.; Tu, J.Y. Detailed micro-particle deposition patterns in the human nasal cavity influenced by the breathing zone. Comput. Fluids 2013, 114, 141–150. [Google Scholar] [CrossRef]
- Luo, H.Y.; Liu, Y. Particle deposition in a CT-Scanned human lung airway. J. Biomech. 2009, 42, 1869–1876. [Google Scholar] [CrossRef] [PubMed]
- Chen, X.; Feng, Y.; Wenqi, Z.; Sun, B.; Feng, T. Numerical investigation of particle deposition in a triple bifurcation airway due to gravitational sedimentation and inertial impaction. J. Powder Technol. 2017, 323, 284–293. [Google Scholar] [CrossRef]
- Chen, W.-H.; Lee, K.-H.; Mutuku, J.K.; Hwang, C.-J. Flow dynamics and PM2.5 depositions in healthy and asthmatic airways at different inhalation statuses. J. Aerosol Air Qual. Res. 2018, 18, 866–883. [Google Scholar] [CrossRef] [Green Version]
- Pirhadi, M.; Sajadia, B.; Ahmadi, G.; Malekian, D. Phase change and deposition of inhaled droplets in the human nasal cavity under cyclic inspiratory airflow. J. Aerosol Sci. 2018, 118, 64–81. [Google Scholar] [CrossRef]
- Tohidi, R.; Sajadi, B.; Ahmadi, G. The effect of nasal airway obstruction on the dispersion and deposition of inhaled volatile droplets in the human nasal cavity: A numerical study. J. Aerosol Sci. 2020, 150, 105650. [Google Scholar] [CrossRef]
- Calmet, H.; Houzeaux, G.; Vázquez, M.; Eguzkitza, B.; Gambaruto, A.M.; Bates, A.J.; Doorly, D.J. Flow features and micro-particle deposition in a human respiratory system during sniffing. J. Aerosol Sci. 2018, 123, 171–184. [Google Scholar] [CrossRef] [Green Version]
- Dong, J.; Tian, L.; Ahmadi, G. Numerical assessment of respiratory airway exposure risks to diesel exhaust particles. Exp. Comput. Multiph. Flow 2019, 1, 51–59. [Google Scholar] [CrossRef] [Green Version]
- Health Effects Institute (HEI). State of Global Air 2020; Special Report; Health Effects Institute: Boston, MA, USA, 2020; pp. 1–28. Available online: https://www.healthdata.org/policy-report/state-global-air-2020 (accessed on 10 September 2022).
- Zhou, Y.; Cheng, Y.-S. Particle Deposition in a Cast of Human Tracheobronchial Airways. Aerosol Sci. Technol. 2005, 39, 492–500. [Google Scholar] [CrossRef]
- Srivastav, V.K.; Paul, A.R.; Jain, A. Effects of Cartilaginous Rings on Airflow and Particle Transport through Simplified and Realistic Human Upper Respiratory Tracts. Acta Mech. Sin. 2013, 29, 883–892. [Google Scholar] [CrossRef]
- Inthavong, K.; Ma, J.; Shang, Y.; Dong, J.; Chetty, A.S.R.; Tu, J.; Frank-Ito, D. Geometry and airflow dynamics analysis in the nasal cavity during inhalation. J. Clin. Biomech. 2019, 66, 97–106. [Google Scholar] [CrossRef] [PubMed]
- Shang, Y.; Dong, J.; Tiana, L.; Inthavong, K.; Tu, J. Detailed computational analysis of flow dynamics in an extended respiratory airway model. J. Clin. Biomech. 2019, 61, 105–111. [Google Scholar] [CrossRef]
- Srivastav, V.S.; Paul, A.R.; Jain, A. Capturing the wall turbulence in CFD simulation of human respiratory tract. Math. Comput. Simul. 2019, 160, 23–38. [Google Scholar] [CrossRef]
- Kumar, B.; Srivastav, V.K.; Jain, A.; Paul, A.R. Study of numerical schemes for the CFD simulation of human airways. Int. J. Integr. Eng. 2019, 11, 32–40. Available online: https://publisher.uthm.edu.my/ojs/index.php/ijie/article/view/3637 (accessed on 1 October 2022).
- Tiwari, A.; Jain, A.; Paul, A.R.; Saha, S.C. Computational evaluation of drug delivery in human respiratory tract under realistic inhalation. Phys. Fluids 2021, 33, 083311. [Google Scholar] [CrossRef]
- Srivastav, V.K.; Paul, A.R.; Jain, A. Computational fluid dynamics study of airflow and particle transport in third to sixth generation human respiratory tract. Int. J. Emerg. Multidiscip. Fluid Sci. 2011, 3, 227–234. [Google Scholar] [CrossRef]
- Srivastav, V.K.; Jain, A.; Paul, A.R. Computational study of drug delivery in tumorous human airways. Int. J. Comput. Sci. Math. 2019, 10, 459–475. [Google Scholar] [CrossRef]
- Shukla, R.K.; Srivastav, V.K.; Paul, A.R.; Jain, A. Fluid structure interaction studies of human airways. Sādhanā 2020, 45, 229. [Google Scholar] [CrossRef]
- Islam, M.S.; Larpruenrudee, P.; Saha, S.C.; Pourmehran, O.; Paul, A.R.; Gemci, T.; Collins, R.; Paul, G.; Gu, Y. How SARS coronavirus-2 aerosol propagate through the age-specific upper airways? Phys. Fluids 2021, 33, 081911. [Google Scholar] [CrossRef]
- Islam, M.S.; Larpruenrudee, P.; Paul, A.R.; Paul, G.; Gemci, T.; Gu, Y.; Saha, S.C. SARS-CoV-2 Aerosol: How far it can travel to the lower airways? Phys. Fluids 2021, 33, 061903. [Google Scholar] [CrossRef]
- Srivastav, V.K.; Kumar, A.; Shukla, S.K.; Paul, A.R.; Bhatt, A.D.; Jain, A. Airflow and Aerosol-Drug Delivery in a CT Scan based Human Respiratory Tract with Tumor using CFD. J. Appl. Fluid Mech. 2014, 7, 345–356. [Google Scholar] [CrossRef]
- Larpruenrudee, P.; Islam, M.S.; Paul, G.; Paul, A.R.; Gu, Y.T.; Saha, S.C. Model for pharmaceutical aerosol transport through stenosis airway. In Handbook of Lung Targeted Drug Delivery Systems: Recent Trends and Clinical Evidences; Pathak, Y., Islam, N., Eds.; CRC Press: Boca Raton, FL, USA, 2022; Chapter 8; ISBN 9780367490676. [Google Scholar]
- Vanaki, S.M.; Holmes, D.; Saha, S.C.; Chen, J.; Brown, R.J.; Jayathilake, P.G. Muco-ciliary clearance: A review of modelling techniques. J. Biomech. 2020, 99, 109578. [Google Scholar] [CrossRef] [PubMed]
- Saha, S.C.; Francis, I.; Huang, X.; Paul, A.R. Heat Transfer and Fluid Flow Analysis of Realistic 16-Generation Lung. Phys. Fluids 2022, 34, 061906. [Google Scholar] [CrossRef]
- Rios de Anda, I.; Wilkins, J.W.; Robinson, J.F.; Royall, C.P.; Sear, R.P. Modeling the filtration efficiency of a woven fabric: The role of multiple lengthscales. Phys. Fluids 2022, 34, 033301. [Google Scholar] [CrossRef] [PubMed]
- Kelly, J.T.; Asgharian, B.; Kimbell, J.S.; Wong, B.A. Particle deposition in human nasal airway replicas manufactured by different methods. Part I: Inertial regime particles. Aerosol Sci. Technol. 2004, 38, 1063–1071. [Google Scholar] [CrossRef] [Green Version]
- Schroeter, J.D.; Guilherme, J.M.; Julia, G.; Kimbell, S. Effects of surface smoothness on inertial particle deposition in human nasal models. J. Aerosol Sci. 2011, 42, 52–63. [Google Scholar] [CrossRef] [Green Version]
- Hossain, S.I.; Gandhi, N.S.; Hughes, Z.E.; Gu, Y.T.; Saha, S.C. Molecular insights on the interference of simplified lung surfactant models by gold nanoparticle pollutants. Biochim. Biophys. Acta (BBA) Biomembr. 2019, 1861, 1458–1467. [Google Scholar] [CrossRef]
- Hossain, S.I.; Gandhi, N.S.; Hughes, Z.E.; Saha, S.C. Computational modelling of the interaction of gold nanoparticle with lung surfactant monolayer. MRS Adv. 2019, 4, 1177–1185. [Google Scholar] [CrossRef]
Figure 1.
Reconstructed model of the human airway showing the translocatory pathway of RSPM.

Figure 2.
Numerical grid generation in human airways.


Figure 4.
(a) Transport pattern of PM2.5 during normal inspiration. (b) Transport pattern of PM10 during normal inspiration.
Figure 4.
(a) Transport pattern of PM2.5 during normal inspiration. (b) Transport pattern of PM10 during normal inspiration.


Figure 5.
(a) Transport pattern of PM2.5 during moderate inspiration. (b) Transport pattern of PM10 during moderate inspiration.
Figure 5.
(a) Transport pattern of PM2.5 during moderate inspiration. (b) Transport pattern of PM10 during moderate inspiration.


Figure 6.
Regional deposition fraction (RDF) of RSPM in the upper airways at normal inspiration.


Figure 7.
Regional deposition fraction (RDF) of RSPM in the upper airways at moderate inhalation.


Figure 8.
Three-dimensional tracheo-bronchial airways model.

Figure 9.
(a) Regional deposition fraction (RDF) of PM2.5 during normal inspiration, (b) Regional deposition fraction (RDF) of PM2.5 during moderate inspiration.
Figure 9.
(a) Regional deposition fraction (RDF) of PM2.5 during normal inspiration, (b) Regional deposition fraction (RDF) of PM2.5 during moderate inspiration.


Figure 10.
(a) Regional deposition fraction (RDF) of PM10 during normal inspiration, (b) Regional deposition fraction (RDF) of PM10 during moderate inspiration.
Figure 10.
(a) Regional deposition fraction (RDF) of PM10 during normal inspiration, (b) Regional deposition fraction (RDF) of PM10 during moderate inspiration.


Publisher’s Note: MDPI stays neutral with regard to jurisdictional claims in published maps and institutional affiliations. |
© 2022 by the authors. Licensee MDPI, Basel, Switzerland. This article is an open access article distributed under the terms and conditions of the Creative Commons Attribution (CC BY) license (https://creativecommons.org/licenses/by/4.0/).
Share and Cite
MDPI and ACS Style
Paul, A.R.; Jain, A.; Saha, S.C. Exposure Assessment of Air Pollution in Lungs. Atmosphere 2022, 13, 1767. https://0-doi-org.brum.beds.ac.uk/10.3390/atmos13111767
AMA Style
Paul AR, Jain A, Saha SC. Exposure Assessment of Air Pollution in Lungs. Atmosphere. 2022; 13(11):1767. https://0-doi-org.brum.beds.ac.uk/10.3390/atmos13111767
Chicago/Turabian StylePaul, Akshoy Ranjan, Anuj Jain, and Suvash C. Saha. 2022. "Exposure Assessment of Air Pollution in Lungs" Atmosphere 13, no. 11: 1767. https://0-doi-org.brum.beds.ac.uk/10.3390/atmos13111767
Note that from the first issue of 2016, this journal uses article numbers instead of page numbers. See further details here.