Article

Assessment of Coarse, Fine, and Ultrafine Particles in S-Bahn Trains and Underground Stations in Stuttgart

Department of Flue Gas Cleaning and Air Quality Control, Institute of Combustion and Power Plant Technology (IFK), University of Stuttgart, Pfaffenwaldring 23, 70569 Stuttgart, Germany
*
Author to whom correspondence should be addressed.
Submission received: 1 October 2022 / Revised: 6 November 2022 / Accepted: 7 November 2022 / Published: 10 November 2022
(This article belongs to the Special Issue Feature Papers in Air Quality)

Abstract

:
The Stuttgart S-Bahn network comprises six subway lines and is used by approximately 425,000 people on a daily basis. In previous studies in other cities, it was found that subways can be a source and collection point of particulate matter (PM), which is detrimental to human health. This study focused on making an initial assessment of the pollution situation inside the trains and on the underground platforms. Real-time measurements were performed with high time-resolution instruments inside the S-Bahn trains, two underground stations, and two outdoor stations in the Stuttgart subway network in November 2019. Firstly, the variation in concentration inside the train as it traveled through the tunnel was investigated, and it was recurrently observed that the pollutant concentration in the train increased while traveling through the tunnel and then decreased when nearing the tunnel exit. Secondly, the measurement location with the highest particulate matter concentrations was determined. The particulate matter concentrations on underground platforms were higher than those on the train and on the outdoor platforms. In addition, the dominant fraction of the particulate matter measured was in the range of ultrafine particles (UFP). Finally, the wind speed and wind direction data were analyzed in conjunction with specific locations along the platforms. From the wind measurement results, it was assumed that the combined airflows led to higher particle resuspension and particulate matter concentrations in these areas. In conclusion, it was determined that subway users were exposed to higher particle concentrations, particularly UFP (10–116 nm), while standing on underground platforms and when traveling through underground tunnels. It was found that the PNCs inside the train wagons as well as PM and BC mass concentrations increase when passing through the tunnel. Additionally, the average number concentration of UFPs on underground platforms was significantly higher than in other locations by factors of around 1.7 to 1.9 for UFPs and 1.6 to 2 for coarse and fine particles.

1. Introduction

For many people, a considerable amount of the day is typically spent commuting. Considering that road traffic in urban areas is a major source of airborne particulate matter emissions, traveling by public transportation saves energy, produces less pollution, and can reduce commute times. One major mode of public transportation in large cities is subways. Being electric and one of the cleanest public transport systems, they are considered to be environmentally friendly and beneficial in reducing highway traffic congestion. In turn, subways are a powerful tool in reducing energy demand and improving air quality in urban environments [1].
Despite the numerous benefits, it has become more evident that subway systems may have issues related to underground air quality [2]. In several cities around the world, the elevated concentrations of airborne particles measured on subway platforms and in tunnels and trains present a potential health risk to regular commuters and working staff [3,4]. Due to the nature of subway systems, the confined spaces with limited air circulation can lead to an accumulation of air pollutants at a high level. These pollutants are sourced from outdoor air that enters the tunnel and from particulate matter (PM) generated during normal train operation. Previous studies have linked these different generation mechanisms to wear processes from mechanical braking, rail/wheel contact, system electrification and material resuspension due to the turbulence of passing trains, and the movement of passengers [5]. Though other cities have shown elevated contaminant levels, results from different places cannot be directly compared or assumed to be equivalent because of the differences in outdoor environments, measurement methods, and data analyses. In addition, PM concentrations in underground railway systems are also influenced by a variety of factors including the design and length of the stations and tunnels, the age of the subway system, the wheel and rail-track materials and braking mechanisms, the train speed and frequency, the passenger densities, the ventilation and air conditioning systems, and the frequency of cleanings [2].
The air quality in railway systems has been widely investigated in America, Asia, and Europe. The majority of research and attention has been focused on evaluating the degree of pollutant exposure, identifying pollutant chemical compositions, and developing mitigation measures. In previous studies, researchers have identified the main air pollutants in subways to be PM, aromatic hydrocarbons, carbonyls, and airborne bacteria. In addition, the sources of various contaminants have been linked to the wear of railway systems components (i.e., rails, wheels, brake pads) and to the infiltration of outdoor polluted air [6]. To mitigate these risks, the influence of the train ventilation system on the air quality in the train has been investigated. In addition, other factors that could be used as handles to limit the air pollutant levels in the train include service time, ventilation system quality, passenger numbers, platform screen doors, and train speed [7].
Differences in metro system designs have led to a large variation in air pollutant concentrations and hence personal exposure levels. However, multiple studies in Europe have shown that the highest exposure to airborne particles takes place on underground platforms rather than inside the trains or on outdoor platforms [5]. From a study conducted in Paris, the average PM10 and PM2.5 concentrations in the metro system were approximately 5 to 30 times higher than the levels measured on the streets of Paris. It was also found that these PM levels were influenced by the frequency of passing trains and the number of people passing through the station [8]. Another study performed in central Stockholm measured the PM10 and PM2.5 in several metro stations. The results showed that PM10 concentrations at two underground stations far exceeded the outdoor limit value [9]. A study in Milan evaluated the PM1, PM2.5, and PM10 exposure levels for four modes of transportation including walking, cycling, using a car, and taking the metro. The metro mode had the highest PM1, PM2.5, and PM10 concentrations, which were 2 to 4 times higher than the other modes [10]. Finally, a metro air quality study in Barcelona showed that PM concentrations on the underground platforms were approximately 1.3 to 6.7 times higher compared to outdoors, revealing the prevalence of PM on the underground platforms and in the tunnels [1].
Rail vehicle brakes consist of a variety of brake discs and pads with different elemental compositions. There are three main groups of brake pads (metallic, composite, and sintered), each with a very different composition. While the metallic type consists mainly of iron, the sintered type is dominated by copper, and the composite type is mainly carbon. The wheels, on the other hand, can consist of over 96% iron. Carbon, chromium, nickel, copper, and silica are the main trace elements. The results from a study in Norway confirmed that the PM10 fraction in railroad tunnels is characterized by a very high metal content that is dominated by iron. This implies that the abrasion of the metallic components in the system is one of the ways particles are produced. Possible sources of metallic components include brake components, wheels, rails, pantograph, and electric current lines [11].
Several mitigation measures have been developed and applied to reduce pollutant levels on underground platforms and in trains. One measure to reduce PM concentration in the platform areas of subways is to install platform screen doors. A number of studies, mainly in South Korea, have evaluated the effects. After the installation of screen doors, a significant decrease in concentration on the platforms was reported (16% in PM10 and 12% in PM2.5) [8]. However, a major drawback was the significant increase in PM levels inside subway trains, which rose 30% and to even more than 100% on some subway lines [12]. One proposed measure to improve the situation was to use magnetic filters since a large proportion of subway tunnel dust is composed of iron and magnetite. By using this method, removal efficiencies could be up to 56% for PM10, 46% for PM2.5, and 38% for PM1 [12]. Another possible solution involved the ventilation system. Efficient ventilation systems have the ability to maintain indoor air quality and to reduce pollutant entry from the outdoor atmosphere. Thus, it was proposed to synchronize the ventilation system with the daily variation in traffic flow. This could be performed by regulating the time schedule or by implementing sensors and artificial intelligence [8]. The locating of natural ventilation ducts in areas with low air pollution was also of importance. Not only are ventilation systems necessary to ensure healthy air quality in trains but they are also a key factor in maintaining the air quality on the underground platforms. In a study of underground platforms in Barcelona, researchers found that the PM levels in different seasons were influenced by the ventilation system. The measurements in the warmer period (strong ventilation) showed lower concentrations than in the colder period (weak ventilation). They also found that the use of air conditioning inside trains was an effective approach to reducing PM concentrations. The concentrations inside the train were around 15% lower than those on the underground platforms. Both the ventilation and air condoning systems were more efficient in removing coarse particles, resulting in a UFP-dominated fraction in the subway system [1].
Using public transportation, particularly subways, is often promoted as an environmentally friendly way to reduce emissions, save energy, and lessen commute time. While these benefits are easily recognized by subway users, the less apparent risks, such as a higher exposure to PM, especially UFP, while standing on underground platforms and when traveling through underground tunnels, also need to be brought to light.
To determine if the Stuttgart subway system also possessed elevated levels of pollutants, this study was conducted to assess the air quality in S-Bahn trains, on underground and outdoor station platforms. The objectives of this research study were to assess the air quality in the S-Bahn in Stuttgart as well as to determine the temporal and spatial distribution of PM in trains, underground stations, and outdoor stations. Additionally, to examine the influence of airflows on the pollutant concentrations on the underground platforms. To fulfill these objectives, a survey was performed on a 12 km section of the Stuttgart subway system that included an 11 km underground tunnel, the longest in the entire network. Measurements were performed over the course of 11 days in November and were taken at three locations: inside the train as it traveled along the selected route, on two specific underground platforms in the tunnel, and on the two outdoor platforms on opposite ends of the measurement route. A combination of equipment measuring coarse, fine, and ultrafine PM concentrations and size distributions, as well as black carbon (BC) concentration, was used. In addition, wind speed and direction data were also collected on the two underground platforms.

2. Applied Methodology

The purpose of this study was to make an initial assessment of the air quality in the Stuttgart S-Bahn network by comparing the measurements from three locations: inside the train as it traveled along the designated route, on two selected underground platforms, and on two outdoor platforms. The details of the measurement technique are described in the following sections.

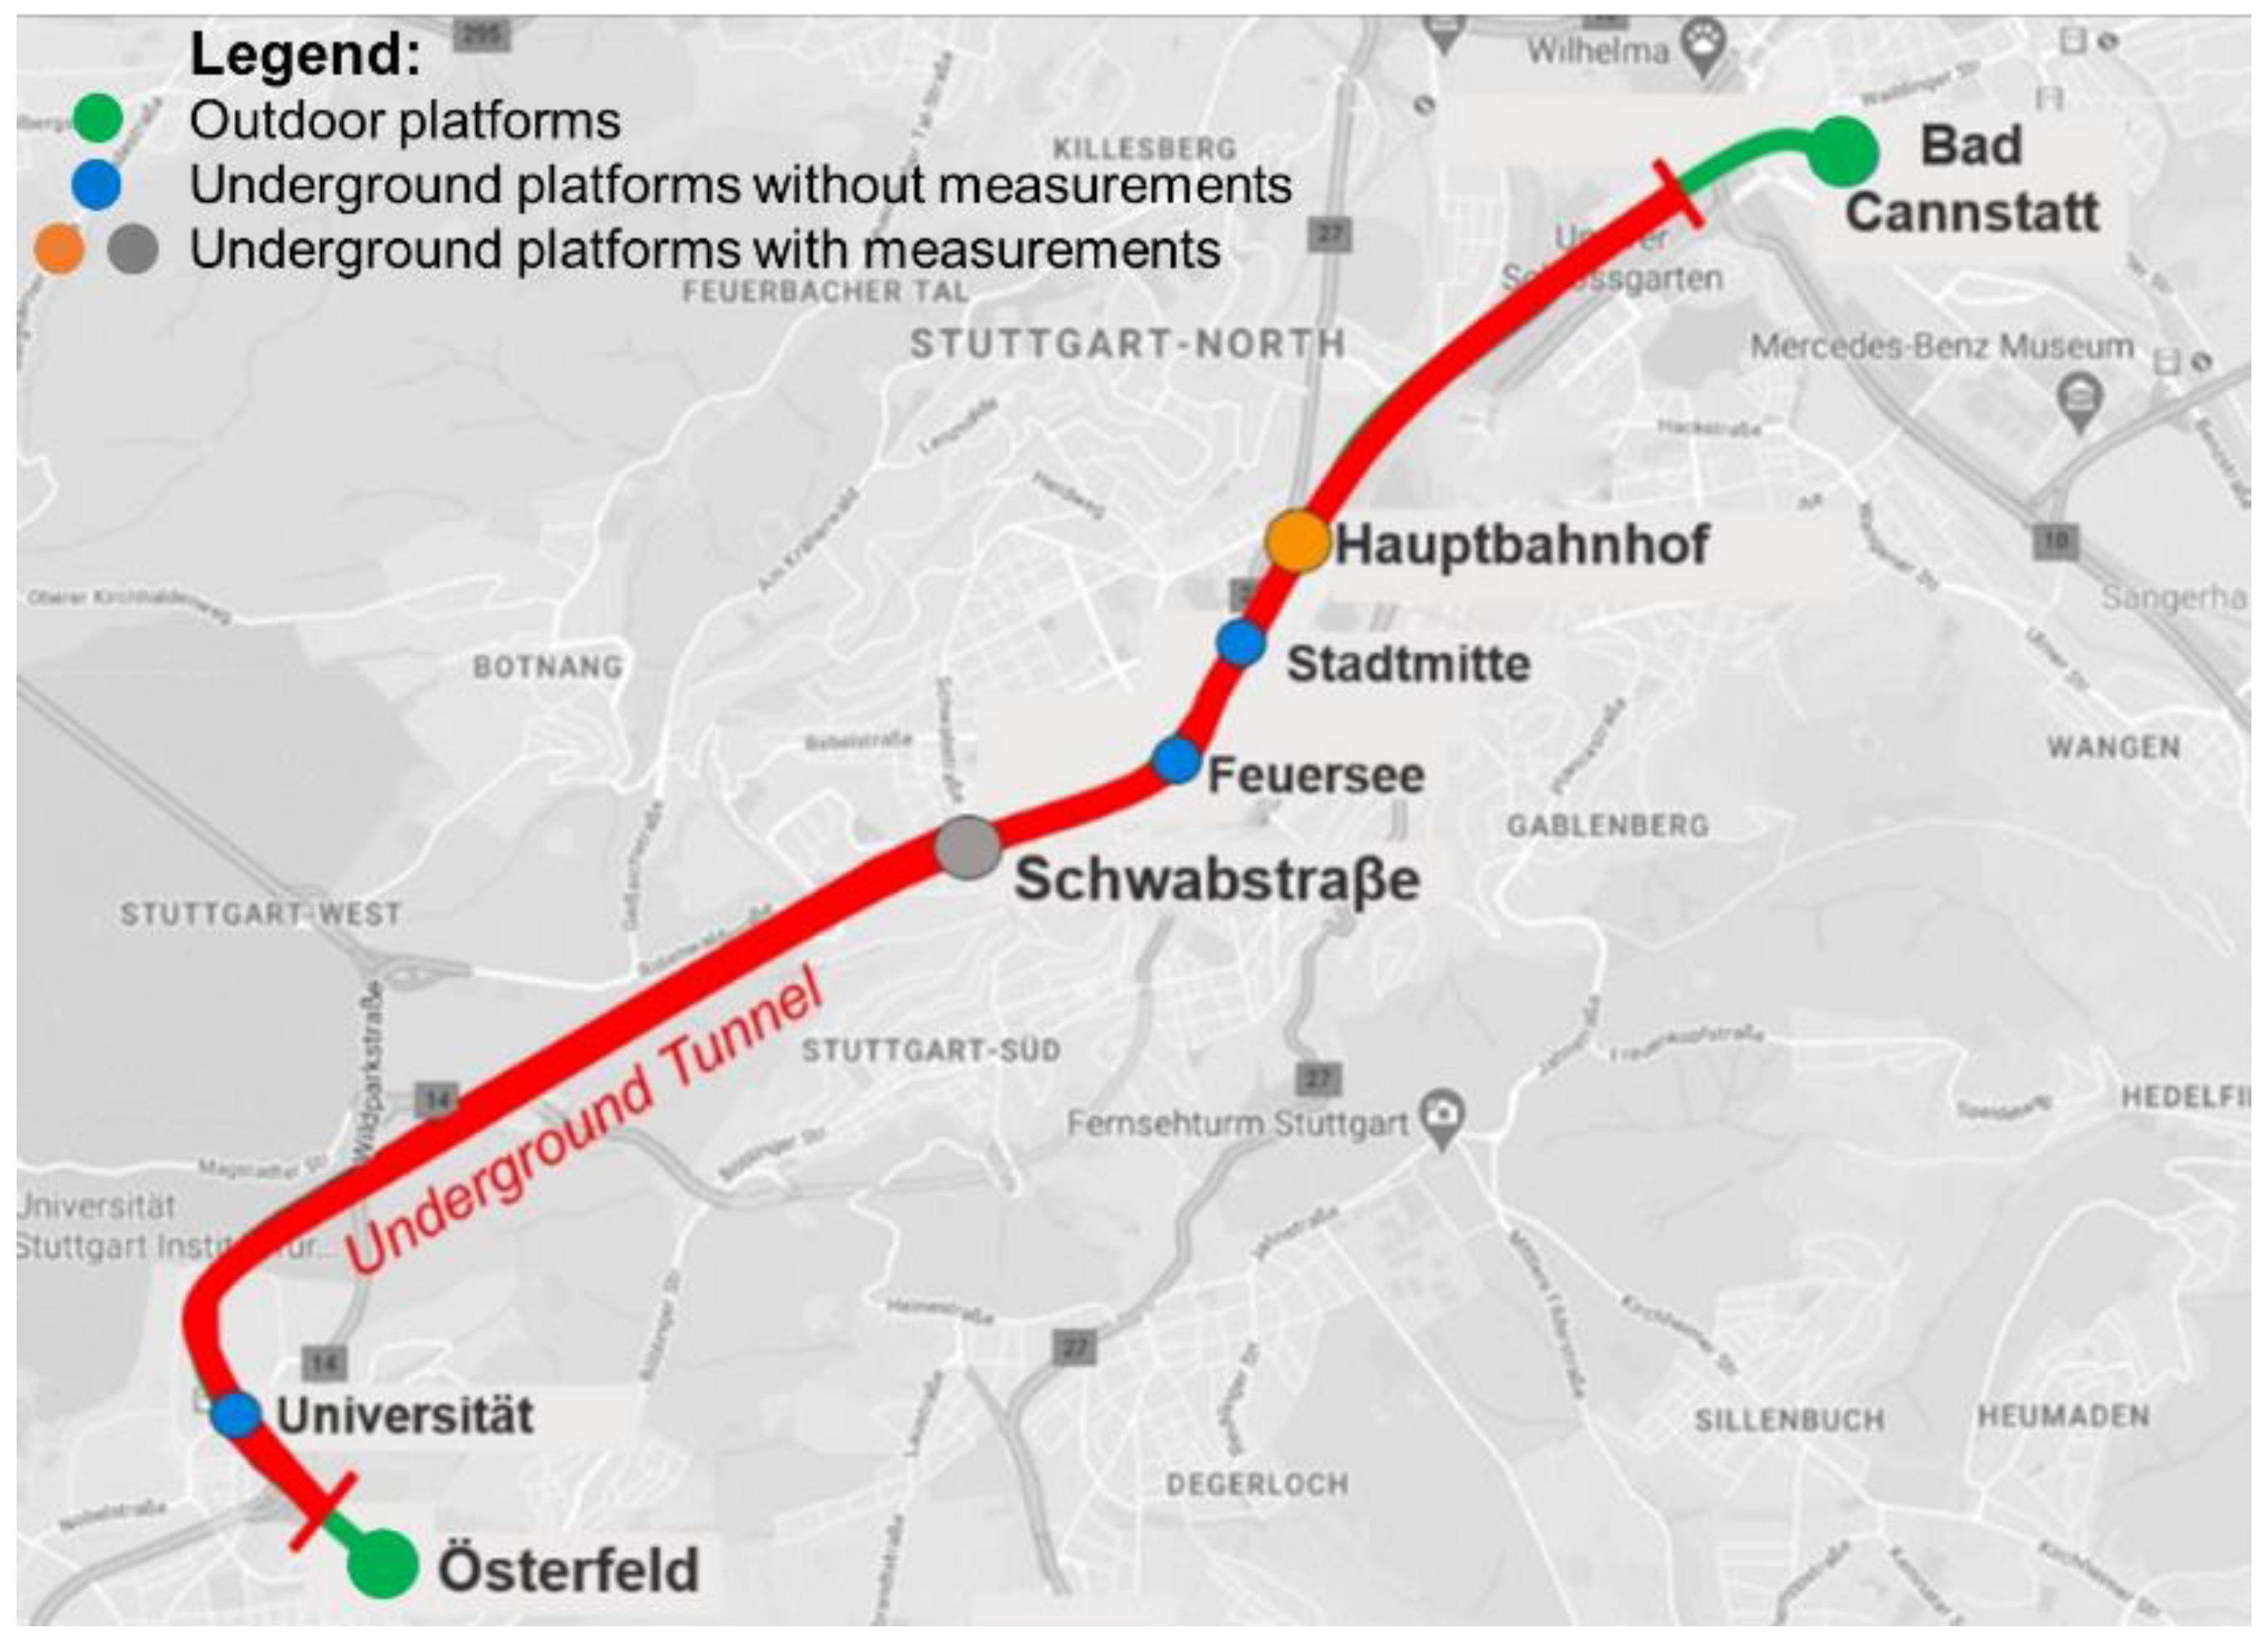
2.1. Measurement Locations

The measurements were carried out simultaneously at three locations. Two of them were for the stationary measurements on two underground platforms, while the third one was for mobile measurements inside the train and on the outdoor platforms.

2.1.1. Train Wagon and Outdoor Platform Measurements

Mobile measurements were conducted on the train to assess the air quality inside the train as it traveled along the route shown in Figure 1. In total, there were seven stations along the route. In the tunnel were five underground stations, two of which were selected for stationary measurements (Schwabstraße and Hauptbahnhof). Stationary measurements were also conducted on the remaining two stations, which were outdoor platforms (Österfeld and Bad Cannstatt) on opposite ends of the route. The measurements taken at the outdoor stations were the basis of comparison for the pollutant levels measured on the underground platforms and in the train.
Many trips back and forth between Österfeld and Bad Cannstatt were undertaken throughout the measurement campaign. When the train arrived at either Österfeld or Bad Cannstatt, the measurements were taken outside the train along the outdoor platform for 20 min. Then, the measurements were continued inside the next train in the opposite direction.

2.1.2. Underground Platforms

Stationary measurements were conducted on two underground platforms, Hauptbahnhof (HBF) and Schwabstraße. Hauptbahnhof was selected as it is one of the busiest underground stations in Stuttgart, while Schwabstraße, although it is less busy than Hauptbahnhof, was also of interest because of its high train frequency. On the underground platforms, six specific positions were measured: two positions near the four tunnel openings and two locations towards the center of the platform. During each day of measurements, all six positions were measured for approximately 45 min to 1 h.

2.2. Measurement Devices and Protocol

A variety of instruments were used in this study, which covered the PM size range from UFP to coarse particle sizes, as well as particle distribution. A summary of the devices used can be seen in Table 1.

2.2.1. Particle Counters

Three particle counter models were employed. One model was the Scanning Mobility Particle Sizer + Condensate Particle Counter (SMPS + CPC) NanoScan 3910 (TSI, Shoreview, MN, USA) which measured the particle number concentration (PNC) and particle size distribution (PSD) of UFP. According to the measurement principle, the UFPs are first charged with electricity and then separated in an electric field according to their size. In the next step, the “monodisperse” particles are grown in the so-called saturator with butanol and then are able to be detected by a laser (light-scattering) and counted [13]. In addition, two optical particle counter (OPC) models were used, namely, the Fidas Frog (Palas, Karlsruhe, Germany) and the optical particle sizer (OPS) 3330 (TSI). Both utilized the light scattering principle and measured fine-to-coarse-size particles and size distribution [14,15].

2.2.2. Diffusion Charger

The diffusion charger DiSCmini (testo, Titisee-Neustadt, Germany) was also used to measure the PNC of UFPs. The device functions by first charging the particles with electricity and then measuring the charge with an electrometer. The measured charge and flowrate are then converted to concentration [16].

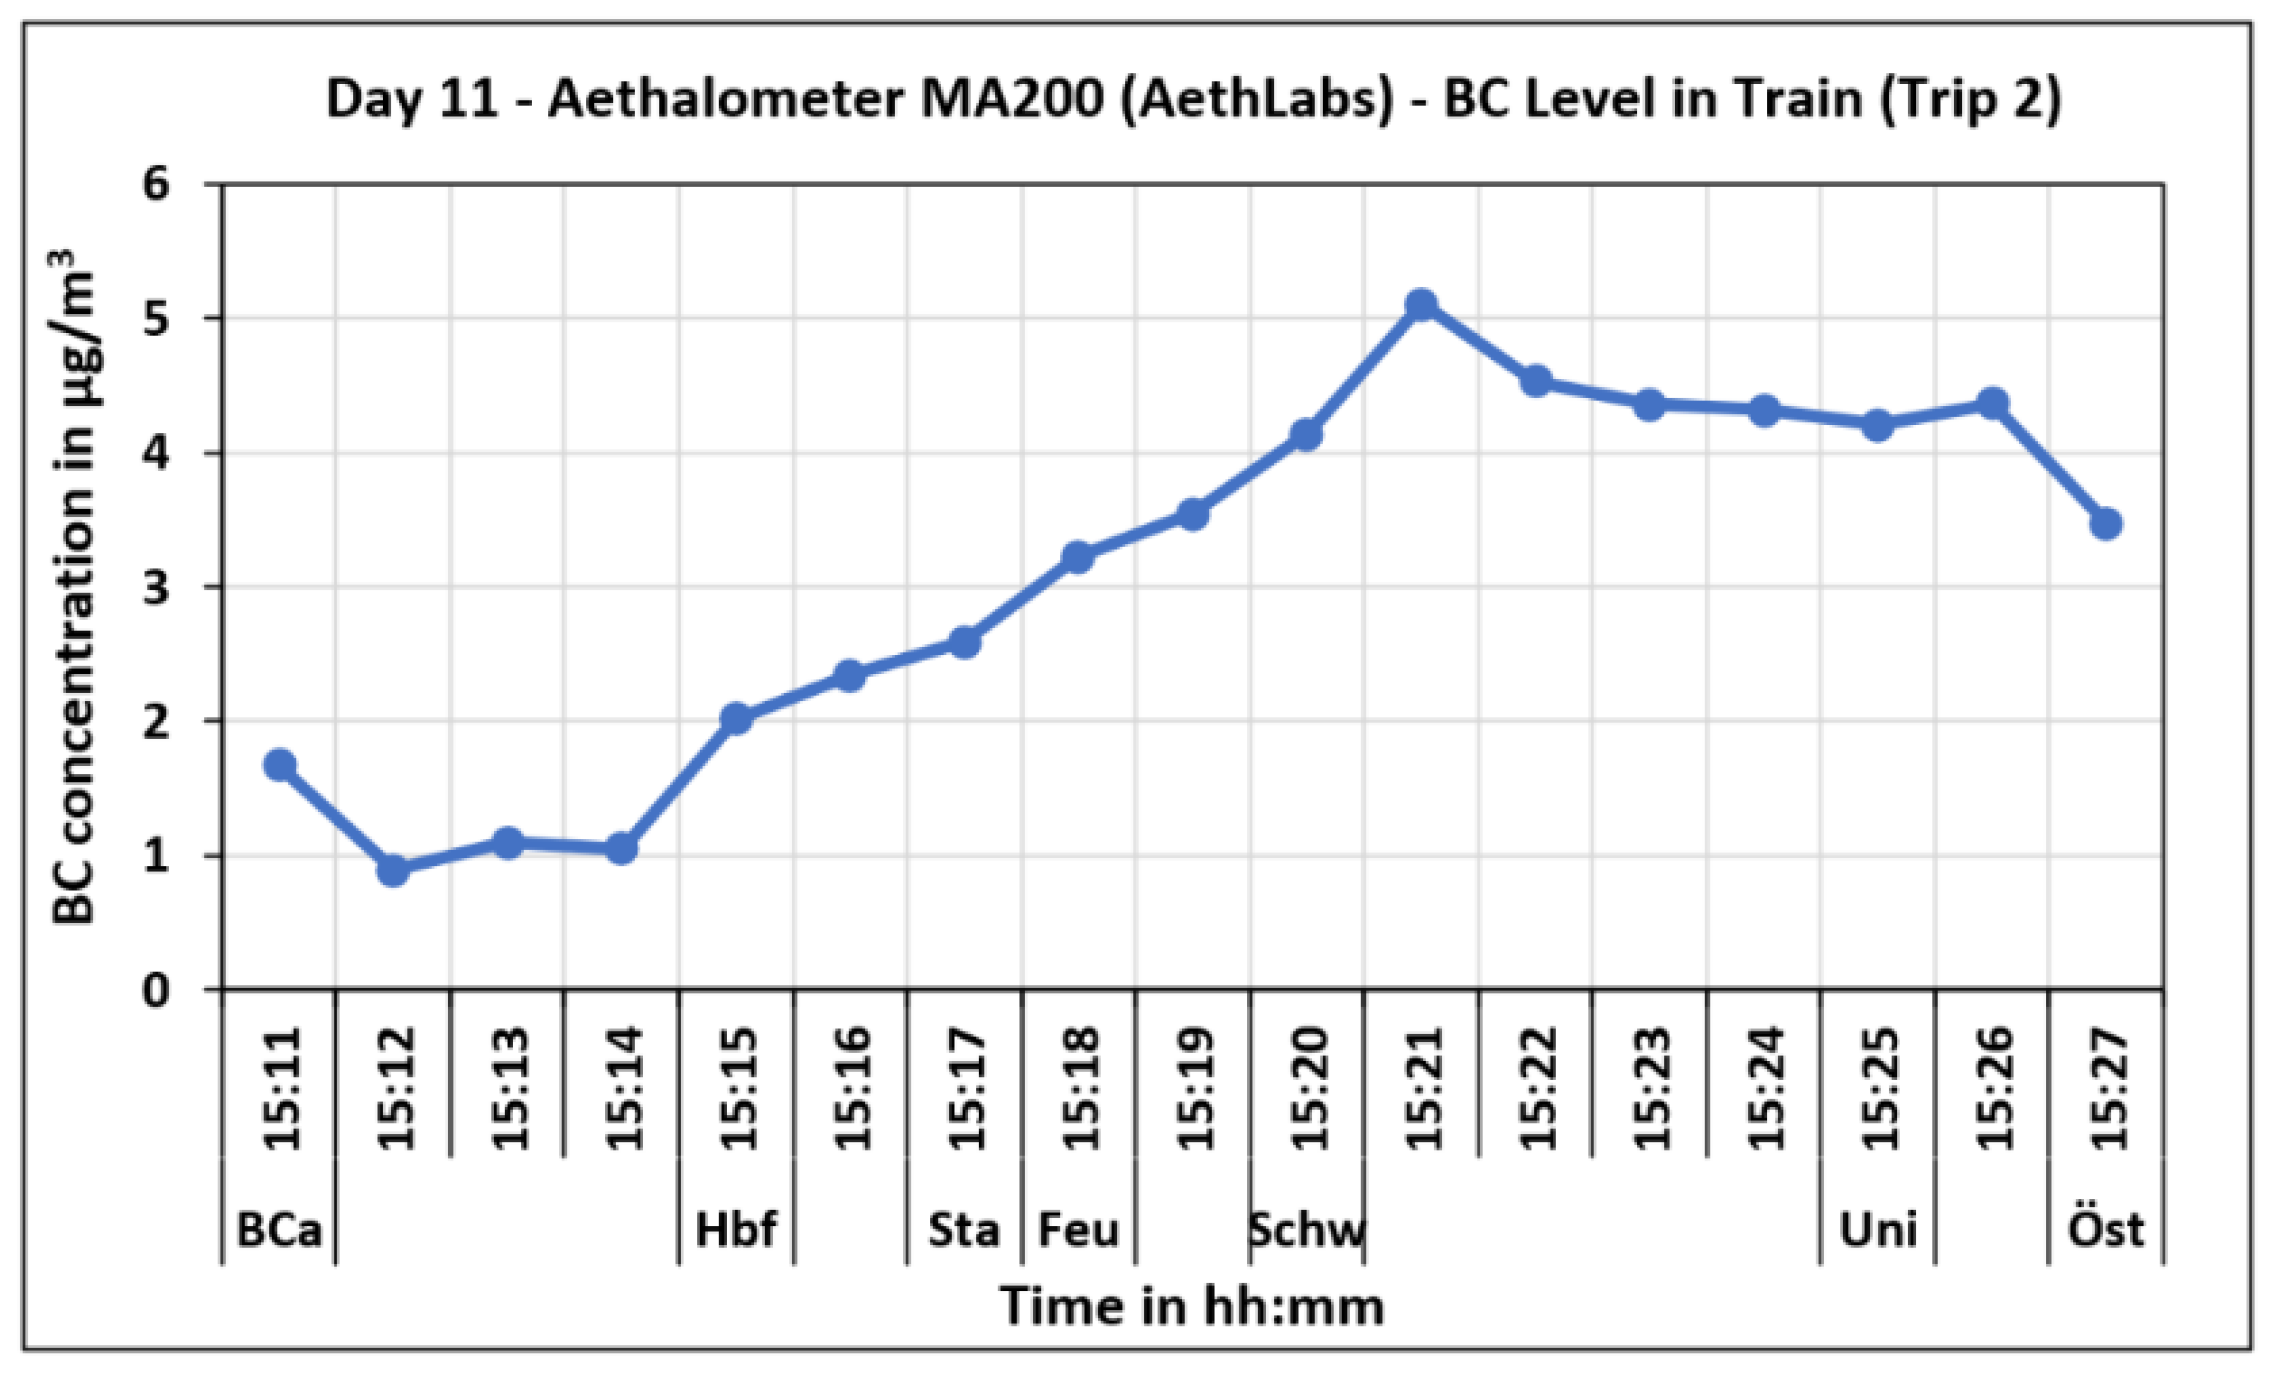
2.2.3. Aethalometers

Two models of BC aethalometers, the AE51 (AethLabs, San Francisco, CA, USA) and the MA200 (AethLabs), were also used since BC is one of the components of PM. Both devices function by collecting particles on a filter while light is transmitted through it. The absorbance is measured (black particles absorb the light much more than particles with other colors or transparent particles) and then converted to concentration [17,18].

2.2.4. Meteorological Devices

In addition to the air pollutant measurement devices, an anemometer ATMOS-22 (METER Environment, Pullman, WA, USA) and a compact weather station MaxiMet GMX501 (Gill Instruments, Lymington, UK) were used to capture the airflow speed and direction [19,20]. These measurements were conducted to assess the influence of airflows on the resuspension of particles along the underground platforms. Finally, HOBO sensors (Onset, Bourne, MA, USA) to measure temperature and humidity were incorporated as well [21].

2.3. Measurement Schedule

The measurement campaign lasted eleven days in November and consisted of four morning and seven afternoon measurement shifts. The duration of the shifts was from 7:30 CET until 13:00 CET in the morning and from 14:30 CET to 19:00 CET in the afternoon. These times were selected to capture peak levels during the train rush hour when the majority of people commute to and from work. Most of the days measured were weekdays. Weekdays were prioritized over weekend days since there is a higher train frequency during the week. In addition, days with Feinstaubalarm (days with high PM concentration were expected) conditions were evaluated to see if a difference could be seen in the measurement results. The measurement campaign plan is shown in Table 2. The time of the shift (Morning/Afternoon) taking place on the day is highlighted with grey color.

2.4. Device Locations

Several models of each device were used to measure at the same time at the different locations during the campaign. While the setup for the stationary measurements on the underground platforms remained fairly consistent, both the setup and the number of devices used for measurements on the train/outdoor stations varied.
On days 1 and 2, the air pollutant devices were loaded onto three carts. Two of the carts included an OPC Fidas Frog (Palas), SMPS + CPC NanoScan (TSI), OPC OPS (TSI), Diffusion Charger—DC (testo DiSCmini), Aethalometer MA200 (AethLabs), and a HOBO (ONSET). One of the carts was used for stationary measurements at Hauptbahnhof, and the other was used for measurements on the train/outdoor stations. The third cart was measured at Schwabstraße and included an Aethalometer AE51 (AethLabs), OPC Fidas Frog (Palas), and a HOBO (ONSET). The Anemometer ATMOS-22 (METER Environment) was also added to the cart at Schwabstraße beginning on day 2. The devices set up for train/outdoor platform measurements on days 1 and 2 can be seen in Figure 2.
For days 3 and 4, the train/outdoor platform measurements were paused due to some unforeseeable circumstances, and only stationary measurements on the Hauptbahnhof and Schwabstraße platforms were conducted. The two carts measuring on the underground platforms included an OPC Fidas Frog (Palas), SMPS + CPC NanoScan (TSI), OPC OPS (TSI), DC DiSCmini (testo), Aethalometer MA200 (AethLabs), and a HOBO (ONSET). In Figure 3, the devices set up for underground platform measurements are shown.
On day 5, the train/outdoor platform measurements were resumed. However, instead of carting the equipment onto the train, “light measurements” were conducted with fewer devices that could easily be carried on and off the train. The “light measurement” devices included the OPC Fidas Frog (Palas), Aethalometer AE51 (AethLabs), and DC DiSCmini (testo). This measurement setup is shown in Figure 4.
The two stationary measurement carts at Hauptbahnhof and Schwabstraße included an OPC Fidas Frog (Palas), SMPS + CPC NanoScan (TSI), OPC OPS (TSI), DC DiSCmini (testo) (at Hauptbahnhof only), Aethalometer MA200 (AethLabs), and a HOBO (ONSET). On day 5, the MaxiMet portable weather station (Gill) was added to the Hauptbahnhof cart.
On day 11, measurements were conducted only on the Hauptbahnhof platform and the train/outdoor platforms. The train/outdoor platform devices included the SMPS + CPC NanoScan (TSI), OPC OPS (TSI), DC DiSCmini (testo), and Aethalometer MA200 (AethLabs). The cart measuring at Hauptbahnhof included the same devices as the previous days. A summary of the device locations throughout the campaign can be seen in Table 3. This measurement plan was established based on the purpose to perform the measurements at the underground platforms as well as outdoor platforms and at the same time measure the pollutant concentrations inside the train. The locations and the distribution of devices on each day were selected on the basis of available resources.

3. Results and Discussion

3.1. Concentration Variation in Train Wagon

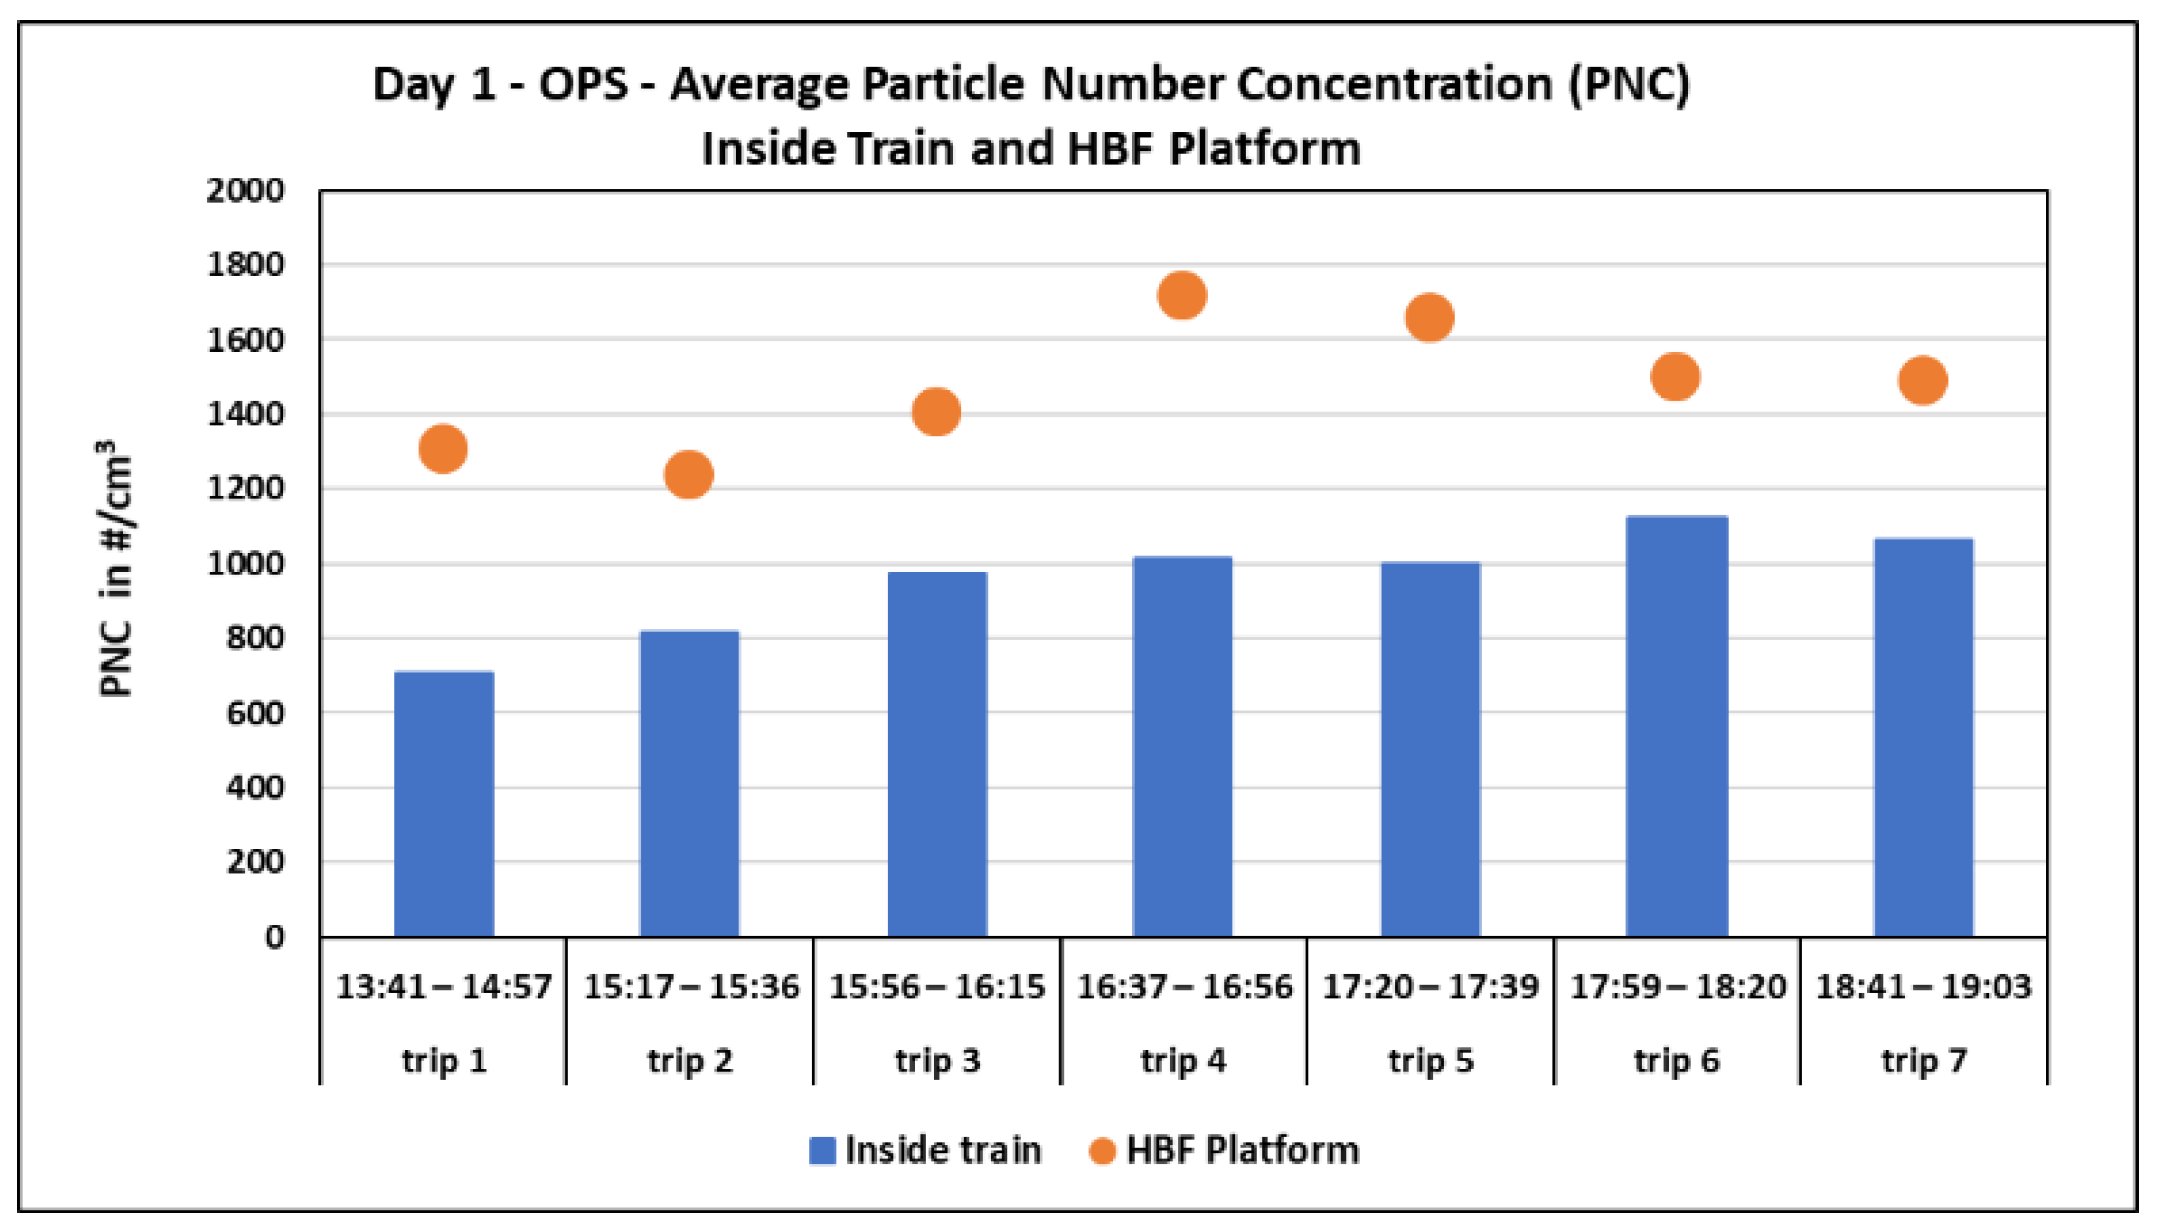
3.1.1. Particle Number Concentration (PNC)

To analyze the variation of the PNC inside the train, the recorded data from all the instruments were evaluated and compared. The purpose was to examine the variations to see if there were patterns between train trips and also if there were commonalities between the instruments covering similar particle size ranges. The train trips to be presented are representative of the entire measurement campaign. Figure 5 shows the variation of the UFP number concentration measured inside the train while passing through the tunnel on two trips on two different days. The PNC presented are 60 s average values from the DC DiSCmini (testo). The minutes at which the train stopped at the underground stations and the doors opened are indicated by the markers on the graphs.
It can be seen that the PNC varied significantly over the two trips. In both cases, the increase in the concentrations is mainly influenced by the air exchange with the air in the tunnel through the air conditioning system and through the doors when they were opened on the underground stations. The exchange through the doors depends on how long the train stops and the doors are opened at the stations. However, the variations occurred differently due to the influence of outside concentrations. For instance, during trip 3 on day 1 shown in Figure 5a, the concentrations on the two outdoor stations were around 4000 #/cm3 which is relatively low compared to the other trips. When entering the train, the PNC slightly decreased as a result of even lower concentrations inside the train. However, when the train entered into the tunnel, the PNC immediately started increasing, reaching the highest level after Feuersee (Feue). Then, there was a decline in particle count as the train traveled towards the exit of the tunnel, particularly in the long section of the tunnel between the Schwabstraße (Schw) and Universität (Uni) stations, towards the exit of the tunnel. On the other hand, during trip 8 on day 11 shown in Figure 5b, the concentrations were higher on both outdoor stations (around 18,000 #/cm3). Therefore, after entering the train, the PNC immediately decreased due to the lower concentrations in this environment and kept decreasing through the first part of the tunnel. After Schwabstraße, the values started increasing station by station, reaching the highest values when the train stopped at Hauptbahnhof (Hbf), the last underground station before going out of the tunnel. In both cases, Figure 5a,b, PNC decreased in the section between Schwabstraße resp. Feuersee and Universität and vice versa, and the PNC increased in the section between Hauptbahnhof and Feuersee resp. Schwabstraße and vice versa.
Figure 6 presents the OPS (TSI) data from the same two trips. The values were averaged over 60 s from the original 1 s data. It can be seen that the values for the larger particles were significantly lower than those of the UFP, but a similar variation occurred. When there are lower concentrations outside as in trip 3 (Figure 6a), the PNC slightly decreased once going into the train and then started increasing after the train entered the tunnel, reaching the highest level after Feuersee. Then, the PNC declined throughout the long section of the tunnel between Schwabstraße and Universität, as the train headed towards the exit of the tunnel. On the contrary, when the concentrations outside were higher, as in trip 8 (Figure 6b), the PNC decreased from the time the train entered the tunnel until Schwabstraße. The values then started increasing station by station, reaching the highest values at Hauptbahnhof. This shows the influence of air exchange through the AC system of the train and the doors at the underground stations on the number of concentrations of coarse and fine particles inside the train.
In addition, it was observed that for all particle modes (Figure 5 and Figure 6), the PNC inside the train tended to decrease throughout the long section of the tunnel between Schwabstraße and Universität. This tunnel section, which leads to the outskirts of the city, seems to be less polluted than the other sections which are within the densely populated city center of Stuttgart.
Figure 7 shows the comparison between the average particle number concentrations of UFP inside the train and on the Hauptbahnhof platform during the same time periods on day 11. Even though the concentration levels inside the train increased when passing through the tunnel, the values on the Hauptbahnhof platform were always significantly higher than those inside the S-Bahn trains. Similar results were observed when comparing the average concentrations of the coarse and fine particles inside the train with those at Hauptbahnhof. As shown in Figure 8, on day 1, the PNC was always lower inside the trains.
Table 4 shows the average PNC of the days when measurements were performed simultaneously inside the train and at Hauptbahnhof. The reported concentrations validate that the concentration levels on the underground platform were higher than the levels inside the trains by a factor ranging from 1.7 to 1.9 for UFP and by a factor of 1.5 for coarse and fine particles. These values are according to the data from the SMPS NanoScan (TSI) and OPS (TSI), respectively.

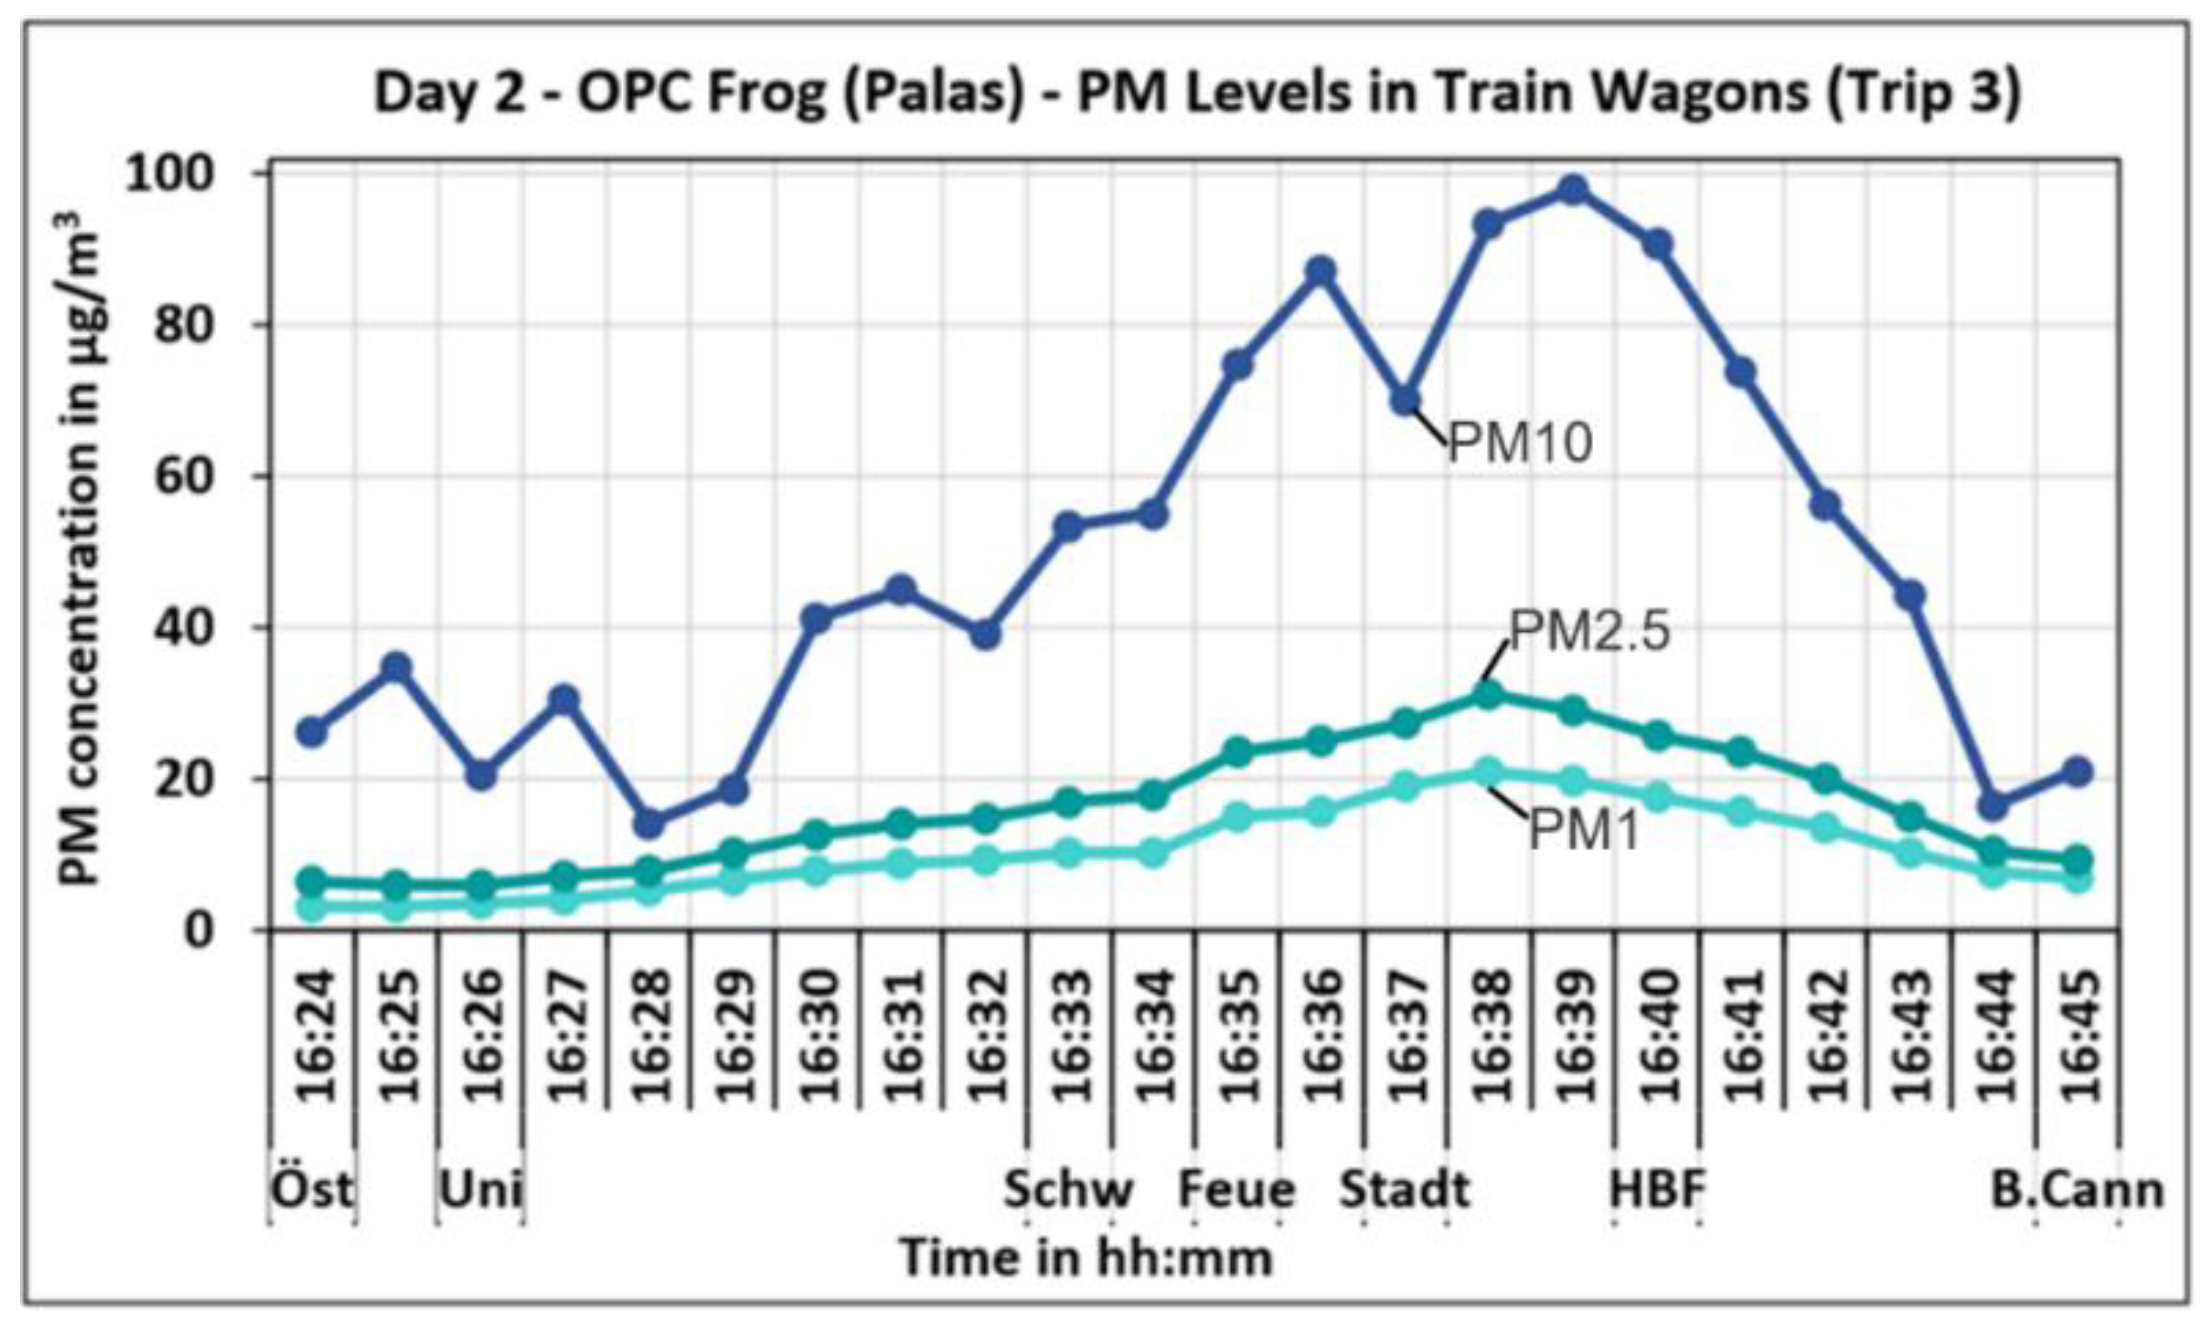
3.1.2. Mass Concentration

The PM concentration in the train was graphed with respect to time to observe how the PM mass concentrations varied inside the train as it traveled through the tunnel. The following PM graphs of the OPC (Palas Fidas Frog) results are composed of 60 s average values. The stations along the measurement route are indicated on the x-axis in addition to the time. From Figure 9, PM1, PM2.5, and PM10 all begin to increase once the train leaves Österfeld, an outdoor station, and enters the underground tunnel. As the train travels to the five underground stations in the tunnel (Universität to Hauptbahnhof), the concentrations in the train increase until they peak between Stadtmitte and Hauptbahnhof. Then, the concentrations decrease as the train nears the exit of the tunnel. When the train travels in the opposite direction (Figure 10) from Bad Cannstatt to Österfeld, again, the concentration inside the train increases in the tunnel. However, the greatest increase in concentration is towards the center of the tunnel at the Feuersee station. These findings were similar to the ones from Martins et al. [1] and Moreno et al. [2].
The PM concentration decreased after the tunnel stations when traveling to Bad Cannstatt as can be seen in Figure 9. An extended trip was performed on day 9 in order to see how the PM concentrations behave while traveling further in the same direction after the Bad Cannstatt station. The measurements were continued to four more stations, i.e., Nürnberger Straße, Sommerrain, Fellbach, until Waiblingen. The results of this extended trip can be seen in Figure 11. The PM concentrations increase as the train moves to the tunnel from Österfeld until the maximum PM10 concentration of around 130 µg/m3 is reached between Stadtmitte and Hauptbahnhof. After that, the PM concentrations showed a decreasing trend, and the minimum PM10 concentration of around 20 µg/m3 was observed in Waiblingen.
Figure 12 depicts the average PM1, PM2.5, and PM10 mobile measurement concentrations inside the train at the minute the train arrived at each station and the doors opened. The box plot includes data from 6 of the 8 days on which OPC (Palas Fidas Frog) measurements were conducted in the train. The remaining 2 days were not considered due to issues with the device. For all the following box plots, note that the x marks on each box plot indicate the average concentration and the horizontal line within the box marks the median value. The number of data samples for all these plots was equal. From the box plot, the highest median concentrations were measured at the Hauptbahnhof, Stadtmitte, and Feuersee stations. Thus, it can be expected that the concentrations will peak at this section in the tunnel regardless of the direction the train is traveling.
As with the PM graphs, from Figure 13 of trip 1 on day 11, as the train travels from Österfeld to Bad Cannstatt, the BC concentration in the train peaks at Hauptbahnhof, the last underground station, before the train exits the tunnel. When the train travels back from Bad Cannstatt to Österfeld (trip 2), the greatest increase in BC occurred when the train passes the underground stations Stadtmitte, Feuersee, and Schwabstraße as shown in Figure 14. This is consistent with the data from the box plots of the overall BC concentrations at each station shown in Figure 15.
The box plot in Figure 15 depicts an average of 1 min values from when the train stopped at each station during mobile measurements. The plot includes data from all 8 days on which BC was measured on the train. From the boxplot, it can be seen that the stations with the highest median values are Stadtmitte, Feuersee, and Schwabstraße, so it is plausible to have the highest increase in concentration when passing these stations.

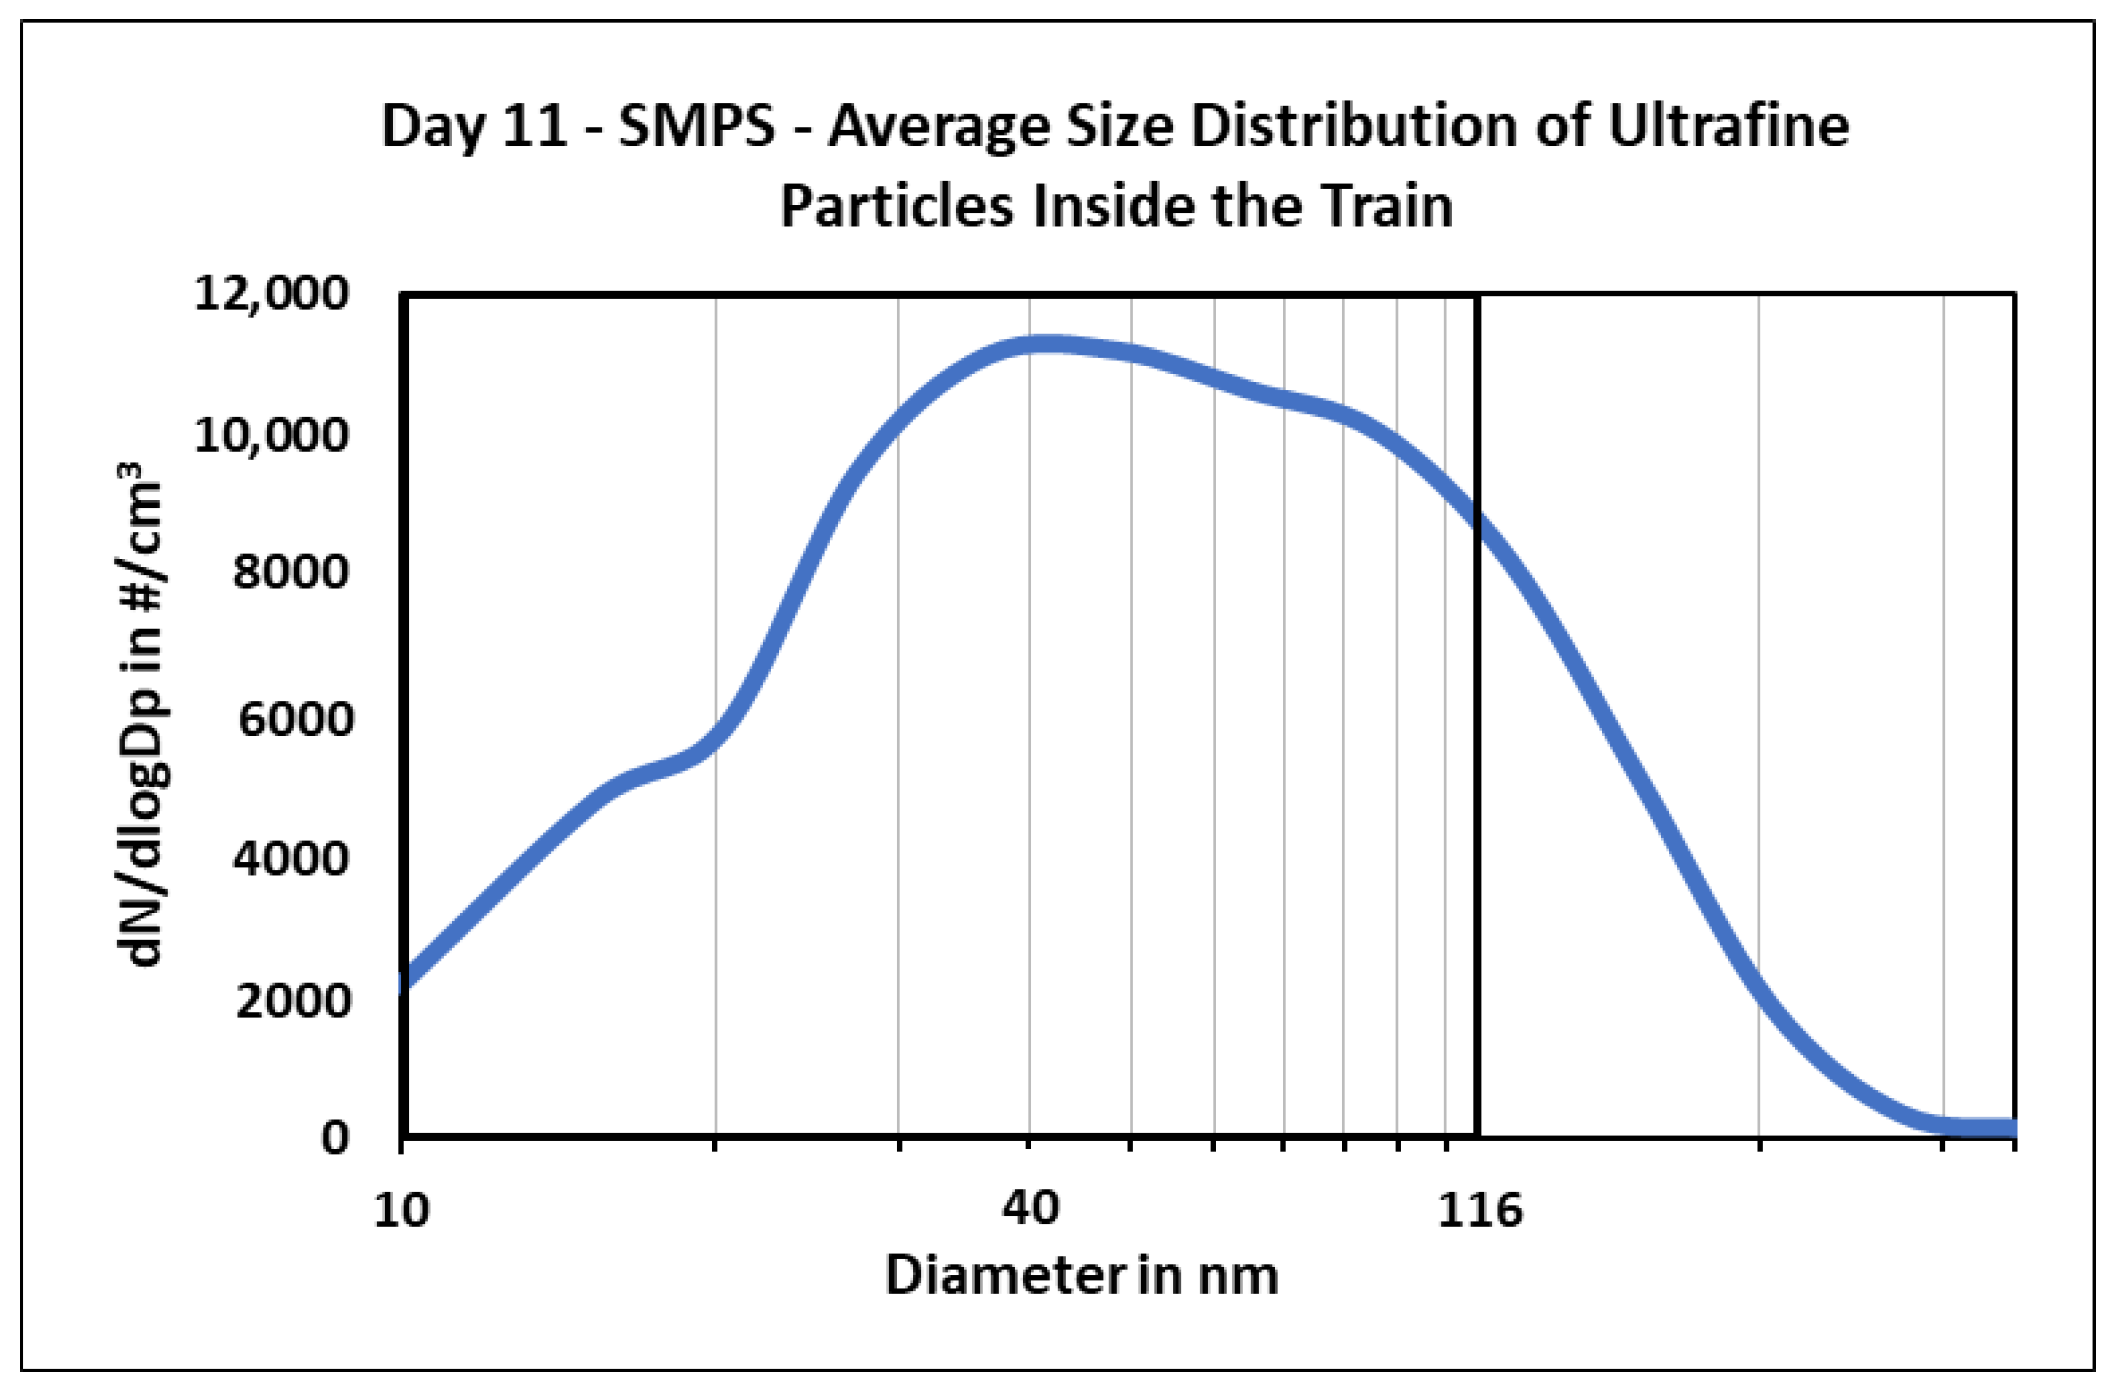
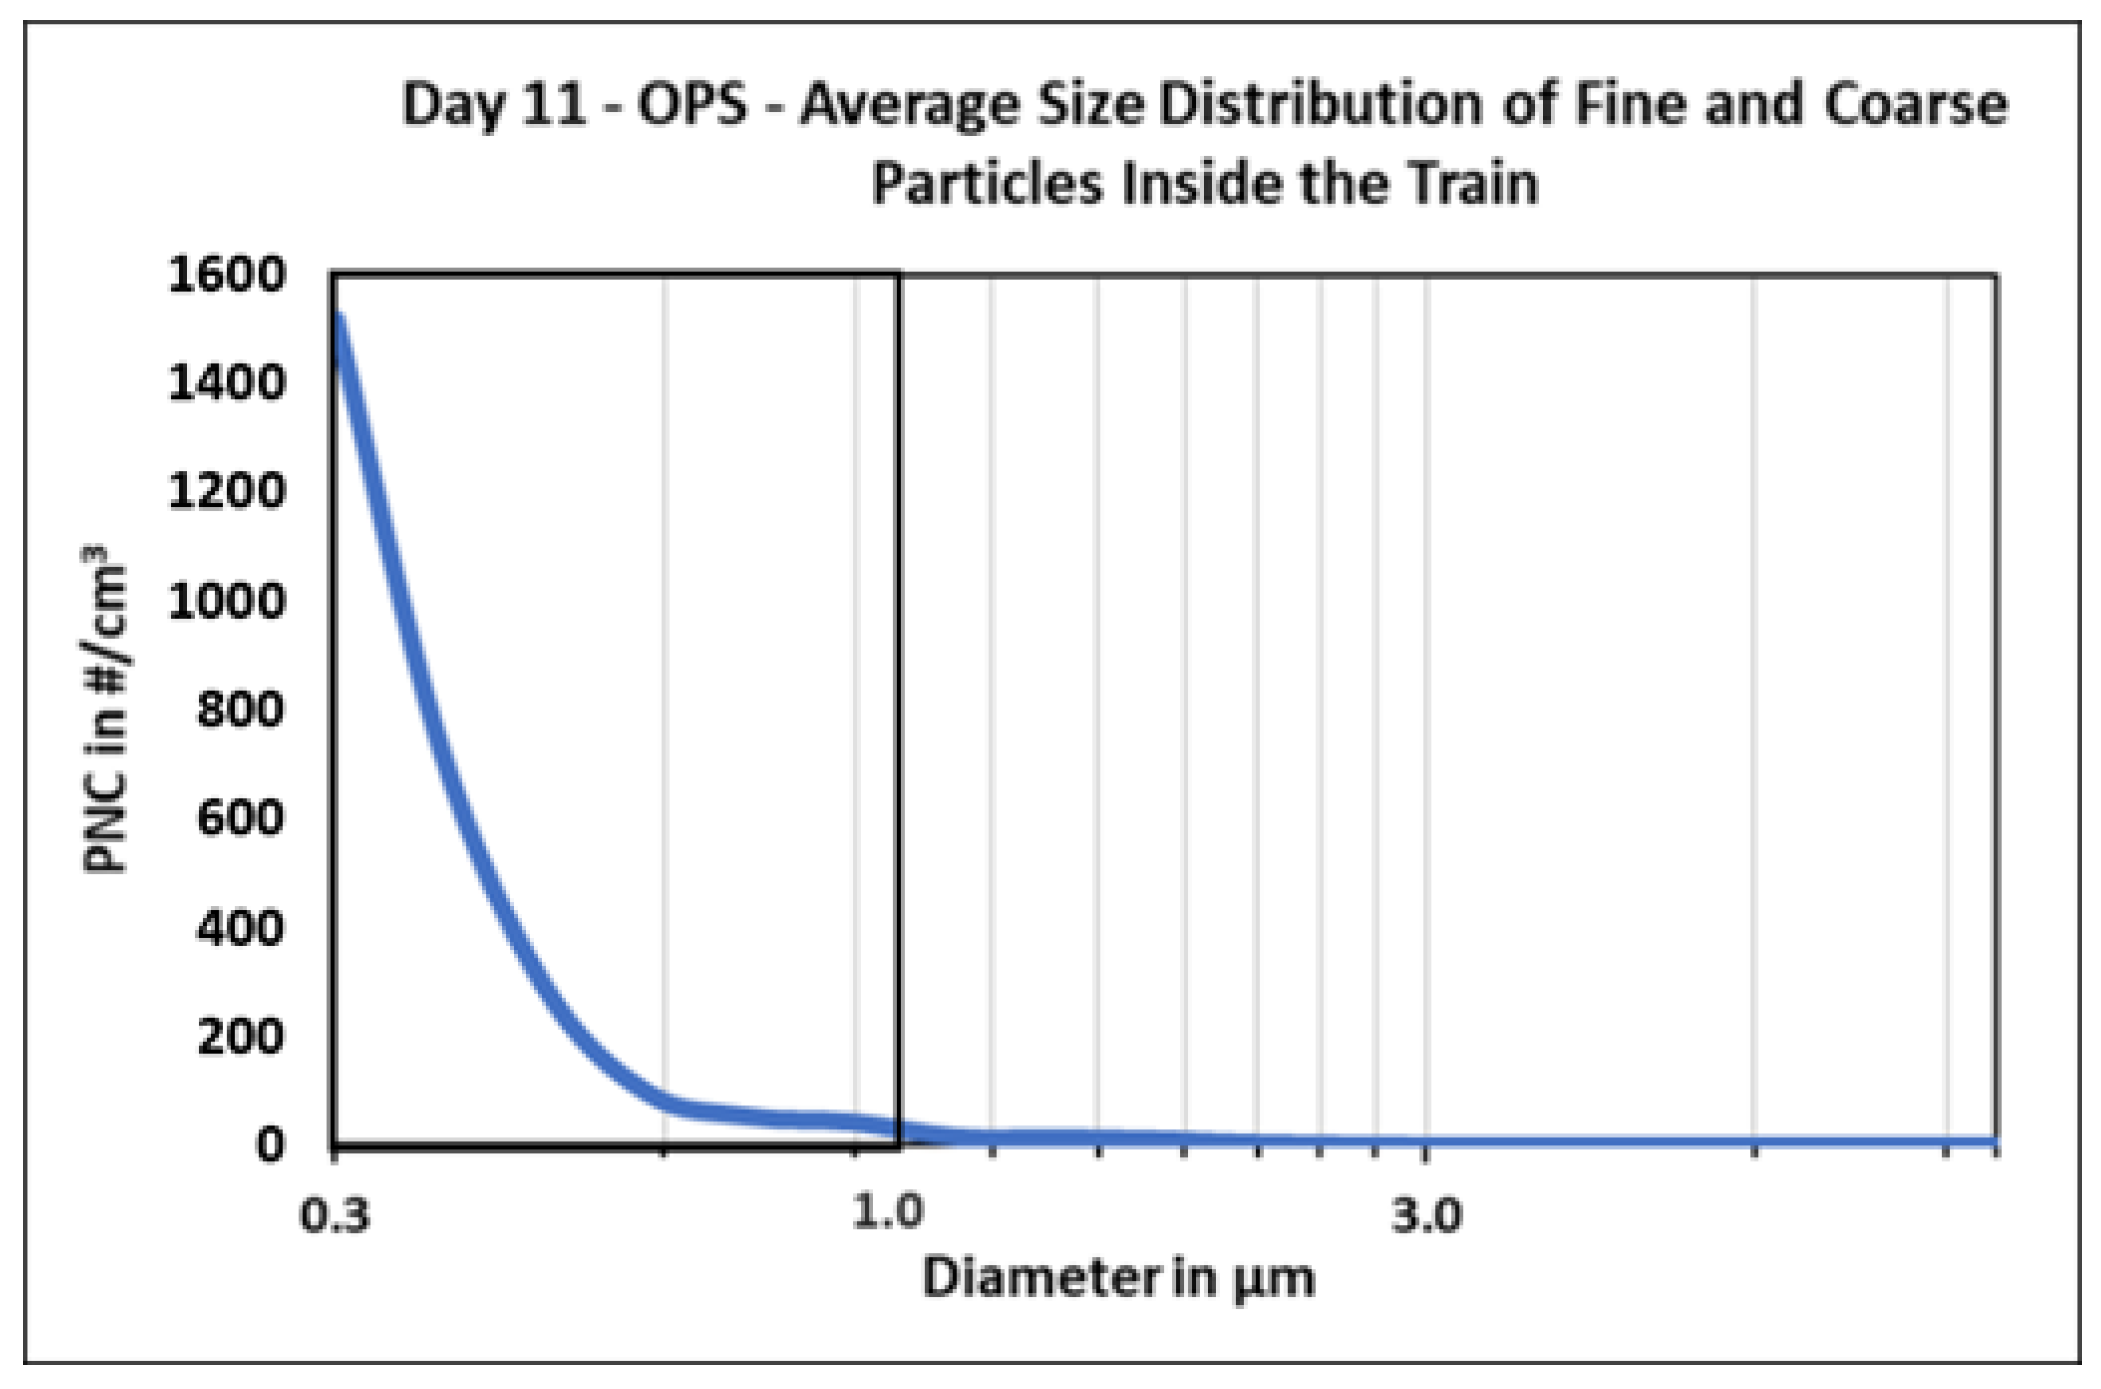
3.1.3. Particle Size Distribution

Figure 16 below shows the average size distribution of the PNC of ultrafine particles inside the train on day 11 measured by the SMPS NanoScan (TSI). The particle size distribution curve shows that the majority of the UFPs were in the smaller fraction of the total ultrafine range (10–365 nm). Ninety-one percent of the particles were under the size of 116 nm, with the maximum particle number concentrations at a size of 40 nm. Cha et al. found the particle size mode in the range of 30 nm when no train was on the platform. The authors also observed that the measured particle size was mainly lower than 200 nm [4]. Figure 17 on the other hand, shows the average size distribution for larger particles (0.3–10 µm) measured by the OPS (TSI) inside the train on day 11. It can be seen from the particle size distribution curve that 98% of the entire PNC is in the range of 0.3–1 µm. Similar particle size distribution curves were observed for the UFPs and coarser particles on days 1 and 2 when the same experiment was performed (not presented in this paper).

3.2. Outdoor Compared with Underground Platform Concentrations

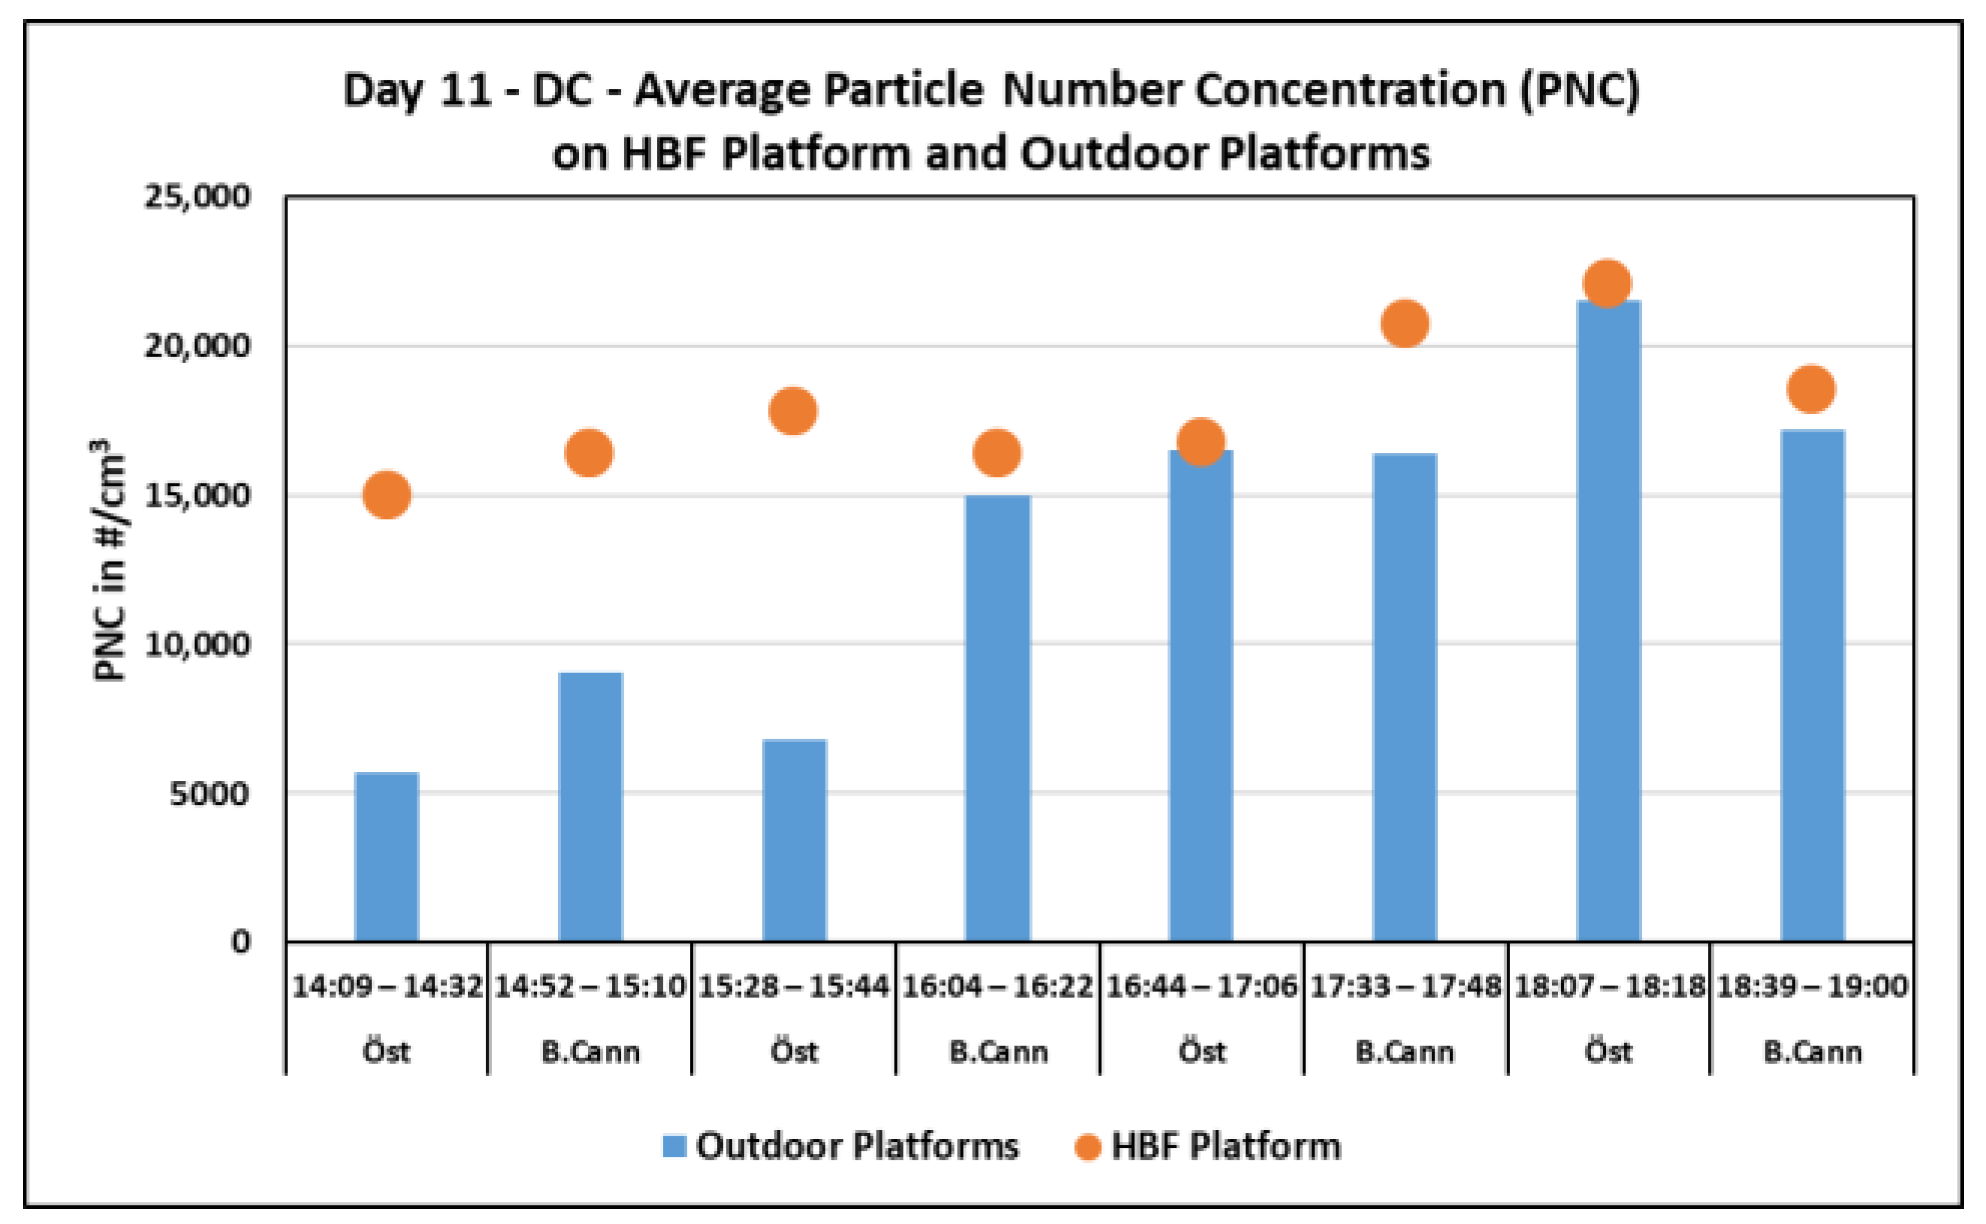
3.2.1. Particle Number Concentration

Figure 18 compares the day 11 average PNC of UFPs from the DC (testo DiSCmini) on the underground Hauptbahnhof platform with the concentrations on the two outdoor platforms (Bad Cannstatt and Österfeld) during the same periods. As illustrated, the comparable section shows that the average values were always higher at Hauptbahnhof than at the outdoor stations. Additionally, it can be seen that the PNC on the outdoor platforms increased over the course of the afternoon when the number of people on the platforms, as well as the road traffic, increased. The PNC values at Hauptbahnhof also increased, especially in the late afternoon.
When looking at the data from the DC (testo DiSCmini) on day 2 shown in Figure 19, it can be seen that there was relatively less difference in the average UFP number concentrations on the Hauptbahnhof platform and outdoor platforms as compared to the measurements during day 1 and 11. This was mainly due to the influence of externalities. For instance, on day 2, prolonged smoking events were reported during all three stationary measurement periods at Bad Cannstatt. Figure 20 compares the same scenarios as discussed above but for coarse and fine particle concentrations on day 1. It can be seen that the average PNC on the Hauptbahnhof platform was also considerably higher than that on the outdoor platforms. Then, when comparing the two outdoor platforms, the concentration of larger-size particles was consistently higher at Bad Cannstatt than at Österfeld. Finally, as seen in previous graphs, the PNC values on the outdoor platforms increased over the course of the afternoon.
Table 5 shows the average PNCs of the 3 days when measurements were performed simultaneously on the Hauptbahnhof and outdoor platforms. The reported values corroborate that the concentration levels on the underground platforms were higher than those on the outdoor platforms by factors ranging from 1.6 to 2 for UFP measured by the SMPS NanoScan (TSI) and from 1.1 to 4.1 for coarse and fine particles measured by the OPS (TSI). It is evident that there was more variation in the factors for coarser particles than UFPs. On day 11, the concentration levels were nearly the same indoors and outdoors, which can possibly be attributed to the PM10 Feinstaubalarm conditions on that day.

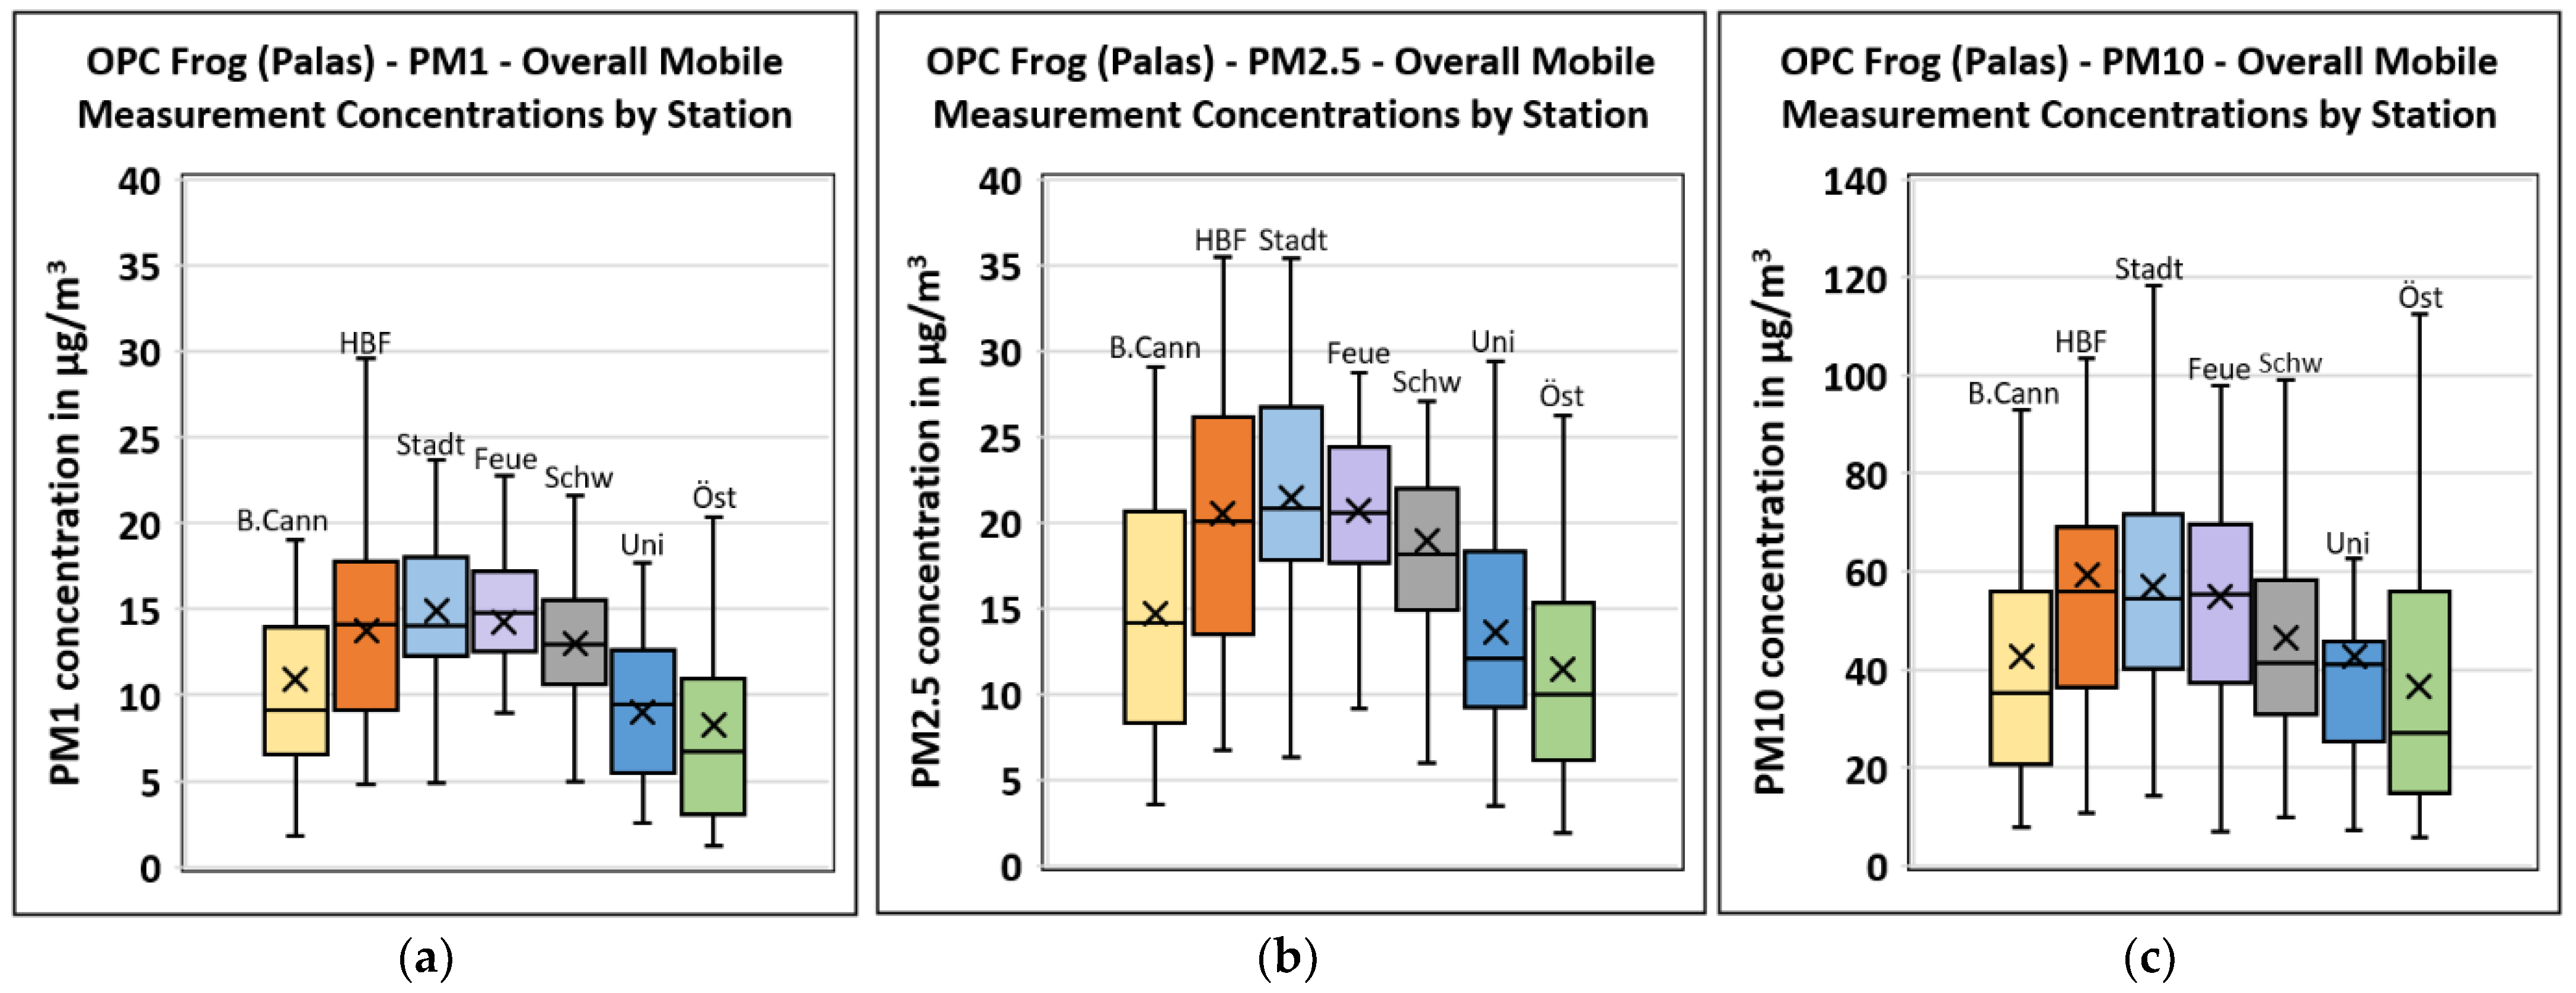
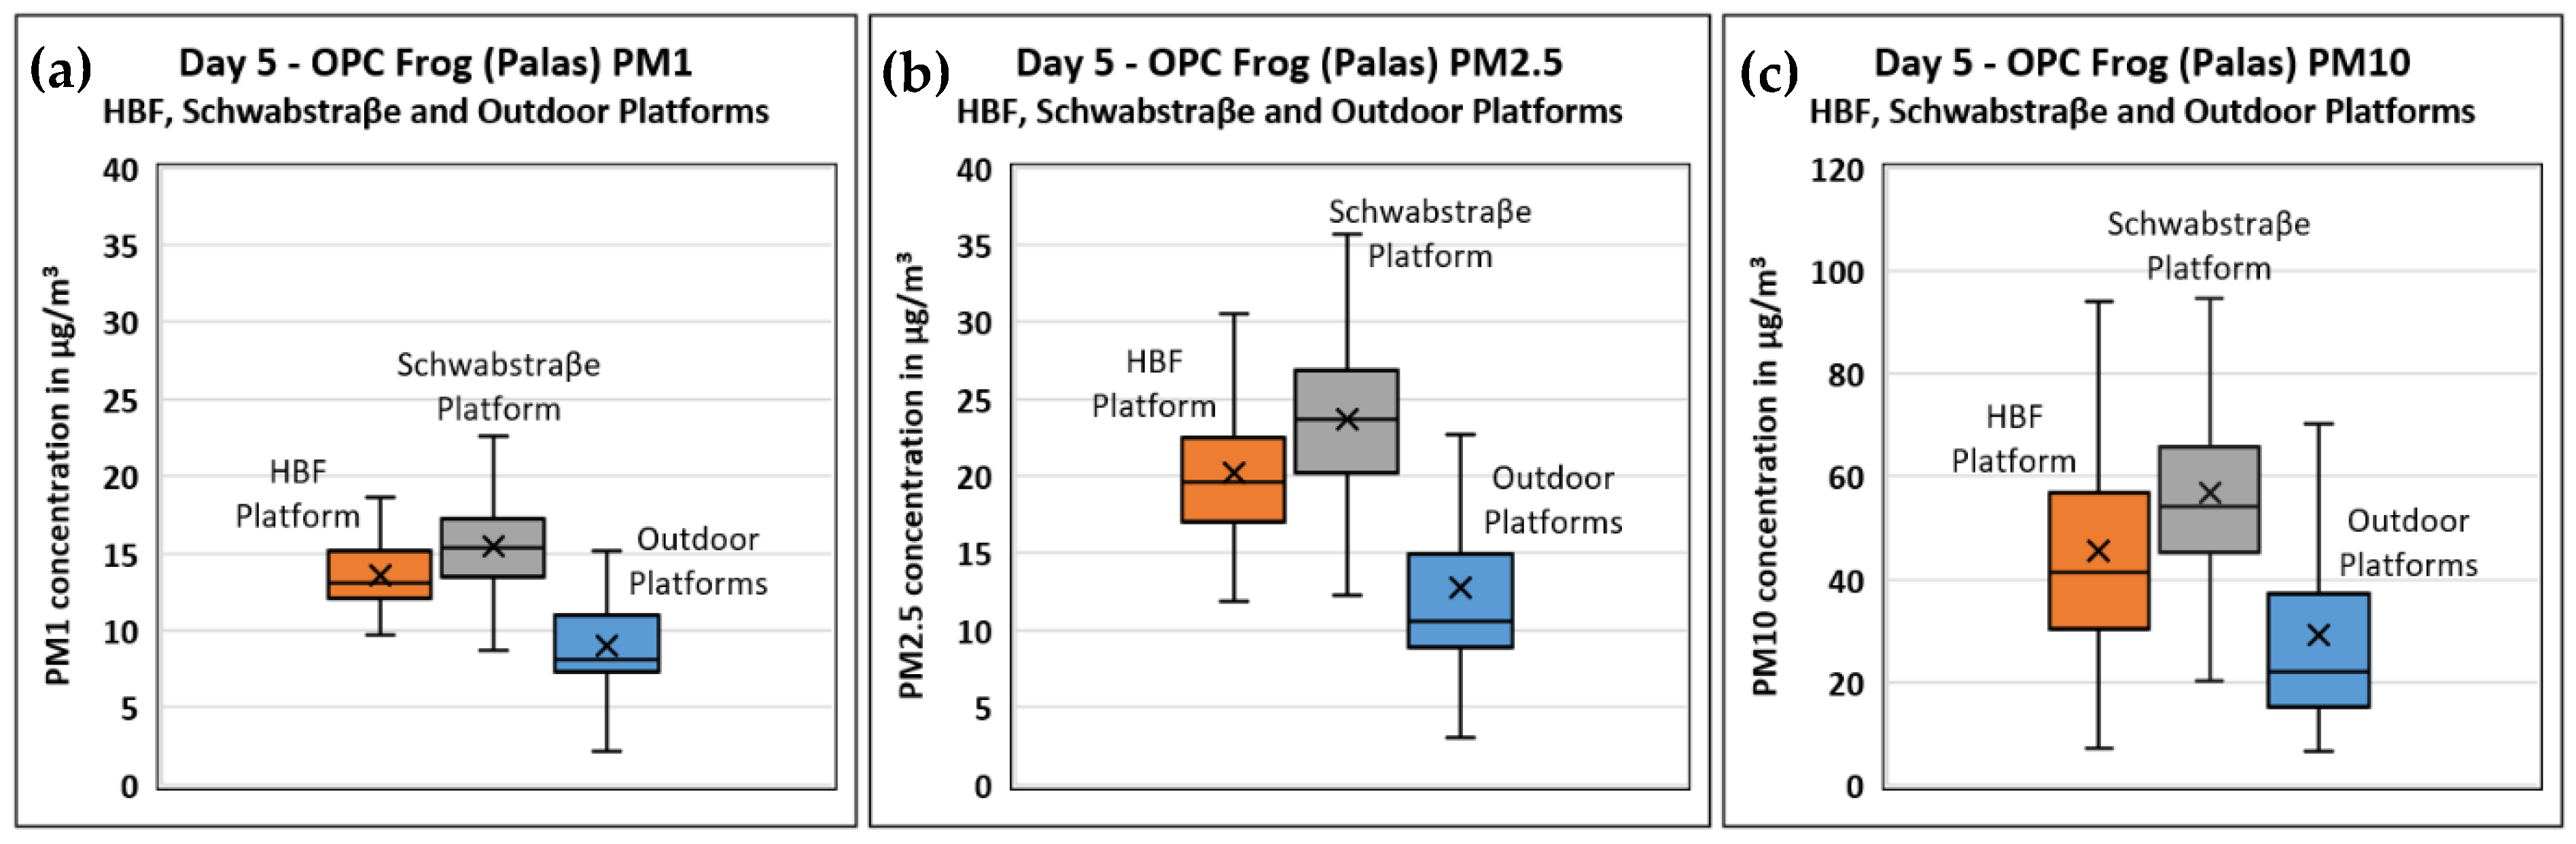
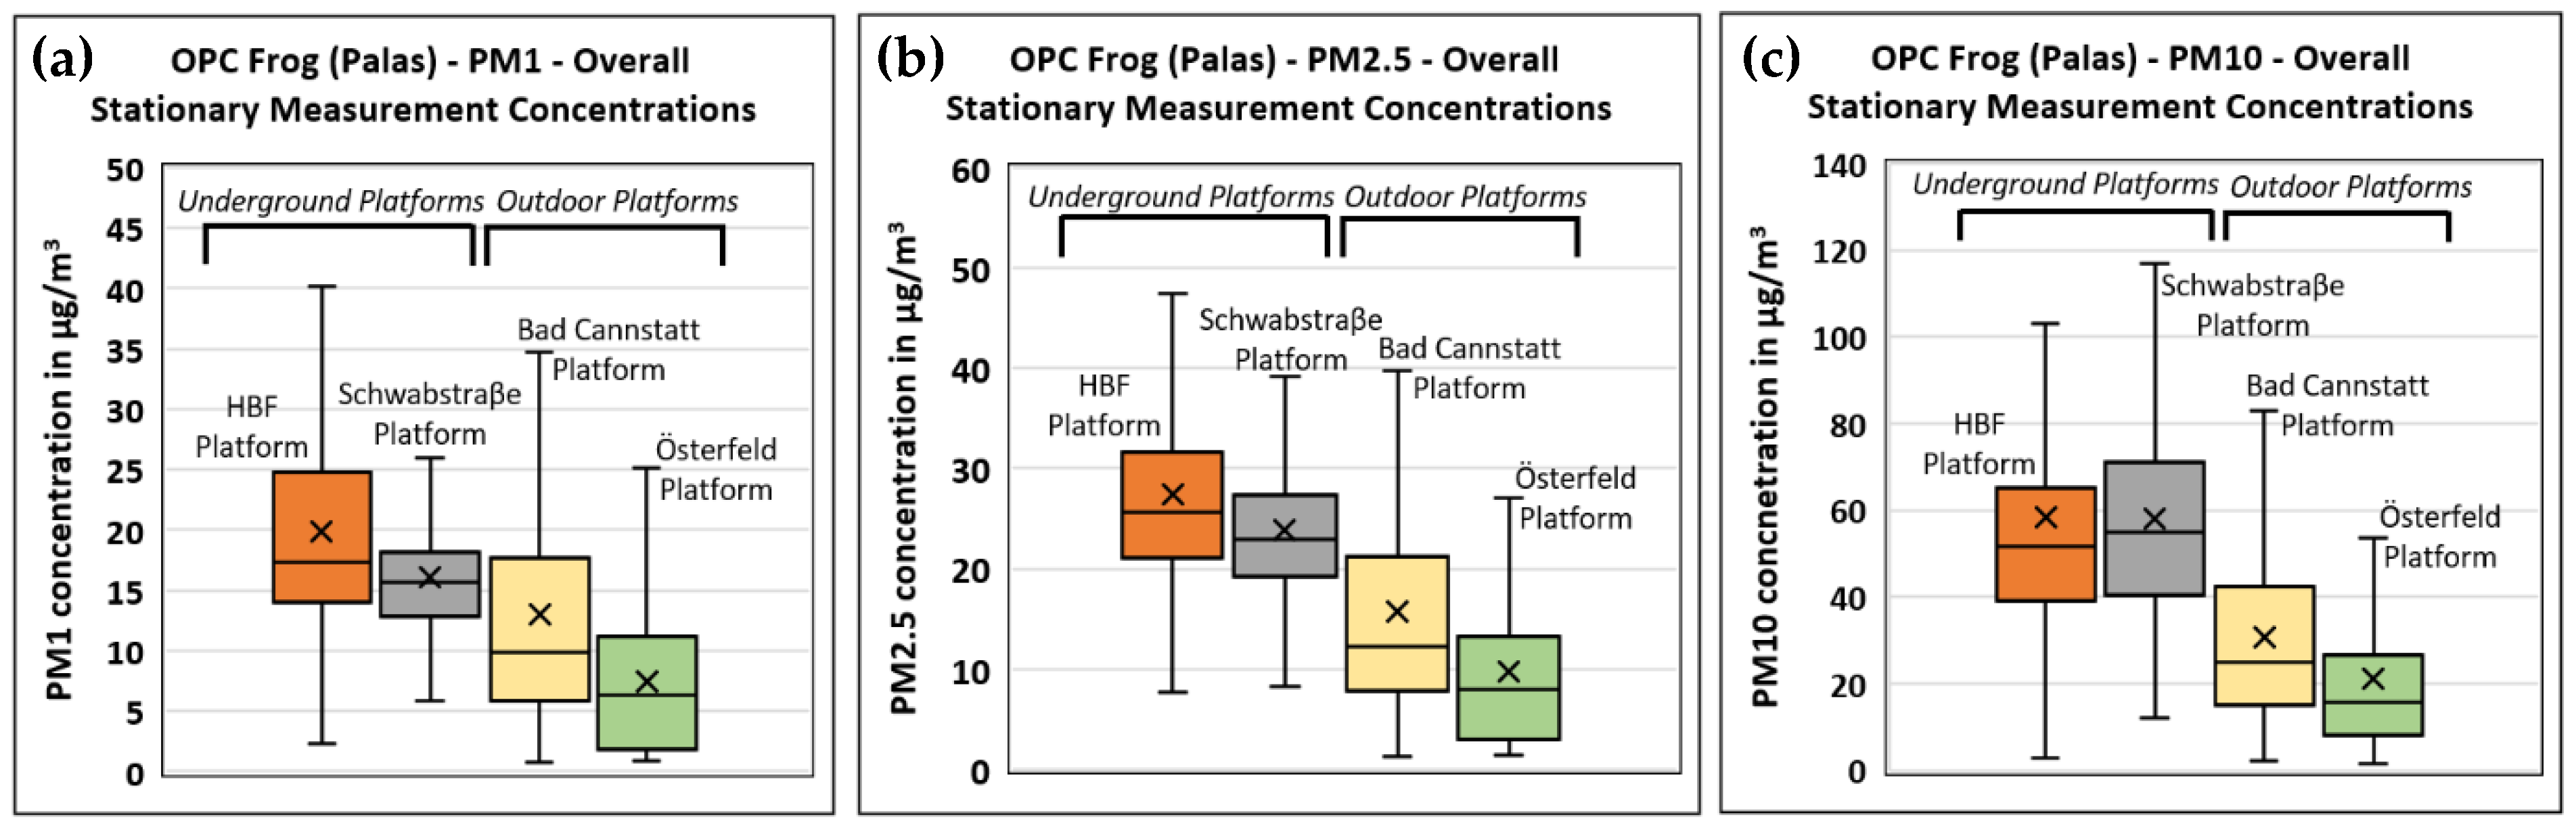
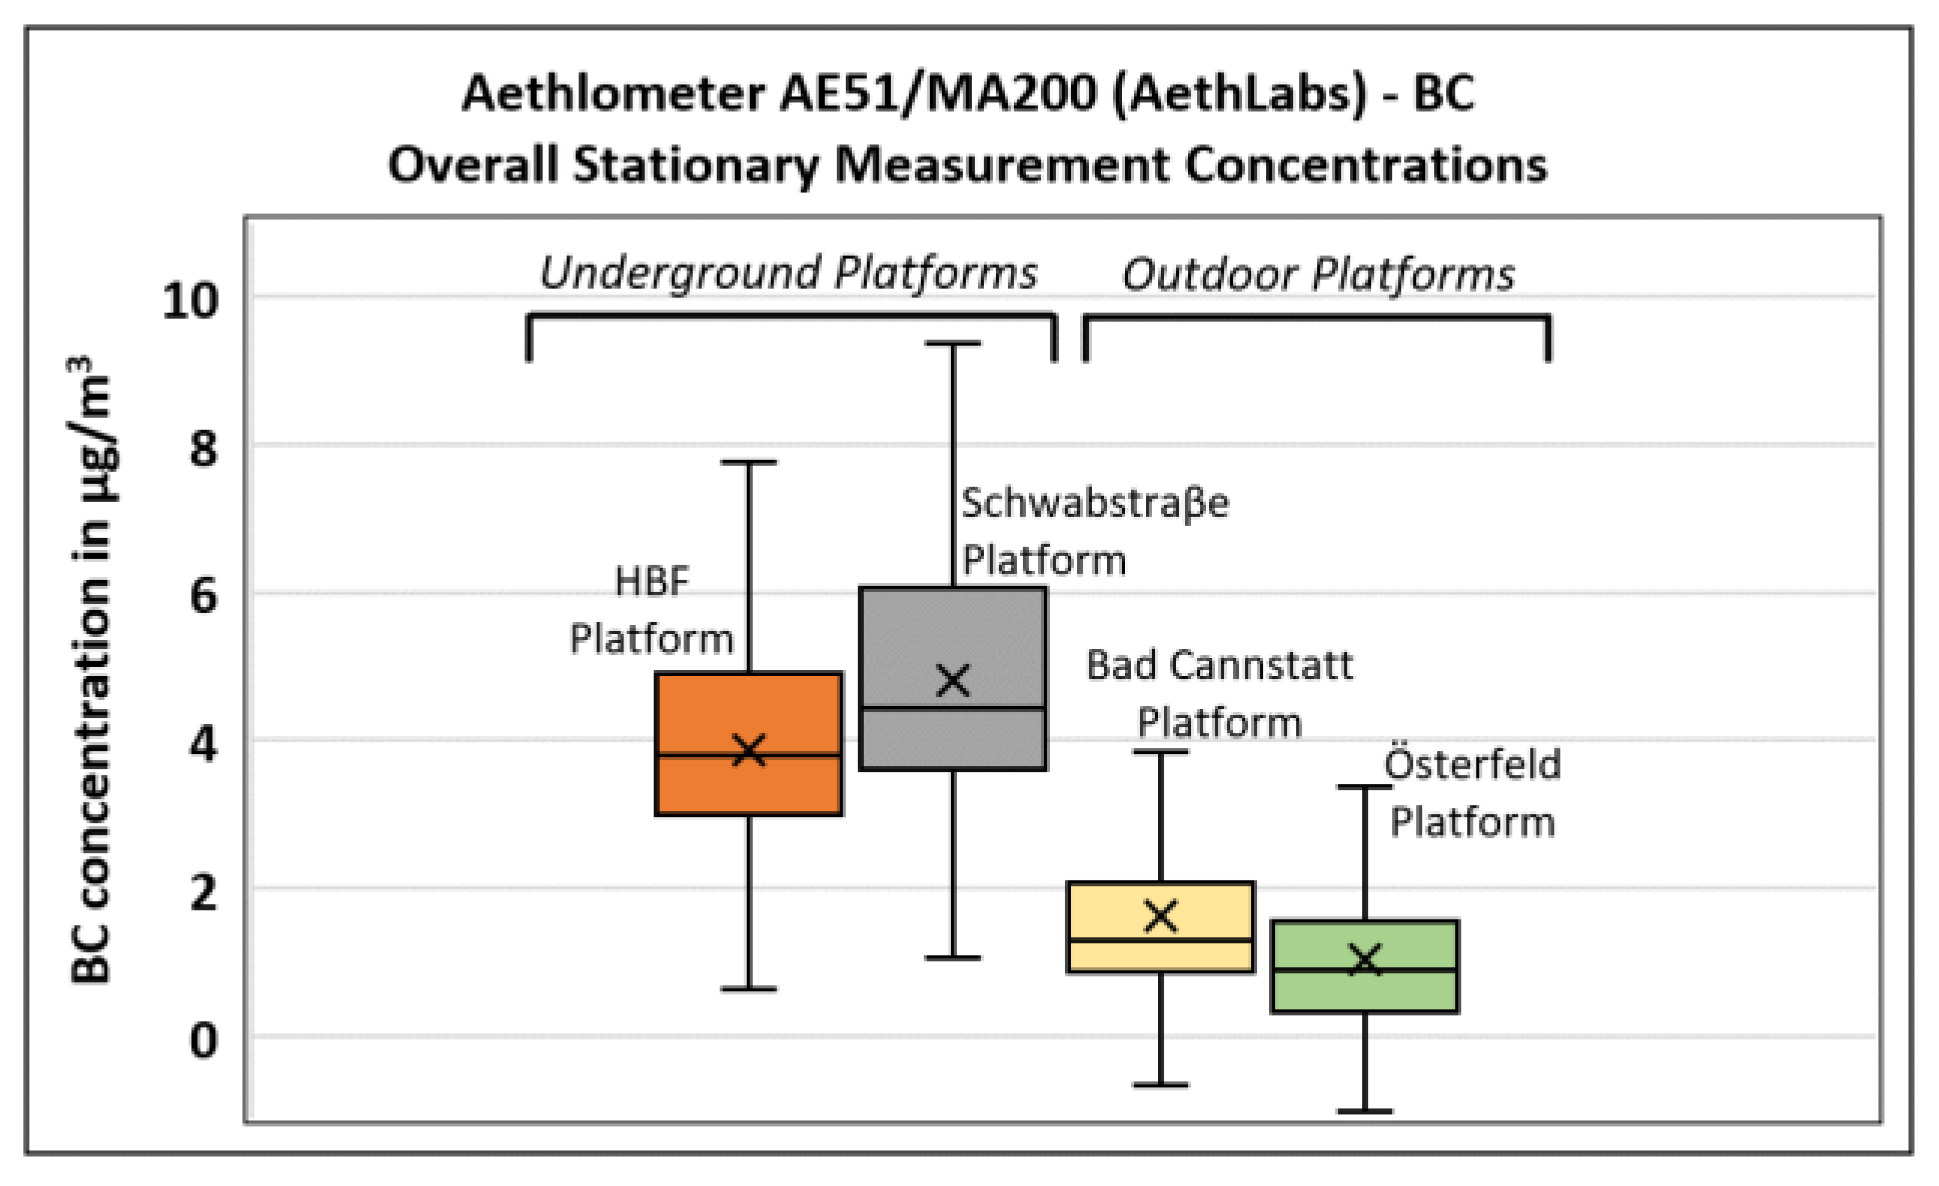
3.2.2. Mass Concentration

The outdoor platform and underground platform OPC (Palas Fidas Frog) mass concentration values were also compared to see which location had more elevated PM concentrations. The box plots in Figure 21, Figure 22 and Figure 23 clearly show that the underground Hauptbahnhof and Schwabstraße platforms have higher PM1, PM2.5, and PM10 median concentrations than the outdoor platforms (Österfeld and Bad Cannstatt). In Figure 21 and Figure 22, concentrations were observed on Feinstaubalarm days, day 5, and day 6, respectively. Under these conditions, the concentrations at all the compared locations were higher overall with the underground Hauptbahnhof and Schwabstraße platform concentrations still higher than those measured on the outdoor platforms. Figure 23 compares the levels from all the stationary measurement locations over the whole campaign and lists the platforms with the highest concentrations to the lowest.
Thus, it can be concluded that the mass concentrations on the underground platforms are higher than the concentrations on the outdoor platforms. When comparing the levels on the underground platforms, the PM1 and PM2.5 concentrations at Hauptbahnhof were slightly higher than the values at Schwabstraße, while the PM10 concentration was higher at Schwabstraße. When comparing the BC concentrations of underground and outdoor platforms, the graphed Aethalometer AE51/MA200 BC concentrations yielded a similar behavior to the OPC (Palas Fidas Frog) results. Figure 24 shows examples from three different days of the varying BC concentrations on the underground Hauptbahnhof and Schwabstraße platforms and outdoor platforms. From all the days evaluated, the BC concentrations underground at Hauptbahnhof and Schwabstraße were always higher than the values on the outdoor platforms.
However, when comparing whether the Schwabstraße or Hauptbahnhof platform had a higher BC concentration, the levels at Schwabstraße were higher than Hauptbahnhof 60% of the time (Figure 24b), equal to Hauptbahnhof 20% of the time (Figure 24a), and less than Hauptbahnhof 20% of the time (Figure 24c). The cause of the elevated BC levels on the Schwabstraße platform is still uncertain. Nevertheless, the underground platform with the highest BC concentration varies from day to day.
Finally, Figure 25 shows an overall box plot of all campaign days comparing the BC levels at the four stationary measurement platforms. The BC on the Schwabstraße platform was the highest, followed by Hauptbahnhof, Bad Cannstatt, and Österfeld.

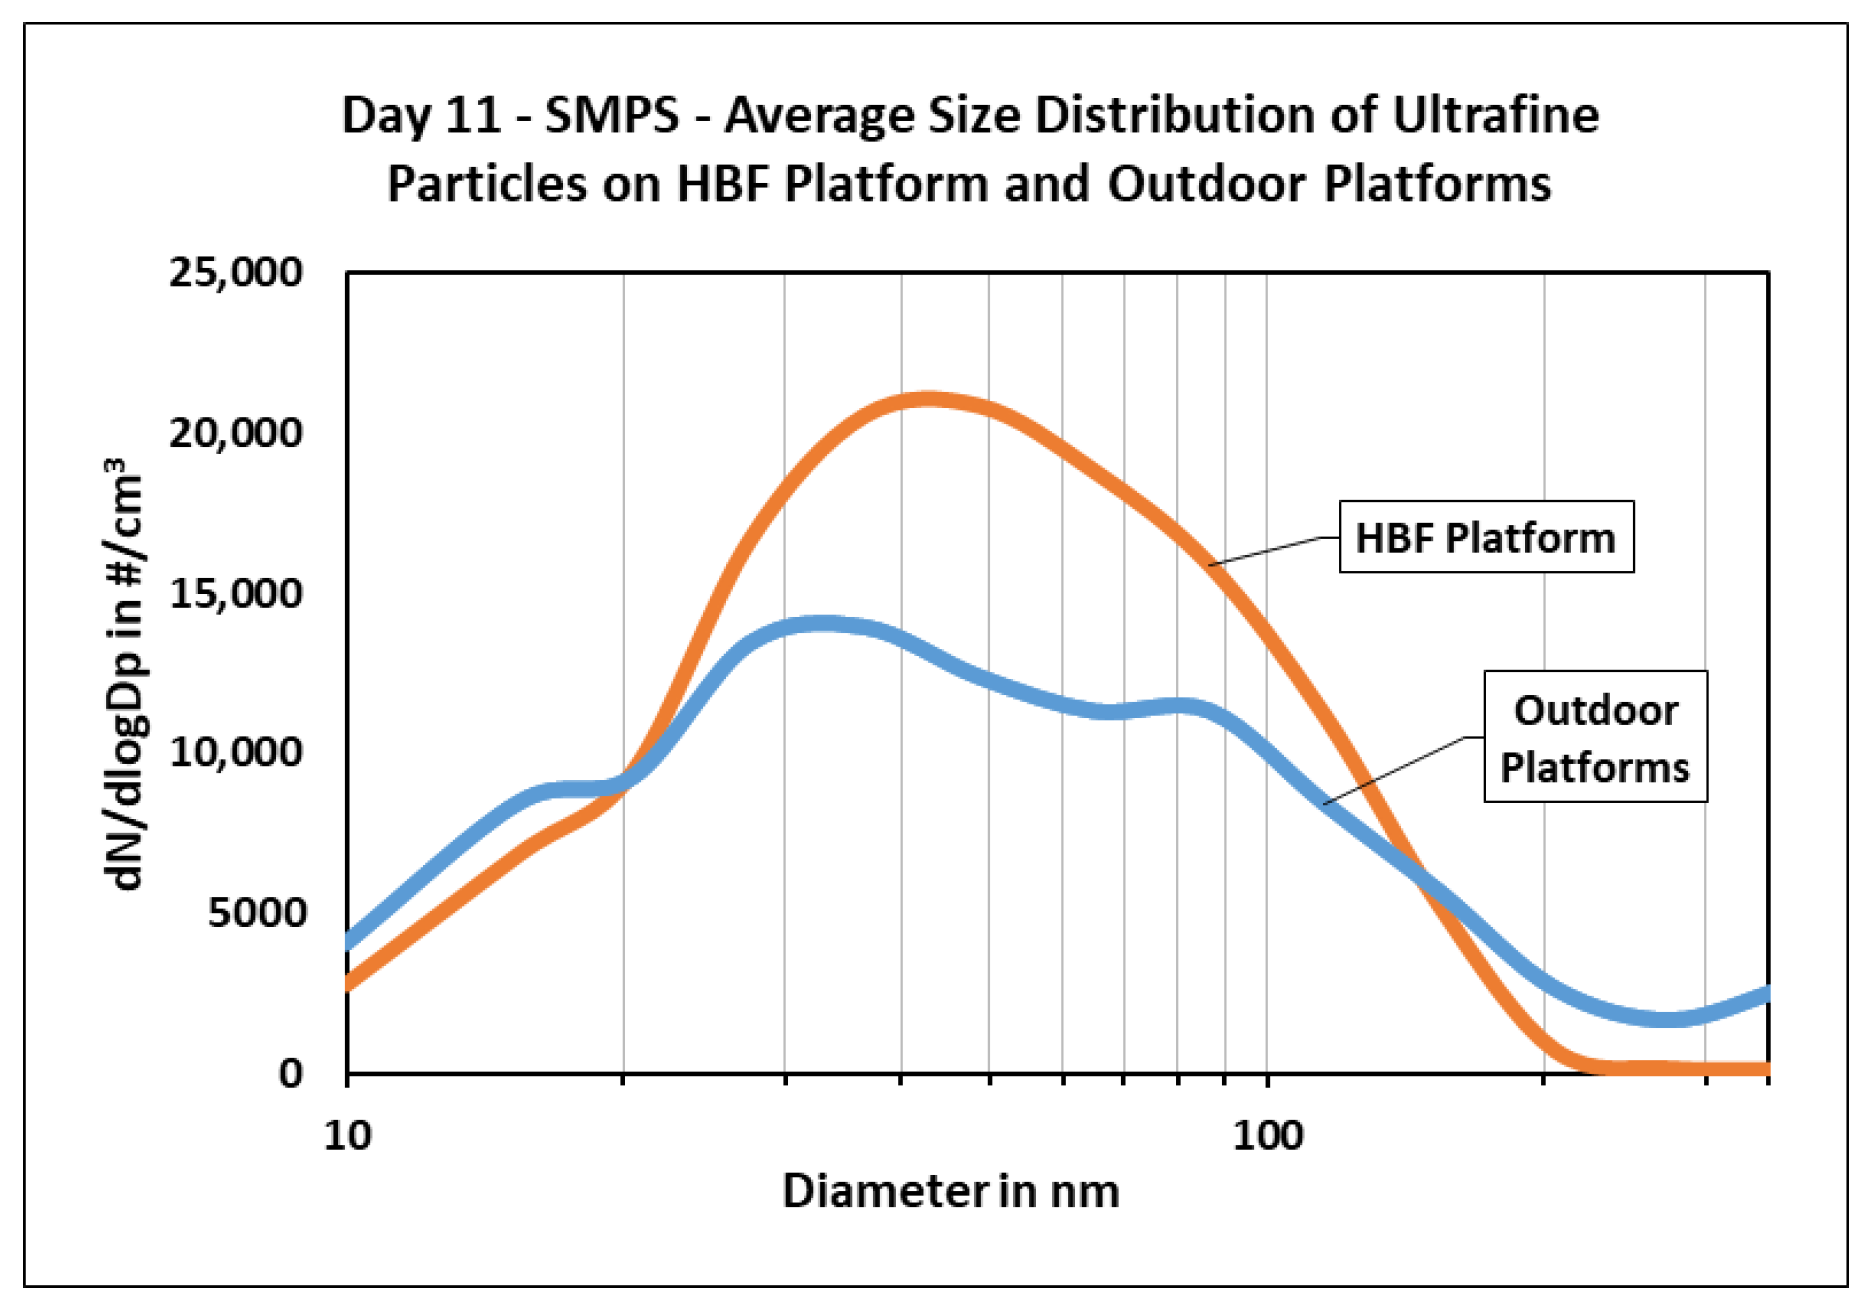
3.2.3. Particle Size Distribution

Figure 26 shows the average size distribution of the UFPs on the Hauptbahnhof platform and the outdoor platforms on day 11. The size distribution curve at Hauptbahnhof was similar to the one inside the S-Bahn train (Figure 16). This suggests the possibility of similar particulate matter sources. In this case, 95% of the particles were in the range of 10–116 nm, with the peak also around 40 nm. On the other hand, the size distribution curve for the outdoor platforms had a peak of around 30 nm, and the PNC values were more spread out.
For the fine and coarse particle sizes, there were similar results for both the indoor and outdoor station average size distributions of PNC. Ninety-eight percent of the particles were in the range of 0.3 µm to 1 µm, as can be seen in Figure 27, with the smaller fraction of the fine particle range again being dominant.

3.3. Airflow Influence on Underground Platform Concentrations

The airflow speed and direction were measured at six different positions around the underground Hauptbahnhof and Schwabstraße platforms to see if an effect on the variation in concentration around the platform could be observed. When comparing the layout of Hauptbahnhof and Schwabstraße, both had very different characteristics. Figure 28 shows an overhead view of the Hauptbahnhof platform which consisted of multiple entrances, elevators, food stands, and an information center. In addition, there was a lot of user traffic since it is one of the busiest stations in the network. The many obstructions and people on the platform could be one of the reasons this platform had a very low average airflow speed of 0 to 1 m/s.
On the contrary, the Schwabstraße platform (Figure 29) was open, apart from some pillars along the center of the platform, and only had two entrances on either end. The south entrance had a clear barrier around it encasing it, while the north entrance was open with nothing surrounding it. Due to this, a north wind was typically felt throughout the measurement campaign. The average wind speed was slightly higher ranging from 1 to 2 m/s.
To gain more understanding of the airflows at each position, the airflow speed and direction data from each of the six positions were analyzed using wind roses.

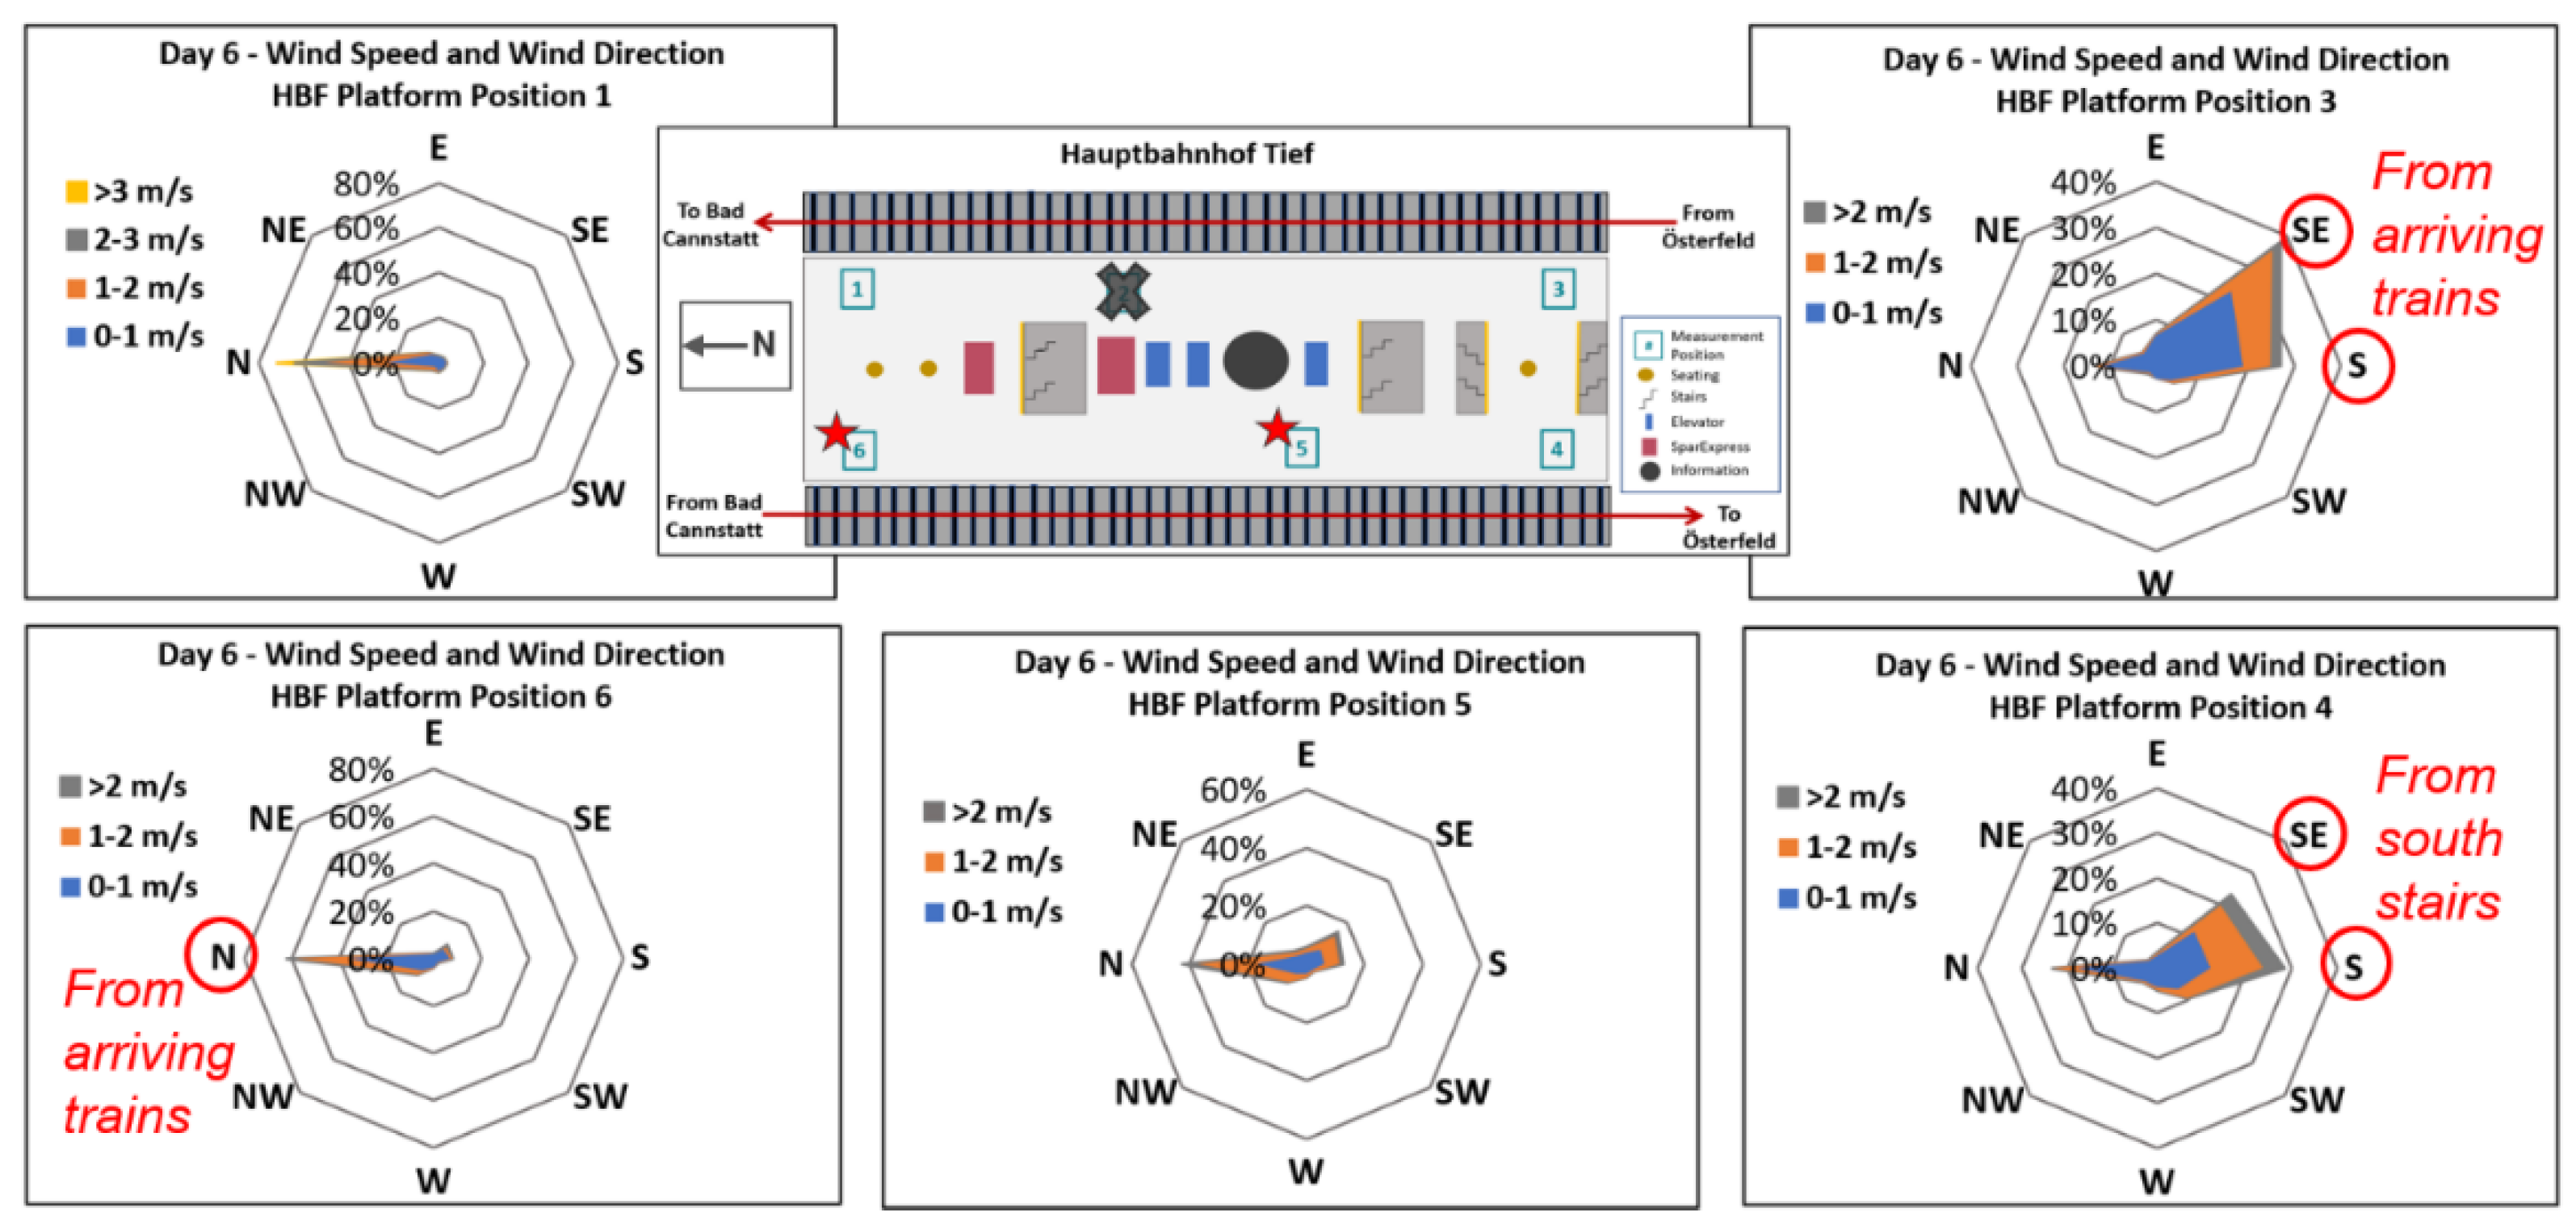
3.3.1. Hauptbahnhof Platform

For OPC (Palas Fidas Frog) measurements along the Hauptbahnhof platform, an increase in PM concentration was seen at Positions 5 and 6 on nearly half of the days measured. An example of these trends can be seen in Figure 30, which shows the variation in PM concentration as the measurements were taken at the six different areas on the platform. From the graph, there is a definite increase in concentration when measuring at Position 6 that was maintained when measurements continued at Position 5. However, when the measurements were moved to Position 4, there was a clear drop in PM concentration. The airflows were looked at in more detail to better understand why Positions 5 and 6 showed higher concentrations than the other locations.
Figure 31 shows the wind roses at the different positions along the platform. Note that wind data for Position 2 was not available on this day. Hence, it is marked with a cross in the Figure. On the west side of the platform at Position 6, it can be seen that there was a north wind coming from trains arriving from Bad Cannstatt, and at Position 4, there were also south and southeast winds, which likely came from the south stairs entrance. In addition, on the southeast side of the platform at Position 3, there were both southeast and south winds from trains arriving on the east track. A summary of these air streams is presented in Figure 32 shown with blue arrows. Therefore, it is believed that the combined airflows led to a higher resuspension of particulate matter at Positions 5 and 6 (highlighted with red starts) and thus a higher measurable concentration at these positions.

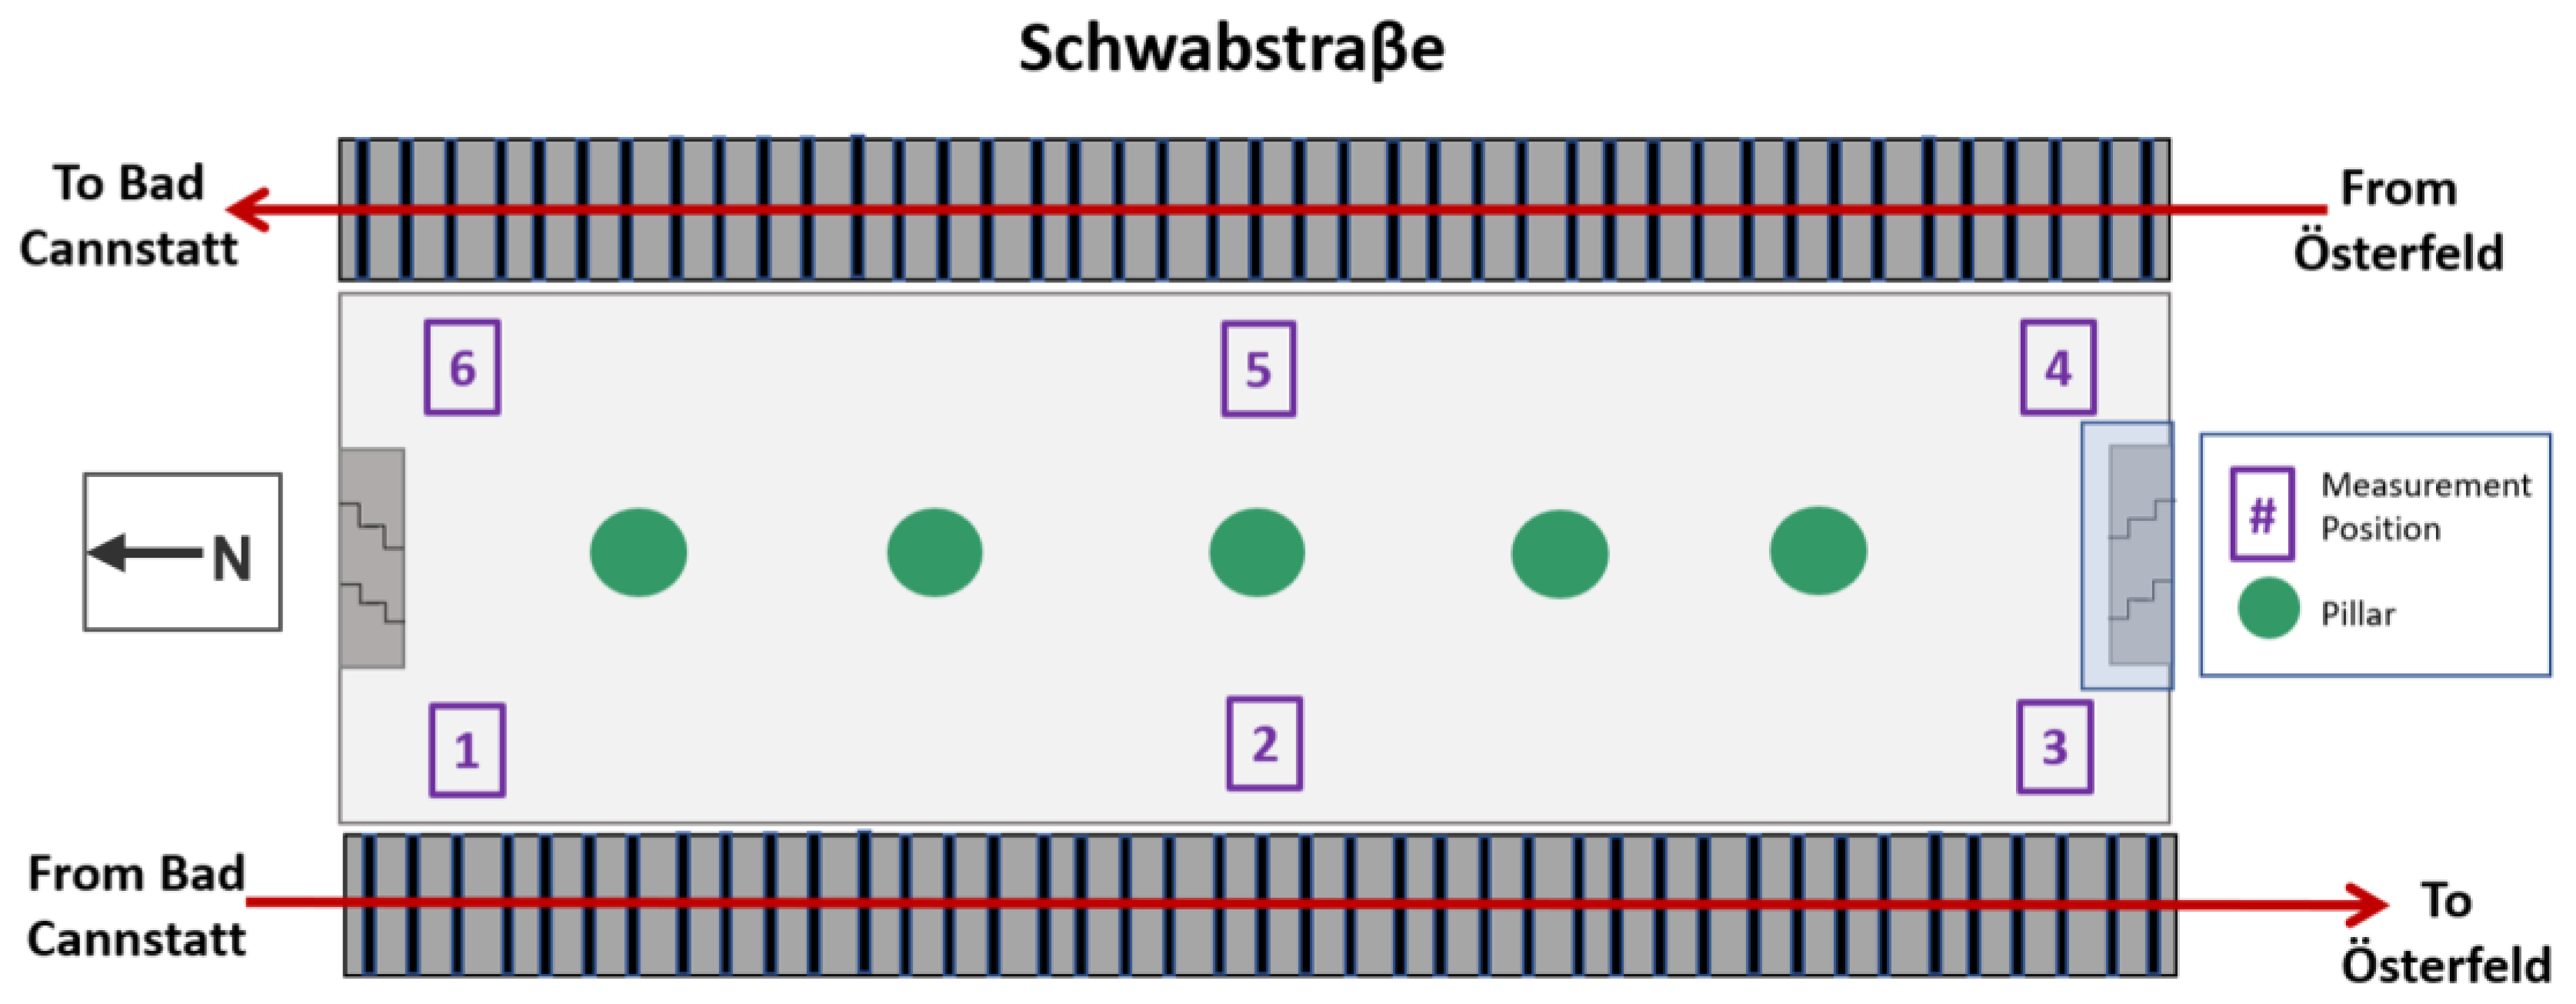
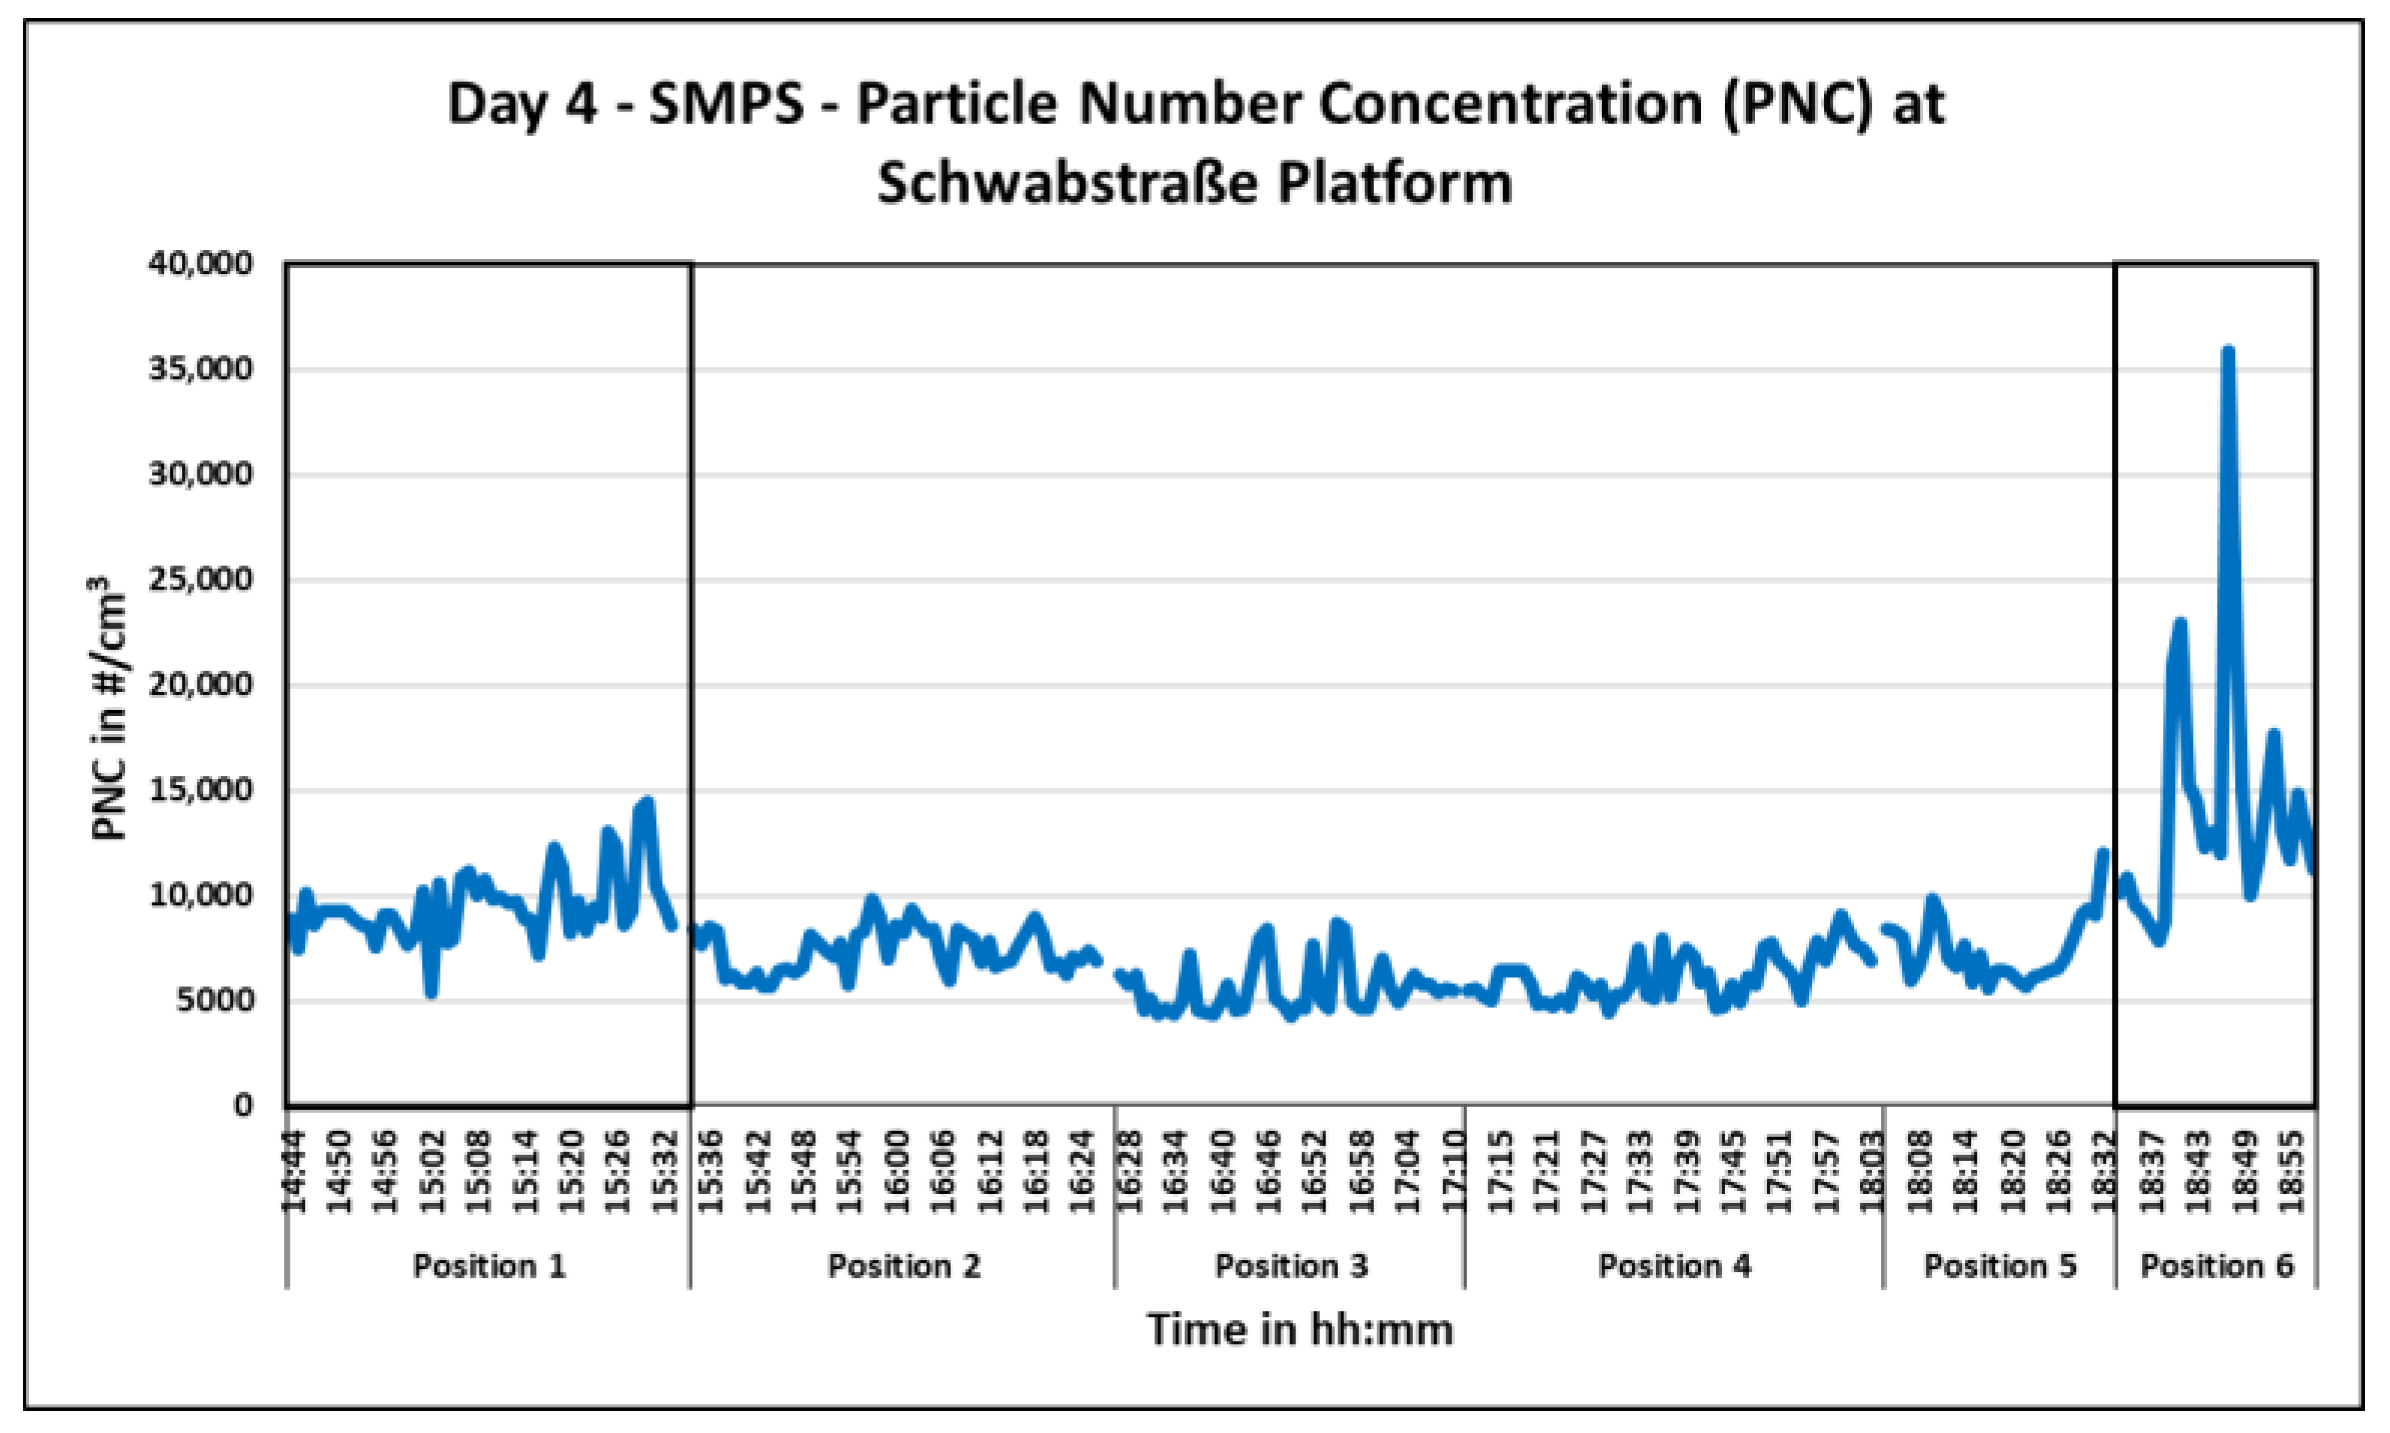
3.3.2. Schwabstraße Platform

Figure 33 shows the UFP number concentrations on the Schwabstraße platform measured by the SMPS NanoScan (TSI) on day 4. It can be seen that the concentrations were more elevated at Positions 1 and 6. This pattern was recurrently observed on all measurement days at this underground station.
Figure 34 shows the wind roses for all the positions on the Schwabstraße platform measured on day 4. The airflows on this platform varied greatly from day to day. However, at Position 1, there was a consistent north air current coming from the entrance of the tunnel. It is probable that this is the result of the air being pushed through the tunnel from arriving trains (by piston effect). At Position 6, there were south air currents which are likely from the arriving trains on the east track, as well as a consistent northwest airflow from the north stairs and from the trains arriving on the west track. In addition, Positions 1 and 6 were both located next to the north stair entrance from which a north wind was typically felt. These three main airflows are illustrated in Figure 35 with blue arrows and the positions 1 and 6 highlighted with red circle. Thus, due to the combined airflows, the turbulence in these areas increased and possibly contributed to a higher resuspension of particles at these positions.

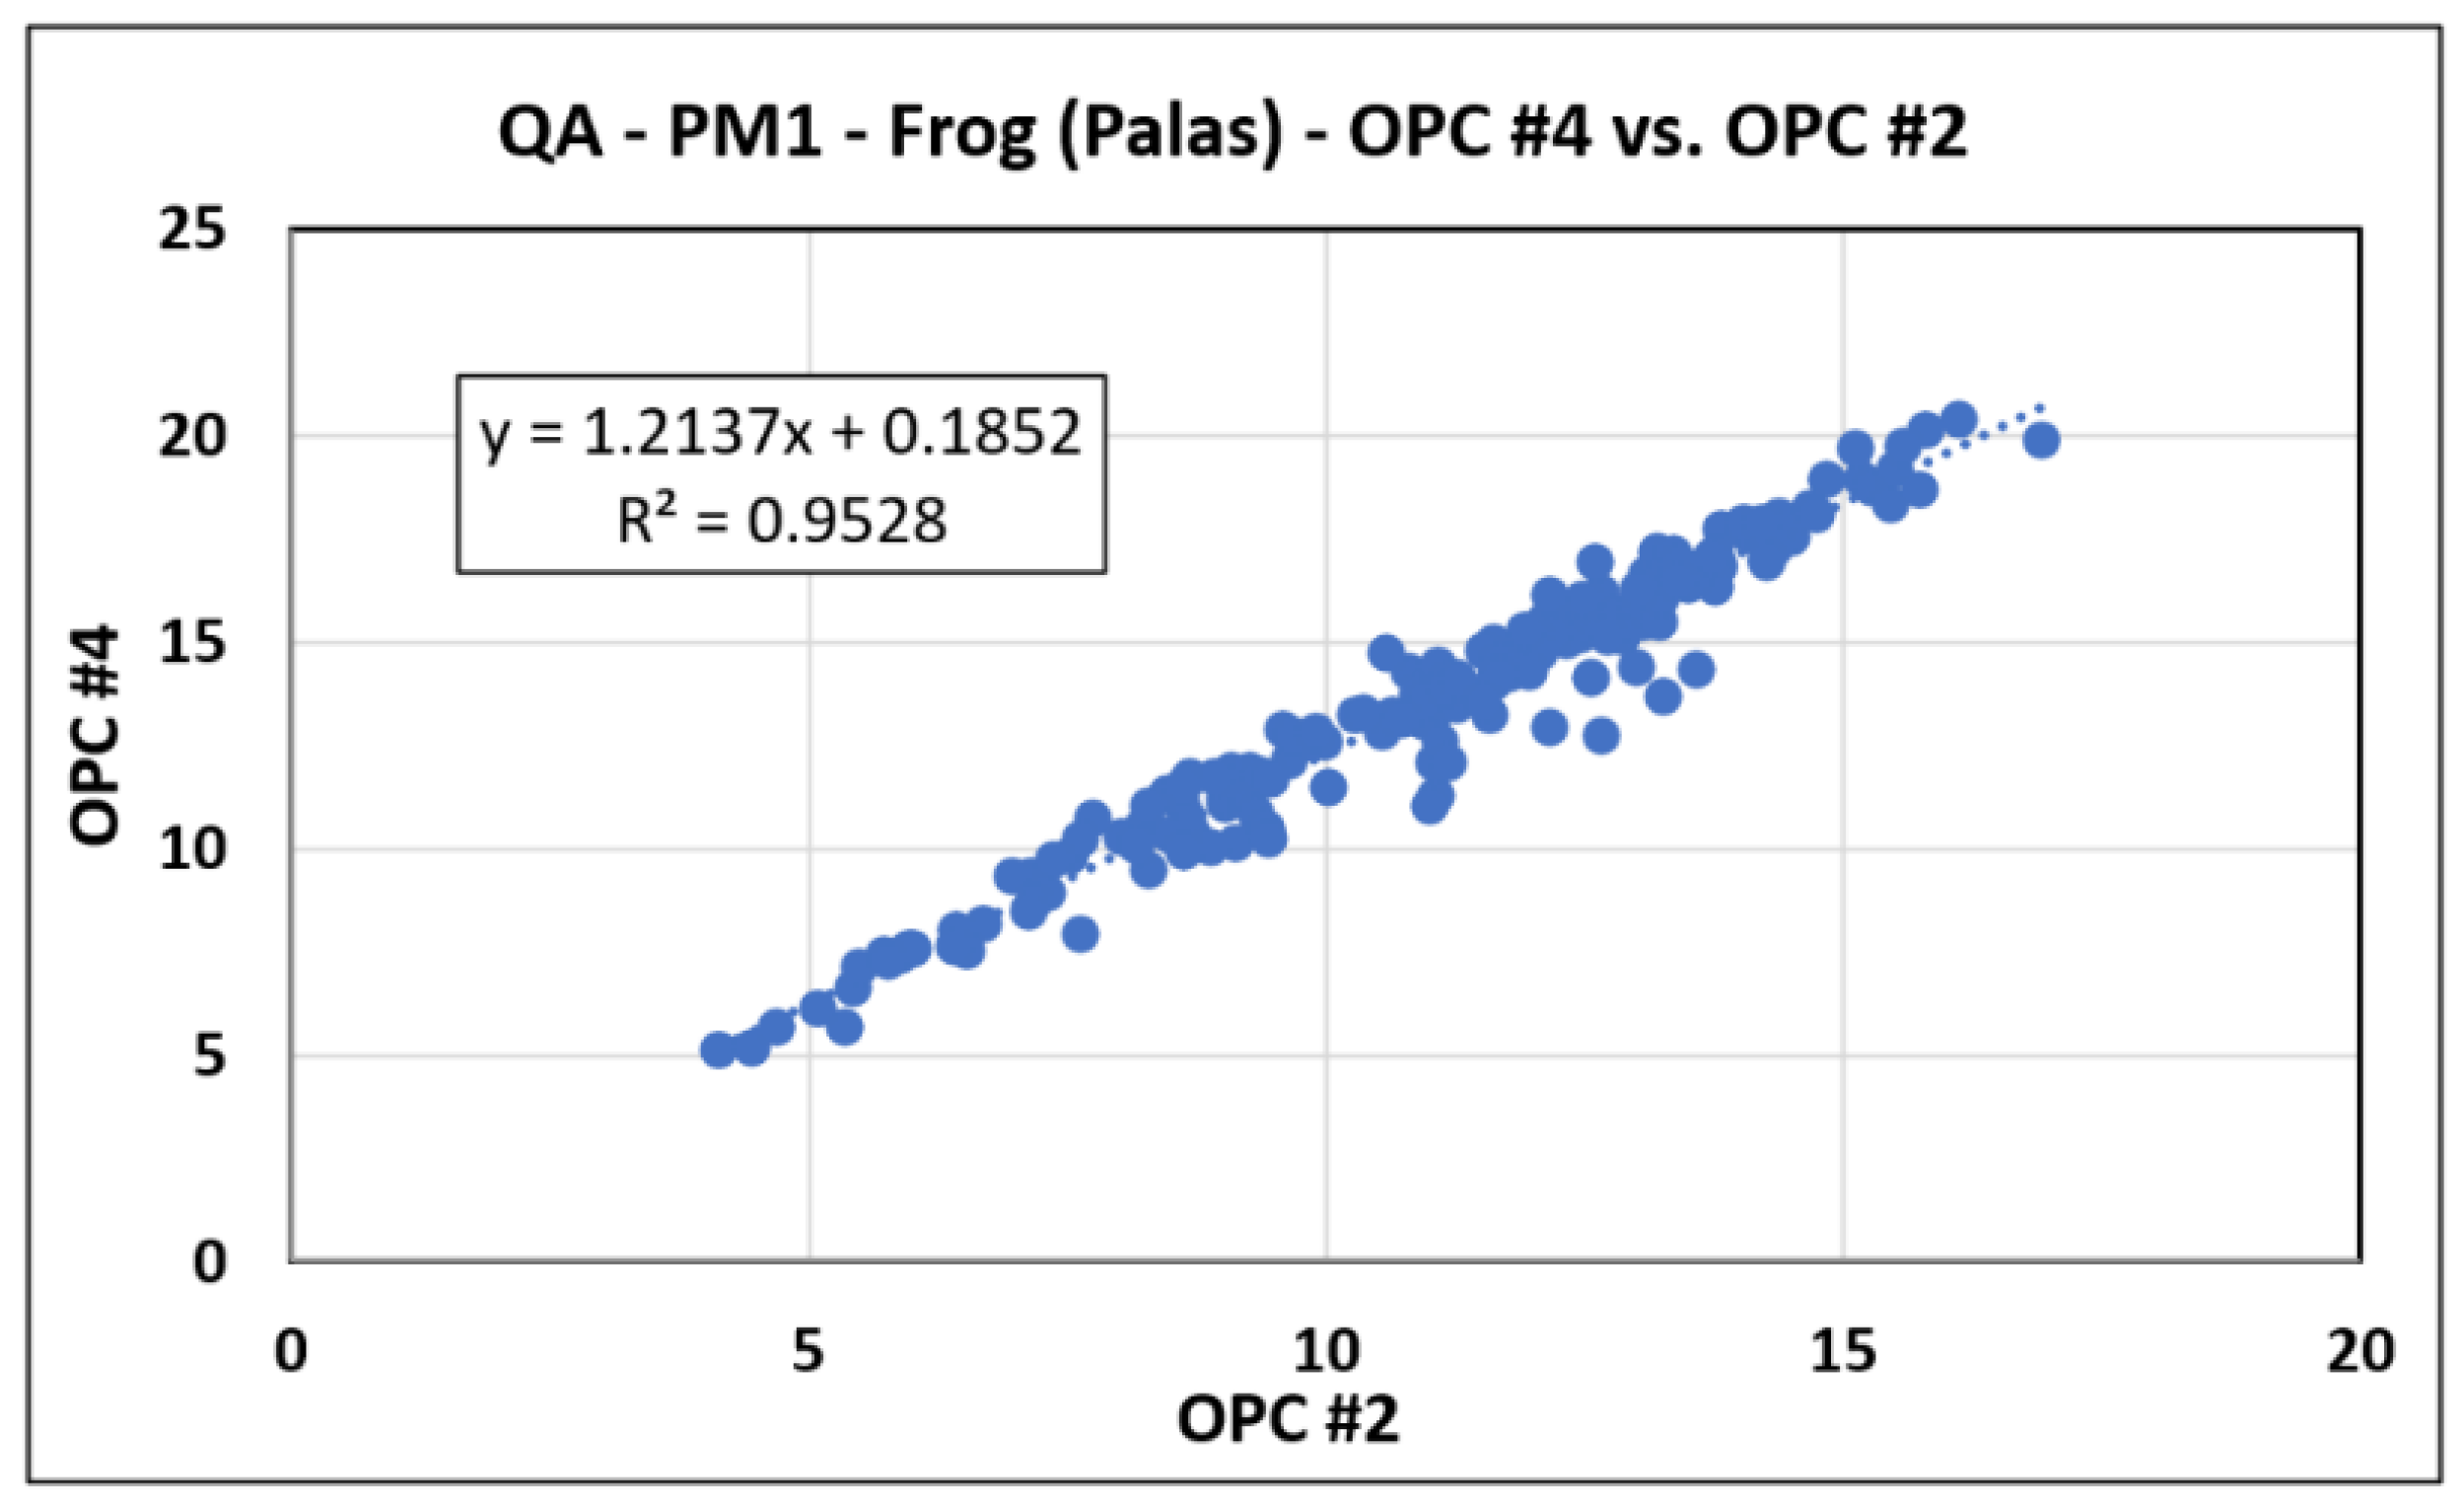
3.4. Quality Assurance

To be able to compare the data taken at different measurement locations, several quality assurance (QA) tests were conducted to ensure the results from the devices are comparable. The QA tests consisted of a colocation experiment in which all the devices were measured simultaneously at one location.
An example of the raw data from the QA can be seen in Figure 36 which shows the measurements from two OPC Frog (Palas) devices. Both graphs had a similar trend, but there was a gap between them. To make the results comparable, it was necessary for a correction equation to be applied. To create the correction equation, first, a reference device was selected as the baseline. This reference device was chosen based on how recently the device had been calibrated. The correction equation was then determined by an x–y plot in which the reference device was graphed with respect to the other device as shown in Figure 37. The resulting graph was fitted with an equation that became the correction equation. The R2 was also referenced to determine how close of a fit the equation was. The goal of the correction equation was for the results from all the other duplicates of the device to match the results of the reference device. The correction equation was then applied to the duplicate devices and the results were plotted as shown in Figure 38. Now, the concentrations from both devices match more closely, and the results are comparable. All other devices were corrected according to the same procedure.

4. Conclusions

Instruments with a high temporal resolution were used to assess the air quality inside the S-Bahn trains. The results indicated that the PNCs inside the train wagons increase when passing through the tunnel. This is mainly due to the influence of the air exchange through the train doors at the underground stations. Additionally, throughout the long section of the tunnel between Schwabstraße and Universität, there was a tendency for the PNC levels inside the train to decrease. The results also showed that the average number concentration of UFPs on underground platforms is significantly higher than those measured inside the S-Bahn trains and on the outdoor platforms by factors of about 1.7 to 1.9 for UFPs and 1.6 to 2 for coarse and fine particles. Additionally, it was revealed that the outside ambient air conditions have a direct impact on underground platform concentrations. During Feinstaubalarm days, the PNC values were significantly higher compared to days without Feinstaubalarm conditions for all particle size modes.
For both the PM and BC measurements, the trends recurrently showed an increase in mass concentration inside the train when it entered the tunnel and a decrease in concentration when the train was exiting and outside the tunnel. This was substantiated by the box plots of the mobile measurement concentrations at each station along the route which displayed higher PM and BC concentrations at the underground stations compared with the concentrations measured at the outdoor stations. This was further supported by the stationary measurement box plots, which also showed the concentrations on the underground platforms to be higher than those at the outdoor stations. Therefore, it was determined that the measured BC and PM concentrations were the highest on the underground platforms and the lowest on the outdoor platforms, with the levels inside the train varying to reflect the concentrations of the surrounding environment.
Additionally, the PM10 measured by the OPC Frog (Palas) was significantly more elevated inside the tunnel compared with the PM1 and PM2.5 levels. The results showed that the mobile measurement PM10 concentration in the train increased until it reached the stationary measurement PM10 concentration of the Hauptbahnhof platform. During the extended route measurements, it was also observed that the PM10 concentration greatly decreased when the train traveled outside the tunnel. Therefore, it was concluded that there is a higher fraction of coarse particles in the tunnel.
The results from the size distribution of all particle modes showed that particles smaller than 1 µm composed 99% of the entire particle number concentration values in the trains and on the underground platforms, with ultrafine (<0.1 µm) being the dominant fraction. The particle size distribution results inside the train and on the underground platforms were similar, suggesting the possibility of common sources. In both scenarios, the size distribution curves of the UFPs had peaks of around 40 nm, more than 91% of the entire PNCs were in the range of 10–116 nm, and 98% of the coarser particles were in the range of 0.3–1 µm.
Finally, examining the airflows from the wind roses at the different positions around the platform gave more insight as to why certain areas repeatedly had higher concentrations than others. However, only a limited number of measurement days had airflow profiles for the entire platform. Of these days, there were variations in the airflow directions at the different positions, and consistencies were not so apparent. While it is likely that the combined airflows from passing trains and entrances promote higher concentrations in particular areas, further analysis would be useful in obtaining a more comprehensive understanding.

Author Contributions

Conceptualization, A.S., K.A., D.A.F., I.C. and U.V.; methodology, A.S., K.A., D.A.F., I.C. and U.V.; validation, K.A. and D.A.F.; formal analysis, K.A. and D.A.F.; investigation, A.S., K.A., D.A.F. and I.C.; resources, U.V.; data curation, A.S., K.A. and D.A.F.; writing—original draft preparation, A.S., K.A. and D.A.F.; writing—review and editing, A.S., I.C. and U.V.; visualization, K.A. and D.A.F.; supervision, A.S., I.C. and U.V.; project administration, U.V.; funding acquisition, U.V. All authors have read and agreed to the published version of the manuscript.

Funding

This research received no external funding.

Acknowledgments

The authors would like to thank the company PALAS GmbH for providing the Fidas-Frog devices, as well as Achim Dittler for providing the SMPS (Nanoscan) and OPS (3330) devices for this research project.

Conflicts of Interest

The authors declare no conflict of interest.

References

  1. Martins, V.; Moreno, T.; Mendes, L.; Eleftheriadis, K.; Diapouli, E.; Alves, C.A.; Duarte, M.; de Miguel, E.; Capdevila, M.; Querol, X.; et al. Factors controlling air quality in different European subway systems. Environ. Res. 2016, 146, 35–46. [Google Scholar] [CrossRef] [PubMed] [Green Version]
  2. Moreno, T.; Pérez, N.; Reche, C.; Martins, V.; de Miguel, E.; Capdevila, M.; Centelles, S.; Minguillón, M.C.; Amato, F.; Alastuey, A.; et al. Subway platform air quality: Assessing the influences of tunnel ventilation, train piston effect and station design. Atmos. Environ. 2014, 92, 461–468, Advance online publication. [Google Scholar] [CrossRef]
  3. Querol, X.; Moreno, T.; Karanasiou, A.; Reche, C.; Alastuey, A.; Viana, M.; Font, O.; Gil, J.; de Miguel, E.; Capdevila, M. Variability of levels and composition of PM 10 and PM 2.5 in the Barcelona metro system. Atmos. Chem. Phys. 2012, 12, 5055–5076. [Google Scholar] [CrossRef] [Green Version]
  4. Cha, Y.; Olofsson, U.; Gustafsson, M.; Johansson, C. On particulate emissions from moving trains in a tunnel environment. Transp. Res. Part D Transp. Environ. 2018, 59, 35–45. [Google Scholar] [CrossRef]
  5. Cha, Y.; Abbasi, S.; Olofsson, U. Indoor and outdoor measurement of airborne particulates on a commuter train running partly in tunnels. Proc. Inst. Mech. Eng. Part F J. Rail Rapid Transit 2018, 232, 3–13. [Google Scholar] [CrossRef]
  6. Park, D.; Lee, T.; Hwang, D.; Jung, W.; Lee, Y.; Cho, K.; Kim, D.; Lees, K. Identification of the sources of PM10 in a subway tunnel using positive matrix factorization. J. Air Waste Manag. Assoc. 2014, 64, 1361–1368. [Google Scholar] [CrossRef] [PubMed]
  7. Martins, V.; Moreno, T.; Minguillón, M.C.; Amato, F.; de Miguel, E.; Capdevila, M.; Querol, X. Exposure to airborne particulate matter in the subway system. Sci. Total Environ. 2015, 511, 711–722. [Google Scholar] [CrossRef] [PubMed] [Green Version]
  8. Xu, B.; Hao, J. Air quality inside subway metro indoor environment worldwide: A review. Environ. Int. 2017, 107, 33–46. [Google Scholar] [CrossRef] [PubMed]
  9. Gustafsson, M.; Blomqvist, G.; Swietlicki, E.; Dahl, A.; Gudmundsson, A. Inhalable railroad particles at ground level and subterranean stations–Physical and chemical properties and relation to train traffic. Transp. Res. Part D Transp. Environ. 2012, 17, 277–285. [Google Scholar] [CrossRef]
  10. Ozgen, S.; Ripamonti, G.; Malandrini, A.; SRagettli, M.; Lonati, G. Particle number and mass exposure concentrations by commuter transport modes in Milan, Italy. AIMS Environ. Sci. 2016, 3, 168–184. [Google Scholar] [CrossRef]
  11. Gustafsson, M.; Abbasi, S.; Blomqvist, G.; Cha, Y.; Gudmundsson, A.; Janhäll, S.; Johansson, C.; Norman, M.; Olofsson, U. Particles in Road and Railroad Tunnel Air. Sources, Properties and Abatement Measures. Rep. 917a 2016. pp. 1–79. Available online: http://vti.diva-portal.org/smash/get/diva2:1059647/FULLTEXT01.pdf (accessed on 21 July 2022).
  12. Son, Y.-S.; Jeon, J.-S.; Lee, H.J.; Ryu, I.-C.; Kim, J.-C. Installation of platform screen doors and their impact on indoor air quality: Seoul subway trains. J. Air Waste Manag. Assoc. 2014, 64, 1054–1061. [Google Scholar] [CrossRef] [PubMed]
  13. TSI Incorporated: Nanoscan SMPS Nanoparticle Sizer Model 3910. 2012. Available online: https://tsi.com/getmedia/3188cb1d-2362-44c0-82b4-f2cc60afef17/NanoScan%20SMPS%203910_5001411?ext=.pdf (accessed on 1 September 2022).
  14. Palas GmbH: Fine Dust Measuring Device Operating Manual-Fidas Frog. 2017. Available online: https://www.manualslib.com/manual/2052143/Palas-Fidas-Frog.html (accessed on 1 September 2022).
  15. TSI Incorporated: Model 3330 Optical Particle Sizer Spectrometer Manual. 2013. Available online: https://www.kenelec.com.au/wp-content/uploads/2016/06/TSI_3330_Opticle_Particle_Sizer_Manual.pdf (accessed on 1 September 2022).
  16. Testo DISCmini: Diffusion Size Classifier Miniature. 2016. Available online: https://static-int.testo.com/media/ae/87/df0045b6f8dd/pb-testo-DiSCmini-Brochure-US.pdf (accessed on 1 September 2022).
  17. AethLabs: microAeth AE51 Operating Manual Rev 06. Updated July 2016. Available online: https://aethlabs.com/sites/all/conent/microaeth/ae51/microAeth%20AE51%20Operating%20Manual%20Rev%2006%20Updated%20Jul%202016.pdf (accessed on 1 September 2022).
  18. AethLabs: MA200 MA300 MA350 Operating Manual Rev 3 December 2018. Available online: https://aethlabs.com/sites/all/content/microaeth/maX/MA200%20MA300%20MA350%20Operating%20Manual%20Rev%2003%20Dec%202018.pdf (accessed on 1 September 2022).
  19. GILL Instruments Limited: MaxiMet-Manual-Iss-6. Compact Weather Stations. 2017. Available online: https://gillinstruments.com/wp-content/uploads/2022/08/1957-009-Maximet-gmx501-Iss-9.pdf (accessed on 1 September 2022).
  20. METER Group, Inc. ATMOS-22 Manual (7, 10-11). 2017. Available online: http://library.metergroup.com/Manuals/20419_ATMOS22_Manual_Web.pdf (accessed on 1 September 2022).
  21. Onset Computer Corporation. HOBO MX2300 Series Data Logger Manual. 2016. Available online: https://www.onsetcomp.com/files/manual_pdfs/20923-O%20MX2300%20Manual.pdf (accessed on 1 September 2022).
Figure 1. Measurement route between Österfeld to Bad Cannstatt.
Atmosphere 13 01875 g001
Figure 2. Devices set up for train/outdoor platform measurements on days 1 and 2.
Atmosphere 13 01875 g002
Figure 3. Devices set up for underground platform measurements.
Atmosphere 13 01875 g003
Figure 4. Devices set up for train/outdoor platform for “light measurements”.
Atmosphere 13 01875 g004
Figure 5. Particle number concentration inside the train measured by DC DiSCmini (testo), (a) trip 3 on day 1 and (b) trip 8 on day 11.
Atmosphere 13 01875 g005
Figure 6. PNC inside the train measured by OPS (TSI), (a) trip 3 on day 1 and (b) trip 8 on day 11.
Atmosphere 13 01875 g006
Figure 7. Average PNC inside the train and Hauptbahnhof platform measured by SMPS NanoScan (TSI) on day 11.
Atmosphere 13 01875 g007
Figure 8. Average PNCs inside the train and Hauptbahnhof platform measured by OPS (TSI) on day 1.
Atmosphere 13 01875 g008
Figure 9. Increase in PM concentration as the train travels from Österfeld to Bad Cannstatt.
Atmosphere 13 01875 g009
Figure 10. Increase in PM concentration as the train travels from Bad Cannstatt to Österfeld.
Atmosphere 13 01875 g010
Figure 11. Decrease in PM concentration after the tunnel as the train travels from Österfeld to Waiblingen.
Atmosphere 13 01875 g011
Figure 12. (a) PM1, (b) PM2.5, and (c) PM10 concentrations from mobile measurements in the train at stations along the measurement route.
Atmosphere 13 01875 g012
Figure 13. Variation in BC as the train travels through the underground tunnel.
Atmosphere 13 01875 g013
Figure 14. Variation in BC as the train travels from Bad Cannstatt to Österfeld.
Atmosphere 13 01875 g014
Figure 15. BC concentrations from mobile measurements in the train at stations along the measurement route.
Atmosphere 13 01875 g015
Figure 16. Particle size distribution curve of UFP in the train on day 11.
Atmosphere 13 01875 g016
Figure 17. Particle size distribution curve of coarse and fine particles in the train on day 11.
Atmosphere 13 01875 g017
Figure 18. Average PNCs on the Hauptbahnhof platform and outdoor platforms measured by DC DiSCmini (testo) on day 11.
Atmosphere 13 01875 g018
Figure 19. Average PNCs on the Hauptbahnhof platform and outdoor platforms measured by DC DiSCmini (testo) on day 2.
Atmosphere 13 01875 g019
Figure 20. Average PNCs on the Hauptbahnhof platform and outdoor platforms measured by OPS (TSI) on day 1.
Atmosphere 13 01875 g020
Figure 21. (a) PM1, (b) PM2.5, and (c) PM10 on the underground and outdoor platforms during non-Feinstaubalarm conditions.
Atmosphere 13 01875 g021
Figure 22. (a) PM1, (b) PM2.5, and (c) PM10 levels on the underground and outdoor platforms during Feinstaubalarm conditions.
Atmosphere 13 01875 g022
Figure 23. (a) PM1, (b) PM2.5, and (c) PM10 levels on the underground and outdoor platforms over the whole campaign.
Atmosphere 13 01875 g023
Figure 24. Varying BC concentrations on the underground and outdoor platforms.
Atmosphere 13 01875 g024
Figure 25. Comparison of BC concentrations from stationary measurements at underground and outdoor platforms (all days).
Atmosphere 13 01875 g025
Figure 26. Particle size distribution curves of UFPs on the Hauptbahnhof platform and on outdoor platforms.
Atmosphere 13 01875 g026
Figure 27. Particle size distribution curves of coarse and fine particles on the Hauptbahnhof and outdoor platforms.
Atmosphere 13 01875 g027
Figure 28. Overhead view of the Hauptbahnhof platform.
Atmosphere 13 01875 g028
Figure 29. Overhead view of the Schwabstraße platform.
Atmosphere 13 01875 g029
Figure 30. Increase in PM concentration when measuring at Positions 5 and 6.
Atmosphere 13 01875 g030
Figure 31. Hauptbahnhof platform wind roses in order of measurement positions moving clockwise around the platform.
Atmosphere 13 01875 g031
Figure 32. Summary of airflows along the Hauptbahnhof platform.
Atmosphere 13 01875 g032
Figure 33. PNCs at Schwabstraße platform measured by SMPS NanoScan (TSI) on day 4.
Atmosphere 13 01875 g033
Figure 34. Schwabstraße platform wind roses in order of measurement positions moving counter-clockwise around the platform.
Atmosphere 13 01875 g034
Figure 35. Main airflows along the Schwabstraße platform.
Atmosphere 13 01875 g035
Figure 36. One minute average PM1 data from two OPCs graphed together for comparison.
Atmosphere 13 01875 g036
Figure 37. OPC #2 graphed with respect to the reference device (OPC #4) with the correction equation displayed.
Atmosphere 13 01875 g037
Figure 38. The reference device OPC #4 and the corrected OPC #2.
Atmosphere 13 01875 g038
Table 1. Air pollutant and meteorological devices used during the measurement campaign.
ParameterMeasurement Technique and PrincipleEquipment ModelMeasurement RangeTime Resolution
Air pollutant devices
UFP + size distributionScanning Mobility Particle Sizer (SMPS) + Condensation Particle Counter (CPC)
→ Particle condensation
NanoScan 3910 (TSI)10–420 nmSize distributions: 60 s
Single size mode: 1 s
UFPDiffusion charger (DC) × 2DiSCmini (testo)10–700 nm1 s
PM2.5, PM10 + size distributionOptical Particle Counter (OPC)
→ Light scattering
OPS 3330 (TSI)0.3–10 µm1 s
PM2.5, PM10 + size distributionOptical Particle Counter (OPC)
→ Light scattering
Fidas Frog (Palas)0.15–18 µm1 s
Black CarbonAethalometry
→ IR and visible light absorption
MA200 (AethLabs)0–1 mg BC/m31 s
Black CarbonAethalometry
→ IR light absorption
AE51 (AethLabs)0–1 mg BC/m31 s
Meteorological devices
Wind speed + directionCompact weather station
Anemometer
Maximet GMX501 (Gill)
ATMOS-22 (METER)
-
-
1 s
Temperature + Humidity-HOBO (Onset)-1 s
Table 2. Measurement campaign days and times measured.
Day1234567891011
Morning
Afternoon
Table 3. Measurement device locations by campaign day.
EquipmentLocation
Air PollutantsQuantityDay 1–2Day 3–4Day 5–10Day 11
OPC Frog (Palas)Train, HBF, Schwab.HBF, Schwab.Train, HBF, Schwab.HBF
SMPS Nanoscan (TSI)Train, HBFHBF, Schwab.HBF, Schwab.Train, HBF
OPC OPS (TSI)Train, HBFHBF, Schwab.HBF, Schwab.Train, HBF
DC DiSCmini (testo)Train, HBFHBF, Schwab.Train, HBFTrain, HBF
Aethalometer MA200 (Aethlabs)Train, HBFHBF, Schwab.HBF, Schwab.Train, HBF
Aethalometer AE51 (Aethlabs)Schwab.-Train-
Meteorological parameters
MaxiMet (Gill)-HBFHBFHBF
ATMOS-22 (METER Environment)Schwab.Schwab.Schwab.-
HOBO (Onset)Train, HBF, Schwab.HBF, Schwab.HBF, Schwab.HBF
Table 4. Average PNC inside the train and Hauptbahnhof platform for all particle modes.
Ultrafine Average PNC in #/cm3Coarse and Fine Average PNC in #/cm3
HBF PlatformS-Bahn TrainHBF/TrainHBF PlatformS-Bahn TrainHBF/Train
Day 111,82169921.714729561.5
Day 216,65799821.7---
Day 1118,97999041.9403127071.5
Table 5. Average PNCs on Hauptbahnhof and outdoor platforms for all particle modes.
Ultrafine Average PNC in #/cm3Coarse and Fine Average PNC in #/cm3
HBF PlatformOutdoor PlatformHBF/OutdoorHBF PlatformOutdoor PlatformHBF/Outdoor
Day 110,74353502.015253684.1
Day 215,88098631.6---
Day 1118,82810,3631.8400138081.1
Publisher’s Note: MDPI stays neutral with regard to jurisdictional claims in published maps and institutional affiliations.

