Article

Error Decomposition of CRA40-Land and ERA5-Land Reanalysis Precipitation Products over the Yongding River Basin in North China

1
Nanjing Hydraulic Research Institute, Nanjing 210029, China
2
Yangtze River Conservation and Green Development Research Institute, Nanjing 210098, China
3
Anhui Institute of Meteorological Sciences, Hefei 230000, China
4
Lvliang Meteorology Bureau of Shanxi Province, Lvliang 033000, China
*
Author to whom correspondence should be addressed.
Submission received: 15 October 2022 / Revised: 16 November 2022 / Accepted: 17 November 2022 / Published: 21 November 2022
(This article belongs to the Topic Advanced Research in Precipitation Measurements)

Abstract

:
Long-term and high-resolution reanalysis precipitation datasets provide important support for research on climate change, hydrological forecasting, etc. The comprehensive evaluation of the error performances of the newly released ERA5-Land and CRA40-Land reanalysis precipitation datasets over the Yongding River Basin in North China was based on the two error decomposition schemes, namely, decomposition of the total mean square error into systematic and random errors and decomposition of the total precipitation bias into hit bias, missed precipitation, and false precipitation. Then, the error features of the two datasets and precipitation intensity and terrain effects against error features were analyzed in this study. The results indicated the following: (1) Based on the decomposition approach of systematic and random errors, the total error of ERA5-Land is generally greater than that of CRA40-Land. Additionally, the proportion of random errors was higher in summer and over mountainous areas, specifically, the ERA5-Land accounts for more than 75%, while the other was less than 70%; (2) Considering the decomposition method of hit, missed, and false bias, the total precipitation bias of ERA5-Land and CRA40-Land was consistent with the hit bias. The magnitude of missed precipitation and false precipitation was less than the hit bias. (3) When the precipitation intensity is less than 38 mm/d, the random errors of ERA5-Land and CRA40-Land are larger than the systematic error. The relationship between precipitation intensity and hit, missed, and false precipitation is complicated, for the hit bias of ERA5-L is always smaller than that of CRA40-L, and the missed precipitation and false precipitation are larger than those ofCRA40-L when the precipitation is small. The error of ERA5-Land and CRA40-Land was significantly correlated with elevation. A comprehensive understanding of the error features of the two reanalysis precipitation datasets is valuable for error correction and the construction of a multi-source fusion model with gauge-based and satellite-based precipitation datasets.

1. Introduction

Precipitation is one of the most fundamental processes of the hydrologic cycle and is closely associated with water resources, agricultural production, and economic development. As a result of global warming, extreme precipitation events have attracted increasing attention from researchers [1]. For a long time, the studies have considered mainly gauge-based measurements of precipitation; however, these methods have various shortcomings, such as human–material constraints, geographical constraints, and uneven distribution, especially in oceans, large lakes, deserts, and alpine mountains [2,3]. Since the 1990s, advances in Earth observation space technology have presented an opportunity to obtain information on the spatial distribution of precipitation. Although weather radar has a higher temporal and spatial resolution than satellite, it has limited scope and high costs. However, the satellite-retrieved precipitation is limited by inversion algorithms and sensor performance and has disadvantages, such as limited accuracy of output precipitation data. Long series high-resolution precipitation datasets are essential for research on climate changes, hydrological forecasting, etc. However, these datasets are difficult to obtain, and the reanalysis of the precipitation datasets can overcome the above limitations [4]. Existing research has indicated that the reanalysis-based approach well captures the seasonality of precipitation [5,6,7]. Sun et al. summarized the basic features of 30 global precipitation datasets and found large differences in the estimated values of different precipitation datasets and a larger degree of variability in reanalysis datasets than in other types of datasets [8]. ERA5, the fifth-generation reanalysis dataset released by the European Centre for Medium-Range Weather Forecasts (ECMWF) and CRA40, China’s first-generation land surface reanalysis data produced by the China Meteorological Administration (CMA), are the two latest reanalysis precipitation datasets.
Colorado-Ruiz G evaluated the simulation performances of ERA5, ERA-Interim, and CFSR(Climate Forecast System Reanalysis) reanalysis datasets for extreme and non-extreme precipitation indicators in the southern United States and Mexico, and demonstrated that ERA5 showed significantly better performance than the other two reanalysis precipitation products [9]. Li et al., evaluated the performance of the CRA40 dataset in typical monsoon regions around the world and demonstrated that CRA40 seemed to slightly underestimate low rainfall but overestimate high rainfall. They also observed that the average global/hemispheric precipitation increased by 0.02–0.11 mm/day/decade in all the reanalysis precipitation (CRA40, ERA5, JRA55, and MERRA2) datasets [10]. Jiang et al. [11] and Xin et al. [12] evaluated the accuracy of the ERA5 precipitation dataset in China and observed significant variations in the ERA5 performance in different climatic regions. Moreover, the simulated precipitation had a large deviation, but the ability to detect precipitation events was better than several other satellite precipitation products. ERA5 performed better in the dry season in coastal urban areas and in the rainy season in mountainous vegetation areas and demonstrated insufficient simulation ability in highly urbanized areas. Colorado-Ruiz et al. [13], Huang et al. [14], and Amjad et al. [15] indicated that although the reanalysis of precipitation can detect precipitation events and reproduce spatial and temporal distributions, it can lead to overestimation of precipitation in most cases.
The error decomposition method was used to reveal the error features of the two reanalysis datasets. There are two main existing error decomposition schemes. One was proposed by Willmott [16], in which the total mean square error was divided into systematic and random errors. For example, Shen et al. [17] applied this scheme to evaluate the accuracy of GPM(Global Precipitation Measurement) and TRMM(Tropical Rainfall Measuring Mission). Similar studies were also conducted by Chen et al. [18], Tang et al. [19], Masood et al. [20], and Tang et al. [21]. The second error decomposition scheme was first proposed by Tian et al. [22] in 2009, and they divided the total error into hit bias (HB), missed precipitation (MP), and false precipitation (FP). For example, Chen et al. [18] evaluated the variations in the error components of IMERG-Late, GSMaP-MVK, and PERSIANN-CCS SPP precipitation datasets in different seasons. Su et al. [23] evaluated the performance of four GPM-based precipitation estimations over mainland China from April 2014 to December 2016. Several studies have demonstrated that the topography and precipitation intensity were closely associated with the reanalysis precipitation accuracy [22,24,25,26]. However, these studies focused only on the total bias of different terrains, ignoring the correlation error of parameter estimates. Thus, the significance of the error components and the formation of terrains have not been well understood [27,28]. Existing studies focus only on random and systematic decomposition of errors of different properties, or focus only on false positives and missed positives, etc. There are few reports on comprehensive interpretation of errors by combining the two methods.
Several researchers have conducted numerous studies to assess the accuracy and applicability of reanalysis precipitation products. The density of rain gauges in Northwest China is low [29], which can have an impact on the accuracy of the dataset. Only a few studies are available on the reanalysis of precipitation data in North China, especially the 40-year global reanalysis dataset released by CMA, i.e., CRA40-Land (CRA) for the land surface in China. The purpose of this study was to evaluate the error features of two reanalysis precipitation datasets, namely, ERA5-Land and CRA40-Land (CRA) in northern China, based on the two error decomposition techniques and further analyze the spatiotemporal variations in errors and correlation with precipitation intensity and terrain features. This study can act as a reference for the selection of the two datasets in the fields of meteorology and hydrology, as well as help in the selection of parameters for the construction of the error-correction model.
The structure of this paper is as follows: (1) Section 2 introduces the study area and the dataset, (2) Section 3 introduces the methods used in this study, (3) Section 4 is the analysis and discussion of results, and (4) Section 5 concludes this study.

2. Study Area and Datasets
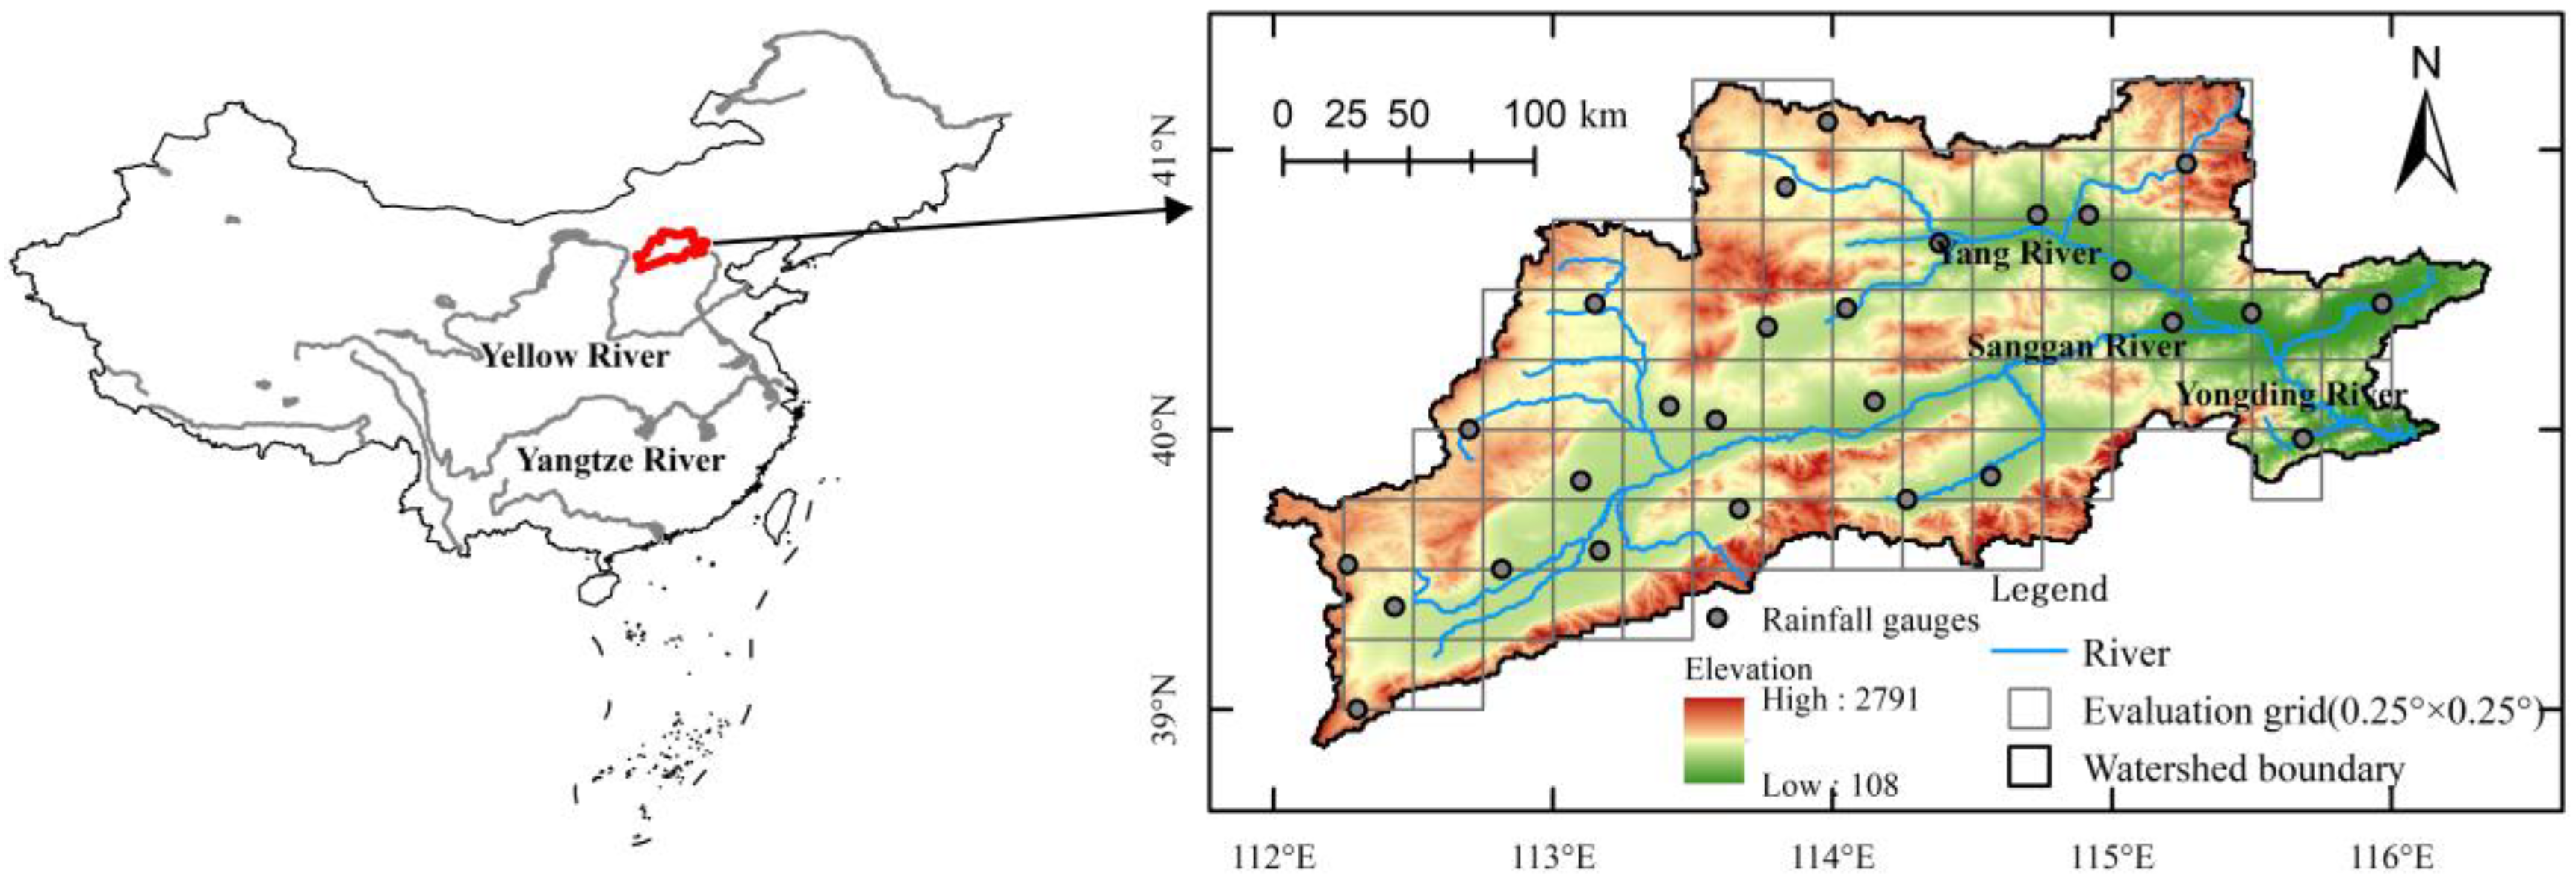
2.1. Study Area

The study area is the Yongding River Basin, a sub-basin of the Haihe River Basin. The study area lies between 111.95–116.22° longitude and 38.90–41.16° latitude. Yongding River flows through five provincial administrative regions, including Beijing and Tianjin, with a catchment area of 47,000 km2, accounting for approximately 14.7% of the Haihe River Basin. The primary tributaries of the upper reaches of the Yongding River are the Sanggan River and the Yang River, which it is known as the Yongding River after their confluence. This region has a semi-humid and semi-arid monsoon climate, with annual average precipitation between 360 and 650 mm. The precipitation is concentrated mainly in summer, and the precipitation from June to August accounts for approximately 80% of the average annual precipitation. The study area is represented in Figure 1.

2.2. Ground Reference Data

In this study, CGDPA (China Gauge-based Daily Precipitation Analysis) was used as the ground reference product, and the raw precipitation data of CGDPA were collected from 2419 meteorological stations in mainland China (including approximately 35 gauges in and around the Yongding River Basin). The National Meteorological Information Center uses the optimal interpolation method based on climatology to interpolate the CGDPA data into raster data at a resolution of 0.25° × 0.25° (http://data.cma.cn, accessed on 15 August 2022). According to the study by Shen et al. [29], the CGDPA product had high precision and could estimate precipitation of varying magnitudes, especially heavy precipitation. In North China, the underestimation of average daily precipitation in summer was 0.13 mm/d, the underestimation in winter was 0.02 mm/d, and the correlation coefficient with the observed precipitation was greater than 0.5. At present, CGDPA has been widely used in the performance evaluation of satellite precipitation products [30,31,32,33]. The CGDPA data of daily precipitation was selected for the duration from 1 January 2017, to 31 December 2019. Some of the missing daily data were discarded without affecting the error evaluation.

2.3. Reanalysis Data

2.3.1. ERA5-Land

The ERA5-Land data is the latest (fifth generation) climate reanalysis dataset produced by the ECMWF, providing hourly data using the 4D-Var data assimilation technique in the Integrated Forecast System (IFS) model cycle CY41R2. ERA5-Land data has a higher resolution in space with enhanced product quality [34,35]. ERA5-Land is a data product obtained by simulations using the tiled ECMWF Scheme for Surface Exchanges over Land incorporating land surface hydrology (H-TESSEL), i.e., land surface model implemented in ERA5-Land in offline mode using atmospheric forcing [36] (https://cds.climate.copernicus.eu/doi/10.24381/cds.e2161bac, accessed on 15 August 2022). When compared with ERA5-Land, the elements such as precipitation and temperature in ERA5-Land were closer to the observed data. In addition, the model used in ERA5-Land is an updated version of the integrated forecast system (IFS CY45R1 model), which also has a higher horizontal resolution and more detailed physical processes and parameterization schemes. Therefore, the land surface product is more accurate and reliable [37]. The selected data length in ERA5-Land is consistent with CGDPA, where ERA5-Land (hereafter referred to as ERA5-Land) has a temporal resolution of 1 h and a spatial resolution of 0.1° × 0.1°, which is resampled using a bilinear interpolation method to 0.25°.

2.3.2. CRA40-Land

The CRA40 dataset is the first generation of land surface reanalysis products in China produced by the CMA. The dataset covers approximately 40 years of data from 1979 to 2020, with a spatial resolution of 34 km and a temporal resolution of 3 h (http://data.cma.cn, accessed on 15 August 2022). The dataset is based on a data assimilation algorithm, multi-source fusion method, Noah-3.3 Land Surface Model, and established core technologies, such as surface parameter optimization [38]. It uses the observation data after 1979 of approximately 60 types of space-borne sensors from nearly 80 meteorological observation satellites, which are part of the international third-generation reanalysis products. Simultaneously, it also makes full use of several satellite reprocessing products released in recent years to replace the real-time products of the same period. The data integrity and data quality of these products were found to be significantly improved [39]. The CRA dataset includes two types of data, namely, atmosphere-driven fusion products and land surface products. The precipitation from CRA40-Land dataset combines the global precipitation products generated by the global surface rain gauge analysis (CPCU) and the global satellite precipitation (GPCP). The CRA40-Land (hereafter denoted as CRA40-Land) precipitation data used in this study were time-aligned with CGDPA and resampled to 0.25° using a bilinear interpolation method.

3. Methods

3.1. Technical Scheme

The quantitative and categorical indicators were used to evaluate the precision of the precipitation data (Jiang et al. [11] and Xin et al. [12]). The quantitative indicators included Pearson correlation coefficient (CC), relative bias (RB), and root mean square error (RMSE). The closer the CC was to 1 and the closer the absolute values of RB and RMSE were to zero, the higher the precipitation accuracy. The classification indicators used for evaluation included the probability of detection (POD), false alarm ratio (FAR), and critical success index (CSI).
C C = i = 1 n x i x ¯ y i y ¯ i = 1 n x i x ¯ 2 i = 1 n y i y ¯ 2
R B = i = 1 n ( x i y i ) i = 1 n y i × 100 %
R M S E = i = 1 n ( x i y i ) 2 n
where x represents reanalysis precipitation, y denotes ground reference precipitation, and n is the number of samples.
P O D = H H + M
F A R = F H + F
C S I = H H + M + F
where H is the number of events observed by both reanalysis data and reference data, M is the number of events observed by reference data but not by reanalysis data, and F is the opposite of M.
The error decomposition methods considering the precipitation-fitting effect and rain/no rain state were used for the error decomposition to quantitatively evaluate the overall precipitation errors of ERA5-Land and CRA40-Land. The simultaneous assessment of the errors of the two reanalysis precipitation products revealed the correlation of the error with precipitation intensity and terrain. On the basis of this, the spatiotemporal variations in error features were further analyzed. The technical scheme is shown in Figure 2.

3.2. Systematic and Random Errors Decomposition

In 1981, Willmott [16] proposed that the mean square error (MSE) of precipitation can be divided into systematic and random components, as shown by Equation (1).
M S E = M S E s + M S E r
where MSE is the total mean square, MSEs is the systematic component, and MSEr is the random component. Equation (1) can be expanded as [40].
1 n i = 1 n ( P r P r e f ) 2 = 1 n i = 1 n ( P r * P r e f ) 2 + 1 n i = 1 n ( P r P r * ) 2
P r * = a × P r e f + b
M S E = 1 n i = 1 n ( P r P r e f ) 2
M S E s = 1 n i = 1 n ( P r * P r e f ) 2
M S E r = 1 n i = 1 n ( P r P r * ) 2
where Pr is the original reanalysis precipitation, Pr* is the regressed reanalysis precipitation, and Pref is the reference precipitation. Pr* is expressed as a linear error model, where a is the slope, and b is the intercept.

3.3. Hit, Missed, and False Errors Decomposition

The total precipitation error describes the degree to which the precipitation datasets overestimate or underestimate the surface precipitation. However, they may not reveal useful information because the error components could cancel one another, especially the quantitative error determined under different classification and identification conditions. The error decomposition method considering rain/no rain state was first proposed by Tian et al. [22] and later developed by Yong et al. [41]. This method can be used to determine the error source associated with precipitation estimates. This approach decomposes the total precipitation bias (TB) into three independent components, namely, HB (hit bias, precipitation occurs in both R and G), MP (missed precipitation, precipitation occurs only in G), and FP (false precipitation, precipitation occurs only in R). An in-depth analysis of the composition and features of the total error as well as the spatiotemporal distribution features of each sub-error can provide important information for improving the precipitation accuracy and the rational selection of datasets.
T B = H B + M P + F P
P ( x , t ) = { 1 if   C ( x , t )   >   T 0 if   C ( x , t ) = T   or   missing
H B = t = 1 ( R t G t ) P ( R t T ) P ( G t T )
M P = t = 1 ( R t G t ) P ( R t < T ) P ( G t T )
F P = t = 1 ( R t G t ) P ( R t T ) P ( G t < T )
where P ( x , t ) represents a binary-valued precipitation event mask, C ( x , t ) represents a precipitation field, and T represents a rain/no rain threshold. For mathematical derivation, T = 0 is used as the rain/no rain threshold to determine the mask. However, in practice, a small value (e.g., 0.1 mm/d or 1 mm/d) instead of 0 is usually used as the rain/no rain threshold to determine the mask. R is the reanalysis precipitation, and G is the reference precipitation.
Thus, TB can be decomposed into three mutually independent components, where the absolute values of the three components may be greater than TB mainly because of MP and FP, which have opposite signs and can cancel one another.

4. Results and Discussion

4.1. Overall Accuracy

Xu et al. [42], Zhao et al. [43], and Li et al. [44] demonstrated that the total error and error components were seasonally dependent, and thus, focused on three different periods: (1) annual, (2) summer (June–August), and (3) winter (December–February).
The quantitative and classification accuracies of the two reanalysis precipitation products are shown in Table 1. For quantitative accuracy, CRA40-Land had lower CC and RMSE and higher RB in the summer. Considering the RB index as the relative value of total precipitation, CRA40-Land demonstrated higher accuracy in the summer. However, the situation in winter was found to be different when the CC and RMSE of the two reanalysis precipitation products were comparable, but the ERA5-Land overestimated the data by 46.8%. If the period considered was annual, the CC, RB, and RMSE of CRA40-Land were lower than those of ERA5-Land. Both the products overestimated the reference precipitation but by different proportions. The larger the precipitation, the smaller the percentage of overestimation (winter > annual > summer). There was no major difference in the classification indicators of the two products, and the FAR and CSI of CRA-40 were better in winter, which was in agreement with the results observed using the RB indicator. Overall, the accuracy of CRA40-Land was found to be better than that of ERA5-Land, but the sources and features of the two error components were still unknown. The following section evaluates the decomposition errors of the products in detail.
Table 2 shows the total error and error components averaged to each grid annually, in summer, and in winter. It can be observed that for the error decomposition scheme, considering the precipitation-fitting effect, the total error and error components averaged to each grid in summer were much higher than those observed annually. The trend observed in summer was opposite of that observed in winter. In this study, a relatively large proportion of random errors was observed, accounting for 80.1% in ERA5-Land and 69.4% in CRA40-Land. The total error of ERA5-Land was also higher than that of CRA40-Land. In summer, the total error of ERA5-Land was almost double that of CRA40-Land, while there was not much difference in the total errors of the two products in winter. However, the comprehensive evaluation of the error features of the two reanalysis precipitation products was based on the homogenization of the equations in both time and space. Therefore, further analysis is required considering the spatiotemporal variability.
For the error decomposition method considering rain/no rain conditions, the overall evaluation was not based on the time-averaged mean values but on the cumulative errors over time, and the errors in summer and winter were part of the annual errors. The evaluation results indicated that the three summer months of June, July, and August were the largest contributors to the total error. Among the three error components, FP was much higher than the other two. It should be noted that the cumulative error results are not necessarily reliable as the positive sign of TB and the negative sign of HB could cancel one another. This occurs not only between the error components but also in the time series of each component. Therefore, for a comprehensive evaluation of associated errors, it is necessary to further analyze the precipitation data considering the spatiotemporal variability to overcome the influence of numerical cancellation.

4.2. Systematic and Random Errors

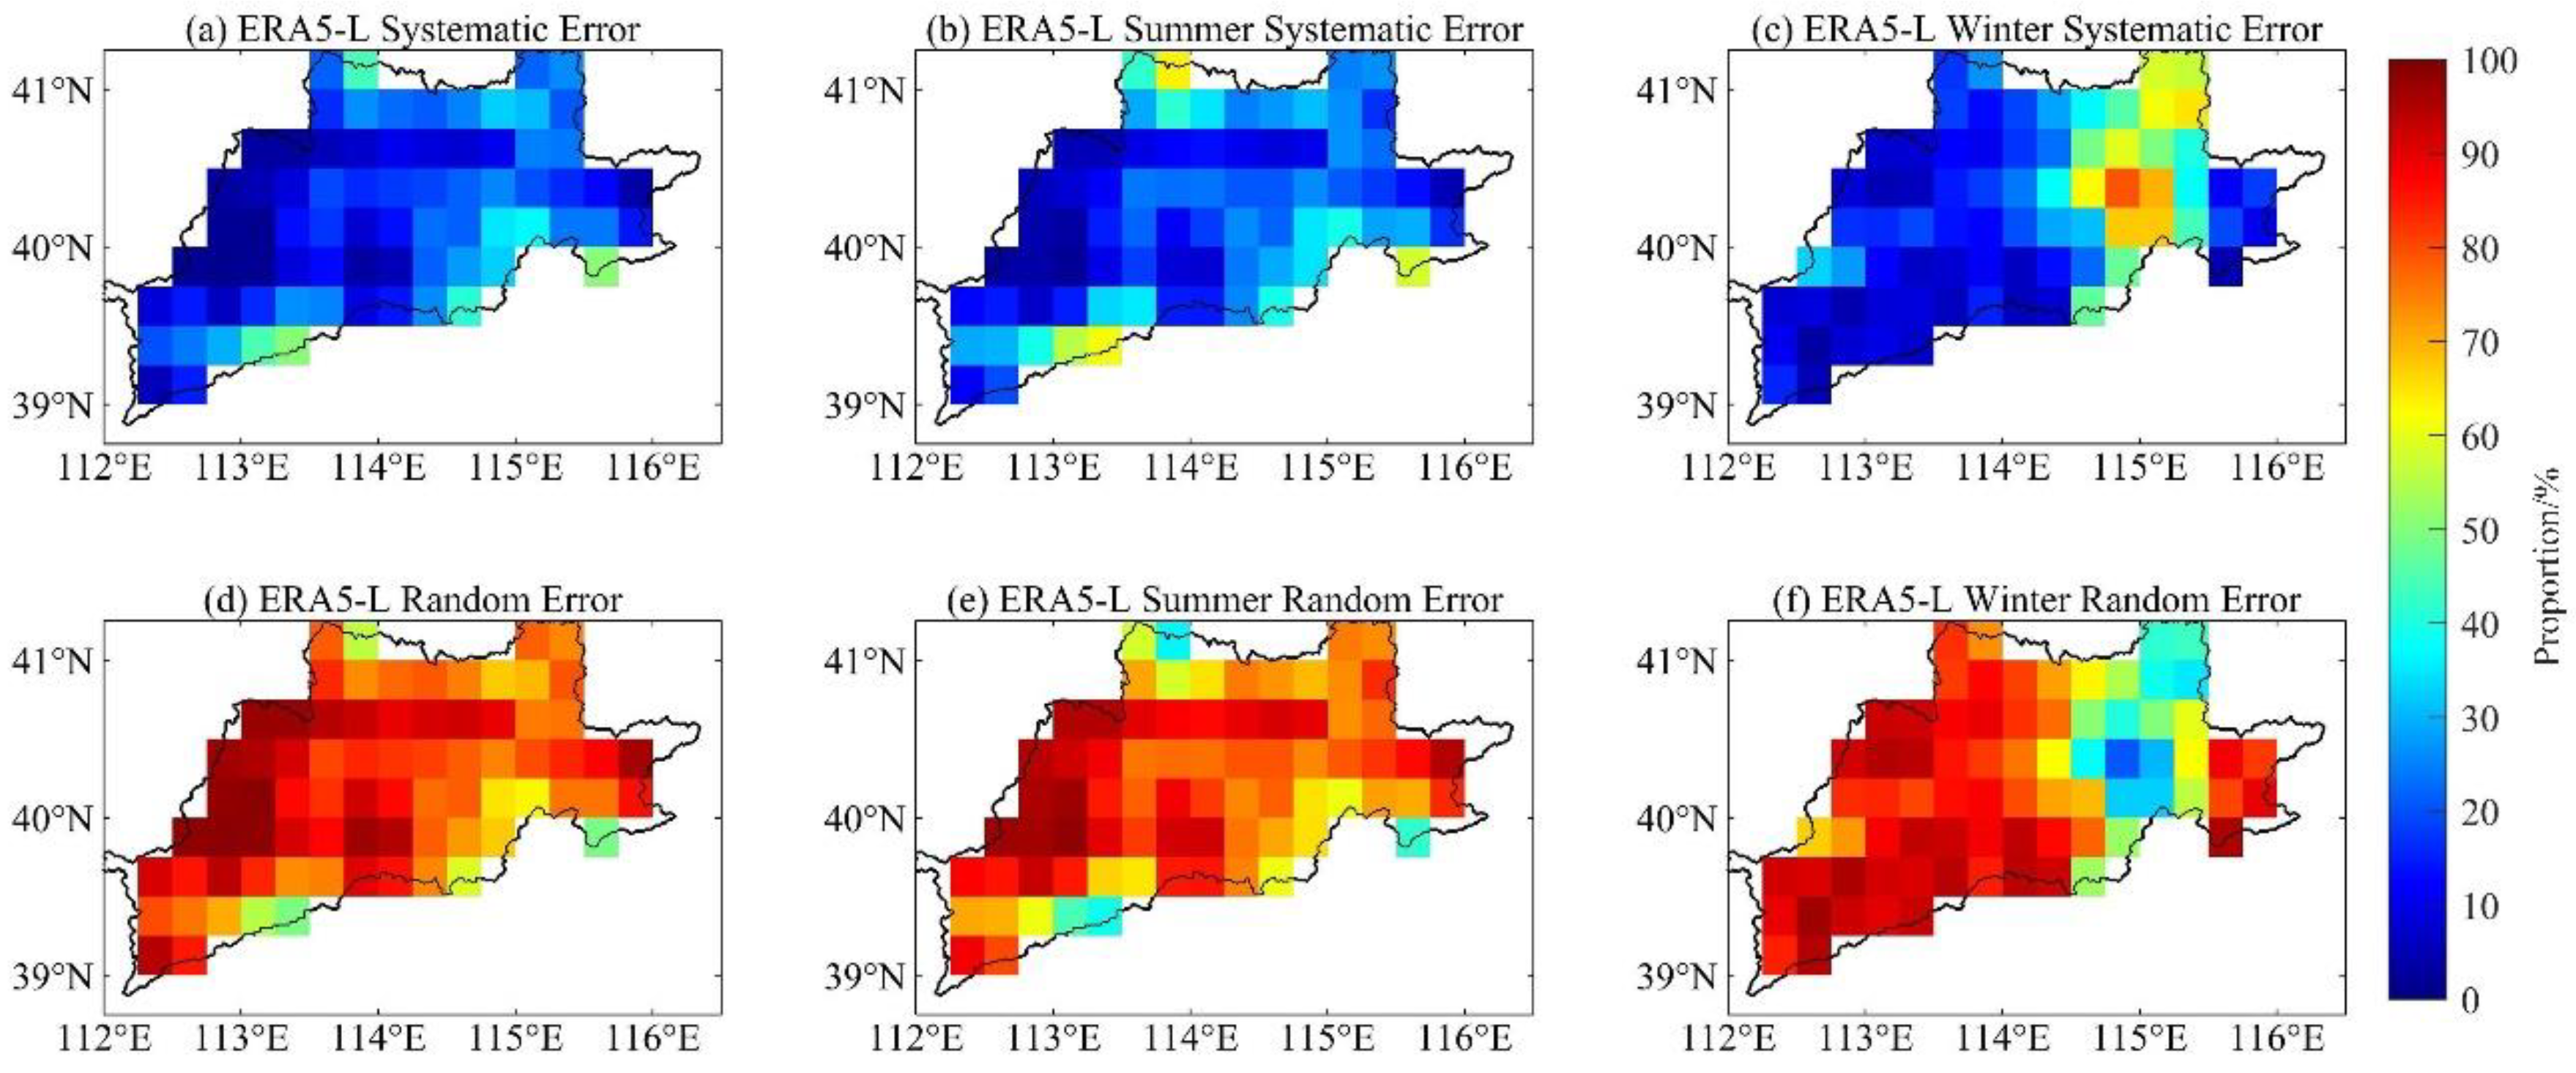
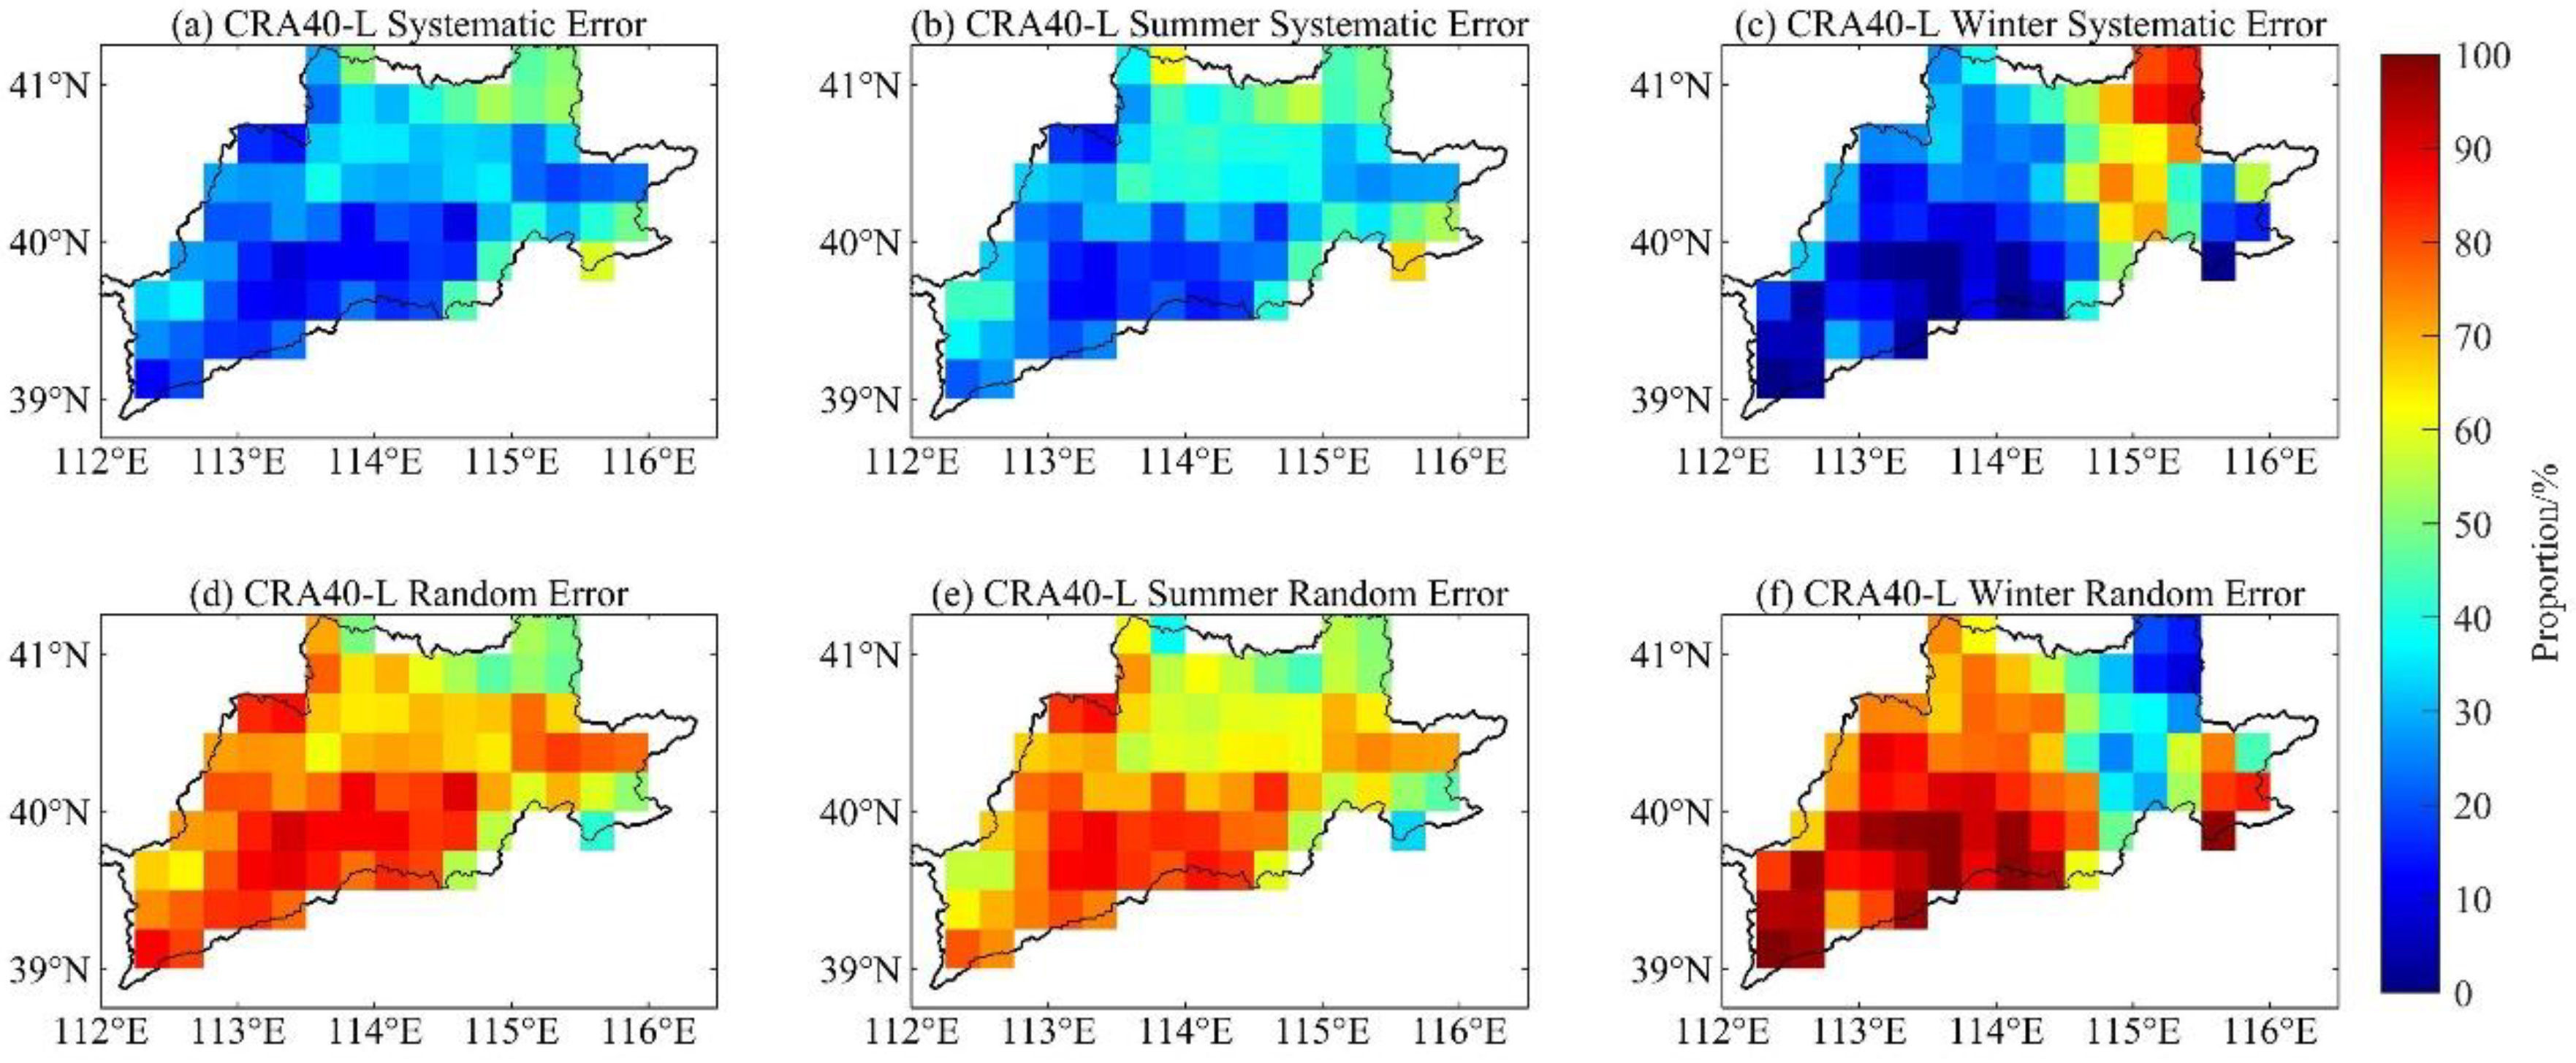
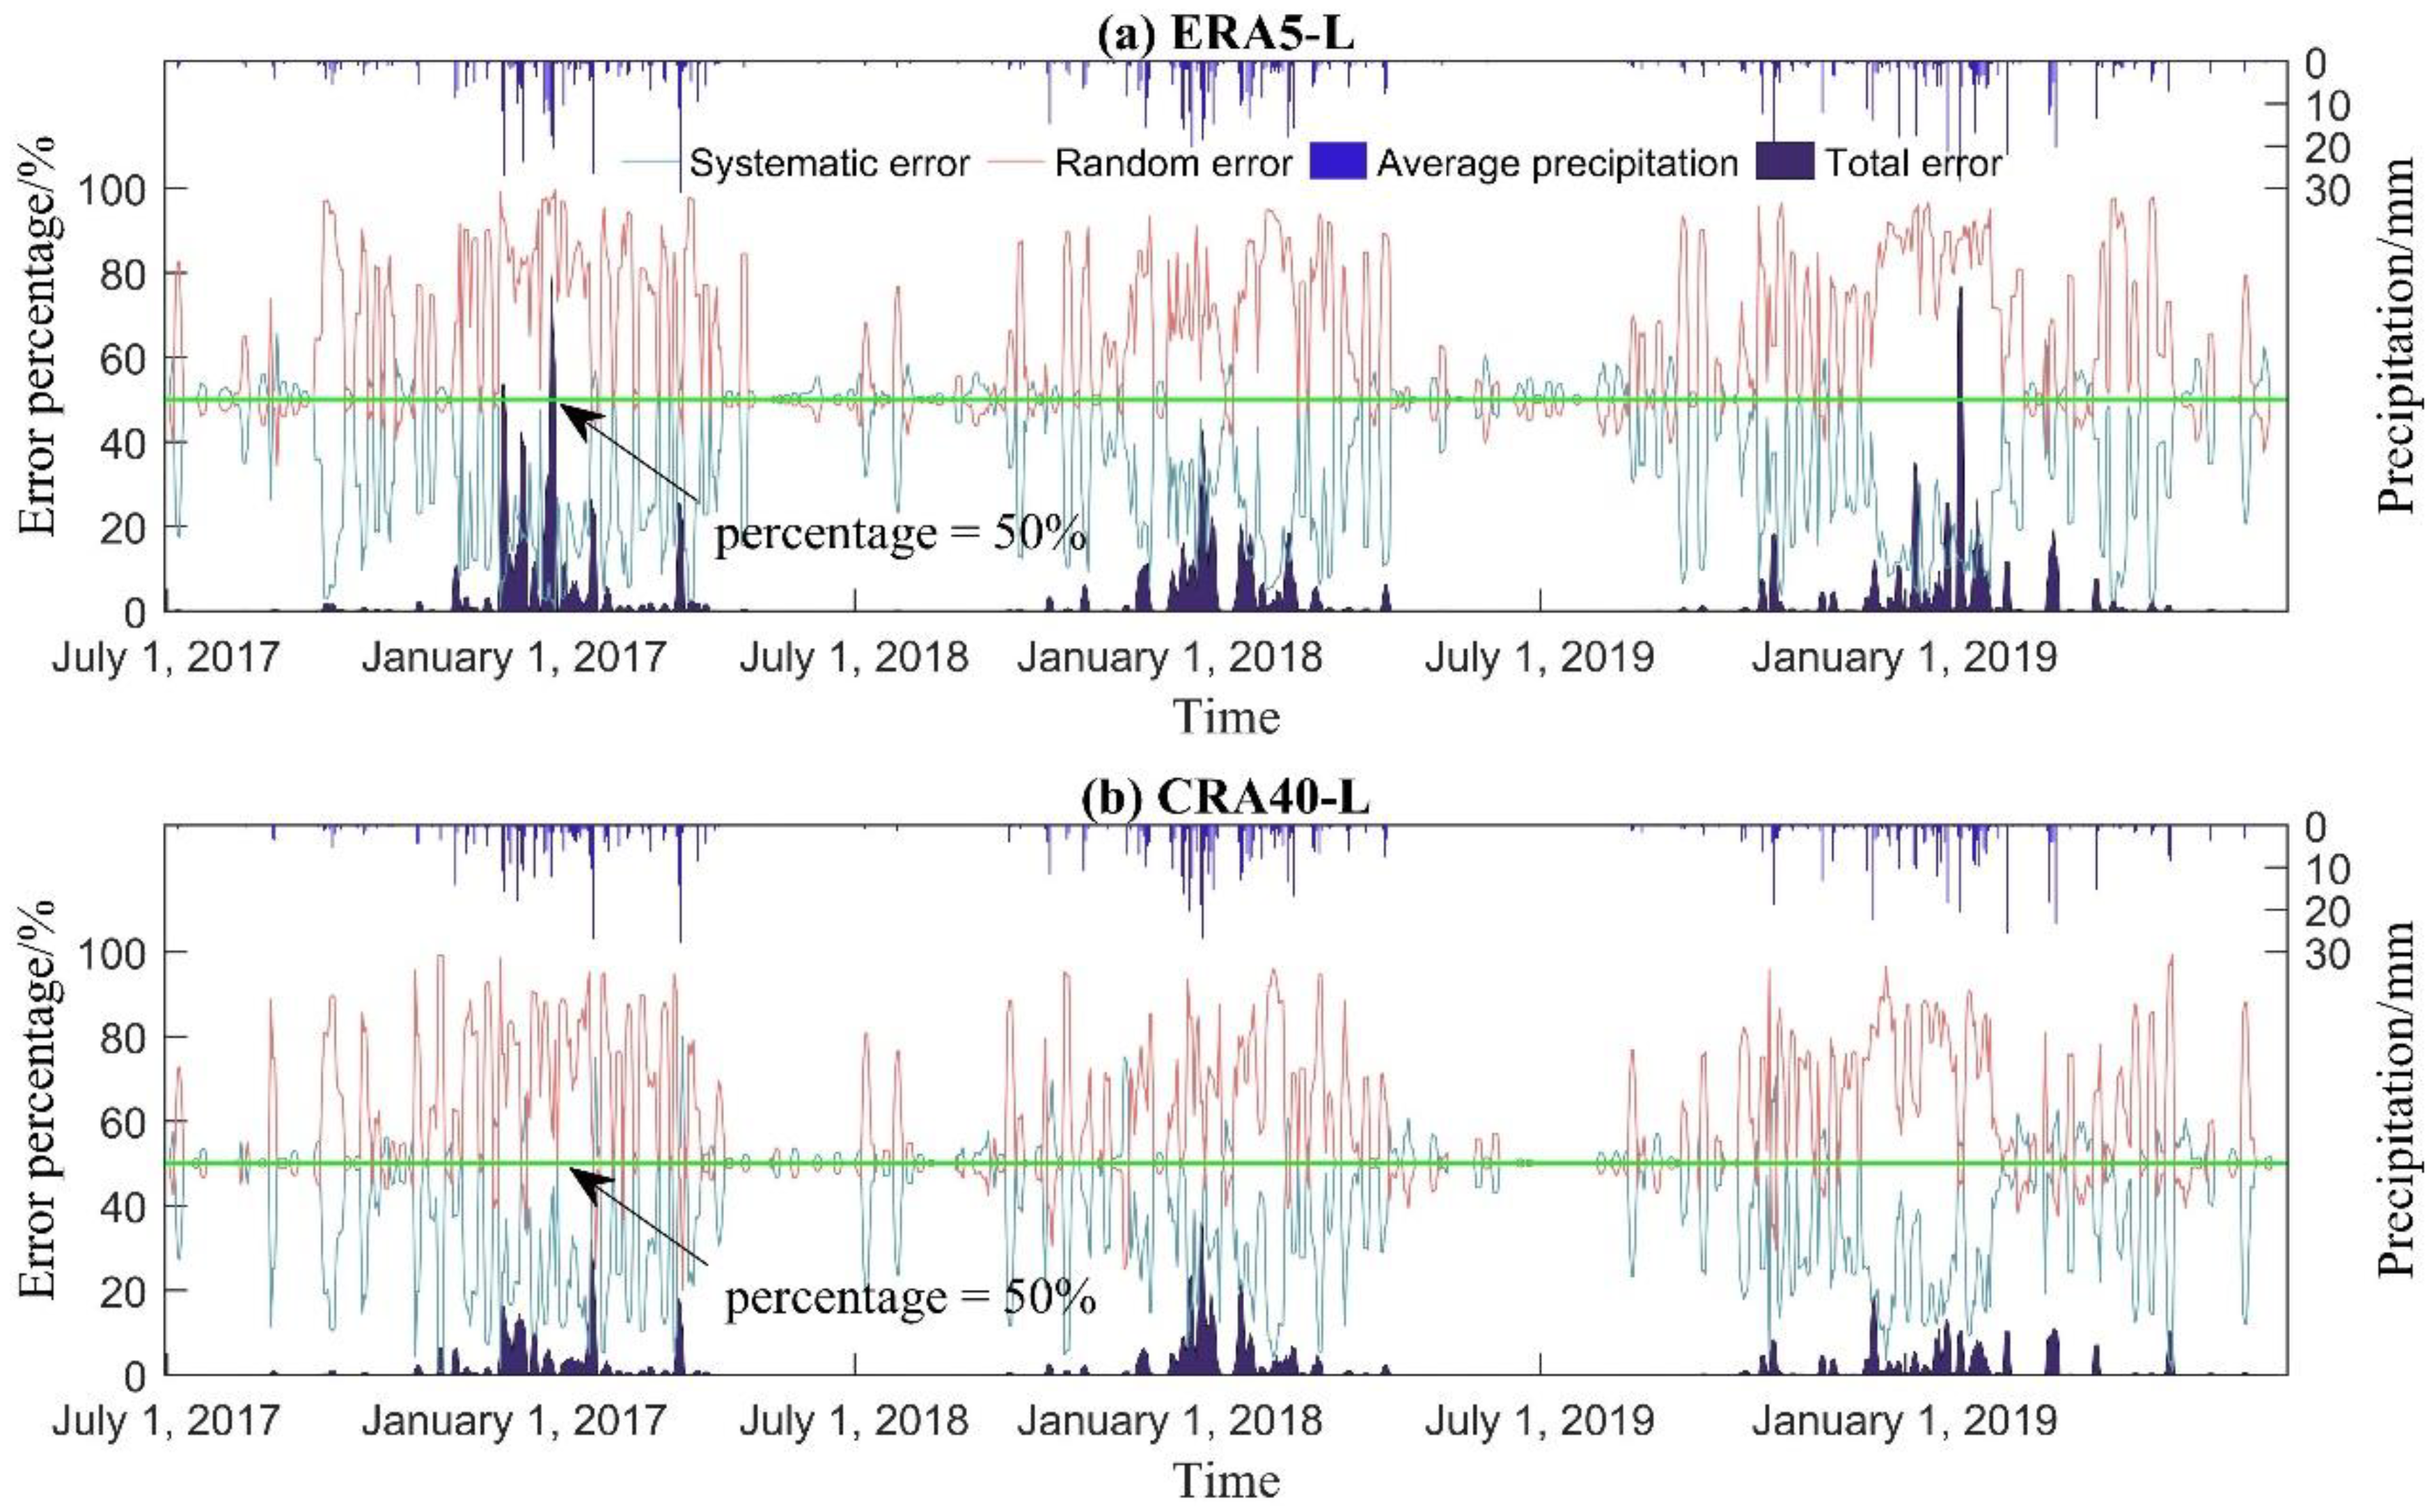
4.2.1. Spatiotemporal Features in Different Seasons

Figure 3 and Figure 4 show the spatial distribution of the systematic and random error components of ERA5-Land and CRA40-Land products, and each grid was calculated as the cumulative error. It can be observed that the random errors in the two reanalysis precipitation products were relatively high. The annual random error in ERA5-Land accounted for more than 75%. As shown in Figure 3f, the random error was higher in winter and may be related to the terrain features. The plain areas exhibited lower random errors, while the upstream mountainous regions also exhibited higher random errors. Although the basic feature of CRA40-Land is the same as that of ERA5-Land, the proportion of annual random errors of CRA40-Land was between 60 and 70%, which was slightly lower than that of ERA5-Land. As shown in Figure 4f, the random error was lower in summer, and significant spatial variability in error was observed in winter. Overall, the proportion of systematic error of ERA5-Land was lower than that of CRA40-Land, and the difference between the two was approximately 10%, indicating that the precipitation accuracy of CRA40-Land in the relevant watershed needs to be improved. It was observed that the accuracy of CRA40-Land in the upstream mountainous areas was almost comparable to that of ERA5-Land, especially in winter.
Figure 5 shows the temporal variations in the error components. To accurately evaluate the error features, the moving average method was used for processing, and 3 d was considered the average time. The variations in the error components of ERA5-Land and CRA40-Land products were significantly associated with the precipitation intensity and were season-dependent. At high precipitation intensity (i.e., in summer), the errors were mainly random errors, accounting for more than 80%, while winter was characterized mainly by systematic errors. When compared with CRA40-Land, ERA5-Land was more sensitive to the precipitation intensity, and higher random errors were observed in ERA5-Land than CRA40-Land at the same precipitation amount. The above analysis indicated that the systematic and random error components were related to the precipitation intensity and terrain features. Therefore, the correlation analysis was further conducted to understand the relationship of error with the rain intensity and the elevation.

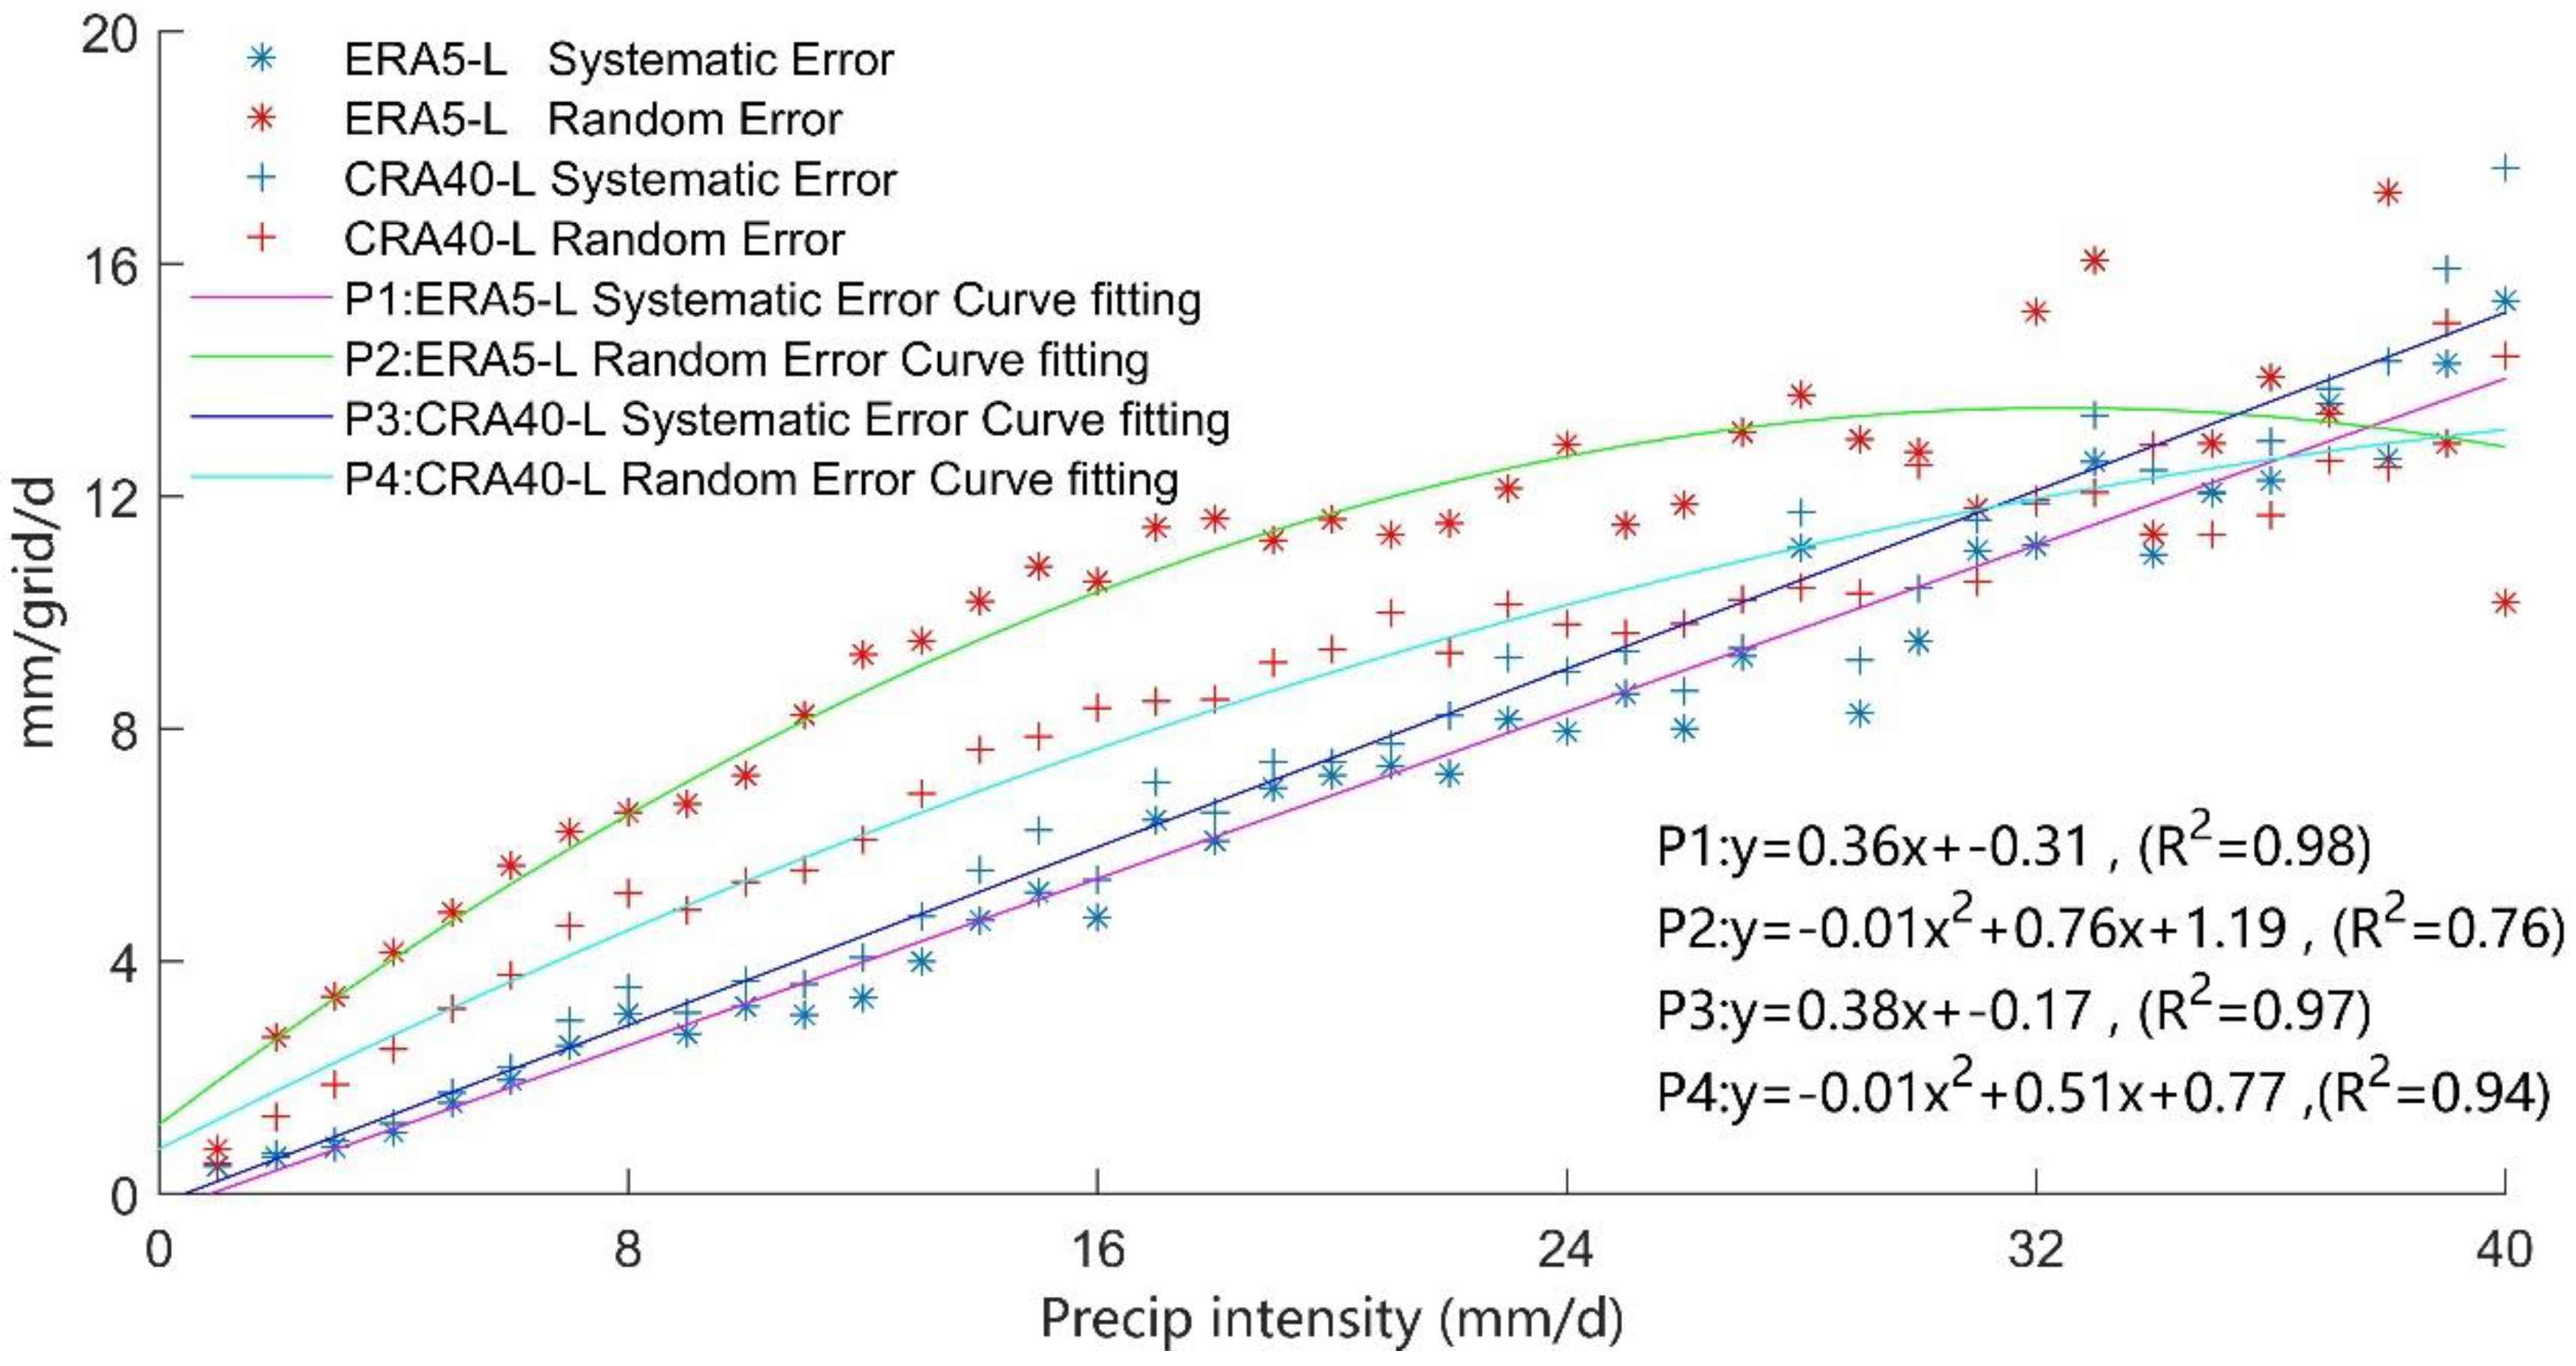
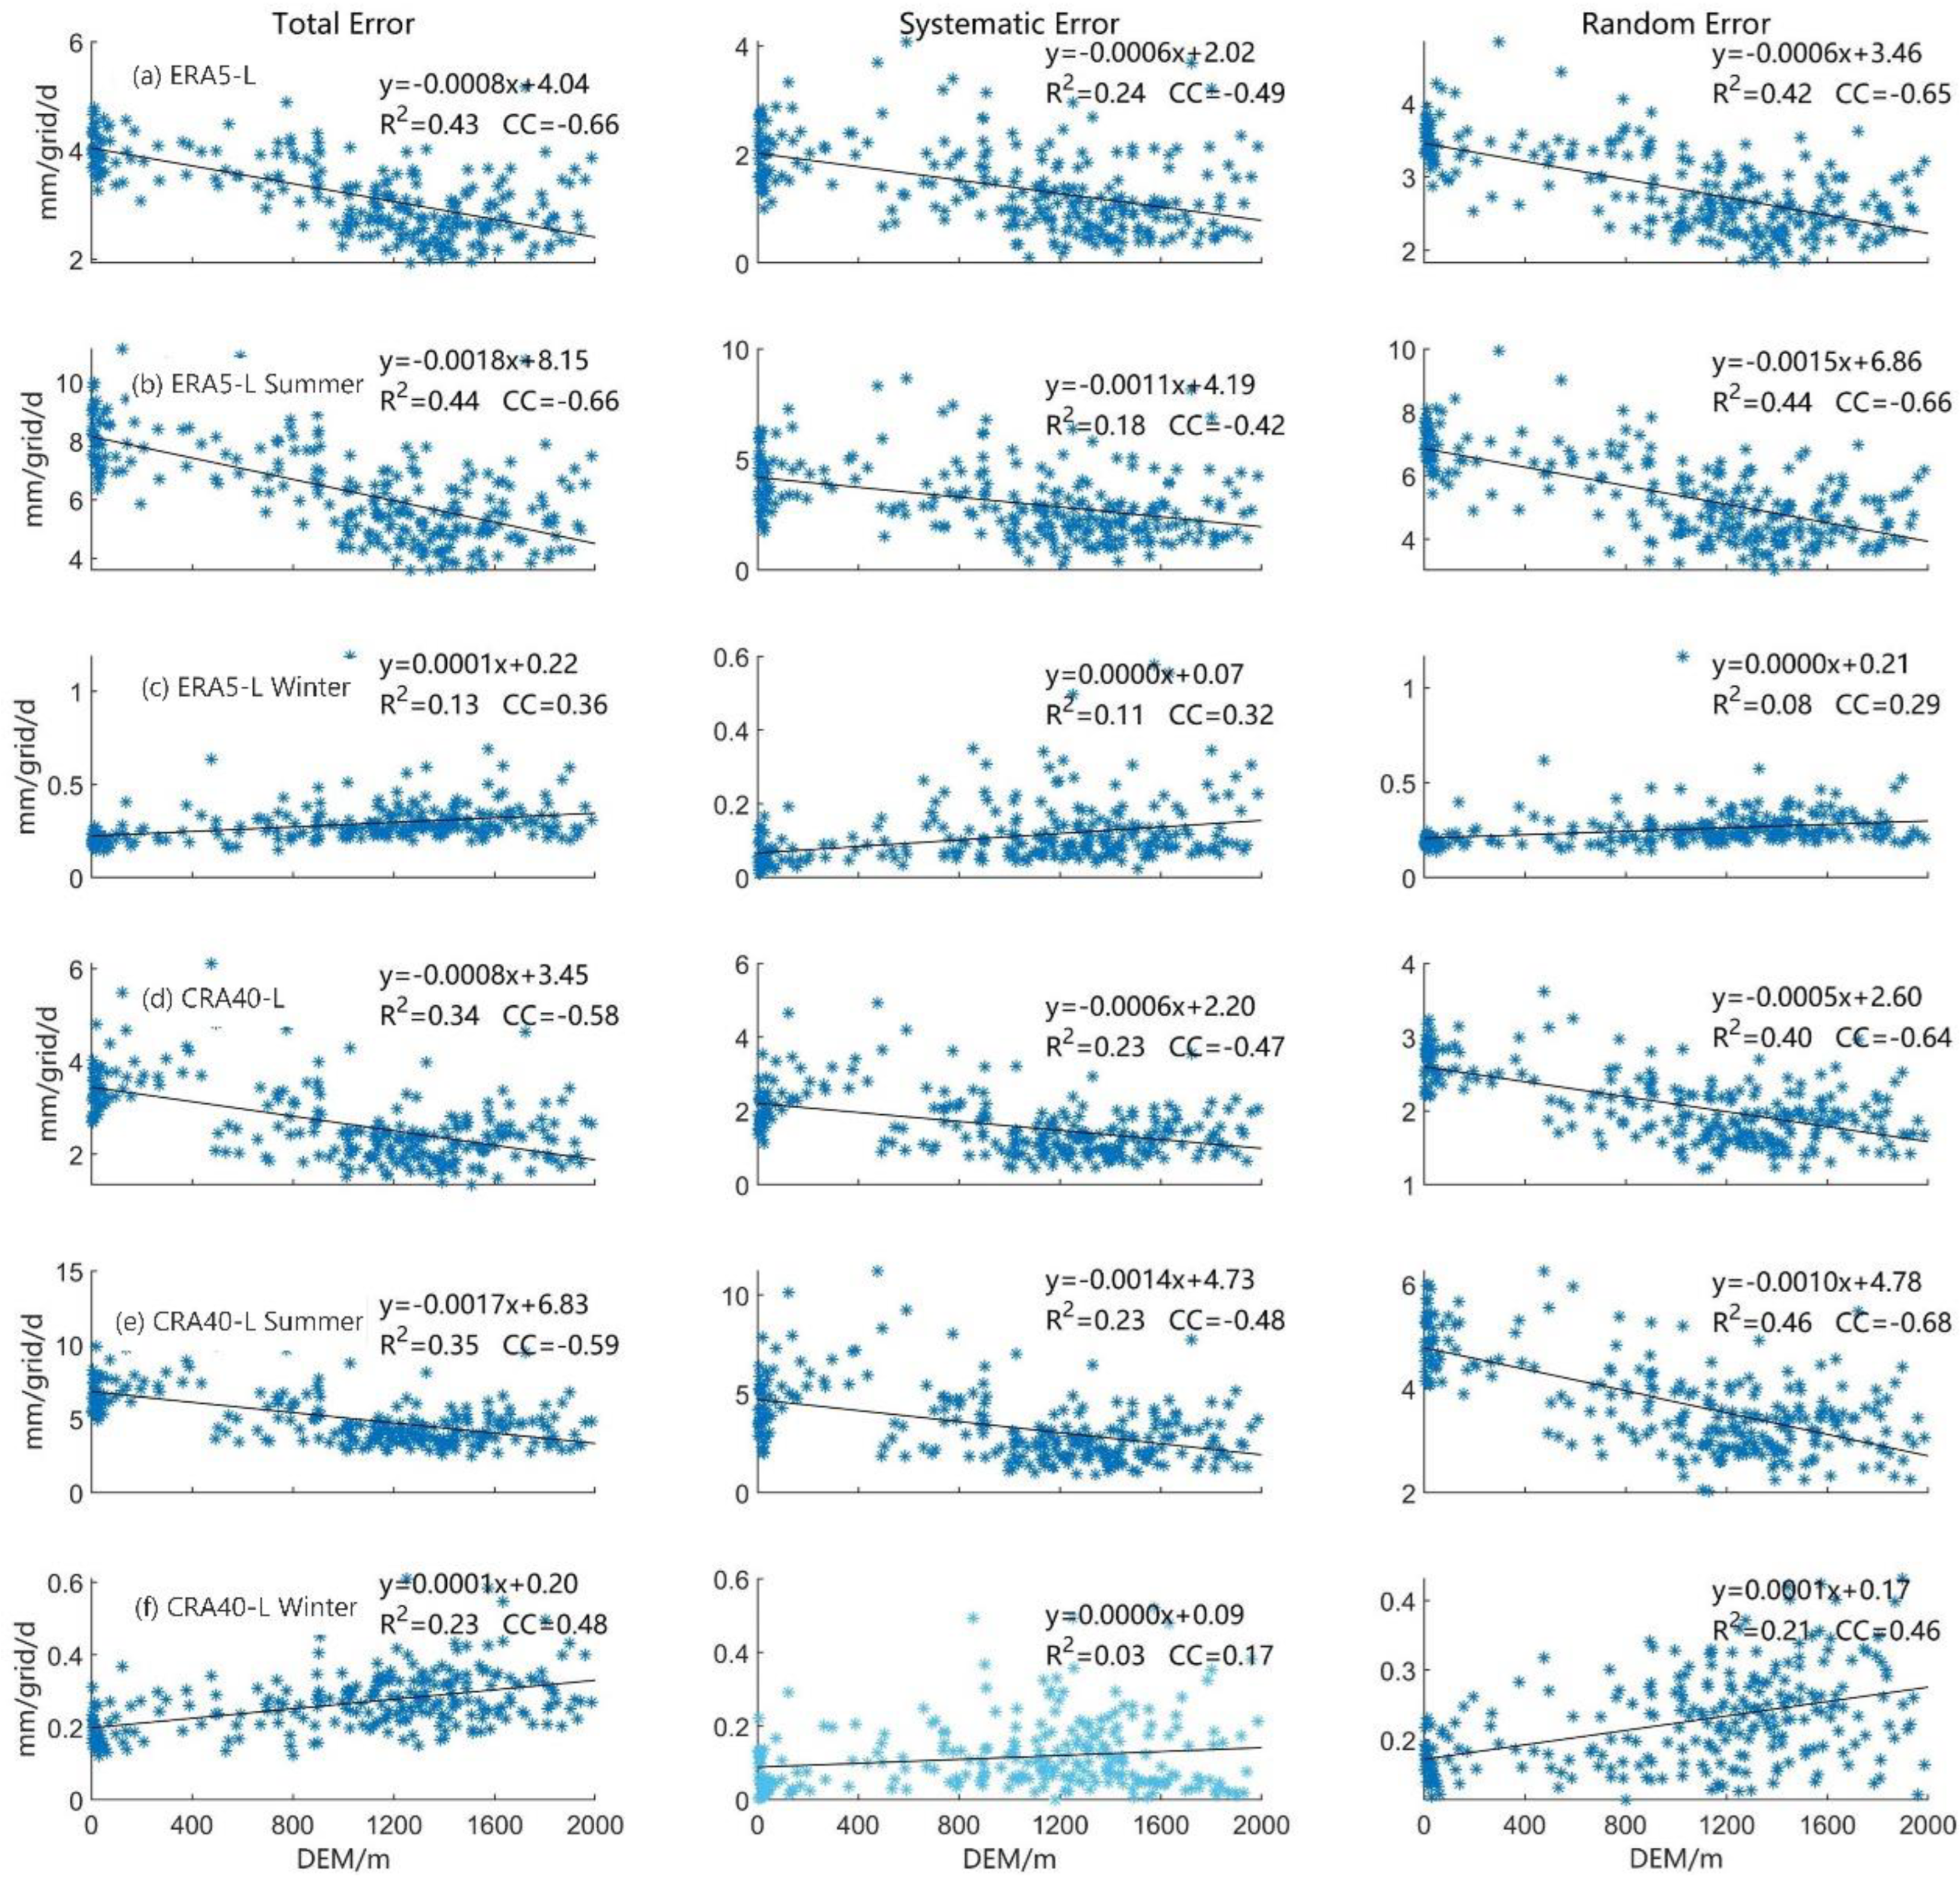
4.2.2. Effect of Precipitation Intensity and Elevation

The correlation analysis of precipitation intensity and elevation with error expressed as the two error components in terms of RMSE rather than MSE. For the correlation analysis of precipitation intensity, each step considered the mean value of all the grid error components within the range of precipitation intensity [p − 0.5, p + 0.5].
Figure 6 shows the distribution of the precipitation intensity and error components of ERA5-Land and CRA40-Land products. The systematic error in the plot was fitted by a first-order linear method of least squares, and the random error was fitted by a second-order linear fit. According to the scattered plot of error distribution, increasing variability in errors was generally observed with increased precipitation intensity. The systematic error increased almost linearly, and the random error increased rapidly at lower precipitation intensity, and then was likely to be stable. The two error components showed good fit at the significance level of α = 0.01 with the goodness-of-fit value above 0.76 (three lines were located above 0.94). The fitted curve indicated that the systematic error of ERA5-Land was always lower than that of CRA40-Land, and the random error was always higher than that of CRA40-Land. It was observed that the fitting curves of systematic and random errors intersected, the proportion of random error was higher before the intersection, and the proportion of systematic error was higher after the intersection, which was in agreement with the results of the spatiotemporal analysis in Section 4.2.1. The error components of ERA5-Land intersected at p = 38 mm/d and those of CRA40-Land at p = 32 mm/d, indicating that at the same precipitation intensity, CRA40-Land had a higher proportion of systematic errors. This was also consistent with the results in Section 4.2.1, i.e., the systematic error of CRA40-Land in summer was higher than that of ERA5-Land.
Although the systematic error of ERA5-Land was always slightly lower than that of CRA40-Land, its random error was always significantly higher than that of CRA40-Land in the precipitation range of 0–38 mm, resulting in a total error of ERA5-Land higher than that of CRA40-Land. The analysis of only the general error features cannot provide a comprehensive understanding of the error features of precipitation.
The degrees of freedom (n) for elevation–error correlation was equal to 264. The critical value determined by the hypothesis test of the significance of CC at α = 0.01 was 0.158, and the CC was found to be 0.201. The correlation between the elevation and the error components is shown in Figure 7. Generally, the correlation between the errors and the elevation was divided into three types: (1) no correlation, i.e., not meeting the hypothesis test of the significance of CC at α = 0.01 (represented in red); (2) weak correlation, which satisfies the hypothesis test of the significance of CC at α = 0.01 but does not meet the hypothesis test at α = 0.001 (represented by light blue); and (3) strong correlation, which satisfies the hypothesis test at α = 0.001 (represented in blue).
Overall, only the systematic error of CRA40-Land in winter failed to pass the hypothesis test at α = 0.001 but passed the hypothesis test at α = 0.01. The elevation had a significant effect on the error, with the two demonstrating a negative correlation in summer and a positive correlation in winter. Significant seasonal variations were observed due to enhanced precipitation in summer, and above all, the annual trend observed was the same as that in summer. However, the concentration and dispersion degrees throughout the year and in summer were different. In particular, CRA40-Land had a higher concentration degree throughout the year and summer, but a higher dispersion degree in winter. Since the summer precipitation accounted for a large proportion, the annual precipitation comprised mainly summer precipitation. Therefore, a stronger elevation–error correlation was observed for CRA40-Land in summer and ERA5-Land in winter.

4.3. Hit, Missed, and False Bias

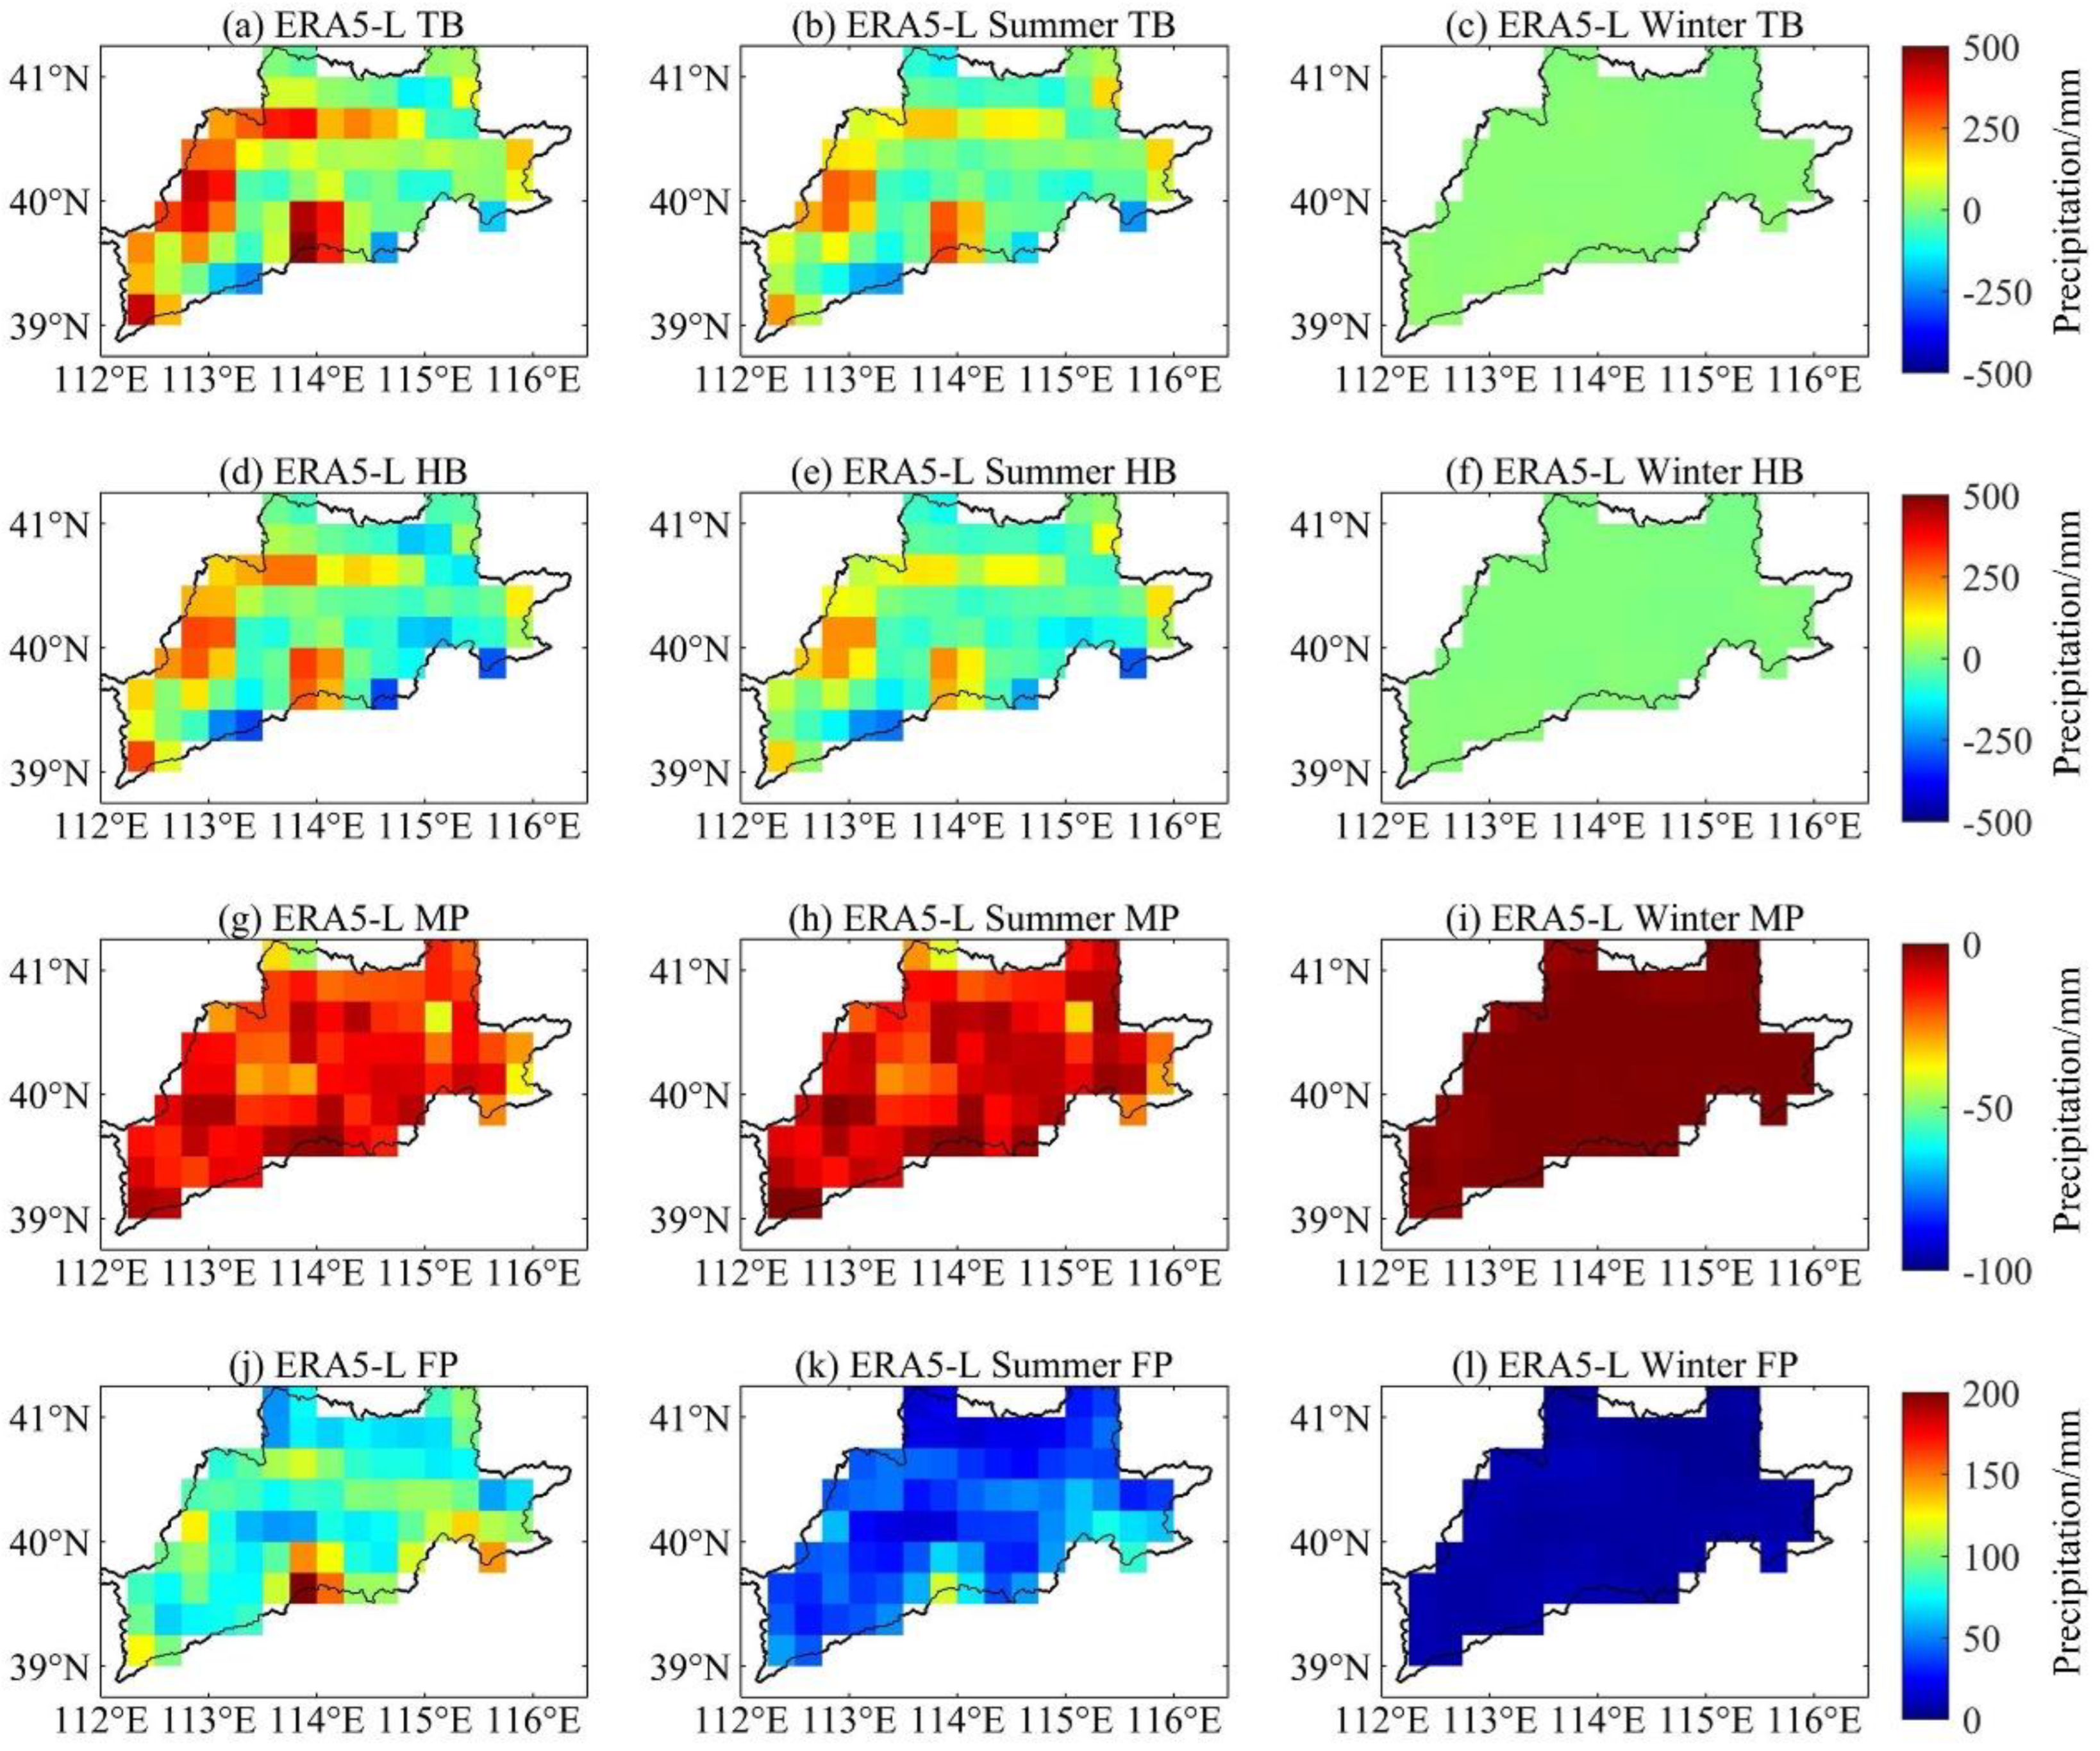
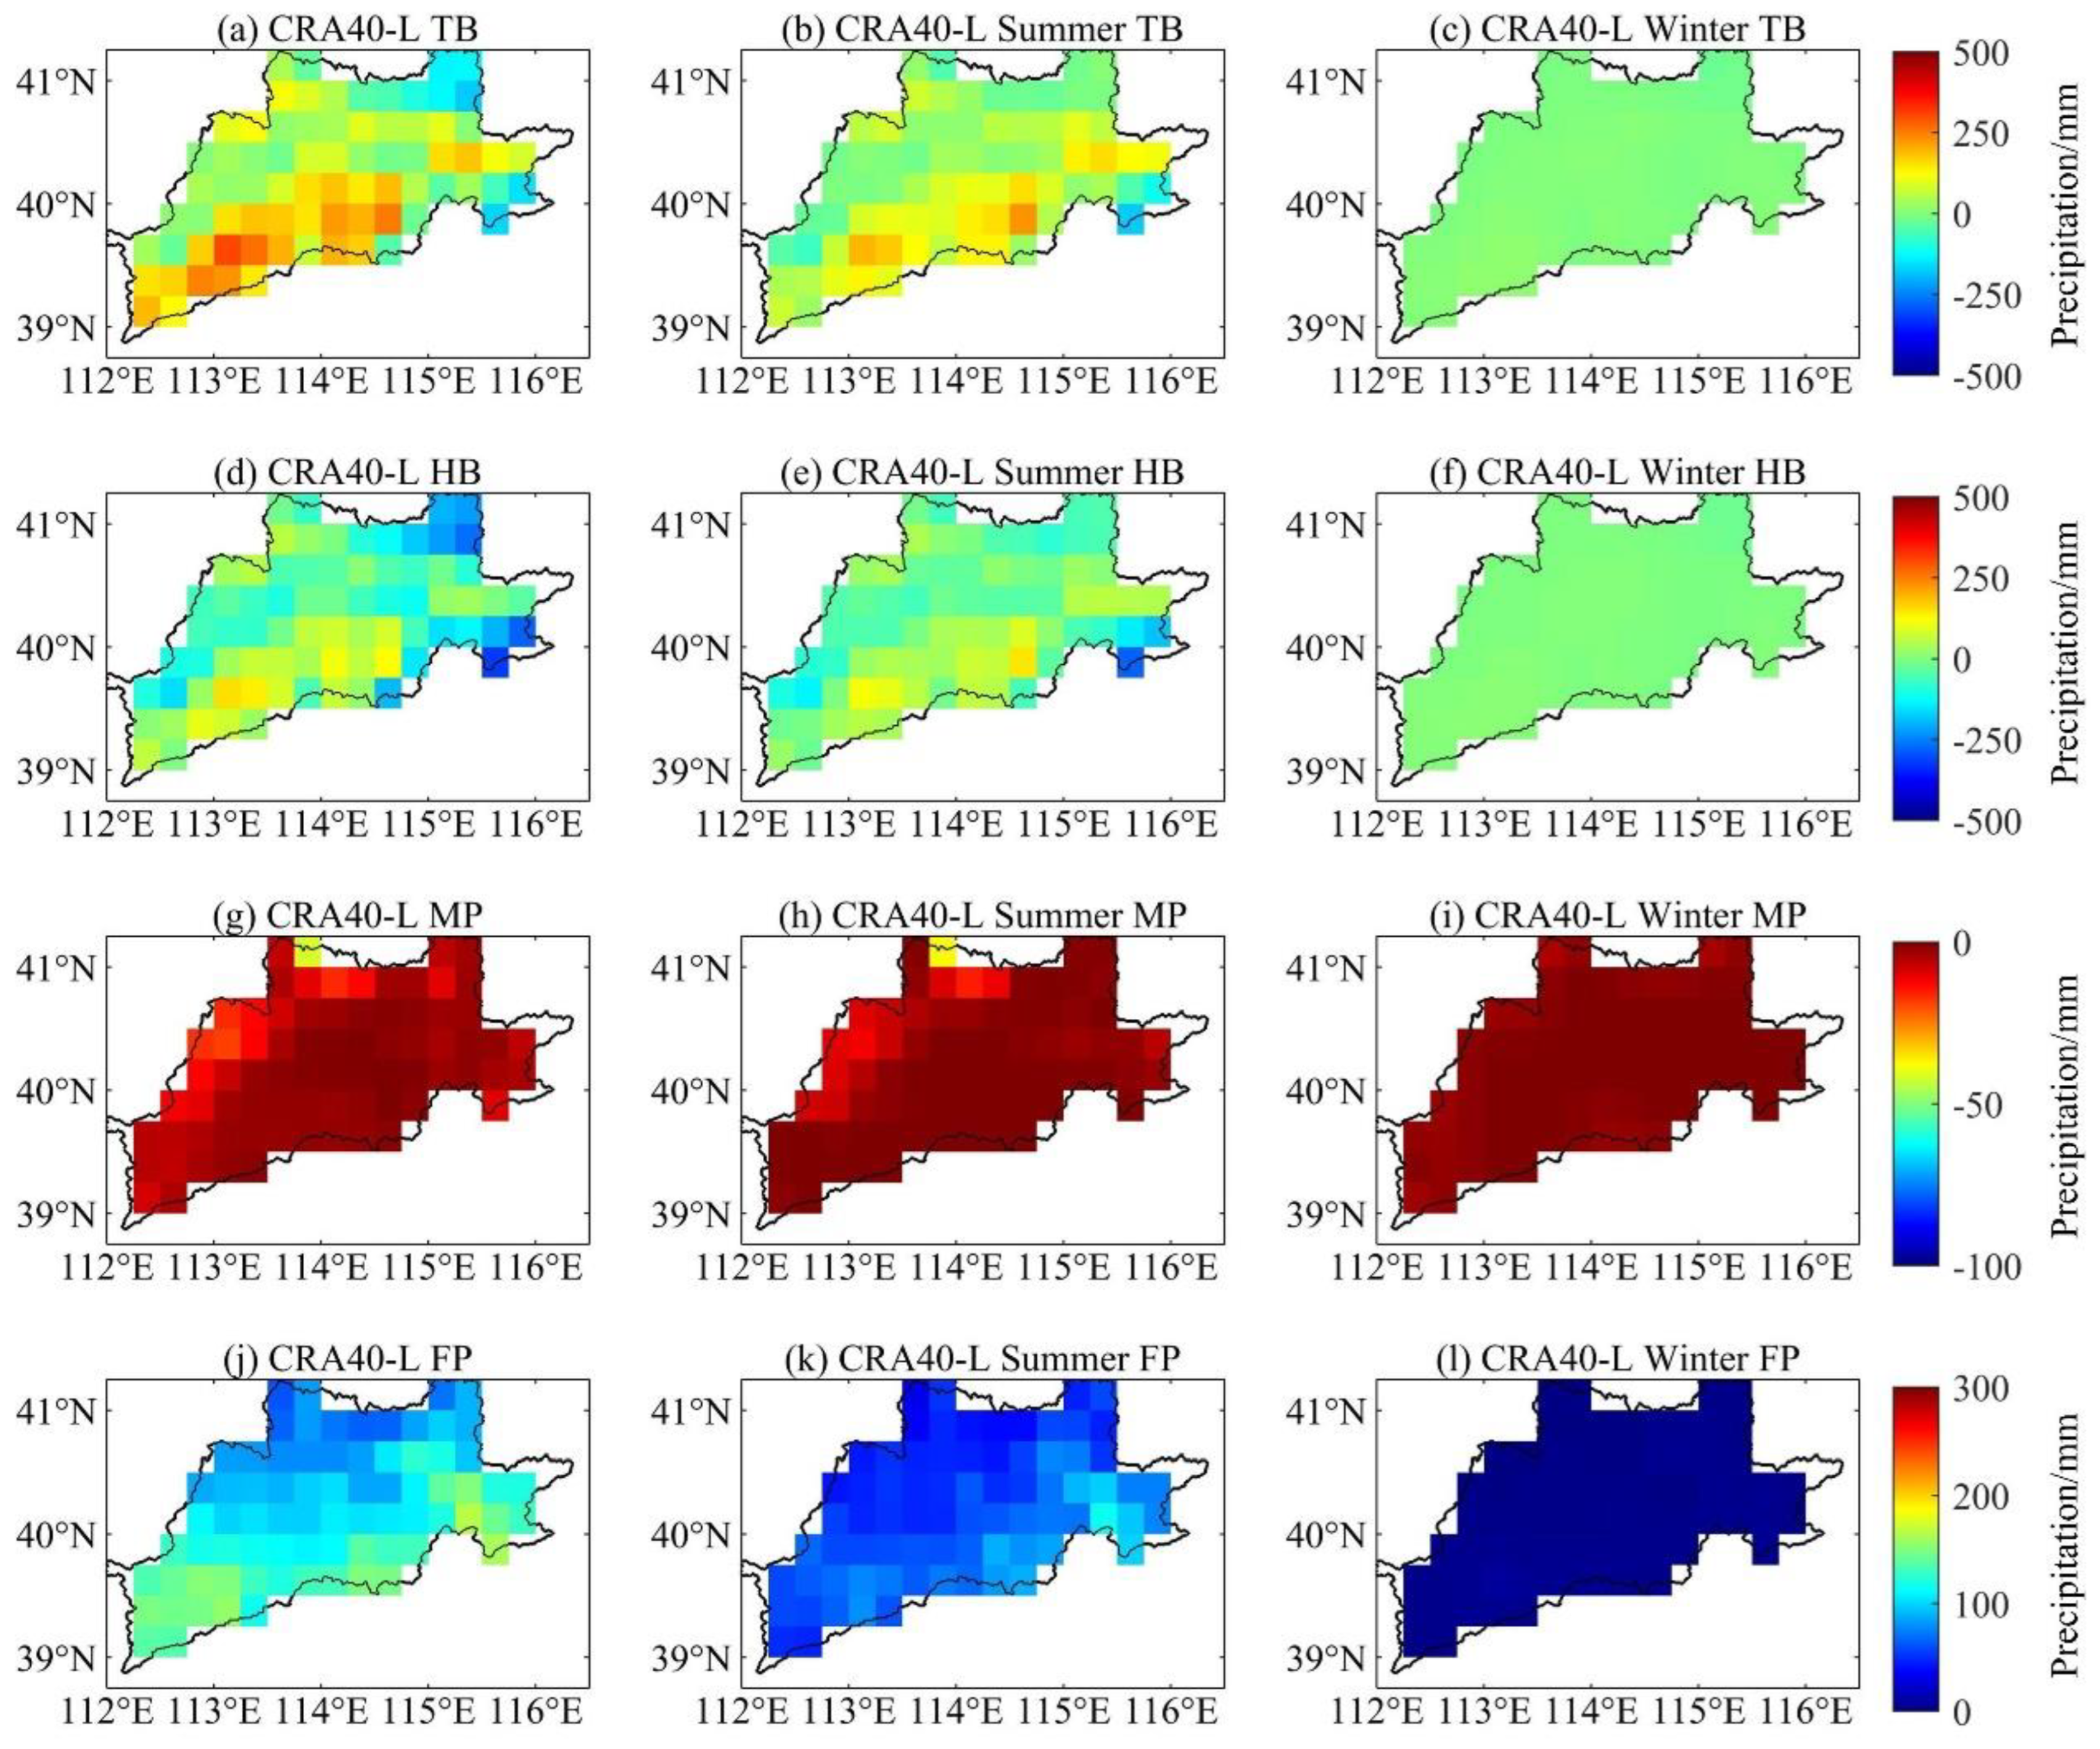
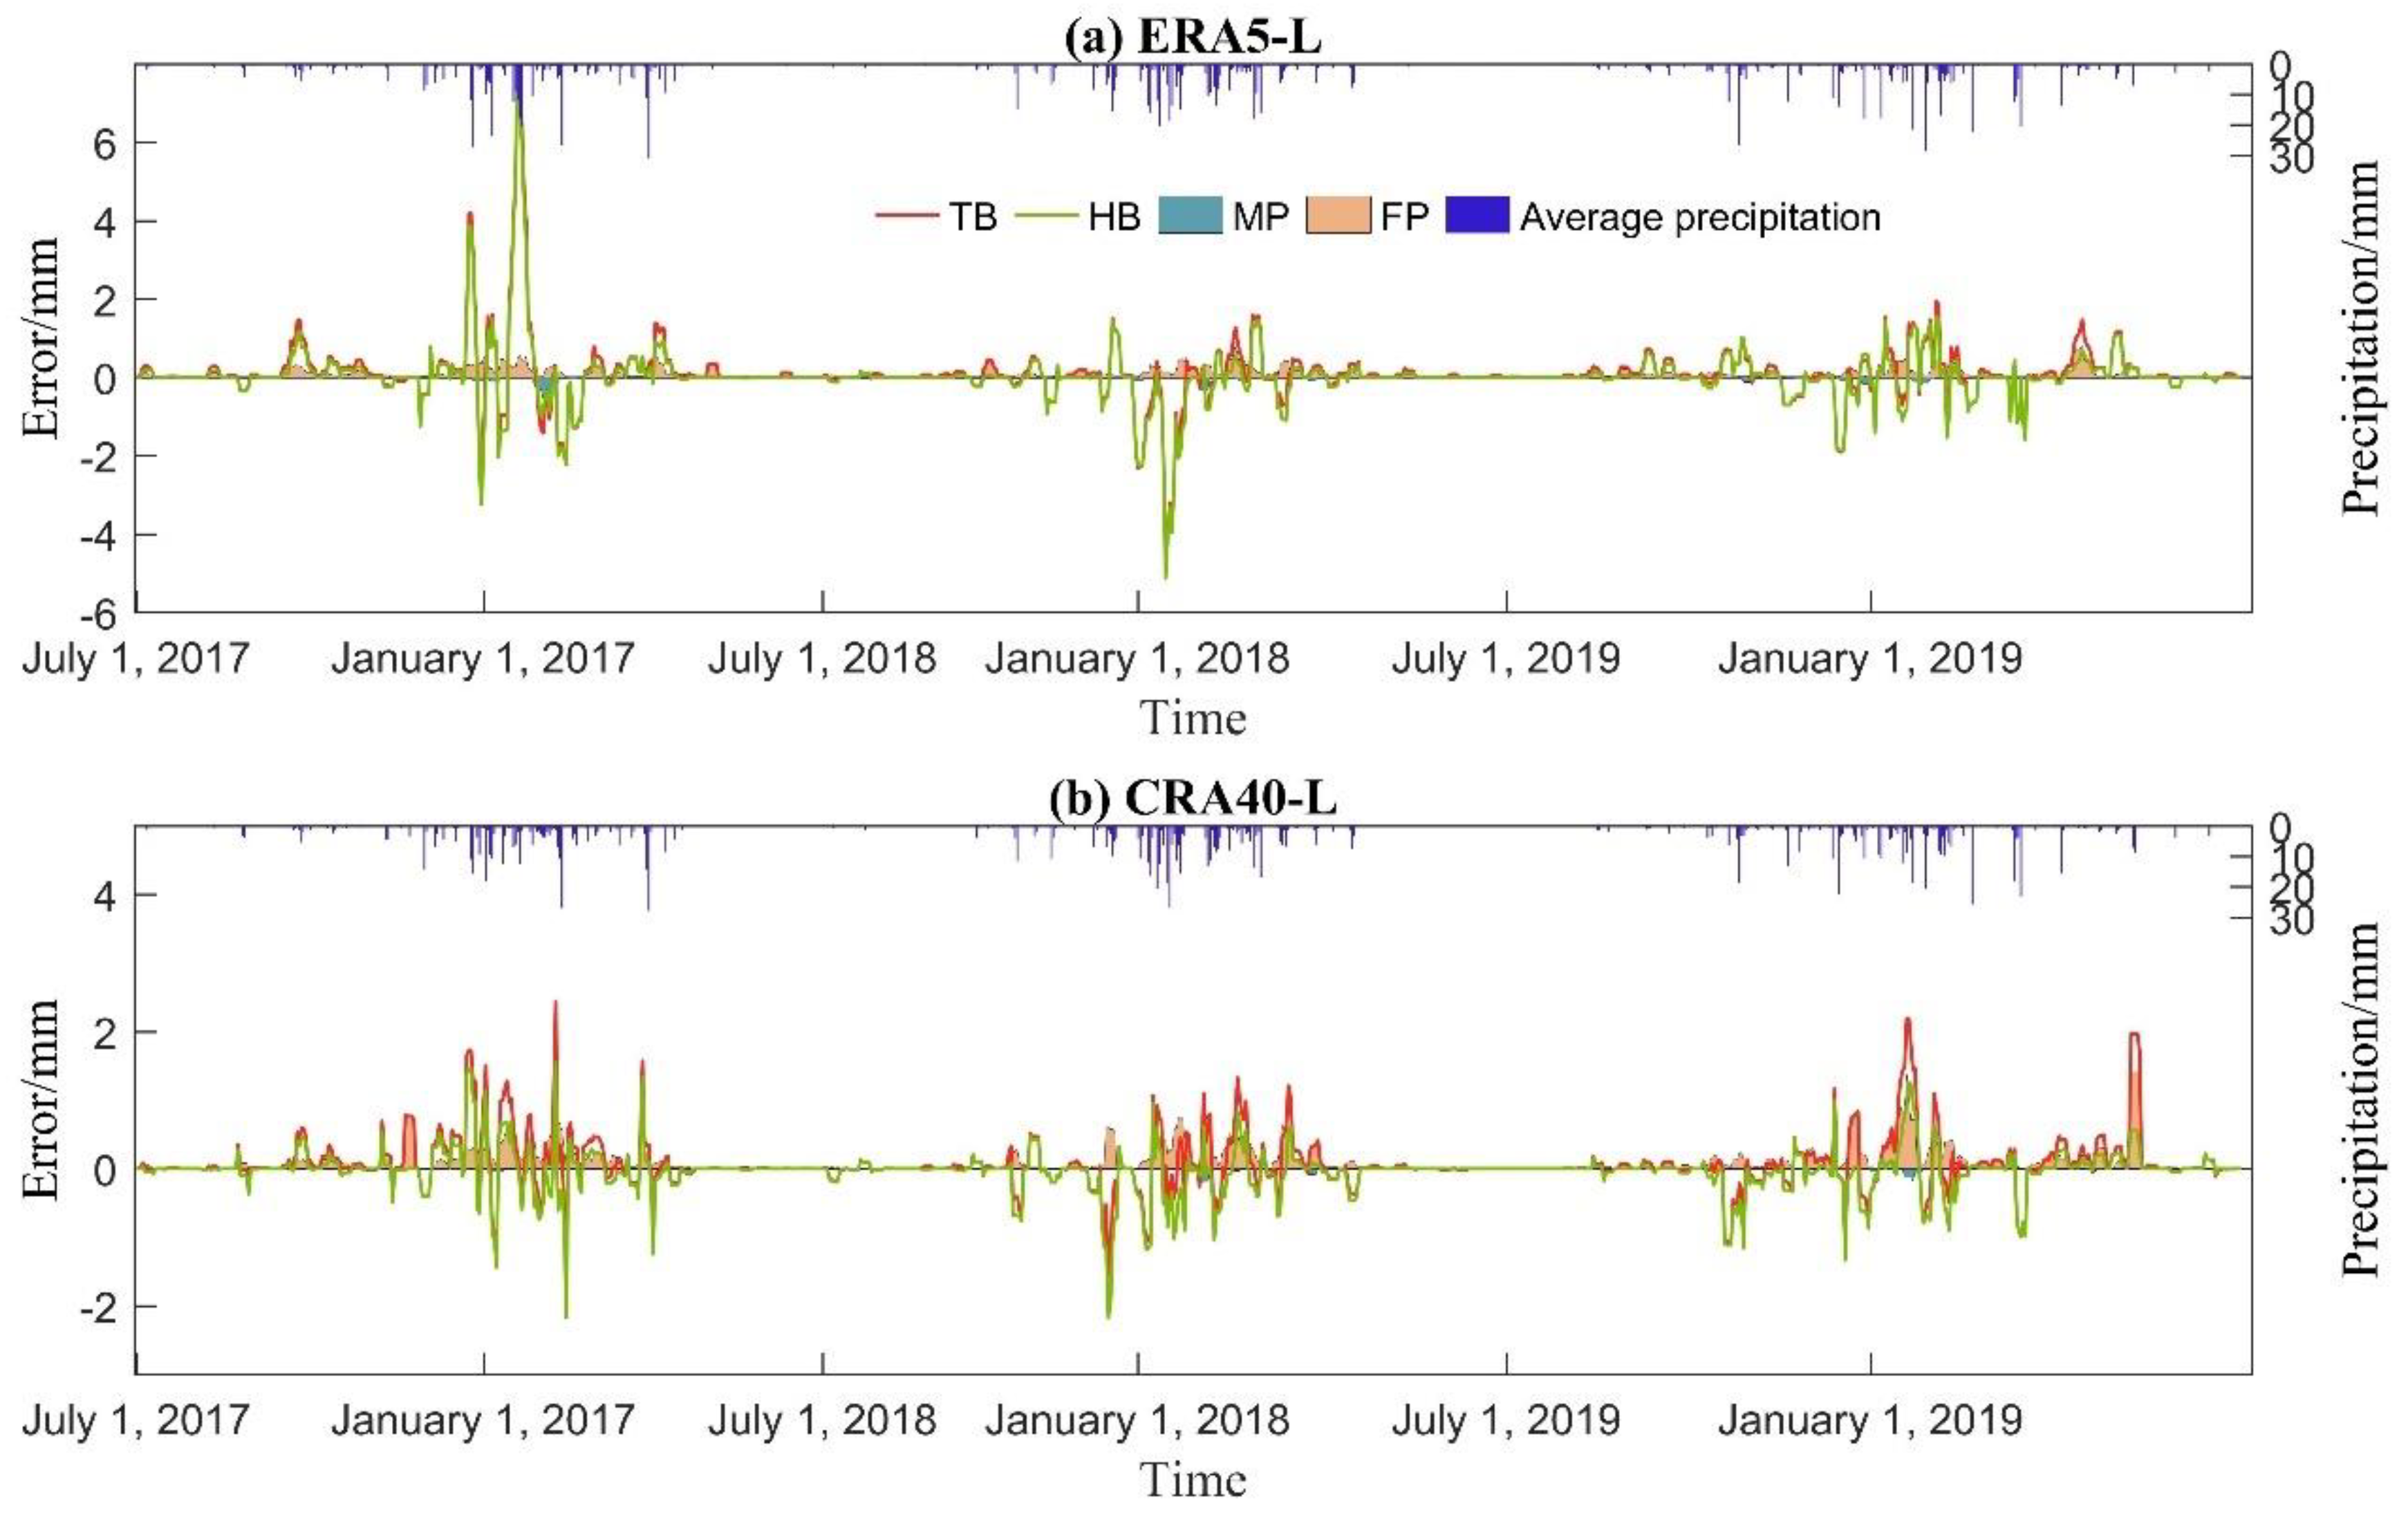
4.3.1. Spatiotemporal Variations in Different Seasons

Given a precipitation field, it is necessary to derive a precipitation event mask based on a rain/no rain threshold. In a study by Tian et al. [22], the threshold was set to 1 mm/d. However, this threshold value would have ignored 365 mm of precipitation per year under ideal conditions. Therefore, the rain/no rain threshold was set to 0.1 mm/d in this study.
The spatial distribution of the error components, namely, TB, HB, MP, and FP of ERA5-Land and CRA40-Land are shown in Figure 8 and Figure 9, respectively, and the accumulated errors were calculated for each grid. As shown in Figure 8a, it can be observed that the total error distribution of ERA5-Land, mostly overestimation, was influenced by the terrain features, and the error gradually increased with the increase in elevation. The contribution of HB to the total error was more than that of other error components. Although CRA40-Land showed spatial variability, it had a weak relationship with topography (Figure 9a), and the associated error was significantly lower than that of ERA5-Land. The overall feature of TB was difficult to understand due to the mutual interferences of each component. The error associated with summer precipitation was relatively higher.
The temporal variations of different error components are shown in Figure 10. Each step was processed by the moving average method, and the average time considered was 3 d. It can be observed that the error associated with the precipitation intensity was difficult to ascertain, whether it was overestimation or underestimation. A large temporal variation was observed in the ERA5-Land data. At high-intensity rainfall (p > 20 mm/d), the total error of ERA5-Land was higher than that of CRA40-Land. However, the CRA40-Land data was observed to be relatively stable, and the total error and its components varied only within a small range. Although the error was significantly associated with the precipitation extremes, the variations in the error of CRA40-Land were not as large as those of ERA5-Land, which leads to greater uncertainty during data overestimation or underestimation. The TB and HB of both datasets had good consistency at higher TB. The under-reported small precipitation amounts of the two datasets, especially CRA40-Land, were ignored. Further analysis of the error features should focus on the correlation analysis between precipitation intensity and error.

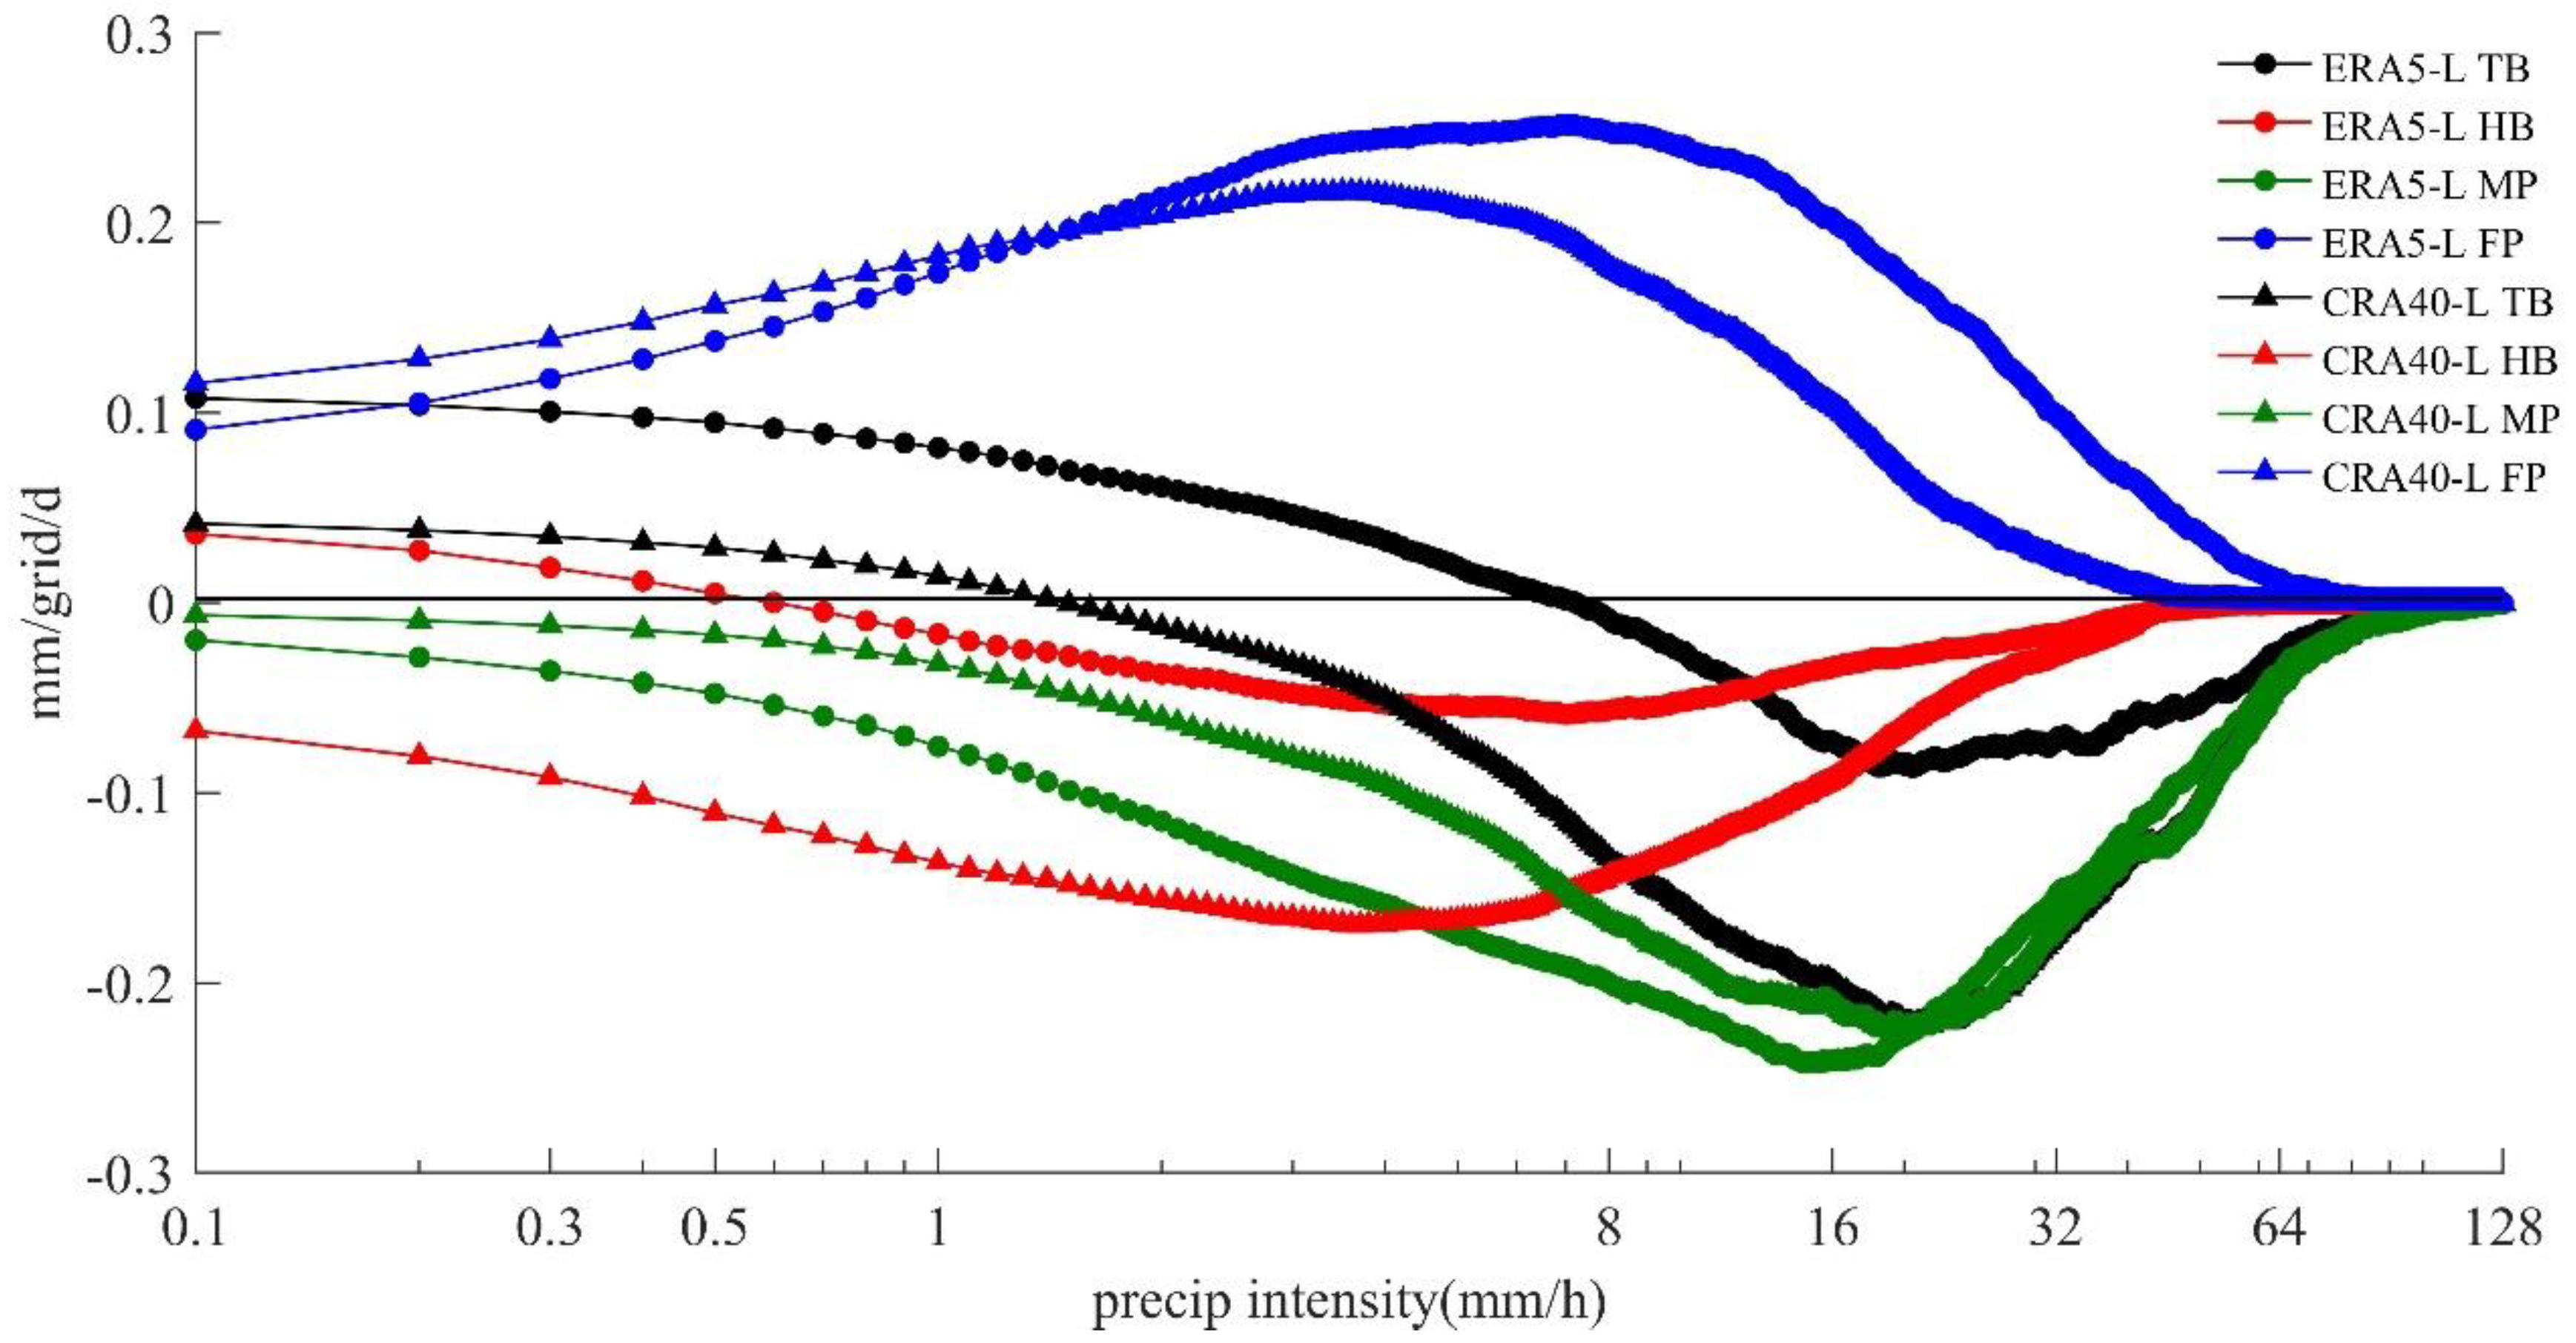
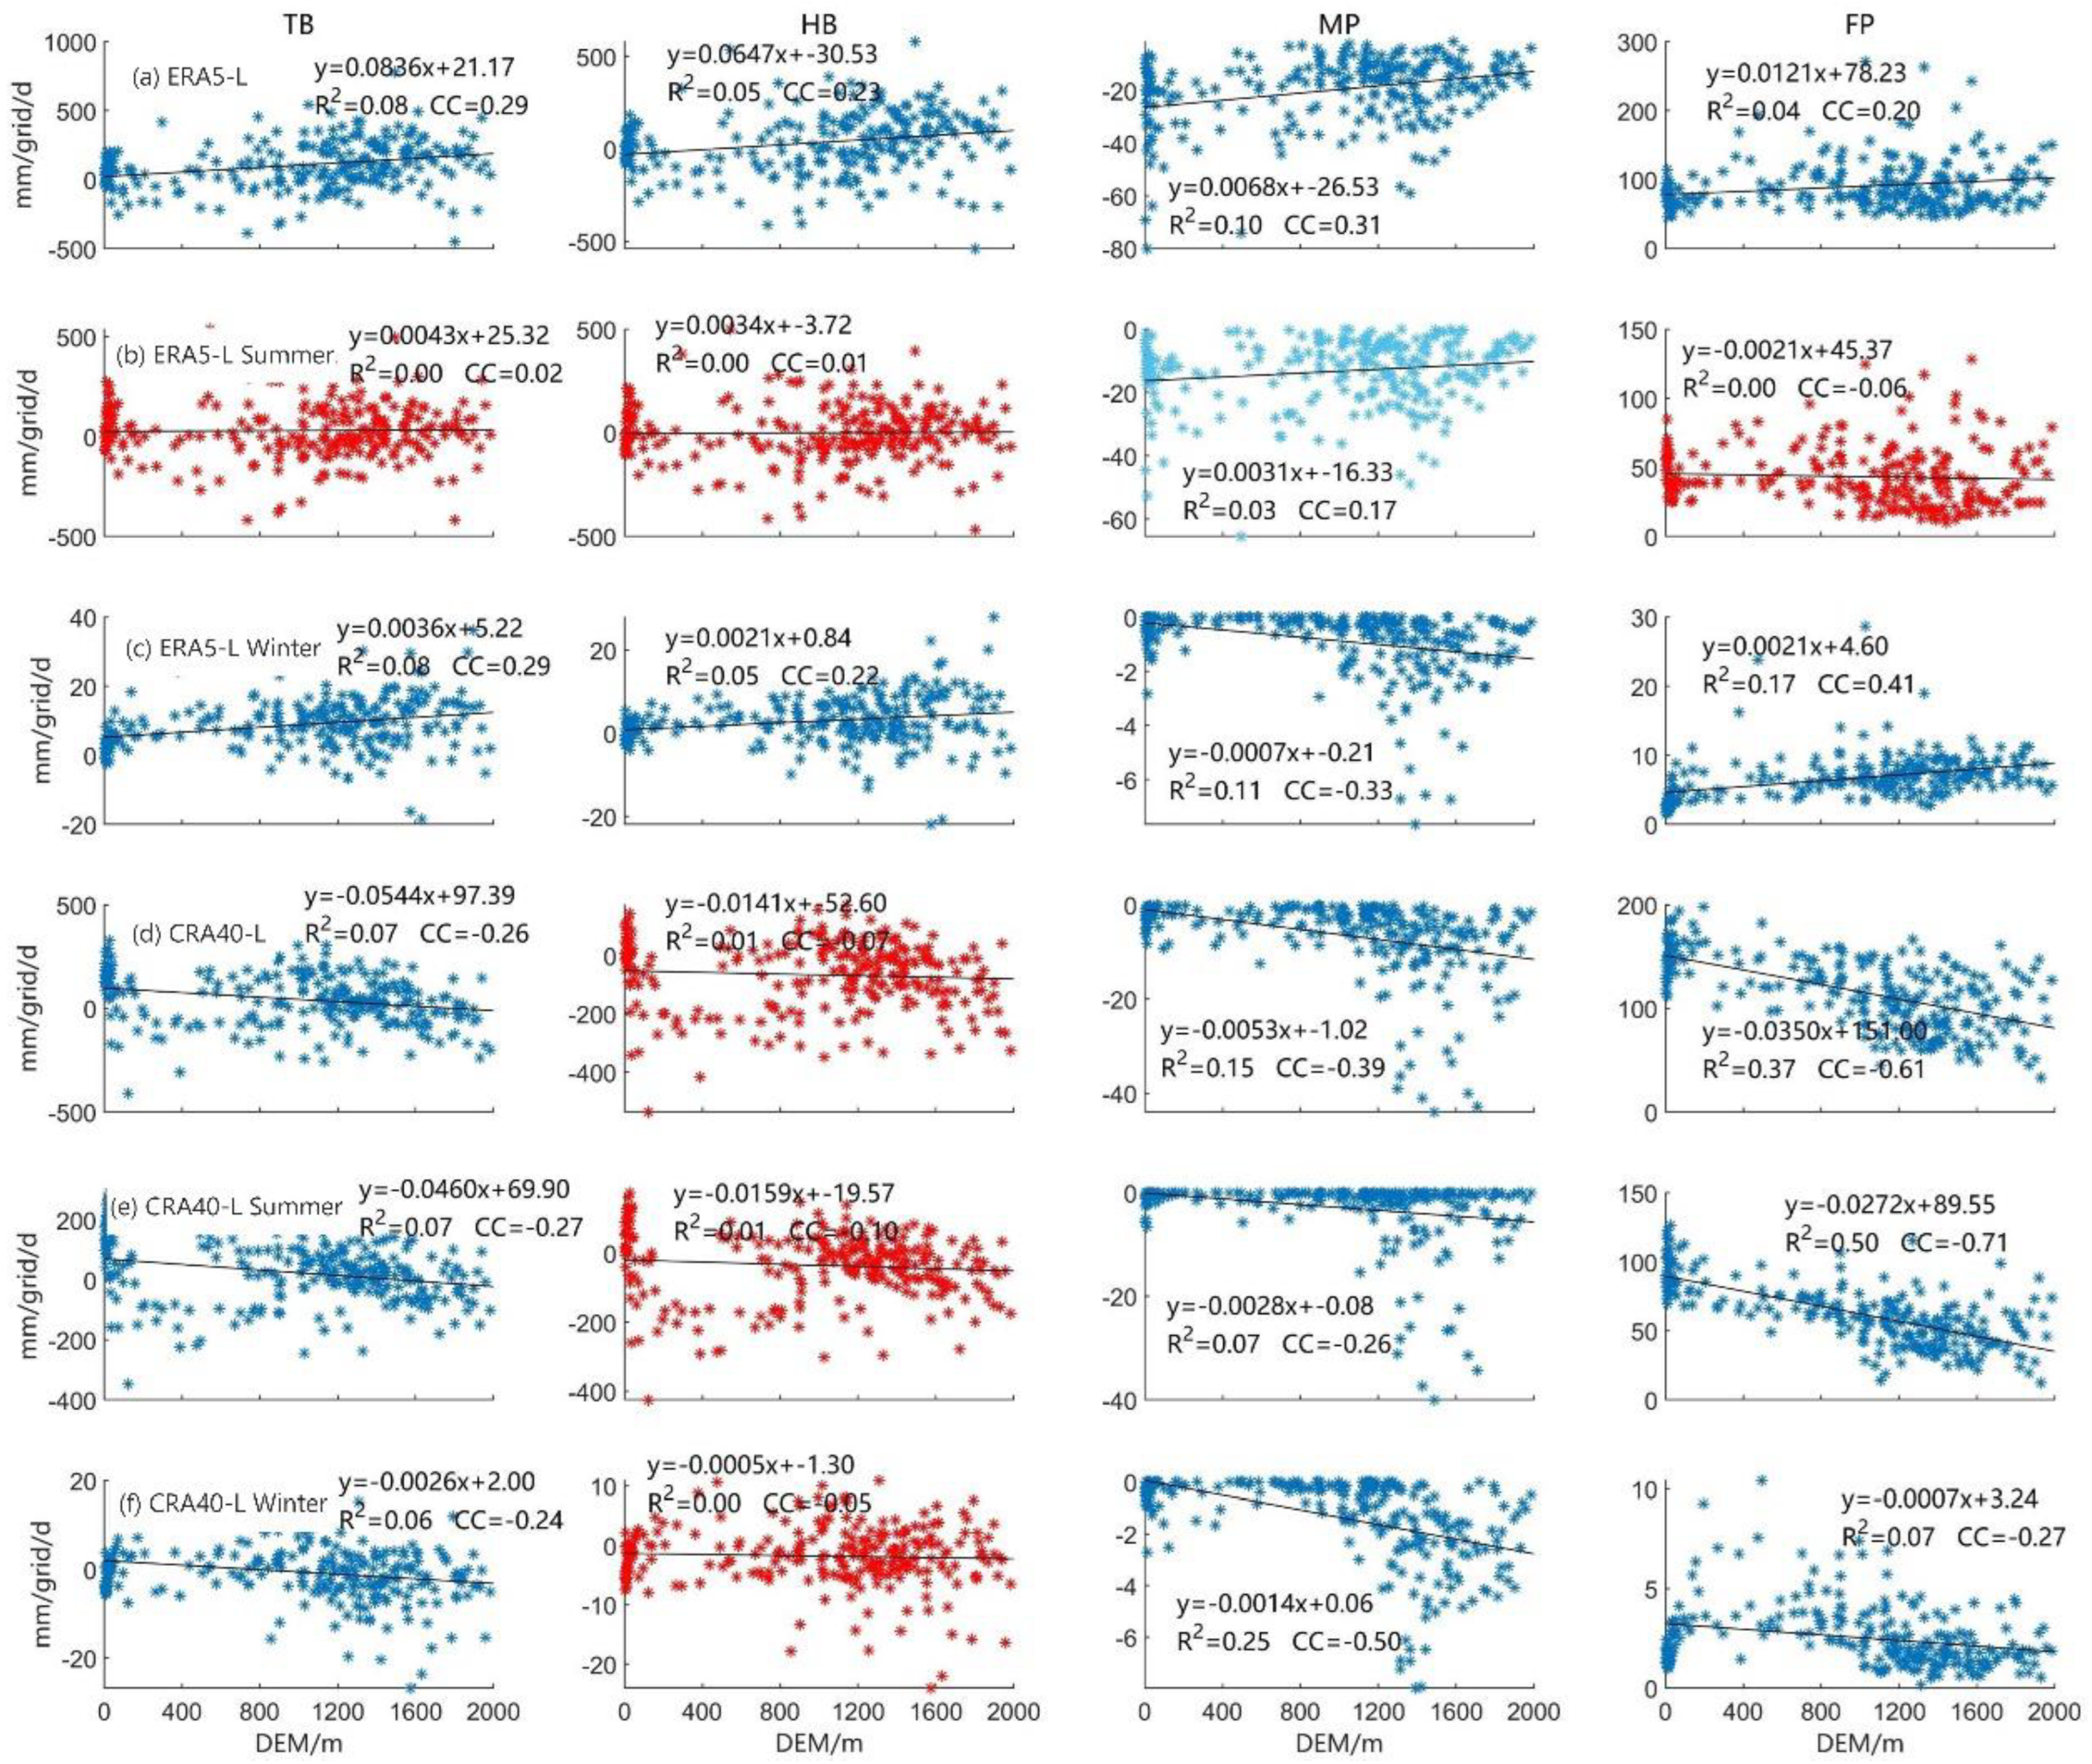
4.3.2. Correlation of Error with Precipitation Intensity and Elevation

Contrary to the results in Section 4.2.2, TB, HB, MP, and FP were related to the rain/no rain threshold. Figure 11 shows the relationship between the precipitation intensity and the error at different rain/no rain thresholds. The total errors of ERA5-Land and CRA40-Land were overestimated at lower rain intensity, then showed a tendency of underestimation, and slowly approached 0 after reaching the critical value. The two reanalysis precipitation datasets had different rain intensities at zero total error (TERA5-Land = 7.5 mm, TCRA40-Land = 1.6 mm). The rain intensity integral was based on the cumulative error, and from the total error perspective, the cumulative error of CRA40-Land was higher than that of ERA5-Land. The HB of ERA5-Land was always found to be lower than that of CRA40-Land, especially at low rain intensity; the MP of ERA5-Land was higher than that of CRA40-Land at low rain intensity and almost comparable at high rain intensity, and the FP of ERA5-Land was higher than that of CRA40-Land at precipitation intensity in the range of 4–40 mm/h.
The above analysis indicated that the total error was the result of the combined effects of multiple components. The HB of ERA5-Land was very low; however, it should overcome the error components of MP and FP to improve accuracy. On the other hand, CRA40-Land should overcome HB to improve its accuracy.
Figure 12 shows the correlation analysis of the elevation with the error components, namely, TB, HB, MP, and FP. If the rain/no rain state was considered, the two reanalysis products had different precipitation features. In particular, there was an increase in TB of ERA5-Land with the increase in elevation, and higher accuracy of ERA5-Land was observed in the plain areas. On the contrary, TB of CRA40-Land showed a decreasing trend with increasing elevation, and the accuracy was higher in the mountainous areas. The error during the summer precipitation in ERA5-Land demonstrated no correlation or weak correlation with elevation, and the error was less affected by elevation at high precipitation amounts. No correlation was observed between HB of CRA40-Land and elevation, and the error was higher than that of ERA5-Land, which is in agreement with the results from the error analysis of precipitation described previously in this study. Except in winter, the MP of ERA5-Land had a high concentration degree, while the dispersion degree of CRA40-Land significantly increased at elevations higher than 1000 m.

5. Conclusions

In this study, the error features of the two newly released reanalysis precipitation products (ERA5-Land and CRA40-Land) were analyzed by two error decomposition methods. The major conclusions drawn from this study are as follows:
(1)
The systematic and random error decomposition approach demonstrated that the random error accounted for a large proportion of the total mean square error, and the total error of ERA5-Land was higher than that of CRA40-Land. The spatial distribution of the error components indicated that the annual random error of ERA5-Land accounted for more than 75%, and that of CRA40-Land was between 60 and 70%. The spatial pattern of errors was significantly correlated with the terrain features, and the random errors in mountainous areas were larger. The temporal variation of the error components indicated that they were significantly dependent on the seasons, and the proportion of random errors in summer was larger. Compared with CRA40-Land, ERA5-Land possessed a higher ratio of random errors in summer.
(2)
On the basis of the hit, missed, and false errors decomposition approach, the spatial pattern of the errors indicated that the total error of ERA5-Land was strongly related to terrain features. The total bias gradually increased with elevation, and it is consistent with the hit bias. Although, the total error of CRA40-Land presented spatial variability, it had a weak relationship with terrain variation. The magnitudes of the total error and its components for CRA40-Land were significantly lower than those of ERA5-Land. The temporal variations of the error indicated that the summer error was significantly larger than in other seasons, and the total error of ERA5-Land was higher than that of CRA40-Land at high precipitation intensities (p > 20 mm/d).
(3)
When the precipitation intensity was lower than 38 mm/d, the random errors of ERA5-Land and CRA40-Land were relatively higher than the systematic errors. This is one of the reasons for the large random error of the solution in the two precipitation reanalysis datasets. In general, the correlation between the elevation and the systematic and random errors was relatively strong, and the error components throughout the year as well as in summer and winter accepted the hypothesis test of significance of the correlation coefficient at α = 0.001. With regard to the hit bias, missed precipitation, and false precipitation, for ERA5-Land, the hit bias was lower than that of CRA40-Land regardless of the precipitation intensity, the missed precipitation was higher than that of CRA40-Land at low rain intensity, and the false precipitation was larger than that of CRA40-Land in the intensity range of 4–40 mm/d. The correlation between hit bias and elevation was weak, and the error associated with the summer precipitation in ERA5-Land generally showed no correlation or weak correlation with elevation. The correlation between the elevation and missed precipitation of CRA40-Land gradually disappeared when elevation exceeded 1000 m.
The error features of ERA5-Land and CRA40-Land over the Yongding River Basin in North China can provide a reference for the selection of these two datasets in the related fields of meteorology and hydrology and can also provide some guidance for the bias correction and muti-source precipitation fusion. It should be noted that this study still has some limitations. Global-scale errors require further in-depth study. The systematic and random error decomposition method ignores the error product term on the right side of the equation, and the impact of this on the error decomposition also needs to be quantitatively analyzed.

Author Contributions

All authors were involved in designing and discussing the study; Y.Z. and L.L. (Lingjie Li) undertook the data analysis and drafted the manuscript; Q.W. collected the required data; Y.W., and L.W. revised the manuscript and edited the language; Y.H. and L.L. (Liping Li) contributed to the set-up of the simulations and the writing of the paper. All authors have read and agreed to the published version of the manuscript.

Funding

This research was funded by the National Key Research and Development Program of China (No. 2021YFC3000104; No. 2021YFC3000101; and No. 2021YFC3000102) and the National Natural Science Foundation of China (No. 52009081).

Institutional Review Board Statement

Not applicable.

Informed Consent Statement

Not applicable.

Data Availability Statement

The raw data used in the study were all available from official sources.

Conflicts of Interest

The authors declare no conflict of interest.

References

  1. He, X.; Pan, M.; Wei, Z.; Wood, E.F.; Sheffield, J. A global drought and flood catalogue from 1950 to 2016. Bull. Am. Meteorol. Soc. 2020, 101, E508–E535. [Google Scholar] [CrossRef] [Green Version]
  2. Kidd, C.; Becker, A.; Huffman, G.J.; Muller, C.L.; Joe, P.; Skofronick-Jackson, G.; Kirschbaum, D.B. So, how much of the Earth’s surface is covered by rain gauges? Bull. Am. Meteorol. Soc. 2017, 98, 69–78. [Google Scholar] [CrossRef]
  3. Zandler, H.; Senftl, T.; Vanselow, K.A. Reanalysis datasets outperform other gridded climate products in vegetation change analysis in peripheral conservation areas of Central Asia. Sci. Rep. 2020, 10, 22446. [Google Scholar] [CrossRef]
  4. Jiang, J.; Zhou, T.; Zhang, W. Evaluation of satellite and reanalysis precipitable water vapor data sets against radiosonde observations in central Asia. Earth Space Sci. 2019, 6, 1129–1148. [Google Scholar] [CrossRef] [Green Version]
  5. Poccard, I.; Janicot, S.; Camberlin, P. Comparison of rainfall structures between NCEP/NCAR reanalyses and observed data over tropical Africa. Clim. Dyn. 2000, 16, 897–915. [Google Scholar] [CrossRef]
  6. Diro, G.; Grimes, D.; Black, E.; O’Neill, A.; Pardo-Iguzquiza, E. Evaluation of reanalysis rainfall estimates over Ethiopia. Int. J. Climatol. A J. R. Meteorol. Soc. 2009, 29, 67–78. [Google Scholar] [CrossRef]
  7. Diro, G.T.; Toniazzo, T.; Shaffrey, L. Ethiopian rainfall in climate models. In African Climate and Climate Change; Springer: Berlin, Germany, 2011; pp. 51–69. [Google Scholar]
  8. Sun, Q.; Miao, C.; Duan, Q.; Ashouri, H.; Sorooshian, S.; Hsu, K.L. A review of global precipitation data sets: Data sources, estimation, and intercomparisons. Rev. Geophys. 2018, 56, 79–107. [Google Scholar] [CrossRef] [Green Version]
  9. Colorado-Ruiz, G.; Cavazos, T. Trends of daily extreme and non-extreme rainfall indices and intercomparison with different gridded data sets over Mexico and the southern United States. Int. J. Climatol. 2021, 41, 5406–5430. [Google Scholar] [CrossRef]
  10. Li, C.; Zhao, T.; Shi, C.; Liu, Z. Assessment of precipitation from the CRA40 dataset and new generation reanalysis datasets in the global domain. Int. J. Climatol. 2021, 41, 5243–5263. [Google Scholar] [CrossRef]
  11. Jiang, Q.; Li, W.; Fan, Z.; He, X.; Sun, W.; Chen, S.; Wen, J.; Gao, J.; Wang, J. Evaluation of the ERA5 reanalysis precipitation dataset over Chinese Mainland. J. Hydrol. 2021, 595, 125660. [Google Scholar] [CrossRef]
  12. Xin, Y.; Lu, N.; Jiang, H.; Liu, Y.; Yao, L. Performance of ERA5 reanalysis precipitation products in the Guangdong-Hong Kong-Macao greater Bay Area, China. J. Hydrol. 2021, 602, 126791. [Google Scholar] [CrossRef]
  13. Huang, J.; Yin, J.; Wang, M.; He, Q.; Guo, J.; Zhang, J.; Liang, X.; Xie, Y. Evaluation of five reanalysis products with radiosonde observations over the Central Taklimakan Desert during summer. Earth Space Sci. 2021, 8, e2021EA001707. [Google Scholar] [CrossRef]
  14. Amjad, M.; Yilmaz, M.T.; Yucel, I.; Yilmaz, K.K. Performance evaluation of satellite-and model-based precipitation products over varying climate and complex topography. J. Hydrol. 2020, 584, 124707. [Google Scholar] [CrossRef]
  15. Sharifi, E.; Eitzinger, J.; Dorigo, W. Performance of the state-of-the-art gridded precipitation products over mountainous terrain: A regional study over Austria. Remote Sens. 2019, 11, 2018. [Google Scholar] [CrossRef] [Green Version]
  16. Willmott, C.J. On the validation of models. Phys. Geogr. 1981, 2, 184–194. [Google Scholar] [CrossRef]
  17. Shen, Z.; Yong, B.; Yi, L.; Wu, H.; Xu, H. From TRMM to GPM, how do improvements of post/near-real-time satellite precipitation estimates manifest? Atmos. Res. 2022, 268, 106029. [Google Scholar] [CrossRef]
  18. Chen, H.; Yong, B.; Kirstetter, P.-E.; Wang, L.; Hong, Y. Global component analysis of errors in three satellite-only global precipitation estimates. Hydrol. Earth Syst. Sci. 2021, 25, 3087–3104. [Google Scholar] [CrossRef]
  19. Tang, S.; Li, R.; He, J. Modeling and Evaluating Systematic and Random Errors in Multiscale GPM IMERG Summer Precipitation Estimates Over the Sichuan Basin. IEEE J. Sel. Top. Appl. Earth Obs. Remote Sens. 2021, 14, 4709–4719. [Google Scholar] [CrossRef]
  20. Masood, M.; Nabi, G.; Babur, M.; Azhar, A.H.; Kaleem Ullah, M. Disintegration of uncertainties associated with real-time multi-satellite precipitation products in diverse topographic and climatic area in Pakistan. J. Mt. Sci. 2021, 18, 716–734. [Google Scholar] [CrossRef]
  21. Tang, G. Characterization of the systematic and random errors in satellite precipitation using the multiplicative error model. IEEE Trans. Geosci. Remote Sens. 2020, 59, 5407–5416. [Google Scholar] [CrossRef]
  22. Tian, Y.; Peters-Lidard, C.D.; Eylander, J.B.; Joyce, R.J.; Huffman, G.J.; Adler, R.F.; Hsu, K.l.; Turk, F.J.; Garcia, M.; Zeng, J. Component analysis of errors in satellite-based precipitation estimates. J. Geophys. Res. Atmos. 2009, 114. [Google Scholar] [CrossRef] [Green Version]
  23. Su, J.; Lü, H.; Zhu, Y.; Wang, X.; Wei, G. Component analysis of errors in four GPM-based precipitation estimations over Mainland China. Remote Sens. 2018, 10, 1420. [Google Scholar] [CrossRef] [Green Version]
  24. Xu, R.; Tian, F.; Yang, L.; Hu, H.; Lu, H.; Hou, A. Ground validation of GPM IMERG and TRMM 3B42V7 rainfall products over southern Tibetan Plateau based on a high-density rain gauge network. J. Geophys. Res. Atmos. 2017, 122, 910–924. [Google Scholar] [CrossRef]
  25. Chen, H.; Yong, B.; Gourley, J.J.; Liu, J.; Ren, L.; Wang, W.; Hong, Y.; Zhang, J. Impact of the crucial geographic and climatic factors on the input source errors of GPM-based global satellite precipitation estimates. J. Hydrol. 2019, 575, 1–16. [Google Scholar] [CrossRef]
  26. Chen, H.; Yong, B.; Shen, Y.; Liu, J.; Hong, Y.; Zhang, J. Comparison analysis of six purely satellite-derived global precipitation estimates. J. Hydrol. 2020, 581, 124376. [Google Scholar] [CrossRef]
  27. Guo, H.; Bao, A.; Ndayisaba, F.; Liu, T.; Kurban, A.; De Maeyer, P. Systematical evaluation of satellite precipitation estimates over central Asia using an improved error-component procedure. J. Geophys. Res. Atmos. 2017, 122, 10906–10927. [Google Scholar] [CrossRef]
  28. Takido, K.; VALERIANO, O.C.S.; Ryo, M.; Tanuma, K.; Ushio, T.; Kubota, T. Spatiotemporal evaluation of the gauge-adjusted global satellite mapping of precipitation at the basin scale. J. Meteorol. Soc. Jpn. Ser. II 2016, 94, 185–195. [Google Scholar] [CrossRef] [Green Version]
  29. Shen, Y.; Xiong, A. Validation and comparison of a new gauge-based precipitation analysis over mainland China. Int. J. Climatol. 2016, 36, 252–265. [Google Scholar] [CrossRef]
  30. Lin, Q.; Peng, T.; Wu, Z.; Guo, J.; Chang, W.; Xu, Z. Performance evaluation, error decomposition and Tree-based Machine Learning error correction of GPM IMERG and TRMM 3B42 products in the Three Gorges Reservoir Area. Atmos. Res. 2022, 268, 105988. [Google Scholar] [CrossRef]
  31. Lei, H.; Li, H.; Zhao, H.; Ao, T.; Li, X. Comprehensive evaluation of satellite and reanalysis precipitation products over the eastern Tibetan plateau characterized by a high diversity of topographies. Atmos. Res. 2021, 259, 105661. [Google Scholar] [CrossRef]
  32. Tang, G.; Li, C.; Hong, Y.; Long, D. Evaluation of multiple precipitation products across Mainland China using the triple collocation method without ground truth. In Proceedings of the AGU Fall Meeting Abstracts, New Orleans, LA, USA, 11–15 December 2017; p. H21E-1506. [Google Scholar]
  33. Chen, J.; Wang, Z.; Wu, X.; Lai, C.; Chen, X. Evaluation of TMPA 3B42-V7 product on extreme precipitation estimates. Remote Sens. 2021, 13, 209. [Google Scholar] [CrossRef]
  34. Hersbach, H.; Bell, B.; Berrisford, P.; Hirahara, S.; Horányi, A.; Muñoz-Sabater, J.; Nicolas, J.; Peubey, C.; Radu, R.; Schepers, D. The ERA5 global reanalysis. Q. J. R. Meteorol. Soc. 2020, 146, 1999–2049. [Google Scholar] [CrossRef]
  35. Tarek, M.; Brissette, F.P.; Arsenault, R. Evaluation of the ERA5 reanalysis as a potential reference dataset for hydrological modelling over North America. Hydrol. Earth Syst. Sci. 2020, 24, 2527–2544. [Google Scholar] [CrossRef]
  36. Muñoz Sabater, J. ERA5-Land hourly data from 1981 to present. Copernic. Clim. Change Serv. (C3S) Clim. Data Store (CDS) 2019, 10. [Google Scholar]
  37. Muñoz-Sabater, J.; Dutra, E.; Agustí-Panareda, A.; Albergel, C.; Arduini, G.; Balsamo, G.; Boussetta, S.; Choulga, M.; Harrigan, S.; Hersbach, H. ERA5-Land: A state-of-the-art global reanalysis dataset for land applications. Earth Syst. Sci. Data 2021, 13, 4349–4383. [Google Scholar] [CrossRef]
  38. Yang, J.; Huang, M.; Zhai, P. Performance of the CRA-40/Land, CMFD, and ERA-Interim datasets in reflecting changes in surface air temperature over the Tibetan Plateau. J. Meteorol. Res. 2021, 35, 663–672. [Google Scholar] [CrossRef]
  39. Liang, X.; Jiang, L.; Pan, Y.; Shi, C.; Liu, Z.; Zhou, Z. A 10-yr global land surface reanalysis interim dataset (CRA-Interim/Land): Implementation and preliminary evaluation. J. Meteorol. Res. 2020, 34, 101–116. [Google Scholar] [CrossRef]
  40. Habib, E.; Henschke, A.; Adler, R.F. Evaluation of TMPA satellite-based research and real-time rainfall estimates during six tropical-related heavy rainfall events over Louisiana, USA. Atmos. Res. 2009, 94, 373–388. [Google Scholar] [CrossRef]
  41. Yong, B.; Chen, B.; Tian, Y.; Yu, Z.; Hong, Y. Error-component analysis of TRMM-based multi-satellite precipitation estimates over mainland China. Remote Sens. 2016, 8, 440. [Google Scholar] [CrossRef] [Green Version]
  42. Xu, J.; Ma, Z.; Yan, S.; Peng, J. Do ERA5 and ERA5-land precipitation estimates outperform satellite-based precipitation products? A comprehensive comparison between state-of-the-art model-based and satellite-based precipitation products over mainland China. J. Hydrol. 2022, 605, 127353. [Google Scholar] [CrossRef]
  43. Zhao, D.; Zhang, L.; Zhou, T.; Liu, J. Contributions of local and remote atmospheric moisture fluxes to East China precipitation estimated from CRA-40 reanalysis. J. Meteorol. Res. 2021, 35, 32–45. [Google Scholar] [CrossRef]
  44. LI, L.; Wang, Y.; Wang, L. Spatio-temporal accuracy evaluation of MSWEP daily precipitation over the Huaihe River Basin, China: A comparison study with representative satellite-and reanalysis-based products. J. Geogr. Sci. 2022, 32, 2271–2290. [Google Scholar] [CrossRef]
Figure 1. Geographical location of the study area.
Atmosphere 13 01936 g001
Figure 2. Technical Scheme.
Atmosphere 13 01936 g002
Figure 3. (af) Systematic and random error components (%) of the ERA5-Land reanalysis precipitation dataset.
Atmosphere 13 01936 g003
Figure 4. (af) Systematic and random error components (%) of the CRA40-Land reanalysis precipitation data.
Atmosphere 13 01936 g004
Figure 5. (a,b) Proportions of systematic and random errors over time.
Atmosphere 13 01936 g005
Figure 6. Correlation of the precipitation intensity with systematic and random error components.
Atmosphere 13 01936 g006
Figure 7. (af) Correlation of the elevation with systematic and random error components.
Atmosphere 13 01936 g007
Figure 8. (al) TB, HB, MP, and FP of ERA5-Land reanalysis precipitation dataset.
Atmosphere 13 01936 g008
Figure 9. (a–l) TB, HB, MP, and FP of CRA40-Land reanalysis precipitation data.
Atmosphere 13 01936 g009
Figure 10. (a,b) Temporal variations of the error components, namely, TB, HB, MP, and FP.
Atmosphere 13 01936 g010
Figure 11. Correlation between precipitation intensity and error components TB, HB, MP, and FP (logarithmic base 10 on the abscissa).
Atmosphere 13 01936 g011
Figure 12. (af) Correlation between elevation and error components, namely, TB, HB, MP, and FP.
Atmosphere 13 01936 g012
Table 1. Quantitative and classification accuracies of the two reanalysis precipitation products.
TimeCCRB (%)RMSE (mm)PODFARCSI
ERA5-Land0.788.52.900.990.070.92
CRA40-Land0.876.62.161.000.080.91
ERA5-Land summer0.703.75.630.980.050.93
CRA40-Land summer0.847.34.001.000.080.92
ERA5-Land winter0.8546.80.270.970.250.73
CRA40-Land winter0.8514.00.270.960.110.86
Table 2. Overall evaluation results of the two error decomposition schemes.
ScenarioType of PrecipitationIndexAnnualSummer (June, July, and August)Winter (December, January, and February)
Error decomposition method considering the precipitation-fitting effect (mm2/grid/d)ERA5-LandMSE8.6432.810.08
MSES1.727.630.02
MSER6.9225.170.06
CRA40-LandMSE4.8616.780.08
MSES1.496.080.03
MSER3.3710.700.05
Error decomposition method considering rain/no rain state (mm/grid)ERA5-LandTB94.1324.657.28
HB18.39−5.630.64
MP−15.55−11.22−0.62
FP91.2941.507.26
CRA40-LandTB68.8547.710.71
HB−37.48−11.26−0.97
MP−5.27−2.65−0.86
FP111.6161.622.54
Publisher’s Note: MDPI stays neutral with regard to jurisdictional claims in published maps and institutional affiliations.

