Article

Fast Identification of the Failure of Heavy-Duty Diesel Particulate Filters Using a Low-Cost Condensation Particle Counter (CPC) Based System

1
School of Optics and Photonics, Beijing Institute of Technology, Beijing 100081, China
2
School of Mechanical Engineering, Beijing Institute of Technology, Beijing 100081, China
*
Author to whom correspondence should be addressed.
Submission received: 21 December 2021 / Revised: 3 February 2022 / Accepted: 3 February 2022 / Published: 5 February 2022
(This article belongs to the Special Issue Greener Energy, Air Quality, and Carbon Neutrality)

Abstract

:
The penetration of diesel particulate filters (DPFs) in the market is growing fast. However, in the current inspection/maintenance (I/M) regulation for these vehicles, particulate emissions were capped with smoke opacity, which is incompetent to identify the excessive particle number (PN) induced by non-major DPF failures such as small cracks in substrate. This research aimed at developing a fast identification method for such malfunctioning vehicles using a low-cost condensation particle counter (CPC). To verify the effectiveness of idle PN test, 33 China-5 and China-6 heavy-duty vehicles fueled with diesel and natural gas (NG) were tested using the regulatory portable emission measurement system (PEMS) as per China-6 protocol and idle PN tests using a low-cost CPC-based system. PN emissions from China-6 vehicles with malfunctioning DPFs were at a similar level to those from China-5 vehicles (without DPF), which were significantly higher than the proper counterparts. Idle PN tests using a CPC-based system managed to identify the vehicles with DPF failures. Volumetric PN concentrations of these vehicles were much higher than those of the proper ones. This study proved that an easy, fast, and low-cost procedure could be used to screen out those high emitters with DPF failure.

1. Introduction

Particulate matter (PM) is one of the major urban air pollutants in developing countries, with mobile sources being a dominant contributor. To curb tailpipe PM emissions and to purify the sky, mass-based PM regulations were promulgated decades before and have been updated periodically until today [1]. However, mass-based PM limits confront greater challenges; through the application of high-pressure fuel injection systems and advanced combustion concepts, PM has been reduced by at least an order of magnitude, while the particle number (PN) increased notably as the mean diameter of exhaust particles dropped to a much smaller level. Decreased sizes and mass of diesel exhaust particles are approaching the accuracy limit of the filter weighing method [2,3,4]. Together with the widely-reported higher health risks of smaller particles associated with easier inhalation, longer deposition, and greater potential of carrying dangerous substances such as the COVID-19 virus [3,5,6,7,8,9,10], number-based harmonizing with mass-based particulate regulation is deemed necessary.
Currently, PM and PN limits for light- and heavy-duty road vehicles have been implemented by major economic entities, such as the EU member states, China, and India. In China, PN requirements were introduced to heavy-duty vehicles starting from the promulgation of the China-6 regulation, which has been effective since July 2021 and which mandates that work-based PN emissions shall be no higher than 8.0 × 10¹¹, 6.0 × 10¹¹, and 1.2 × 10¹²#/kWh in the World Harmonized Steady Cycle (WHSC), World Harmonized Transient Cycle (WHTC), and PEMS tests, respectively [11].
Using diesel particulate filters (DPF) is a straightforward but efficient solution for global ever-tightening PN regulations [12]. DPFs have a high filtering efficiency for particulate matter from automotive exhaust of above 95% [13,14], which means that PN emissions in the exhaust emissions of vehicles equipped with DPF are reduced by about 2 to 3 orders of magnitude, even lower than some direct-injection ignition engine vehicles without particulate filters [15,16,17,18,19,20]. Research has suggested that the adoption of diesel DPFs could, globally, reduce the total black carbon (BC) emissions by 10% and, therefore, alleviate global warming [21,22,23,24]. To comply with the more stringent exhaust regulations in China-6, heavy-duty vehicles are commonly equipped with DPF. The alternatively-plugged channels with the porous microstructure of substrate allow DPFs to have very high filtration efficiency for both PM and PN. However, once a crack emerges inside a DPF monolith, either as a result of mechanical or thermal damage or tampering, engine exhaust won’t flow through the porous filtration medium, disabling the blocking of particles from the exhaust stream. Hence, even a small crack inside, which is typically regarded as a non-major failure, as the mechanical structure of the substrate is still visually complete, could significantly reduce the effectiveness of DPF and increased PN emissions, posing major in-service non-compliance risks even for the vehicles with short mileage. Prior studies estimated that a considerable number of in-use diesel vehicles could have DPF failure problems [25,26].
On-board diagnostics (OBD) systems can detect DPF malfunction by monitoring the pressure drop before and after DPF or by using a soot sensor [27]. Given that on-board monitoring (OBM) of PM is currently non-obligatory in the EU and China, indirect diagnosis based on pressure drop still dominates the market. According to the heavy-duty China-6 regulation, the OBD system shall record a diagnostic trouble code (DTC) and illuminate the malfunction indicating light (MIL) on the dashboard once it has confirmed that the tailpipe PM emission had exceeded 25 mg/kWh. Besides, there is no diagnostic requirement for PN. Thus, OBD systems only manage to detect severe damages of DPF or removal. Non-major damages of DPFs, such as small cracks, could hardly be noticed and receive timely and proper repair [28,29].
Seilor [30] and Dabhoiwala [31] observed apparent pressure difference and flow difference between the inlet and outlet of a defeat DPF monolith, but this back pressure-based identification method failed to be reproduced with only the presence of small cracks because the pressure difference might be negligible and below the confidence margin of industry pressure sensors in real applications. Besides, for pressure-based methods, it’s usually preferable to perform the diagnostic with some engine loads, since pressure difference theoretically increases with space velocity. Such a requirement complicates the test system and confines the application scenario because a chassis-dynamometer is typically needed [32].
Sensors using different principles were also promoted to diagnose DPF failure. Malik [33] investigated the feasibility of detecting particulate matter emission of diesel engines and monitoring DPFs by detecting the resistivity between two comb-like staggered electrodes and attained a positive outcome. Ochs et al. [34] proposed a sensor that reported whether the vehicle’s particulate emission exceed regulation by measuring the decreasing rate of the resistance between the two inter-digitated comb-like electrodes. Ntziachristos et al. [35] designed a sensor to detect the particle concentration from diesel vehicles using the “escaping current” method. The sensor first charged the exhaust-borne particles and then measured particulate concentration indirectly by gauging the “escaping current”. Nevertheless, these two methods were mainly PM, rather than PN, orientated; based on the accurate quantification of PN and judging the status of DPF, these methods may be somewhat problematic, because PN is more sensitive to the boundary conditions of testing.
Sappok et al. [36] proposed a novel technique to diagnose DPF’s failure using radio waves, but this method requires a radio frequency (RF) sensor, which increases the cost and reduces its feasibility in retail. Maricq [37] investigated the feasibility of the particulate measurement using an electrostatic soot sensor; this method still suffers from factors such as exhaust flow rate.
In addition to indirect diagnostics using sensors, direct measurement procedures of PN were also attempted. Bémer [38] tried to detect malfunctioning DPFs of non-road mobile machinery using a portable air flow meter and PN measurement devices such as DISCMini, both the apparatus and process of which are still too complicated for inspection and roadside spot checks. Fleischman et al.’s [39] showed that, for buses, the standard deviations of particulate matter measurement at high idle were much lower than those at idle, exploring a pathway for easy and quick PN-based DPF health diagnostics. Most recently, the fast quantification of tailpipe PN emissions have received increasing attention from both industry and academia as four EU member states, Germany, Netherland, Switzerland, and Belgium, have announced a plan to include fast PN measurement in their domestic periodic technical inspection (PTI) tests for light-duty vehicles. A variety of prototype instruments and testing procedures have been proposed [28,40]. Although the currently available direct and indirect measurement methods have been able to quantify PN emissions, the simplification of the testing system and procedures to application in PTI tests is still worthy of investigation [28].
The aim of this research was to develop a simple and fast identification method for heavy-duty DPF failures using a low-cost condensation particle counter (CPC)-based system, which can be applied to occasions that require fast identification of high-emitters, such as PTI tests. In China, annual PTI tests, including safety and emission checks, are mandatory for heavy-duty vehicles. However, as a key part of I/M program, current PTI tests for emissions only require smoke opacity and NOx using the lug-down procedure, which is unable to screen out high-emitters with non-major DPF damages. [41] For this purpose, 33 China-5 and China-6 compliant diesel and natural gas (NG)-fueled heavy-duty vehicles were tested using (1) PEMS by following the regulatory protocol and (2) low-cost CPC-based system. The results were compared to validate the effectiveness of the proposed simplified procedures.

2. Experimental Methods

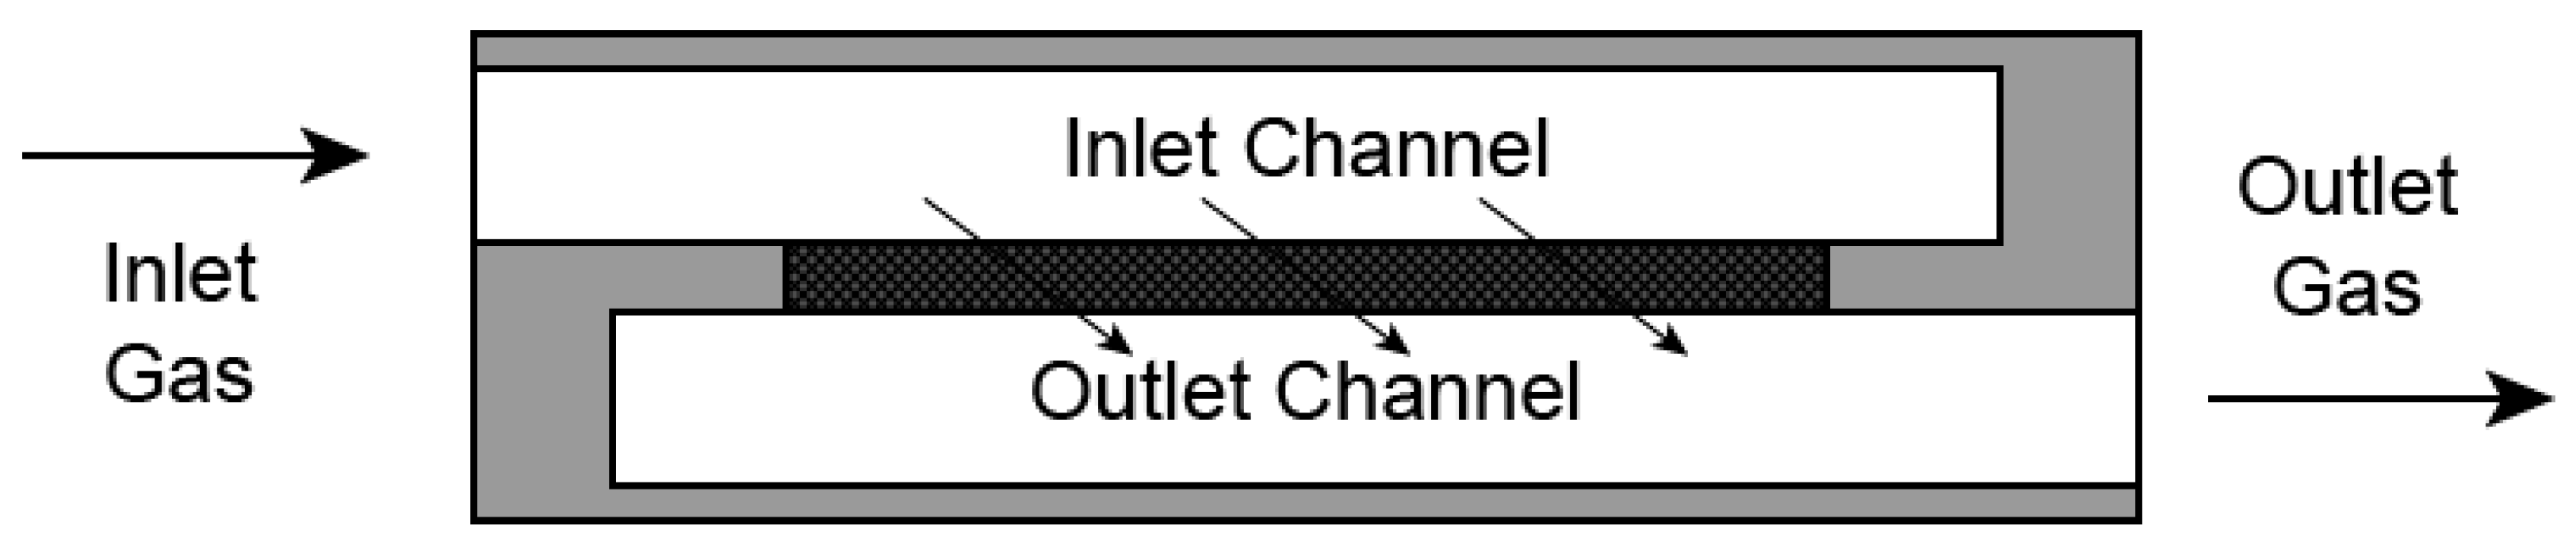
2.1. Principle of Diesel Particulate Filter (DPF)

DPF is an after-treatment device that reduces the majority of engine-out particulate emissions. A classic DPF structure comprises a metallic shell, a cordierite or silicon carbide substrate, and liner. Figure 1 shows the structure of one DPF channel. As shown, the gas flow access is labyrinth-like; exhaust gas flowed through the alternatively plugged ends, and the particulate matter, mainly soot and ashes, were filtered and deposited alongside the inlet channel wall in the DPF substrate. Most of the exhaust particles were blocked by diffusion, interception, and impaction mechanisms chiefly depending on the particle sizes. The filtration efficiency of a clean DPF is not as high as its nominal effectiveness, but it will gradually increase to an above-90% level as exhaust particles continue plugging into the holes across the filtration medium and once a soot-cake layer is established. Soot-cake layer provides extra filtration efficiency because it functions similar to an additional filtration medium with lower permeability; however, this increment in filtration efficiency inevitably comes at the price of an extra pressure drop, inducing engine derating and fuel penalty. Therefore, when the particulate matter inside a DPF accumulates to a certain amount, the regeneration strategy must be triggered. The regeneration strategy works by oxidizing particulate matter stored in DPF in high temperature using oxidizable gases in exhaust, such as O2 and NO2 [42]. There is usually a noble catalyst washcoat on the inner surface of DPF substrates to ease these regeneration reactions occurring at lower temperatures [43].
The filtration efficiency of DPFs in real applications may be significantly below expectation once small cracks on the monolith appear. The cracks could be the consequences of mechanical damages, uneven thermal stress, ablation, and even tampering. Cracks provide a shortcut with much lower flow resistance for the engine exhaust. Without flowing through the porous channel walls, a DPF quickly loses its filtration efficiency, evidenced by the comparably slower soot accumulation at crack sites and the 1–2 orders of magnitude higher PN readings [44]. Correspondingly, the vehicle’s tailpipe PM/PN emissions with a malfunctioning DPF are also subject to non-compliance risks. It is also worth noting that the soot-cake inside a DPF as an additional filtration layer could be a variable of PN measurement; however, compared with light-duty vehicles, this influence on heavy-duty vehicles should be smaller because most of the market-available DPFs are with noble metal washcoats in order to realize continuous regeneration and lower back pressure [28].

2.2. Choice of Testing Vehicles and Working Conditions
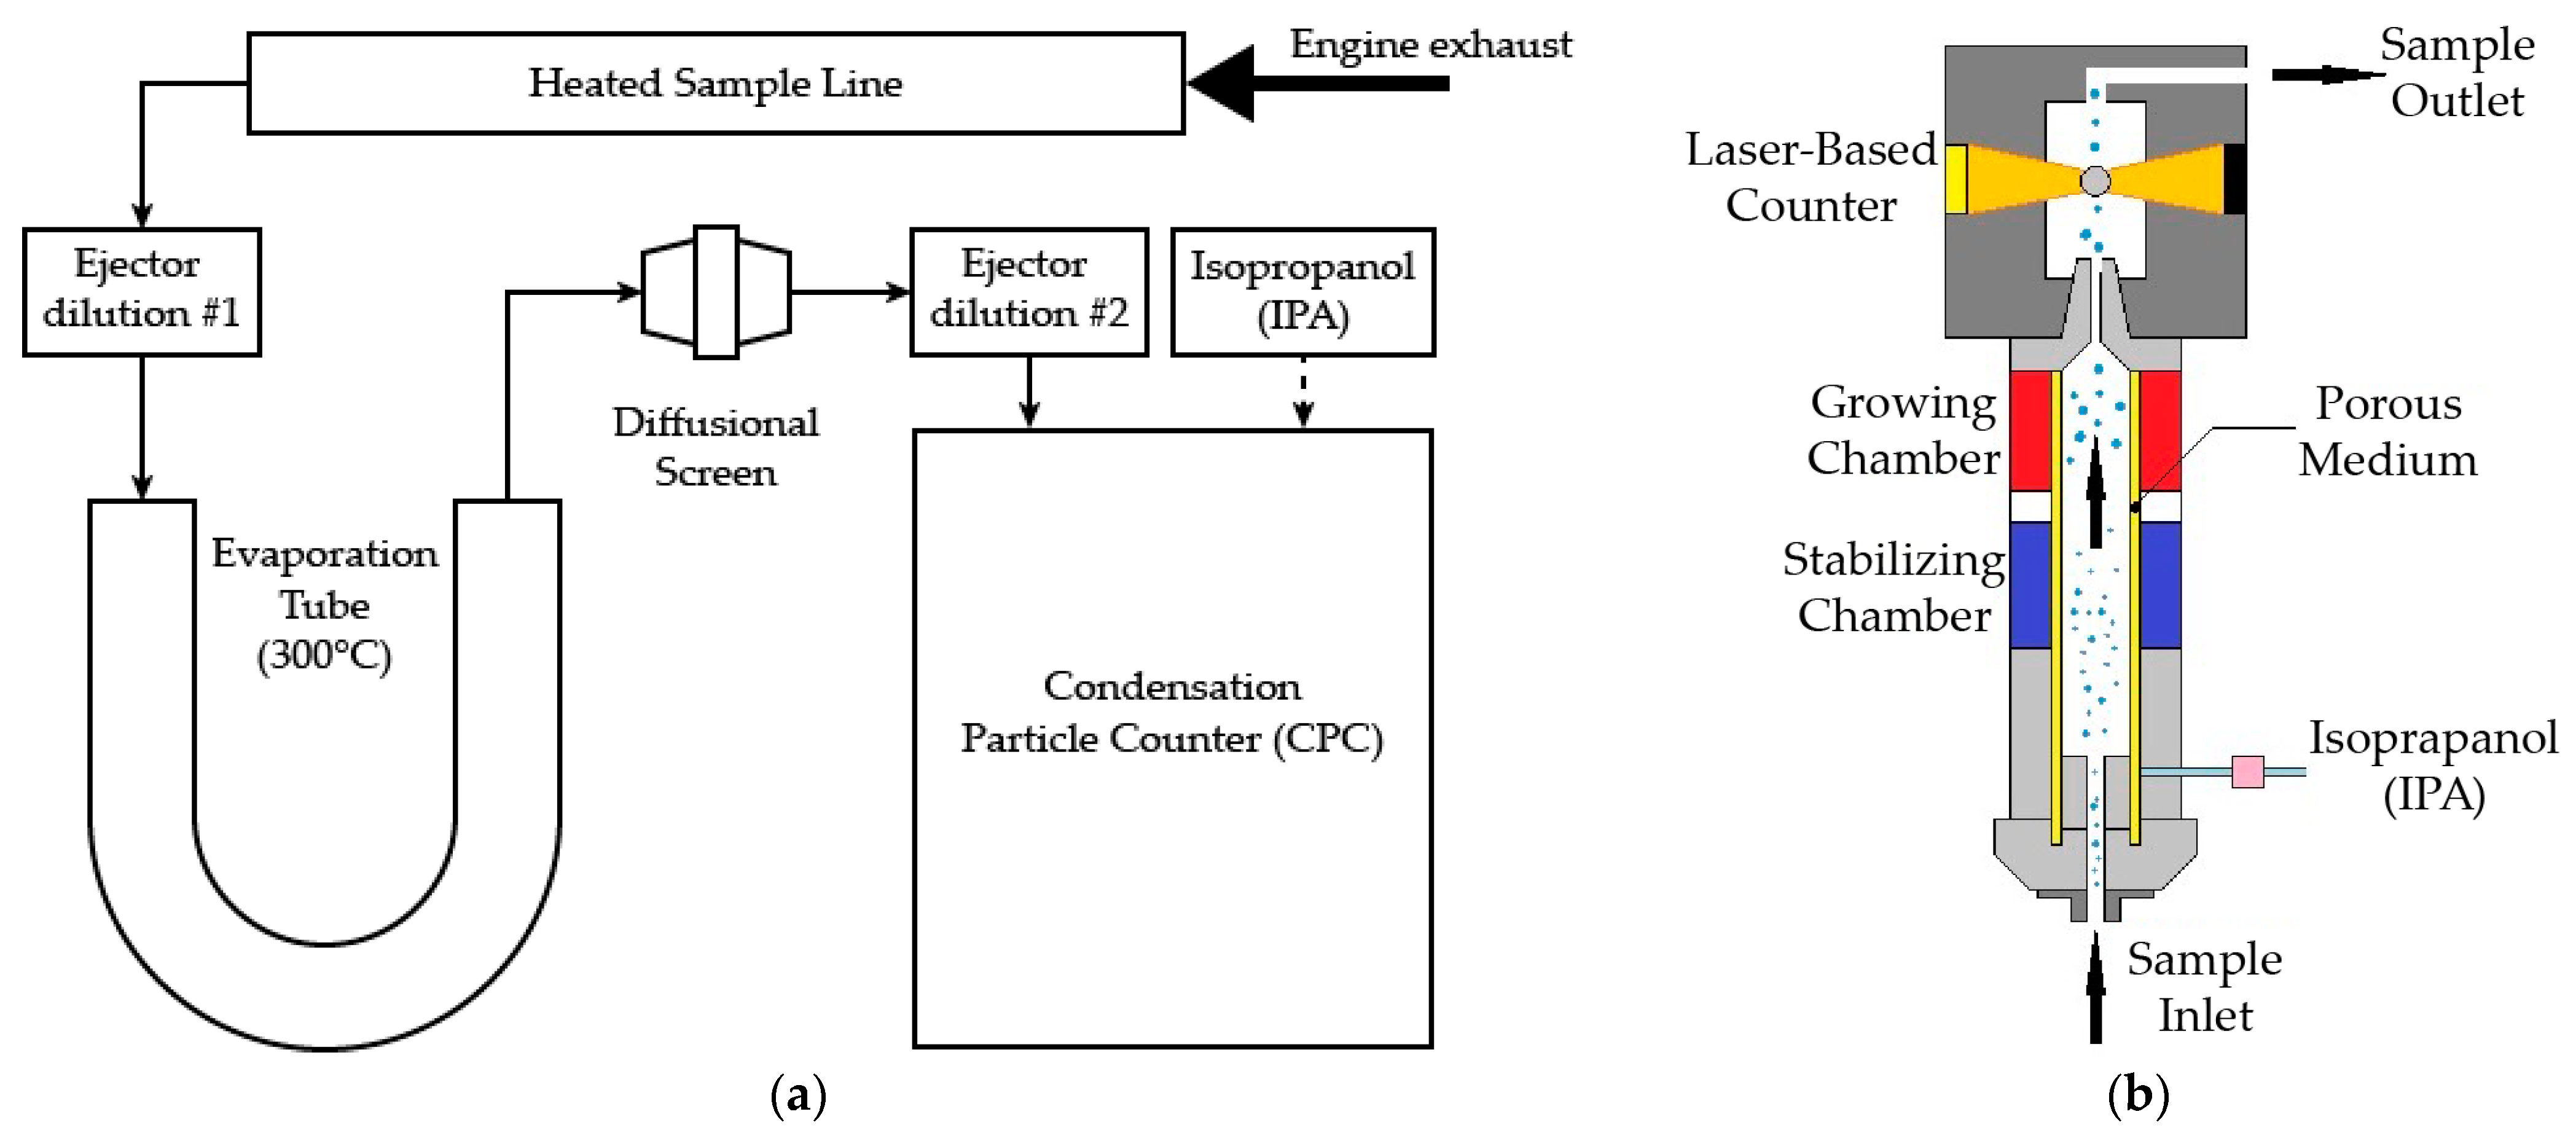
The 15 N3-category heavy-duty vehicles were tested using regulatory PEMS, including 3 China-5 diesel trucks (2 without DPFs and 1 with DPF), 10 China-6 diesel trucks (all with DPFs, 4 of which were malfunctioning) and 2 China-6 NG trucks (without filters). The main specifications of the tested vehicles are listed in Table A1 in Appendix A. The malfunctioning DPFs reported in this paper were first noticed with excessive PN emissions in repeated PEMS tests. Technicians invited from the manufacturers’ service stations confirmed the existence of small cracks on the monolith with on-site disassembly and visual inspection.
PEMS tests were performed as per the standard procedures as clarified in the heavy-duty China-6 regulation. A valid test trip lasted for at least two hours and 100 km, which sequentially comprises urban, rural, and highway stages defined by the average driving speed of the vehicle, whose proportions in total distance were 20%, 25% and 55%, respectively. The testing route for vehicles were all the same. The cumulative engine work over the entire trip was mandated within 4–7 times the cumulative work of the WHTC. All the tests were performed with an engine coolant temperature above 70 °C. The payloads of tested vehicles were at 10%, which met the lowest requirement of payloads in the China-6 standard.
PN emissions were calculated by the WHTC-work-based window method after the test ended. The i-th work-based window started at the i-th time point and ended at the time point just beyond the WHTC cycle work. The starting time point of the i-th work-based moving average window was set as t1,i, the ending time point of the same window was set as t2,i, and the total number of windows as w; then, the starting point of the last window was determined in Equation (1):
W(tn) − W(t1,w − Δt) ≤ WrefW(tn) − W(t1,w)
where tn is the last time point, Wref is the engine work for the WLTC [kWh], W(t) is the engine work from start to time t [kWh], and Δt is the data sampling period, equal to 1 s or less.
In this way, the start time point of the i-th window t1,i is determined as:
t1,I = ti, I = 1, 2, …, w
where ti is the time point corresponding to the i-th data point.
Thus, the end time point of the i-th t2,i should be selected as below:
W(t2,i − Δt) − W(t1,i) ≤ WrefW(t2,i) − W(t1,i), I = 1, 2, …, w
The work-specific PN emission of the window ePNi can be determined in (4):
e P N i = m P N i W ( t 2 , i ) W ( t 1 , i )
where mPNi is the total PN emission in the i-th window (#/window).
Post-processing software (HORIBA PP) purchased with HORIBA OBS-ONE was used to calculate PN-PEMS emissions.
The heavy-duty China-6 regulation mandates that the emission factors within at least 90% of the calculated windows shall be no higher than the limit values before a vehicle could pass a formal PEMS test. To verify, the emission factors of all the calculated windows were first sequenced from low to high, and then the 90th percentile was compared with the limits. In addition to the work-based moving average window results, the instantaneous emission rates were also calculated straightforwardly to give distance-based and work-based PN factors.
Along with the WHTC-work-based window PN emissions, the integrated PN emissions using second-by-second emission rates were also calculated.

2.3. Test Apparatus

For PEMS testing, a regulatory instrument, HORIBA OBS-ONE, was employed. Gaseous pollutants, particle number, exhaust flow rate, OBD stream data, and GPS information were recorded in the frequency of 1 Hz. A more detailed introduction of HORIBA OBS-ONE can be found elsewhere [38]. In the tests, the PEMS was fastened in the carriage of the truck with rubber parts isolating the road vibration. Before and after each PEMS test, the gas modules of the instrument were calibrated and checked with zero and span gases with known concentrations, while the PN analyzer was validated with comparisons to both the stack analyzer and the TSI standard particle generator in a certification laboratory in Beijing.
The 15 PEMS vehicles plus additional 18 N3-category vehicles (in total, 13 China-5 diesel, 2 China-5 NG, and 3 China-6 NG vehicles) were subject to a fast identification testing protocol designed in this research to validate the feasibility of using a low-cost CPC-based system to screen out high-emitters in I/M and roadside spot check scenarios. The adopted low-cost CPC-based system in this research was an automotive particle analyzer (APA) built by Sensors Inc., whose flow diagram is shown in Figure 2a. This light-weight particle counter shared a framework design with particulate matter programme (PMP)-compliant devices. An evaporation tube (ET) was placed in between the two ejector dilutors. An isopropanol-fueled condensation particle counter (CPC) detector was used for particle counting. The major specifications of the CPC detector are shown in Table 1.
The principle of the CPC detector is shown in Figure 2b. As the particle-laden gas sample enters the CPC detector’s stabilizing chamber, it is saturated with the CPC detector’s solvent vapor, which is isopropanol (IPA) in APA. The stream then passes to the growing chamber, where the walls are wetted walls to increase the vapor pressure. The high diffusivity of the solvent allows the vapor to permeate the sample stream faster than the air stream can be heated by the walls. The mixture is then cooled in the condenser tube, causing the vapor to become supersaturated and condense onto the particles, causing them to increase in diameter, to an effective total diameter of approximately 10 μm, so they can be detected by the optical sensor, where a pulse of light from each particle is converted to an electrical signal.
To reduce the apparatus expense of possible future PN fast testing, the detection range of this low-cost CPC was designed to be about two orders of magnitude smaller than a PEMS CPC but was still deemed competent for DPF failure identification because the fast identification procedure only contains idle PN testing [45,46]. The instrument was a retail version validated by its manufacturer; before the tests, the readings of the instrument and PEMS were compared at idle, which showed good agreement.
The procedures of idle PN tests are shown in Figure 3.
Given that the regeneration of DPFs will shortly release a large number of particles, especially the particles with a diameter smaller than 30 nm [47], to avoid any artefact [48,49], no major regeneration events occurred in all the tests reported in this paper and no vehicles had actively regenerated before the idle tests. This requirement is also in alliance with the regulatory protocol.

3. Results and Discussions

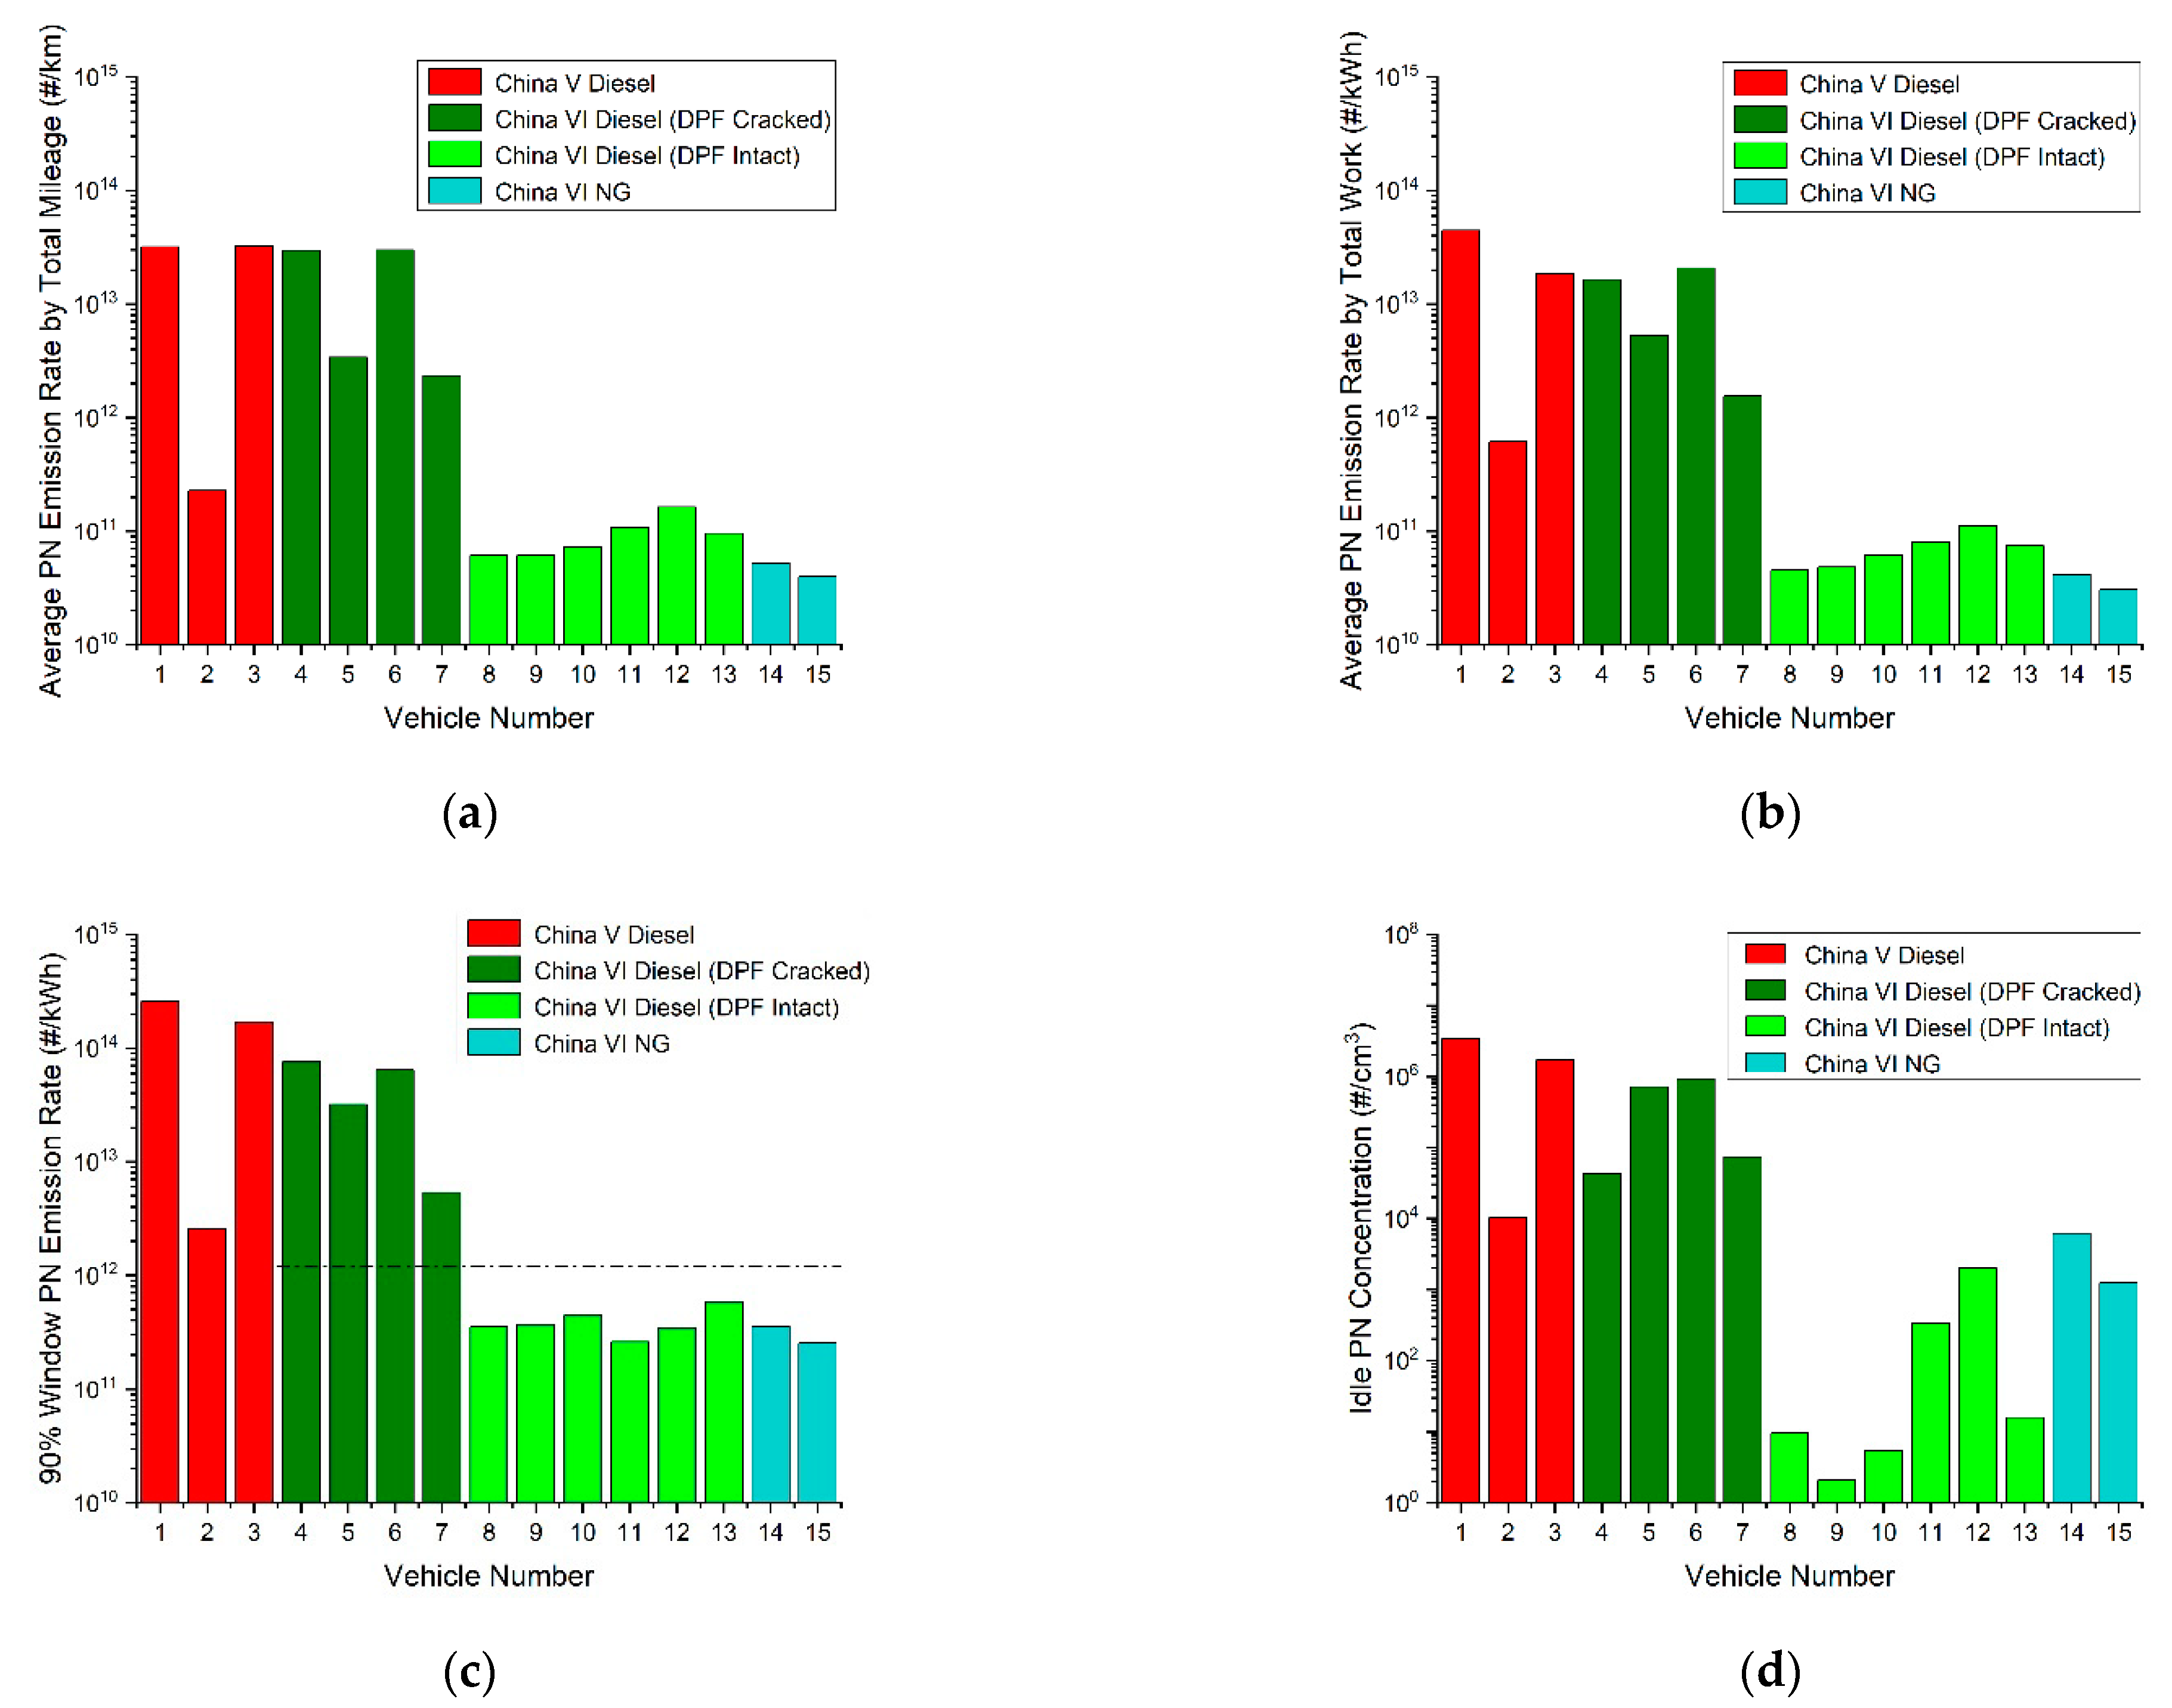
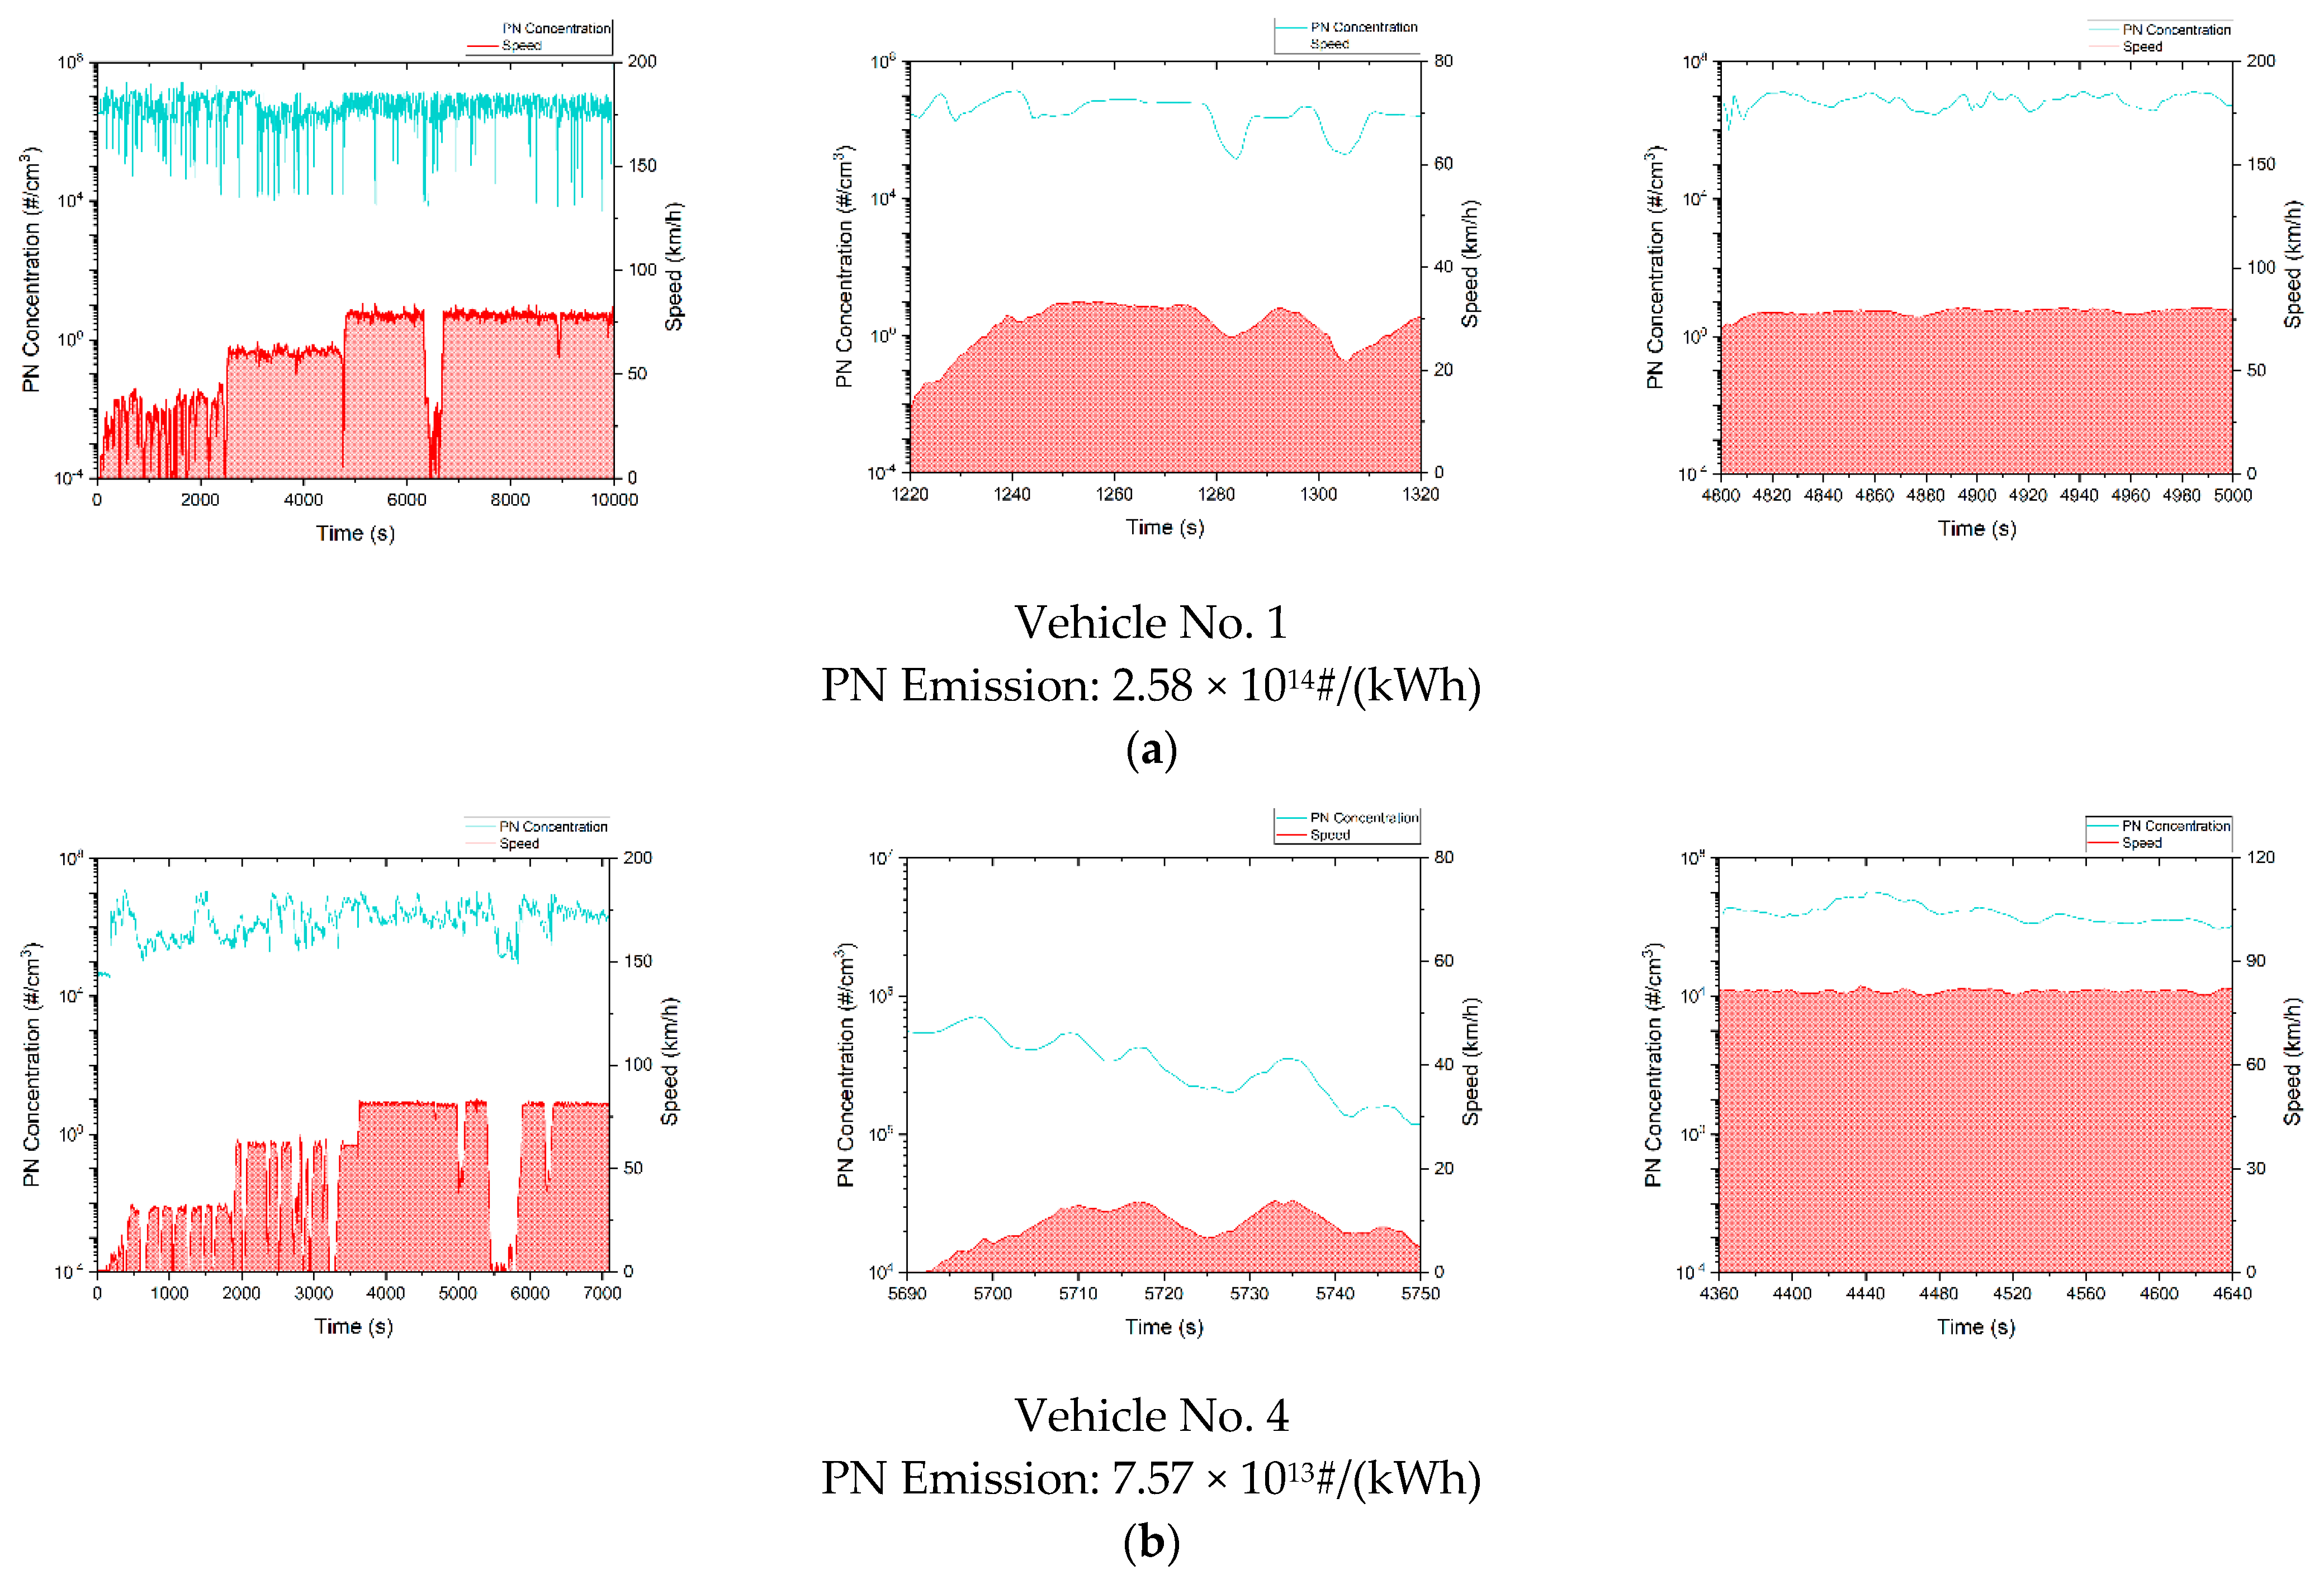
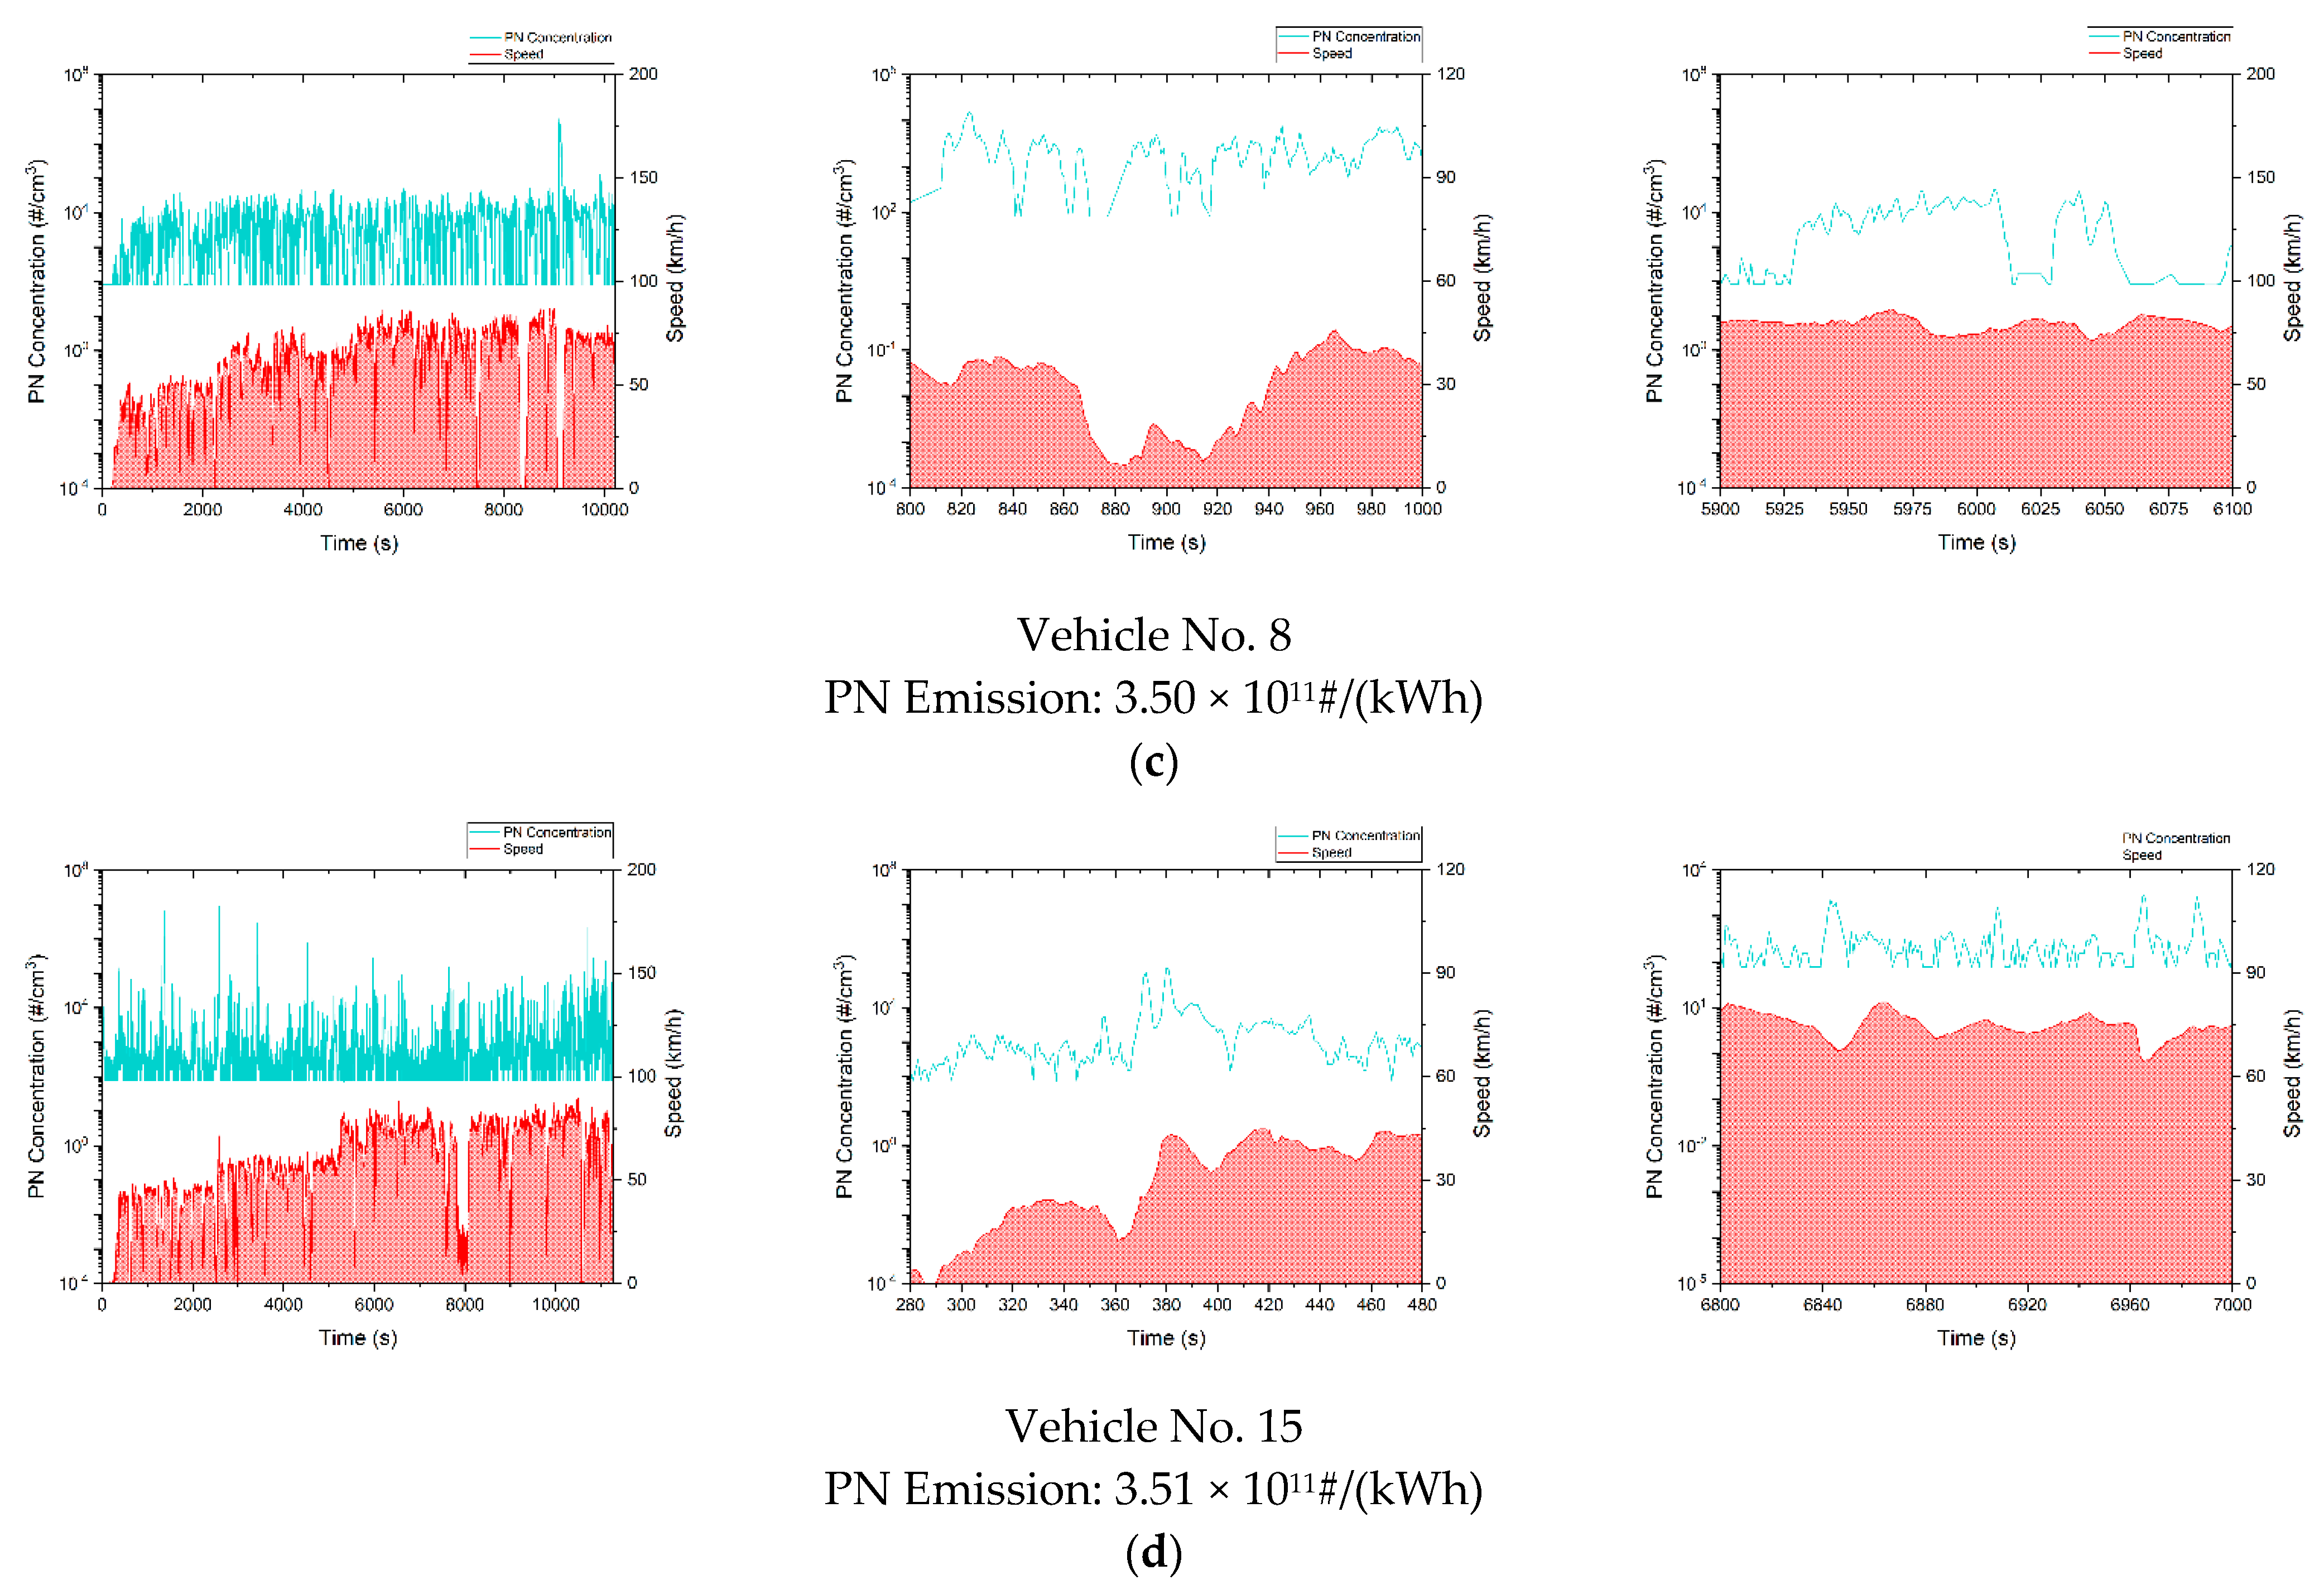
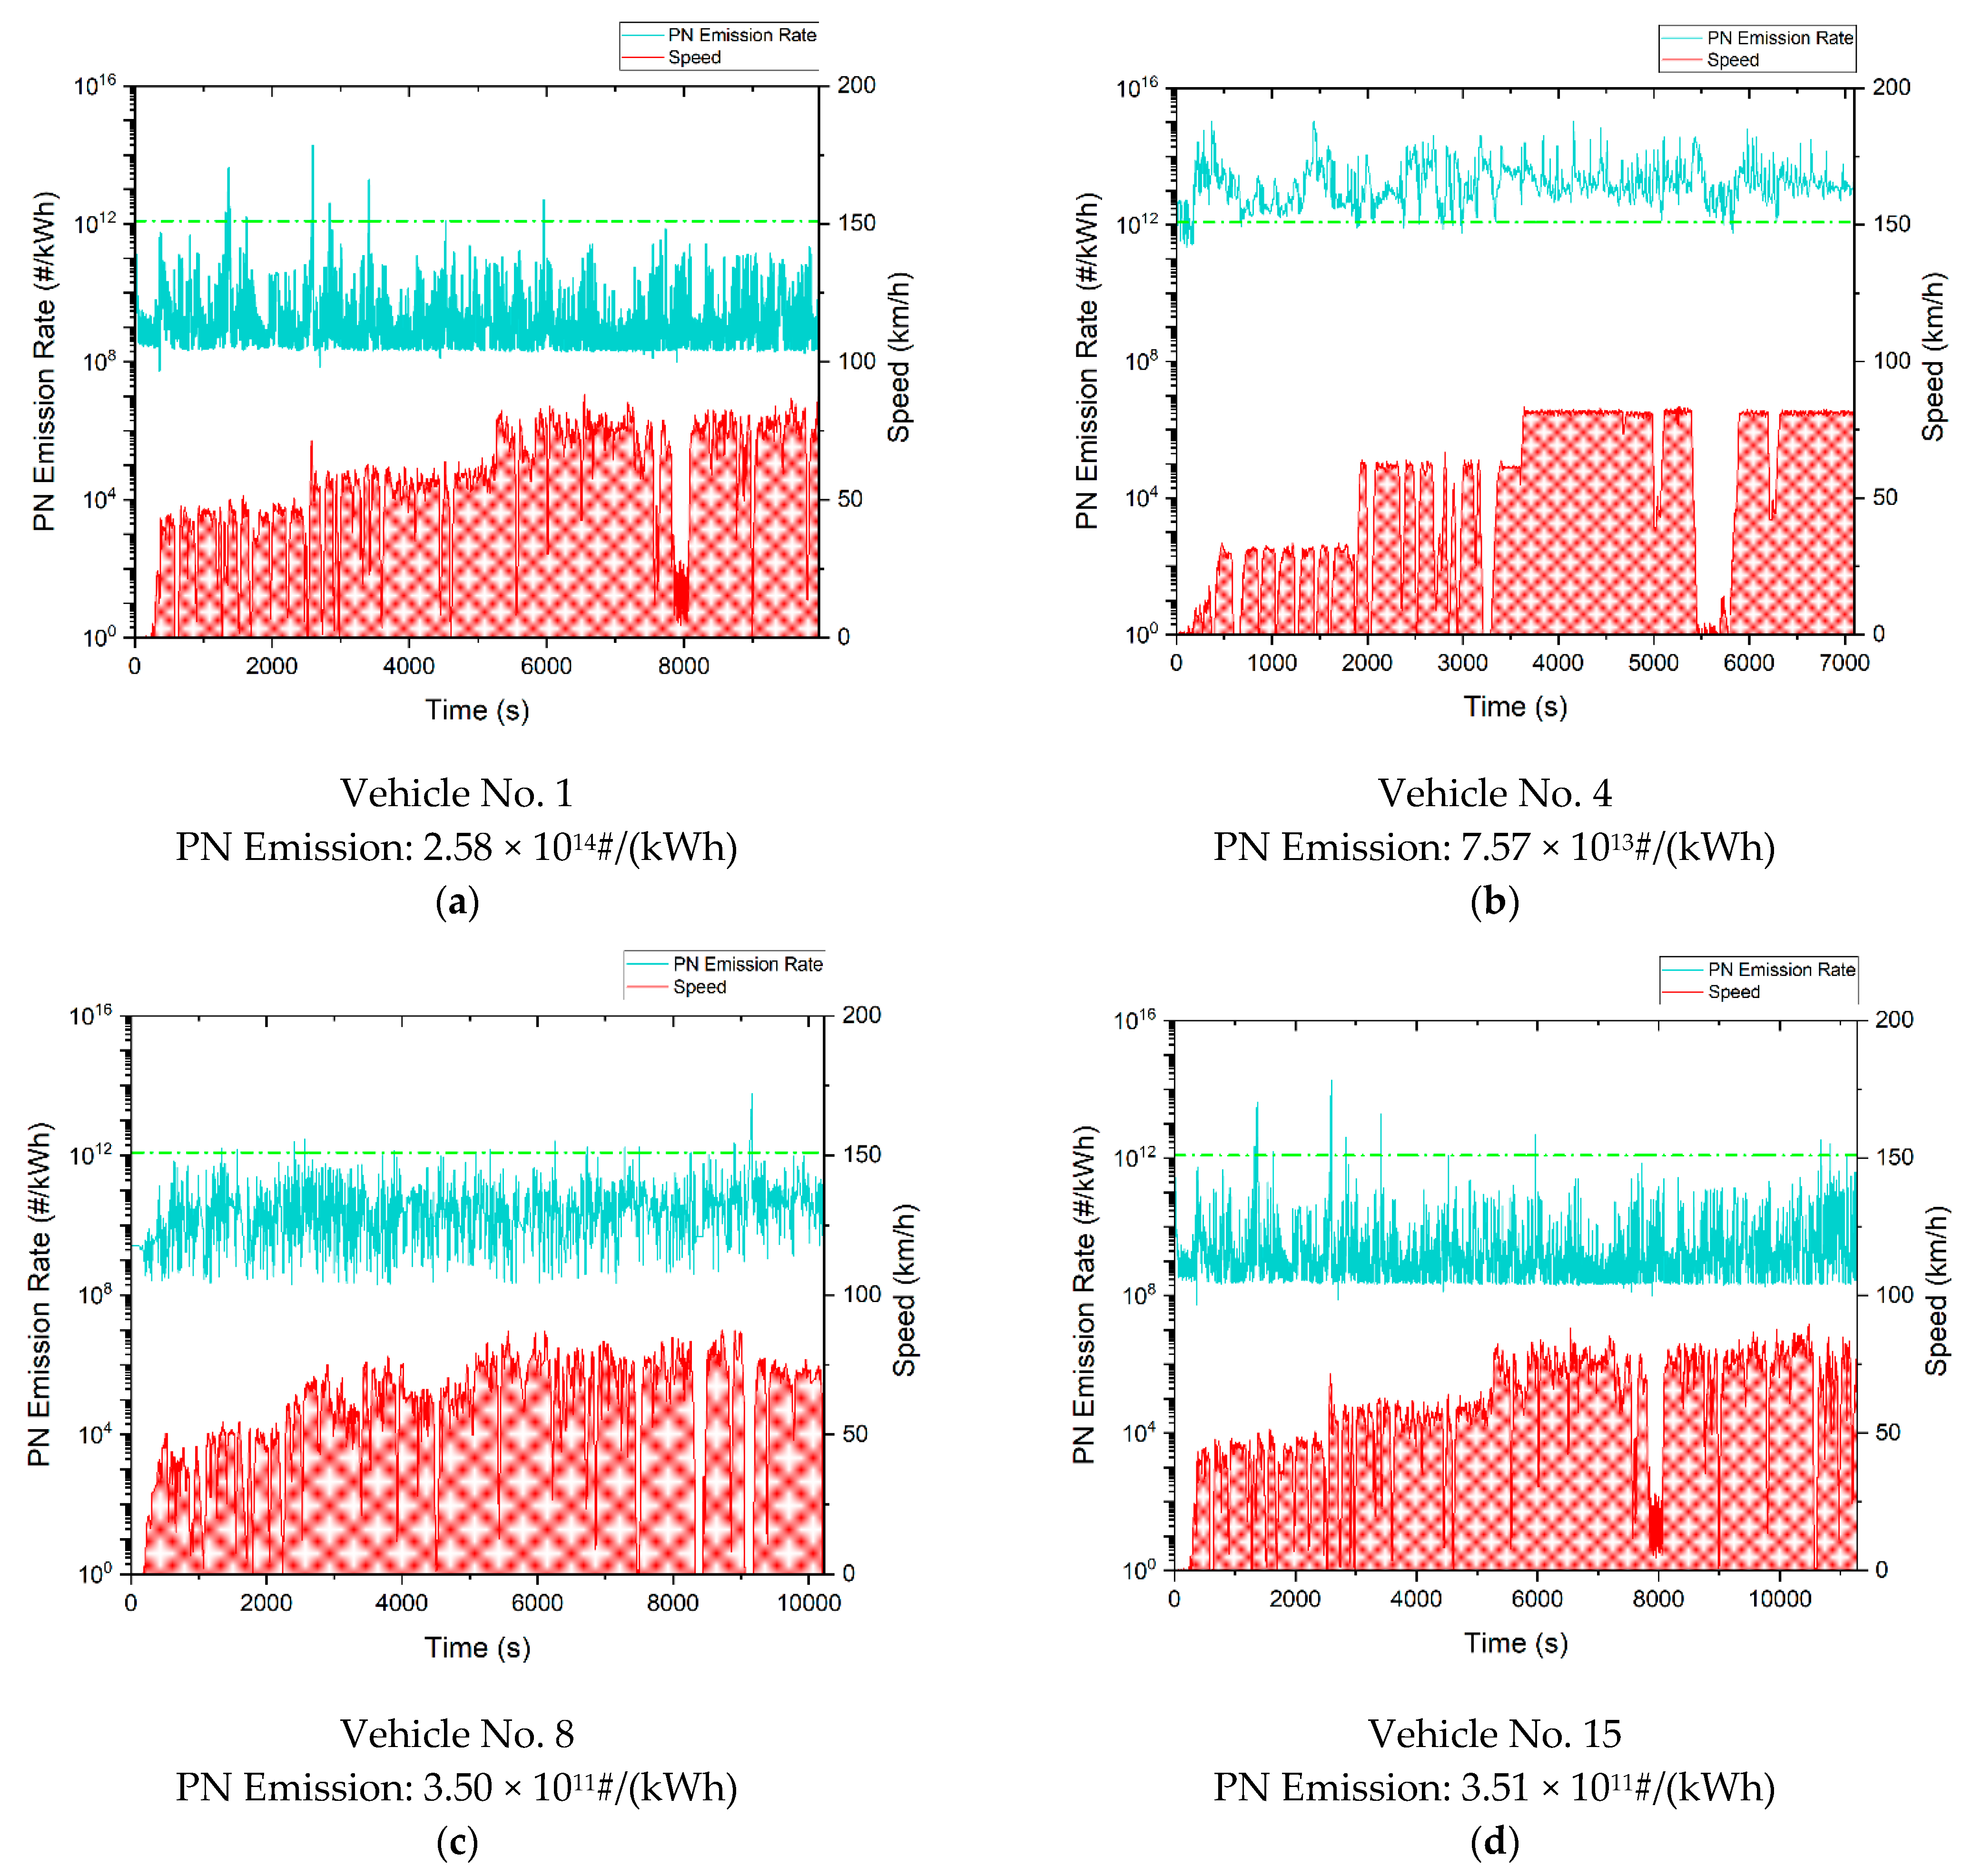
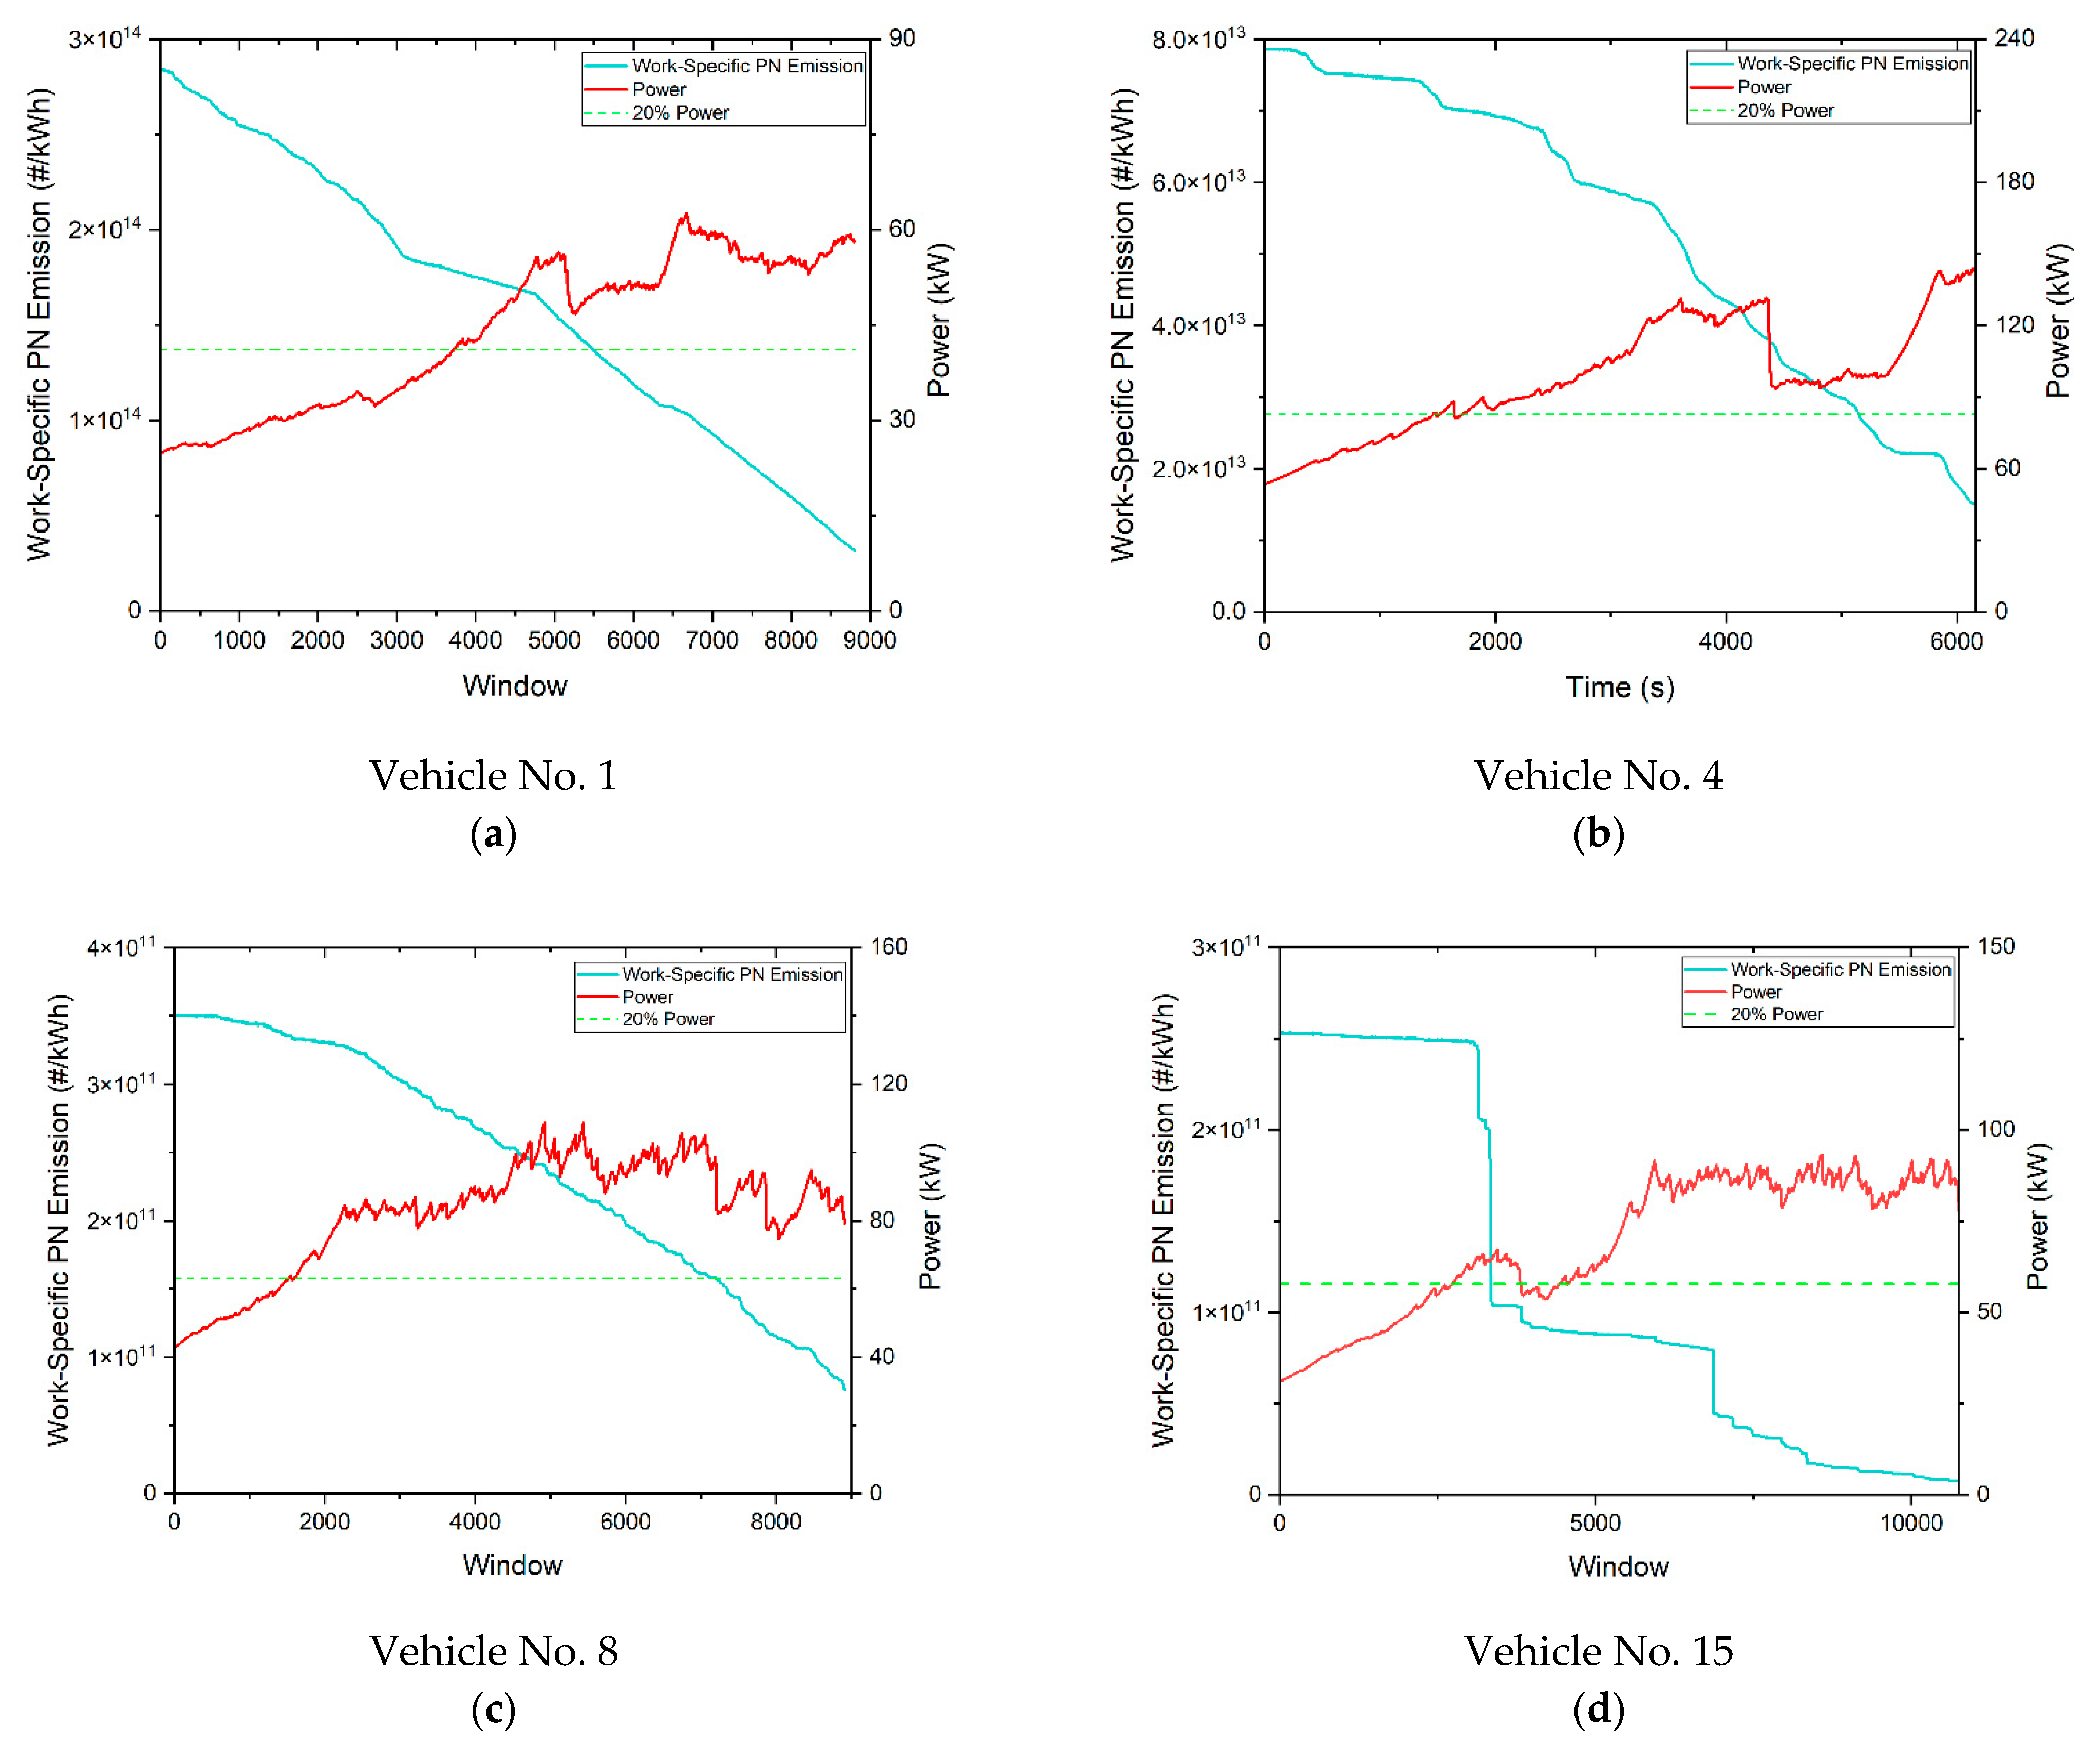
3.1. Results of PEMS Tests

Figure 4a,b illustrates the distance- and work-based PN emission factors of the 1 PEMS testing vehicles, while Figure 4c,d depicts the PN emissions corresponding to the 90 percentiles of moving average window calculation results (low-to-high sequence) and the averaged idle PN concentrations measured by PEMS. The dotted line in Figure 4c is the PN-PEMS cap (1.2 × 10¹²#/kWh). Vehicle 2 is a DPF-fitted China-5 vehicle designed to meet the specific requirements of Beijing. However, its DPF is not as efficient as that of China-6 vehicles. From Figure 4, it is obvious that, compared to China-5 diesel vehicles, China-6 diesel vehicles with intact DPFs had lower PN emissions; both the distance- and work-based PN emission factors were 1~3 orders of magnitude lower. China-6 diesel vehicles with malfunctioning DPFs had similar PN emissions with China-5 counterparts. The PN emissions of China-6-compliant NG and normal diesel vehicles were also close to each other. At idle, the PN emissions of the China-5 diesel without DPFs and the China-6 diesel vehicles with malfunctioning DPFs, on an ensemble average, were above the PN concentration of ambient air, in contrast to the ambient-equivalent, or even 1–2 orders of magnitude lower PN concentrations of proper China-6 vehicles, either fueled with NG or diesel. In PN-PEMS tests in idle, the PN emissions of China-6 compliant diesel vehicles with intact DPFs were notably lower than those from NG counterparts; some China-6 diesel vehicles with intact DPFs even had a low PN emission concentration of less than 103#/cm3.
The urban, rural and motorway- integrated emissions of all PEMS-tested vehicles are plotted in Table A2 in Appendix A; their integrated PEMS results can be seen in Table A3 in Appendix A. Detailed analysis of the four types of heavy-duty vehicles tested is provided in Appendix B.
From the emission test results of the four types of vehicles mentioned above, it can be concluded that China-6 diesel vehicles with malfunctioning DPFs emitted 1–3 orders of magnitude higher PN emissions than the proper counterparts. PN emissions from China-6 vehicles with failure DPFs were at a similar level to those from China-5 vehicles without DPFs. Idle PN tests using a low-cost CPC system were further performed on the vehicles with malfunctioning DPFs, as given in Figure 5. Volumetric PN concentrations of these vehicles were 1–2 orders of magnitude higher than the proper ones and higher than the ambient air. This contrast between proper and malfunctioning vehicles creates a solid fundament to pick out high emitters with DPF failure with an easier procedure, wider scenarios, and lower prices.

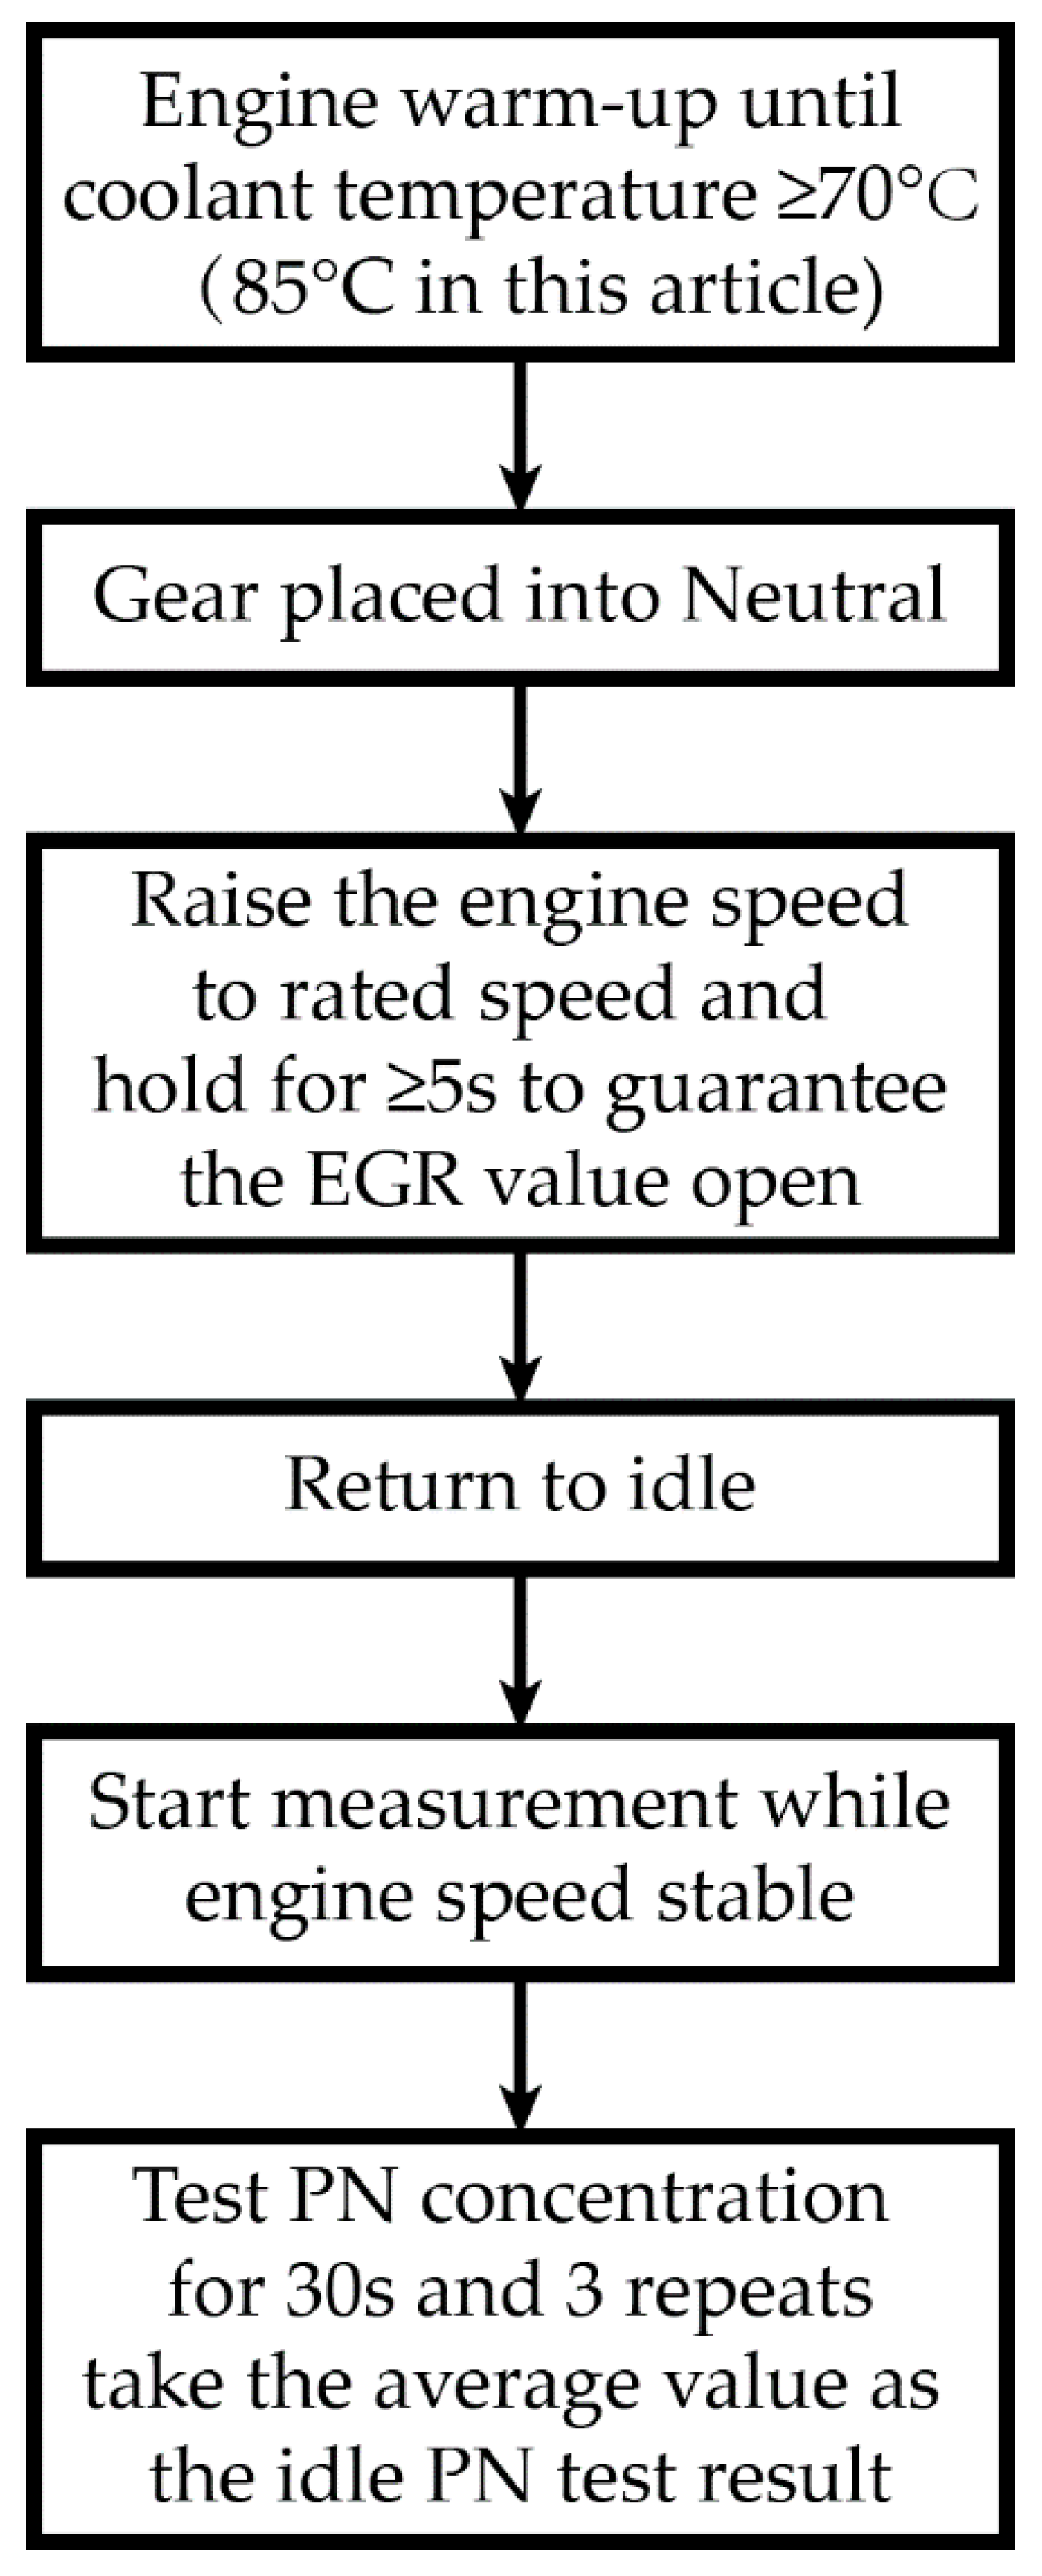
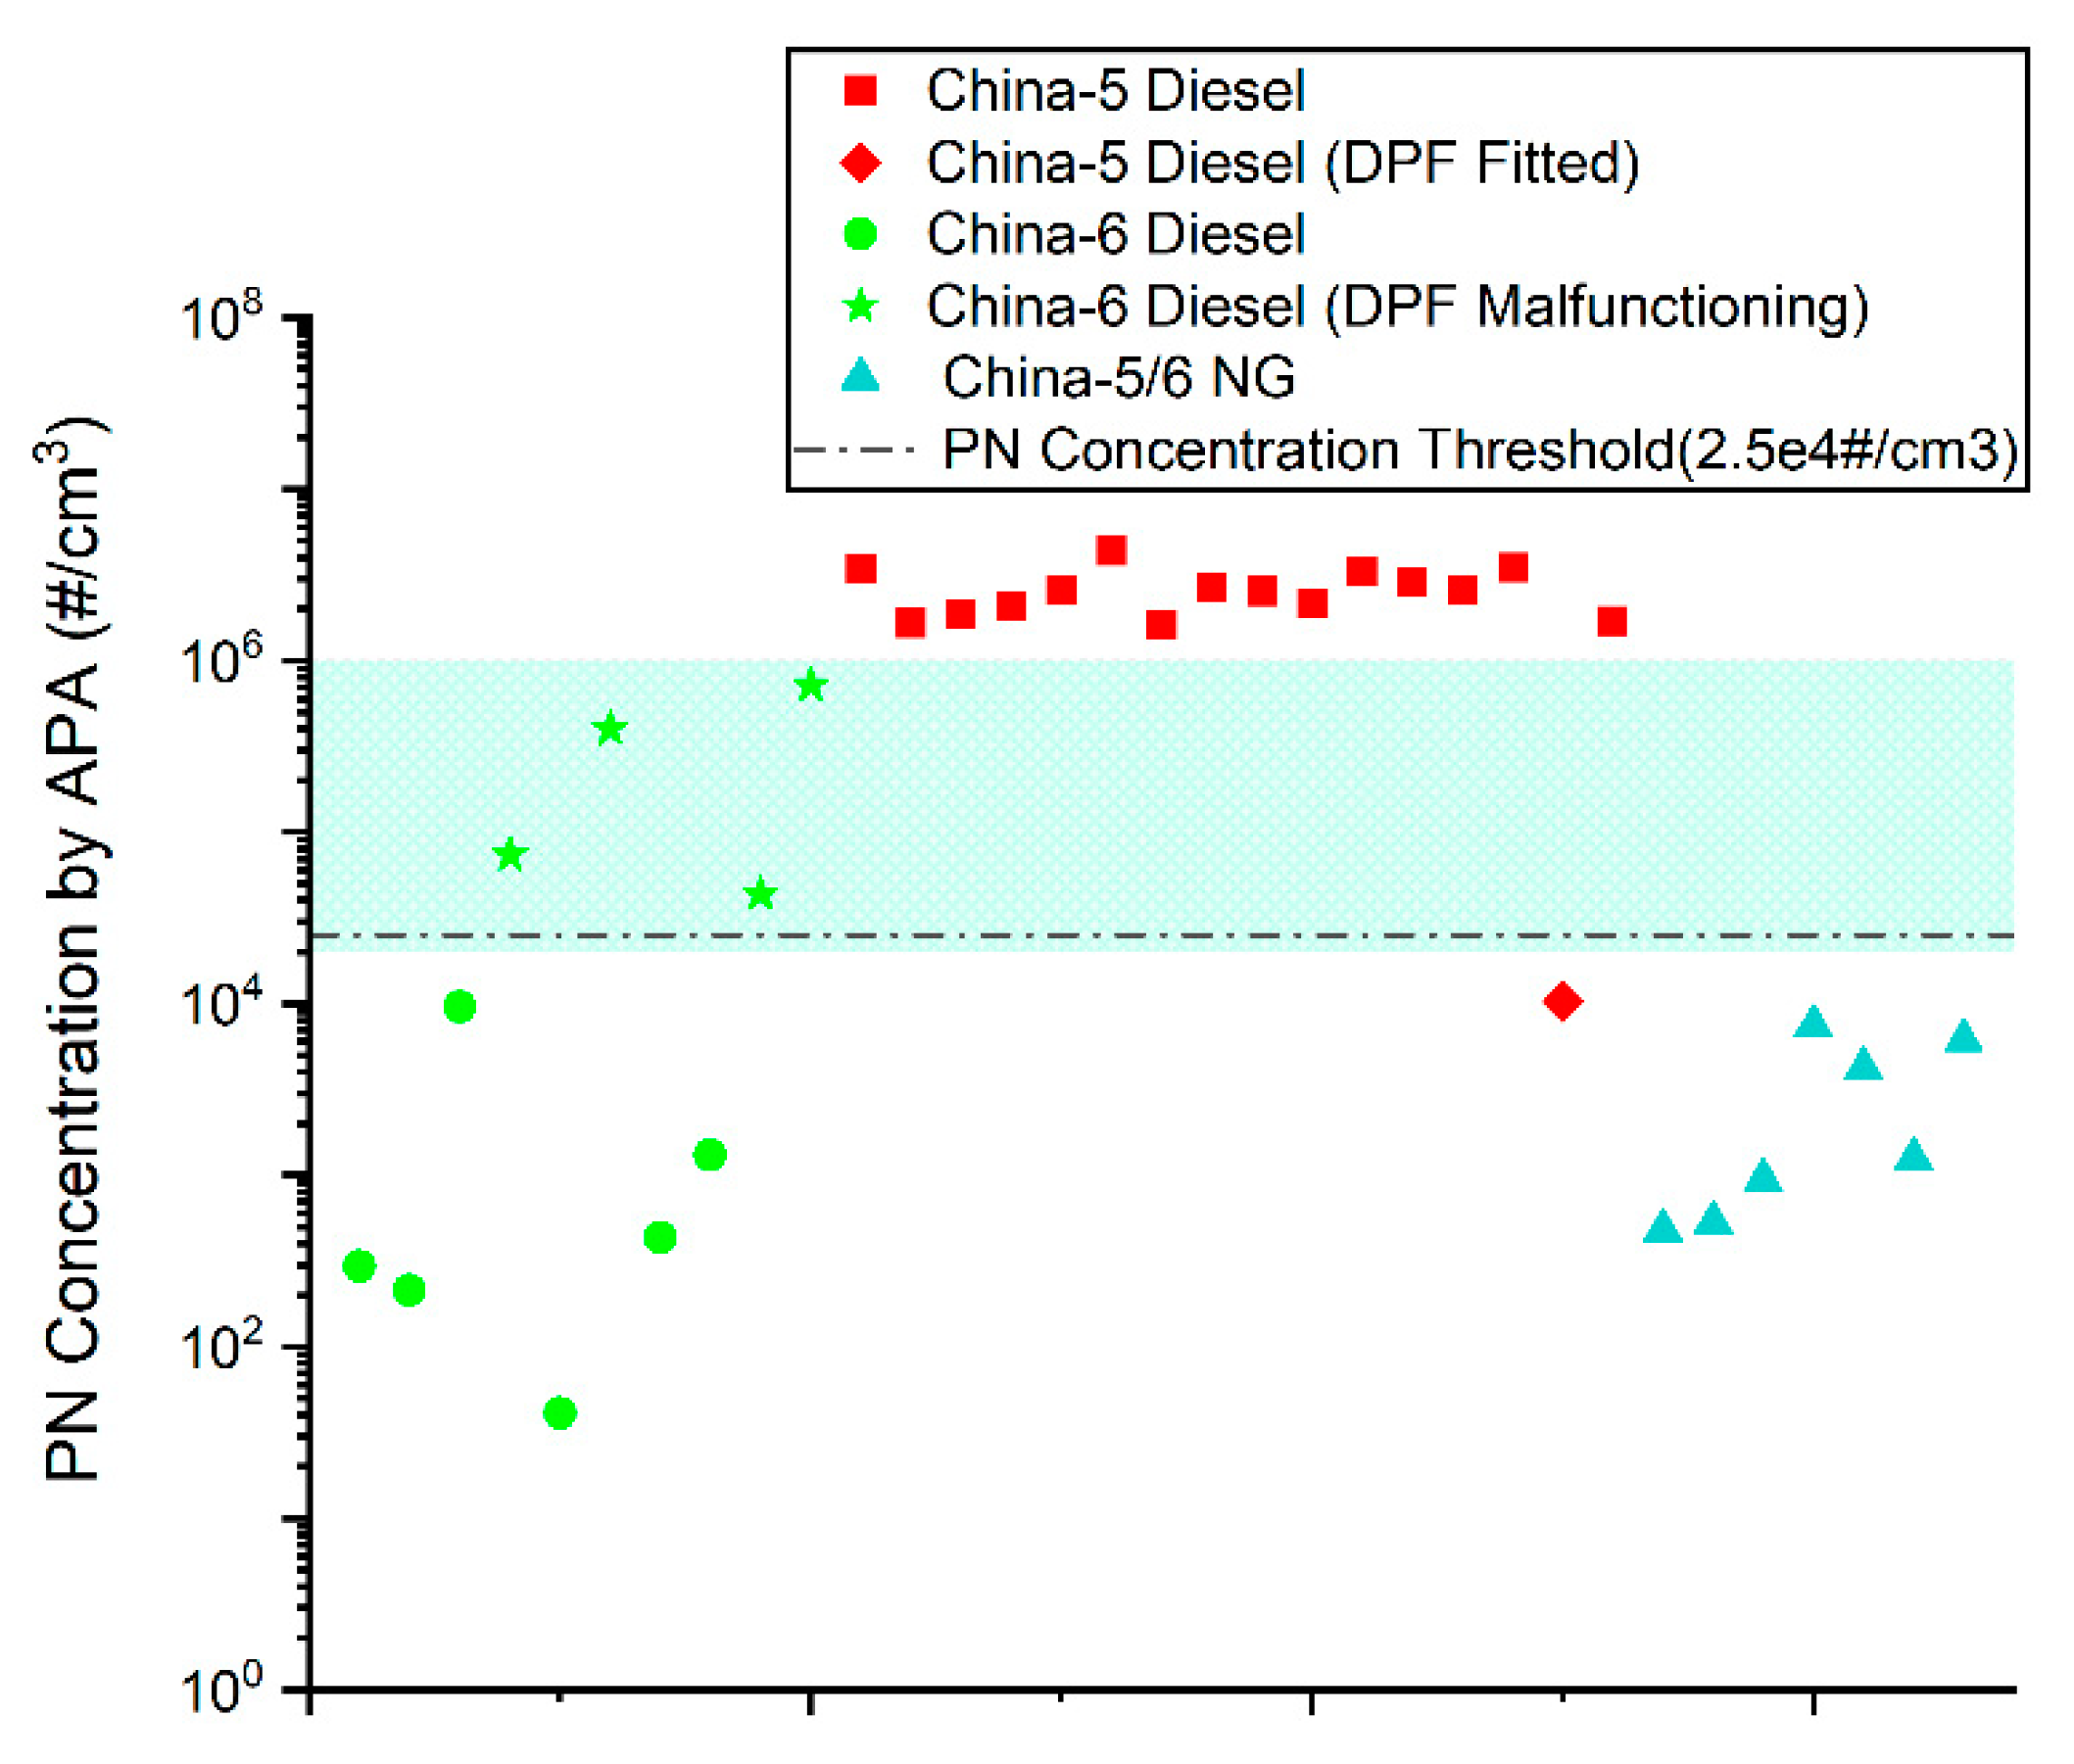
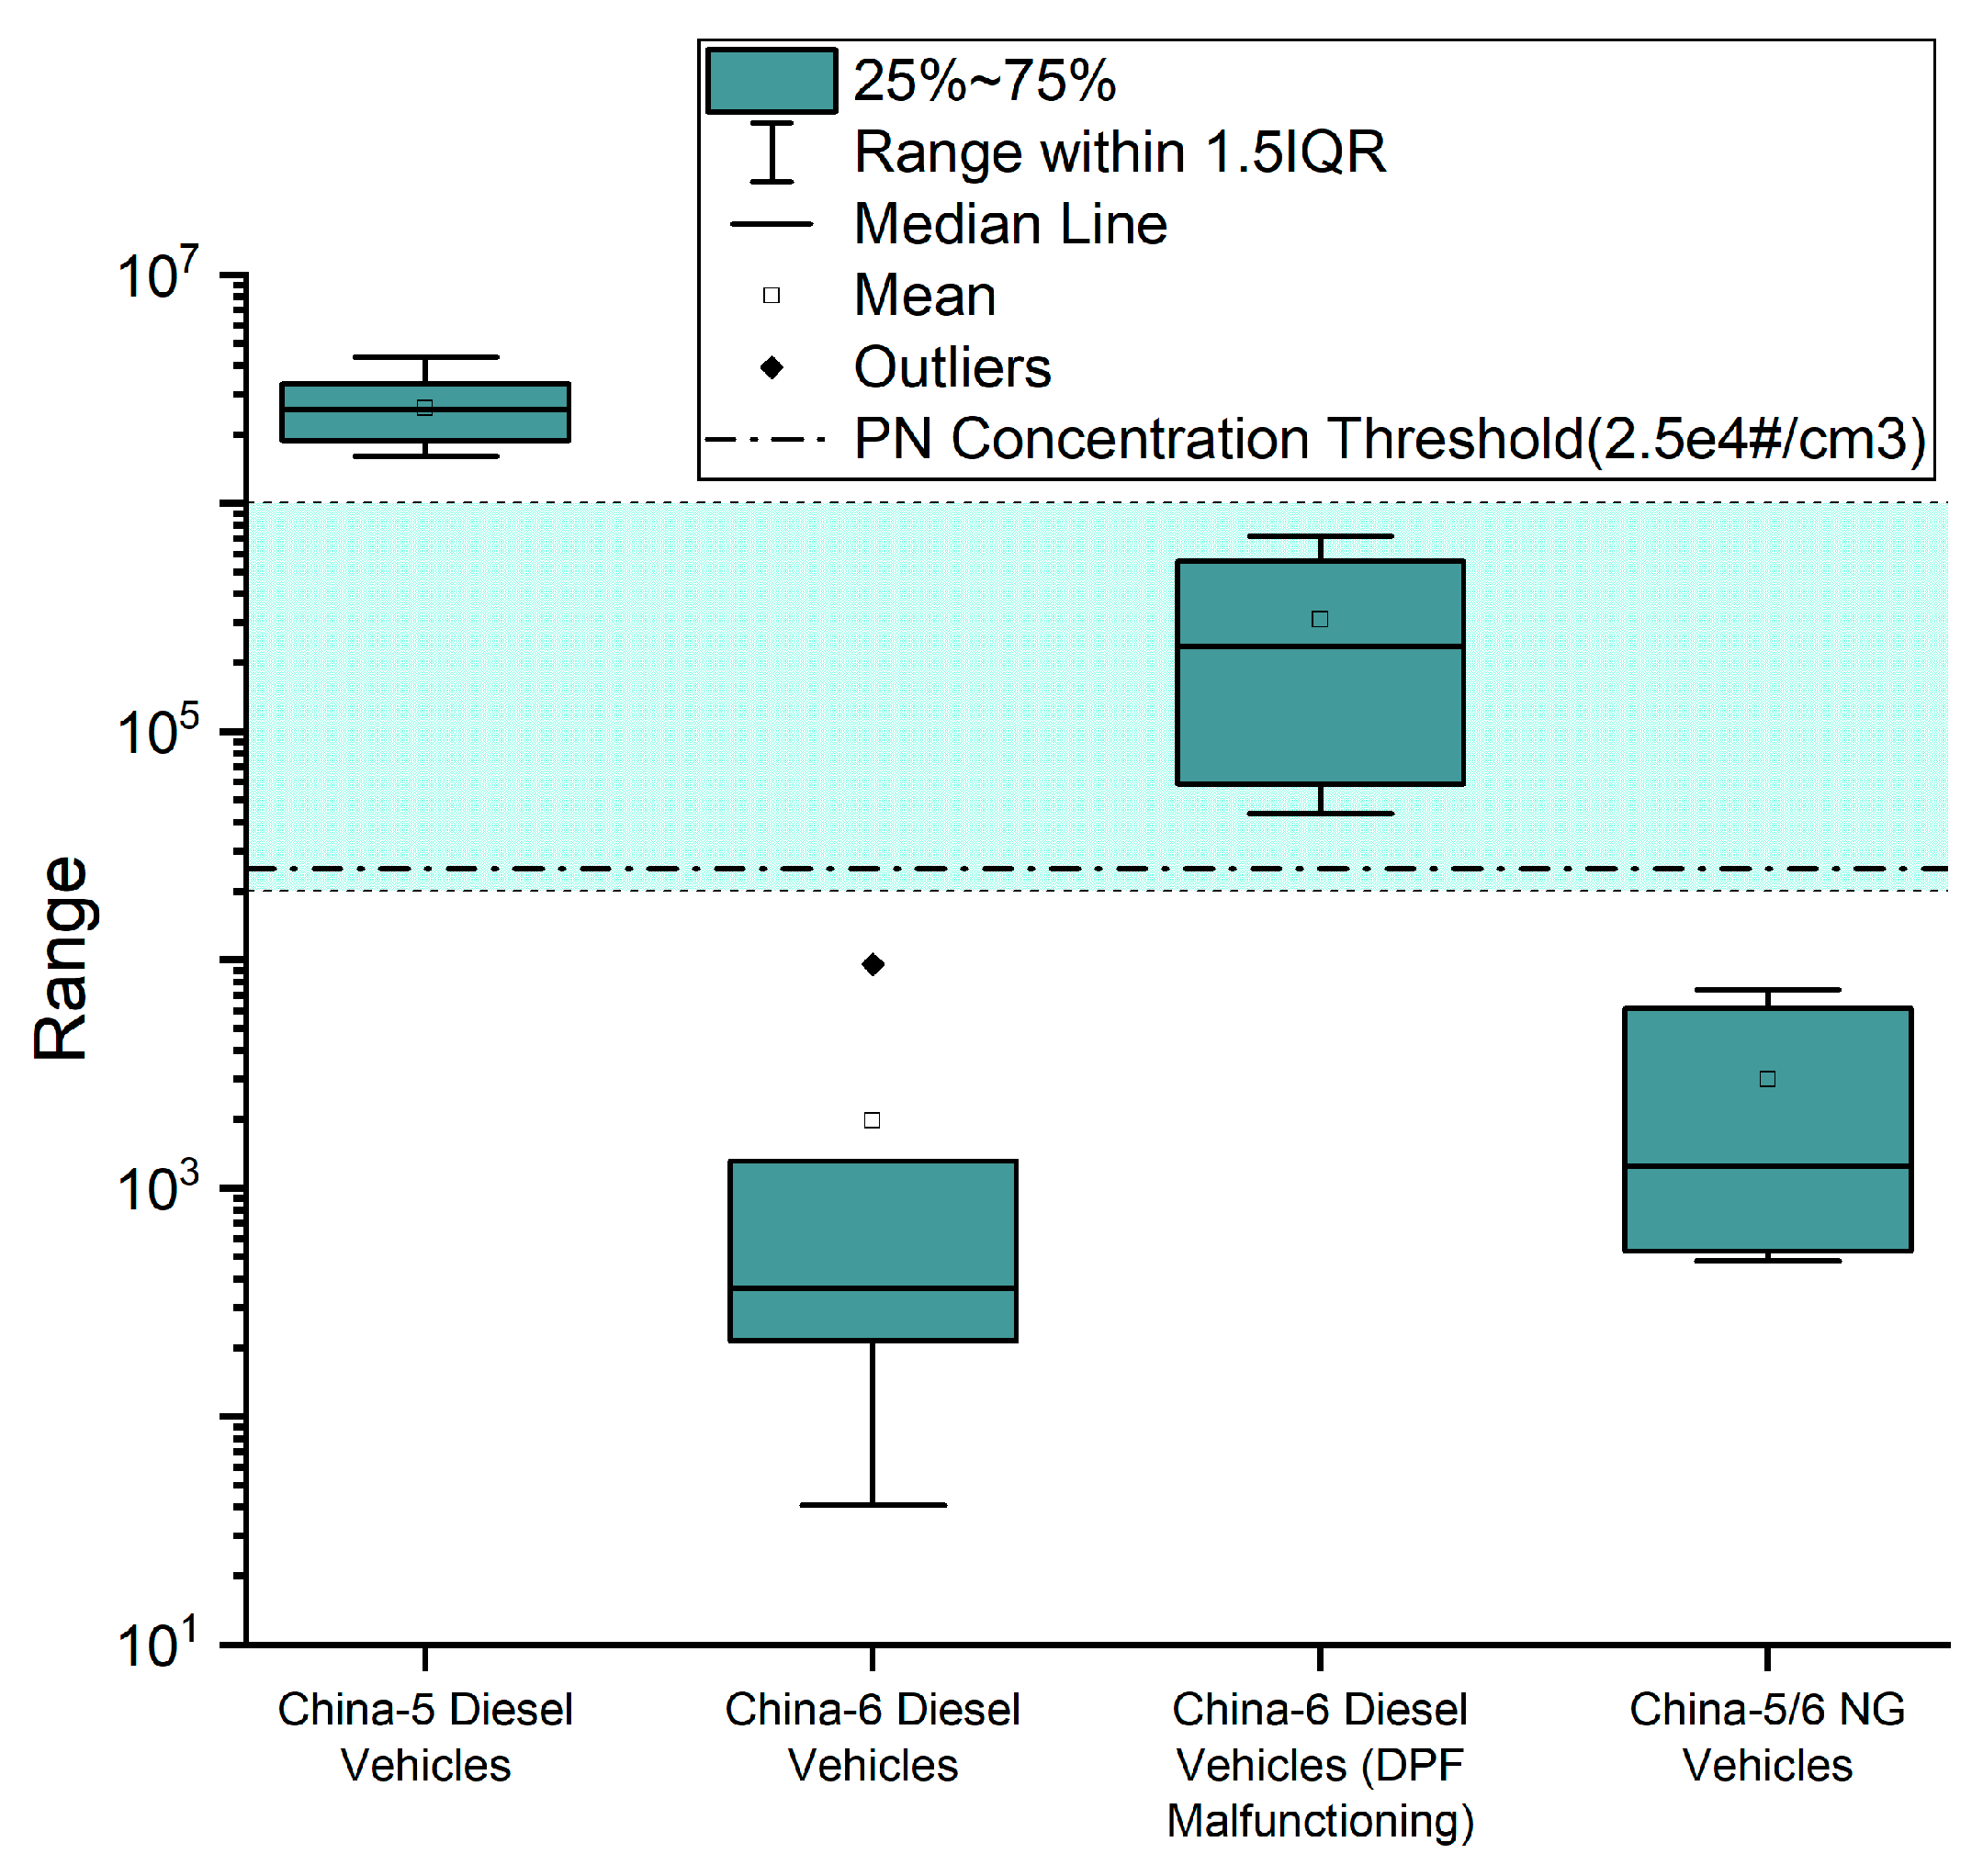
3.2. Results of Idle PN Concentration Tests

Figure 5 shows the idle PN concentration test results of the 33 test vehicles using a low-cost CPC system; the results of PN-PEMS tests for selected vehicles are shown in Table A3 in Appendix A.
In Figure 6, the idle PN test results of diesel and NG vehicles with and without DPF failures are grouped and subject to a statistical analysis. Since there was only one China-5 diesel vehicle equipped with DPF, which is specifically designed for the Beijing market, this category is not presented in Figure 6.
From Figure 5 and Figure 6, it is obvious that the idle PN emissions of the tested China-5 diesel vehicles were very close (except the one equipped with DPF), while idle PN emissions of the tested China-5/6 NG vehicles were at a similar level. As for the tested China-6 diesel vehicles, most of them were found with intact DPFs, their idle PN emissions were close to China-5/6 NG vehicles; however, there were four vehicles whose DPFs were malfunctioning (all have been confirmed with PEMS and professional diagnosis), and their idle PN emission level was significantly higher than those with intact DPFs.
As shown in Figure 6, from 1 × 10⁴ to 1 × 10⁶#/cm3, there was a channel traversing between the upper range of proper China-6 diesel, which was also close to the upper range of China-5/6 NG, and the bottom line of China-5 diesel. The presence of such a channel creates a solid basis for the possible identification of non-major DPF damages with idle PN tests using low-cost CPC systems. It can be also noticed in Figure 5 that one proper China-6 diesel and the DPF-fitted China-5 diesel reported idle PN results around 1 × 10⁴#/cm3, inferring the necessity of reserving a security margin when setting the PN threshold for suspected DPF failure. To balance the risk of misjudgment and the cost-benefit ratio of the method, it is recommended to set the PN threshold to no lower than 2.5 × 10⁴#/cm3; a phase-in strategy could be considered.
Undoubtedly, the lower the PN threshold, the greater chance to screen out high-emitters and to forbid tampering. However, at its initial stage, the PN threshold is not essentially stringent, with the very complicated status quo of in-service vehicles being a constraint. A comparison between the heavy-duty vehicles in China, which, at the moment, seems more promising to be idle PN tested, and the proposed value of 2.5 × 10⁵#/cm3 for light-duty vehicles in the EU member states will help elaborate this. In China, DPFs on heavy-duty vehicles first became unavoidable with the implementation of China-6. Apart from the low number of vehicles that participated in the retrofit programs encouraged by some local governments, DPF is not presented on most in-service vehicles. The big gap between the PN emissions with and without DPF allows for a stricter PN threshold. In contrast, the case of PTI for light-duty vehicles in the EU is more difficult; the enrollment of DPFs could at least date back to Euro-5. Complicated technical pathways and long service time for some of the potentially affected vehicles will exacerbate the difficulty of setting a strict threshold and its future implementation.
Similar to the implementation experience of remote sensing detection (RSD), a PN threshold capable of picking out the dirtiest 10% or 20% of vehicles from the fleet will be largely successful, because a majority of emissions from road vehicles are attributed to this small group of preservation.

4. Conclusions

In this article, both PEMS tests in accordance with heavy-duty China-6 regulations and idle PN emission tests using a low-cost CPC system were performed on 33 China-5/6 diesel and NG-fueled vehicles to validate the feasibility of prompting a simple and quick procedure to use idle PN tests to screen out vehicles with DPF malfunction from in-use fleets. The following conclusions were attained.
  • PN emissions from China-6 heavy-duty diesel vehicles with malfunctioning DPFs were 1–3 orders of magnitude higher than those of the proper counterparts, which were at a similar level to those from China-5 heavy-duty diesel vehicles without DPFs;
  • PN emission levels of the tested China-6 heavy-duty NG vehicles were close to those of China-6 diesel vehicles with proper DPFs.
  • In idle PN concentration, there was a gap between the level of the tested China-6 diesel vehicles with proper DPFs and the level of idle PN concentration of tested China-5 diesel vehicles.
  • Idle PN concentrations of DPF-malfunctioning China-6 heavy-duty vehicles were 1–2 orders of magnitude higher than the proper ones and China-5/6 heavy-duty NG vehicles, and they distributed in this region.
Based on the experimental results, it is practical to identify malfunctioning DPFs of China-6 heavy-duty diesel vehicles by measuring idle PN emissions using a low-cost CPC system; it is recommended to set the idle PN threshold for suspected DPF damages to no smaller than 2.5 × 10⁴#/cm3.

Author Contributions

Conceptualization, Z.G. and W.Z.; methodology, Z.G.; software, Z.G.; validation, inves-tigation and experiment, Z.G., L.L. and Z.Z.; data curation, Z.Z.; writing—original draft preparation, Z.G.; writing—review and editing, Z.G.; supervision, W.Z.; project admin-istration, Z.G. All authors have read and agreed to the published version of the manuscript.

Funding

This research is sponsored by National Natural Science Foundation of China (Grant No. 52172337).

Institutional Review Board Statement

Not applicable.

Informed Consent Statement

Not applicable.

Data Availability Statement

Data available upon request from all the authors.

Conflicts of Interest

The authors declare no conflict of interest.

Abbreviations

BCBlack Carbon
CPCCondensation Particle Counter
DPFDiesel Particle Filter
DTCDiagnostic Trouble Code
ETEvaporation Tube
IPAIsopropanol
MILMalfunction Indicating Light
NGNatural Gas
PTIPeriodic Technical Inspection
OBDOn-Board Diagnostics
OBMOn-Board Monitoring
PEMSPortable Emissions Measurement System
PMParticle Mass
PNParticle Number
WHSCWorld Harmonized Stationary Cycle
WHTCWorld Harmonized Transient Cycle

Appendix A

Table A1. Basic information on PEMS tested vehicles.
Vehicle No.Emission StageAfter-TreatmentRated Power
(kW)
Peak Torque
(N·m)
Mileage
(km)
1China-5
(Diesel)
SCR206110030,463
2 DPF + SCR966003476
3SCR43016003742
4 China-6
(Diesel)
DPF + SCR41226203985
5 1366803712
6 341230030,822
7 341230046,626
8316200014,643
9316200015,810
10316200016,264
1134123005232
1234123006370
13316200018,171
14China-6
(LNG)
TWC289210017,1812
15289210063,438
After Treatment: DPF: diesel particulate filter; SCR: selective catalytic reduction; TWC: three-way catalytic converter. Remarks: Vehicle 2 is a DPF-fitted China-5 vehicle designed to meet the specific requirements of Beijing. However, its DPF is not so efficient as that of China-6 vehicles. Vehicle 4, 5, 6 and 7 has malfunctioning DPFs.
Table A2. Urban, rural and highway integrated emissions of all PEMS-tested vehicles.
Vehicle No.Average PN Emission Rate by Total Mileage
#/km
Average PN Emission Rate by Total Work
#/kWh
UrbanRuralHighwayUrbanRuralHighway
12.45 × 10132.82 × 10132.93 × 10157.55 × 10146.26 × 10142.45 × 1013
2 1.73 × 10113.11 × 10116.02 × 10114.35 × 10117.41 × 10111.73 × 1011
32.66 × 10132.98 × 10133.32 × 10131.48 × 10131.76 × 10132.66 × 1013
4 3.21 × 10132.85 × 10131.54 × 10131.64 × 10131.66 × 10133.21 × 1013
5 1.07 × 10124.72 × 10126.43 × 10112.04 × 10126.92 × 10121.07 × 1012
6 2.76 × 10132.97 × 10134.60 × 10132.06 × 10131.91 × 10132.76 × 1013
7 1.83 × 10123.34 × 10123.58 × 10121.36 × 10121.74 × 10121.83 × 1012
83.92 × 10106.72 × 10102.13 × 1093.13 × 10104.84 × 10103.92 × 1010
96.16 × 10106.87 × 10102.52 × 10105.19 × 10105.18 × 10106.16 × 1010
106.55 × 10107.98 × 10105.60 × 1095.87 × 10106.63 × 10106.55 × 1010
115.25 × 10101.14 × 10113.71 × 10104.31 × 10108.31 × 10105.25 × 1010
122.84 × 10103.10 × 10116.81 × 10102.55 × 10101.86 × 10112.84 × 1010
131.06 × 10111.03 × 10113.39 × 10107.15 × 10107.98 × 10101.06 × 1011
141.12 × 10112.06 × 10105.04 × 1098.84 × 10101.55 × 10101.12 × 1011
154.70 × 10101.24 × 10102.44 × 10113.86 × 10109.67 × 1094.70 × 1010
Remarks: Vehicle 2 is a DPF-fitted China-5 vehicle designed to meet the specific requirements of Beijing. However, its DPF is not as efficient as that of China-6 vehicles. Vehicle 4, 5, 6 and 7 has malfunctioning DPFs.
Table A3. Idle PN and PN-PEMS testing results of selected testing vehicles.
Vehicle No.Emission StageAfter-
treatment
Idle PN Concentration Measured by APA
#/cm3
PN-PEMS
Results
#/kWh
Average PN Emission Rate by Total Mileage
#/km
Average PN Emission Rate by Total Work
#/kWh
Idle
PN Concentration by PEMS
(Standard Deviation)
#/cm3
1China-5
(Diesel)
SCR3.43 × 1062.58 × 10143.19 × 10134.44 × 10133.36 × 106
(2.10 × 10⁵)
2 DPF+SCR1.02 × 1042.57 × 10122.28 × 10116.11 × 10111.05 × 104
(2.69 × 10³)
3SCR1.70 × 1061.67 × 10143.22 × 10131.84 × 10131.58 × 106
(5.52 × 10⁵)
4 China-6
(Diesel)
DPF+SCR4.35 × 1047.57 × 10132.96 × 10131.64 × 10134.16 × 104
(3.35 × 10³)
5 7.13 × 1053.19 × 10133.38 × 10125.29 × 10126.98 × 105
(4.31 × 10⁴)
6 3.98 × 1056.38 × 10132.98 × 10132.07 × 10139.24 × 105
(8.79 × 10⁴)
7 7.36 × 1045.33 × 10122.34 × 10121.54 × 10127.02 × 104
(8.24 × 10³)
82.94 × 1023.50 × 10116.18 × 10104.53 × 10109.63 × 100
(1.31 × 10⁻¹)
92.14 × 1023.69 × 10116.15 × 10104.82 × 10102.12 × 100
(1.69 × 10⁻¹)
104.33 × 1024.41 × 10117.29 × 10106.16 × 10105.44 × 100
(2.70 × 10⁻¹)
119.54 × 1032.59 × 10111.08 × 10118.02 × 10103.35 × 102
(1.38 × 10²)
124.08 × 1013.42 × 10111.63 × 10111.11 × 10111.98 × 103
(2.11 × 10²)
131.31 × 1035.82 × 10119.55 × 10107.42 × 10101.60 × 101
(1.15 × 10⁻¹)
14China-6
(LNG)
TWC1.25 × 1032.52 × 10115.24 × 10104.17 × 10101.48 × 103
(9.44 × 101)
156.12 × 1033.51 × 10113.98 × 10103.06 × 10106.16 × 103
(6.20 × 101)
16China-5
(Diesel)
SCR1.88 × 106N/AN/AN/AN/A
172.07 × 10⁶N/AN/AN/AN/A
182.58 × 10⁶N/AN/AN/AN/A
194.37 × 10⁶N/AN/AN/AN/A
201.60 × 10⁶N/AN/AN/AN/A
212.69 × 10⁶N/AN/AN/AN/A
222.54 × 10⁶N/AN/AN/AN/A
232.14 × 10⁶N/AN/AN/AN/A
243.34 × 10⁶N/AN/AN/AN/A
252.88 × 10⁶N/AN/AN/AN/A
262.58 × 10⁶N/AN/AN/AN/A
273.49 × 10⁶N/AN/AN/AN/A
281.65 × 10⁶N/AN/AN/AN/A
29China-5/6
(LNG)
TWC4.79 × 102N/AN/AN/AN/A
305.31 × 10²N/AN/AN/AN/A
319.37 × 10²N/AN/AN/AN/A
327.40 × 10³N/AN/AN/AN/A
334.20 × 10³N/AN/AN/AN/A
Remarks: Vehicle 2 is a DPF-fitted China-5 vehicle designed to meet the specific requirements of Beijing. However, its DPF is not as efficient as that of China-6 vehicles. Vehicle 4, 5, 6 and 7 has malfunctioning DPFs.

Appendix B

Figure A1 plots the second-by-second PN concentration and vehicle speed as a function of time. For each vehicle, from left to right, there are overall status, fragment in acceleration and fragment in deceleration, respectively. From the above four types of heavy-duty vehicles, one representative vehicle of each type was selected for data analysis to acquire typical PN emission data of each type of vehicle. It can be observed in Figure A1 that idle PN concentrations measured with PEMS of all the four types of vehicles were 1–3 magnitudes lower than the PN concentrations measured when the test vehicles were moving. With a known DPF failure, the PN concentrations of China-6 diesel vehicles were at a similar level as China-5 diesel vehicles. In the entire test trip, the PN concentrations of both types of vehicles ranged from 104~108#/cm3, while the idle PN concentrations of China-6 diesel vehicles with intact DPFs were only roughly 100#/cm3. During most of the trip, the PN concentrations of China-6 diesel vehicles with proper DPFs were 1~2 magnitudes lower than China-5 and China-6 diesel vehicles with malfunctioning DPFs, the PN concentrations of China-6 NG vehicles were on the same order as China-6 diesel vehicles with intact DPFs.
Figure A1. The relationship between the PN concentration and speed over time of a typical test vehicle. (a) China-5 diesel vehicle; (b) China-6 diesel vehicles with malfunctioning DPFs; (c) China-6 diesel vehicles with intact DPFs; (d) China-6 NG vehicles.
Atmosphere 13 00268 g0a1aAtmosphere 13 00268 g0a1b
Figure A2 shows the instantaneous work-based PN emission and vehicle speed as a function of time for the four selected test vehicles. The dotted line in Figure A2 is the PN-PEMS cap (1.2 × 10¹²#/kWh). It is obvious that, for China-5 diesel vehicles and China-6 diesel vehicles with malfunctioning DPFs, the instantaneous PN emissions during most of the testing duration were in the range of 1012~1015#/kWh, the fluctuations were more pronounced than the normal vehicles, and the idle PN emissions were also relatively high; The instantaneous PN emission rate of China-6 diesel vehicles with intact DPFs and China-6 NG vehicles were below the WHTC limit of 1.2 × 10¹²#/kWh during most of the testing duration, which were 3~4 orders of magnitudes lower than China-5 diesel vehicles; in addition, their idle PN emissions were low.
According to Figure A1 and Figure A2, for vehicles without DPFs or with malfunctioning DPFs, in the vehicle starting period, the PN emissions grew with the acceleration of the vehicles. It was also observed that PN emission decreased as the test vehicle decelerated. However, for vehicles with intact DPFs, PN emissions showed no clear correlation with acceleration or deceleration. In a constant speed state, there was no clear relationship between PN emission and vehicle speed.
Figure A2. The relationship between the PN emission rate and speed over time of a typical test vehicle. (a) China-5 diesel vehicle; (b) China-6 diesel vehicles with malfunctioning DPFs; (c) China-6 diesel vehicles with intact DPFs; (d) China-6 NG vehicles.
Atmosphere 13 00268 g0a2
The correlation between work-specific PN emissions (#/kWh) calculated according to the work-based moving average window method and window number of the four types of vehicles is shown in Figure A3. As illustrated, it is evident that the work-specific PN emissions calculated with moving average window method at the beginning of the tests were markedly higher than those of the later work-based window. As a result of the relatively lower average speed in urban stage, the durations of work-based windows in the beginning were long; however, these windows contained frequent stop-and-goes and, therefore, PN spikes, resulting in high PN emissions in work-based windows. The PN emissions of China-5 diesel vehicles were at the level of 1013#/kWh, while, for China-6 diesel vehicles with intact DPFs, they were at the level of 1011#/kWh, two orders of magnitudes lower. The PN emissions of China-6 diesel vehicles with malfunctioning DPFs were again on the same order as those of China-5 diesel vehicles. In the whole test duration, the work-specific PN emissions of diesel vehicles remained at the same order of magnitude and decreased approximately linearly. As for China-6 NG vehicles, the work-specific PN emissions were at the same magnitude as those of China-6 diesel vehicles with intact DPFs.
Figure A3. The relationship between the work-based window PN emission and the power change with the window of a typical test vehicle. (a) China-5 diesel vehicle; (b) China-6 diesel vehicles with malfunctioning DPFs; (c) China-6 diesel vehicles with intact DPFs; (d) China-6 NG vehicles.
Atmosphere 13 00268 g0a3

References

  1. Thorsten, B.; Cutler, W. Reducing particulate emissions in gasoline engines. In Reducing Particulate Emissions in Gasoline Engines; SAE International: Warrendale, PA, USA, 2019. [Google Scholar]
  2. Kittelson, D.; Watts, W.; Johnson, J. Diesel Aerosol Sampling Methodology—CRC E-43, Final Report; Coordinating Research Council: Alpharetta, GA, USA, 2002. [Google Scholar]
  3. Kittelson, D.B. Engines and nanoparticles: A review. J. Aerosol Sci. 1998, 29, 575–588. [Google Scholar] [CrossRef]
  4. Giechaskiel, B.; Munoz-Bueno, R.; Rubino, L.; Manfredi, U.; Dilara, P.; De Santi, G. Particle Measurement Programme (PMP): Particle Size and Number Emissions before, during and after Regeneration Events of a Euro 4 DPF Equipped Light-Duty Diesel Vehicle; SAE Technical Paper 2007-01-1944; SAE International: Warrendale, PA, USA, 2007. [Google Scholar] [CrossRef]
  5. Alföldy, B.; Giechaskiel, B.; Hofmann, W.; Drossinos, Y. Size-distribution dependent lung deposition of diesel exhaust particles. J. Aerosol Sci. 2009, 40, 652–663. [Google Scholar] [CrossRef]
  6. Zoran, M.A.; Savastru, R.S.; Savastru, D.M.; Tautan, M.N. Assessing the relationship between surface levels of PM2.5 and PM10 particulate matter impact on COVID-19 in Milan, Italy. Sci. Total Environ. 2020, 738, 139825. [Google Scholar] [CrossRef] [PubMed]
  7. Bontempi, E. First data analysis about possible COVID-19 virus airborne diffusion due to air particulate matter (PM): The case of Lombardy (Italy). Environ. Res. 2020, 186, 109639. [Google Scholar] [CrossRef]
  8. Pope, C.A., 3rd; Burnett, R.T.; Thun, M.J.; Calle, E.E.; Krewski, D.; Ito, K.; Thurston, G.D. Lung cancer, cardiopulmonary mortality, and long-term exposure to fine particulate air pollution. JAMA 2002, 287, 1132–1141. [Google Scholar] [CrossRef] [Green Version]
  9. Brook, R.D.; Rajagopalan, S.; Pope, C.A., 3rd; Brook, J.R.; Bhatnagar, A.; Diez-Roux, A.V.; Holguin, F.; Hong, Y.; Luepker, R.V.; Mittleman, M.A.; et al. Particulate matter air pollution and cardiovascular disease: An update to the scientific statement from the American Heart Association. Circulation 2010, 121, 2331–2378. [Google Scholar] [CrossRef] [PubMed] [Green Version]
  10. Bond, T.C.; Doherty, S.J.; Fahey, D.W.; Forster, P.M.; Berntsen, T.; DeAngelo, B.J.; Flanner, M.G.; Ghan, S.; Kärcher, B.; Koch, D.; et al. Bounding the role of black carbon in the climate system: A scientific assessment. J. Geophys. Res. Atmos. 2013, 118, 5380–5552. [Google Scholar] [CrossRef]
  11. Ministry of Ecology and Environment of the People’s Republic of China. Limits and Measurement Methods for Emissions from Diesel Fueled Heavy-Duty Vehicles (CHINA-6); Ministry of Ecology and Environment of the People’s Republic of China: Beijing, China, 2018. [Google Scholar]
  12. Bergmann, M.; Kirchner, U.; Vogt, R.; Benter, T. On-road and laboratory investigation of low-level PM emissions of a modern diesel particulate filter equipped diesel passenger car. Atmos. Environ. 2009, 43, 1908–1916. [Google Scholar] [CrossRef]
  13. Li, J.; Ge, Y.; Wang, H.; Yu, C.; Yan, X.; Hao, L.; Tan, J. Effects of different diesel particulate filter on emission characteristics of in-use diesel vehicles. Energy Sources Part A Recovery Util. Environ. Eff. 2019, 41, 2989–3000. [Google Scholar] [CrossRef]
  14. Eisazadeh, H.; Ehteram, M.A.; Khazaee, I. Diffusion charging measurements on exhaust solid particle number and lung deposited surface area of compressed natural gas and diesel buses. Environ. Sci. Pollut. Res. 2020, 27, 16929–16939. [Google Scholar] [CrossRef]
  15. Bai, S.; Tang, J.; Wang, G.; Li, G. Soot loading estimation model and passive regeneration characteristics of DPF system for heavy-duty engine. Appl. Therm. Eng. 2016, 100, 1292–1298. [Google Scholar] [CrossRef]
  16. Kasai, Y.; Miwa, S.; Kuki, T.; Senda, K.; Ogura, Y. New Cordierite Diesel Particulate Filter Material for the Diesel Particulate—NOx Reduction System; SAE Technical Paper 2004-01-0953; SAE International: Warrendale, PA, USA, 2004. [Google Scholar] [CrossRef]
  17. Cordiner, S.; Mecocci, F.; Mulone, V.; Rocco, V. Particle Number Emissions: An Analysis by Varying Engine/Exhaust-System Design and Operating Parameters; SAE Technical Paper 2011-24-0170; SAE International: Warrendale, PA, USA, 2011. [Google Scholar] [CrossRef]
  18. Fujitani, Y.; Takahashi, K.; Fushimi, A.; Hasegawa, S.; Kondo, Y.; Tanabe, K.; Kobayashi, S. Particle number emission factors from diesel trucks at a traffic intersection: Long-term trend and relation to particle mass-based emission regulation. Atmos. Environ. X 2020, 5, 100055. [Google Scholar] [CrossRef]
  19. Yildiz, I.; Caliskan, H.; Mori, K. Effects of cordierite particulate filters on diesel engine exhaust emissions in terms of pollution prevention approaches for better environmental management. J. Environ. Manag. 2021, 293, 112873. [Google Scholar] [CrossRef] [PubMed]
  20. Giechaskiel, B.; Manfredi, U.; Martini, G. Engine Exhaust Solid Sub-23 nm Particles: I. Literature Survey. SAE Int. J. Fuels Lubr. 2014, 7, 950–964. [Google Scholar] [CrossRef]
  21. Levy, H.; Schwarzkopf, M.D.; Horowitz, L.; Ramaswamy, V.; Findell, K.L. Strong sensitivity of late 21st century climate to projected changes in short -lived air pollutants. J. Geophys. Res. 2008, 113. [Google Scholar] [CrossRef] [Green Version]
  22. Jacobson, M.Z. Strong radiative heating due to the mixing state of black carbon in atmospheric aerosols. Nature 2001, 409, 695–697. [Google Scholar] [CrossRef]
  23. Zhou, J.; Tie, X.; Yu, Y.; Zhao, S.; Li, G.; Liu, S.; Zhang, T.; Dai, W. Impact of the Emission Control of Diesel Vehicles on Black Carbon (BC) Concentrations over China. Atmosphere 2020, 11, 696. [Google Scholar] [CrossRef]
  24. Ma, C.; Wu, L.; Mao, H.-j.; Fang, X.-z.; Wei, N.; Zhang, J.-s.; Yang, Z.-w.; Zhang, Y.-j.; Lv, Z.-y.; Yang, L. Transient Characterization of Automotive Exhaust Emission from Different Vehicle Types Based on On-Road Measurements. Atmosphere 2020, 11, 64. [Google Scholar] [CrossRef] [Green Version]
  25. Smit, R.; Bainbridge, S.; Kennedy, D.; Kingston, P. A decade of measuring on-road vehicle emissions with remote sensing in Australia. Atmos. Environ. 2021, 252, 118317. [Google Scholar] [CrossRef]
  26. Boveroux, F.; Cassiers, S.; de Meyer, P.; Buekenhoudt, P.; Bergmans, B.; Idczak, F.; Jeanmart, H.; Verhelst, S.; Contino, F. Impact of Mileage on Particle Number Emission Factors for EURO5 and EURO6 Diesel Passenger Cars. Atmos. Environ. 2021, 244, 117975. [Google Scholar] [CrossRef]
  27. Guan, B.; Zhan, R.; Lin, H.; Huang, Z. Review of the state-of-the-art of exhaust particulate filter technology in internal combustion engines. J. Environ. Manag. 2015, 154, 225–258. [Google Scholar] [CrossRef] [PubMed]
  28. Giechaskiel, B.; Lähde, T.; Suarez-Bertoa, R.; Valverde, V.; Clairotte, M. Comparisons of Laboratory and On-Road Type-Approval Cycles with Idling Emissions. Implications for Periodical Technical Inspection (PTI) Sensors. Sensors 2020, 20, 5790. [Google Scholar] [CrossRef]
  29. Burtscher, H.; Lutz, T.H.; Mayer, A. A New Periodic Technical Inspection for Particle Emissions of Vehicles. Emiss. Control Sci. Technol. 2019, 5, 279–287. [Google Scholar] [CrossRef]
  30. Seiler, V.; Boeckmann, E.; Eilts, P. Performance of Undamaged and Damaged Diesel Particulate Filters; SAE Technical Paper 2008-01-0335; SAE International: Warrendale, PA, USA, 2008. [Google Scholar] [CrossRef]
  31. Dabhoiwala, R.; Johnson, J.; Naber, J. Experimental Study Comparing Particle Size and Mass Concentration Data for a Cracked and Un-Cracked Diesel Particulate Filter; SAE Technical Paper 2009-01-0629; SAE International: Warrendale, PA, USA, 2009. [Google Scholar] [CrossRef]
  32. Zhang, X.; Tennison, P.; Schram, T. 3D Numerical Study of Pressure Loss Characteristics and Soot Leakage Through a Damaged DPF. SAE Int. J. Fuels Lubr. 2009, 2, 590–604. [Google Scholar] [CrossRef]
  33. Malik, A.; Abdulhamid, H.; Pagels, J.; Rissler, J.; Lindskog, M.; Nilsson, P.; Bjorklund, R.; Jozsa, P.; Visser, J.; Spetz, A.; et al. A Potential Soot Mass Determination Method from Resistivity Measurement of Thermophoretically Deposited Soot. Aerosol Sci. Technol. 2011, 45, 284–294. [Google Scholar] [CrossRef] [Green Version]
  34. Ochs, T.; Schittenhelm, H.; Genssle, A.; Kamp, B. Particulate Matter Sensor for On Board Diagnostics (OBD) of Diesel Particulate Filters (DPF); SAE Technical Paper 2010-01-0307; SAE International: Warrendale, PA, USA, 2008. [Google Scholar] [CrossRef]
  35. Ntziachristos, L.; Fragkiadoulakis, P.; Samaras, Z.; Janka, K.; Tikkanen, J. Exhaust Particle Sensor for OBD Application; SAE Technical Paper 2011-01-0626; SAE International: Warrendale, PA, USA, 2011. [Google Scholar] [CrossRef]
  36. Sappok, A.; Ragaller, P.; Herman, A.; Bromberg, L.; Prikhodko, V.; Parks, J.; Storey, J. On-Board Particulate Filter Failure Prevention and Failure Diagnostics Using Radio Frequency Sensing. SAE Int. J. Engines 2017, 10, 1667–1682. [Google Scholar] [CrossRef]
  37. Maricq, M.M.; Bilby, D. The impact of voltage and flow on the electrostatic soot sensor and the implications for its use as a diesel particulate filter monitor. J. Aerosol Sci. 2018, 124, 41–53. [Google Scholar] [CrossRef]
  38. Bémer, D.; Subra, I. Monitoring particle emission for non-road diesel machineries equipped with particulate filters. J. Aerosol Sci. 2017, 113, 153–165. [Google Scholar] [CrossRef]
  39. Fleischman, R.; Amiel, R.; Czerwinski, J.; Mayer, A.; Tartakovsky, L. Buses retrofitting with diesel particle filters: Real-world fuel economy and roadworthiness test considerations. J. Environ. Sci. 2018, 67, 273–286. [Google Scholar] [CrossRef] [PubMed]
  40. Melas, A.; Selleri, T.; Suarez-Bertoa, R.; Giechaskiel, B. Evaluation of Solid Particle Number Sensors for Periodic Technical Inspection of Passenger Cars. Sensors 2021, 21, 8325. [Google Scholar] [CrossRef]
  41. Yamada, H. Improving Methodology of Particulate Measurement in Periodic Technical Inspection with High-Sensitivity Techniques: Laser Light Scattering Photometry and Particle Number Method. Emiss. Control Sci. Technol. 2019, 5, 37–44. [Google Scholar] [CrossRef]
  42. Giechaskiel, B.; Lahde, T.; Suarez-Bertoa, R.; Clairotte, M.; Grigoratos, T.; Zardini, A.; Perujo, A.; Martini, G. Particle number measurements in the European legislation and future JRC activities. Combust. Engines 2018, 174, 3–16. [Google Scholar] [CrossRef]
  43. Valverde, V.; Mora, B.A.; Clairotte, M.; Pavlovic, J.; Suarez-Bertoa, R.; Giechaskiel, B.; Astorga-LLorens, C.; Fontaras, G. Emission Factors Derived from 13 Euro 6b Light-Duty Vehicles Based on Laboratory and On-Road Measurements. Atmosphere 2019, 10, 243. [Google Scholar] [CrossRef] [Green Version]
  44. Haralampous, O.; Mastrokalos, M.; Tzorbatzoglou, F.; Dritselis, C. Experimental and Computational Investigation of Particle Filtration Mechanisms in Partially Damaged DPFs. SAE Int. J. Adv. Curr. Prac. Mobil. 2020, 2, 681–691. [Google Scholar] [CrossRef]
  45. Lv, L.; Ge, Y.; Ji, Z.; Tan, J.; Wang, X.; Hao, L.; Wang, Z.; Zhang, M.; Wang, C.; Liu, H. Regulated emission characteristics of in-use LNG and diesel semi-trailer towing vehicles under real driving conditions using PEMS. J. Environ. Sci. 2020, 88, 155–164. [Google Scholar] [CrossRef] [PubMed]
  46. Jarosinski, W.; Wiśniowski, P. Verifying the Efficiency of a Diesel Particulate Filter Using Particle Counters with Two Different Measurements in Periodic Technical Inspection of Vehicles. Energies 2021, 14, 5128. [Google Scholar] [CrossRef]
  47. Beatrice, C.; di Iorio, S.; Guido, C.; Napolitano, P. Detailed characterization of particulate emissions of an automotive catalyzed DPF using actual regeneration strategies. Exp. Therm. Fluid Sci. 2012, 39, 45–53. [Google Scholar] [CrossRef]
  48. Yamada, H. PN Emissions from Heavy-Duty Diesel Engine with Periodic Regenerating DPF. SAE Int. J. Engines 2013, 6, 1178–1189. [Google Scholar] [CrossRef]
  49. Dwyer, H.; Ayala, A.; Zhang, S.; Collins, J.; Huai, T.; Herner, J.; Chau, W. Emissions from a diesel car during regeneration of an active diesel particulate filter. J. Aerosol Sci. 2010, 41, 541–552. [Google Scholar] [CrossRef]
Figure 1. Filtration mechanism of DPF.
Atmosphere 13 00268 g001
Figure 2. Flow diagram of (a) low cost CPC: APA and (b) CPC detector.
Atmosphere 13 00268 g002
Figure 3. Procedures of idle PN tests.
Atmosphere 13 00268 g003
Figure 4. PN emission and idle PN concentration measured by PEMS test. (a) Average PN emission rate by total mileage; (b) Average PN emission rate by total work; (c) 90% window PN emission rate; (d) Average idle PN concentration.
Atmosphere 13 00268 g004
Figure 5. Result of idle PN concentration measurement.
Atmosphere 13 00268 g005
Figure 6. Distribution characteristics of the results of tested vehicles.
Atmosphere 13 00268 g006
Table 1. Specifications of CPC detector.
SpecificationsValue
Response Time (t10t90)<5 s
Zero Check<2#/cm3 30 s average when sampling HEPA filtered air
(>99.995% filter efficiency with ambient background concentration < 2 × 10⁴#/cm3)
Resolution1#/cm3
Accuracy (Laboratory Test)±15% relative or ±40#/cm3 absolute, whichever is greater
(Monodisperse 70 nm)
Repeatability (Laboratory Test)3 Repeats 30 s average data ±10% @1 × 10³–2 × 10⁴#/cm3
(Monodisperse 70 nm)
Linearity (Laboratory Test)R2 > 0.95 For Entire Concentration Range
Intercept < 0.5% of Full Scale
Minimum 6 points between 0 and 2 × 10⁴#/cm3
(Monodisperse 70 nm)
Efficiency (Laboratory Test)Monodisperse Counting Efficiencies @1 × 10³–2 × 10⁴#/cm3
10 nm < 0.80
23 nm 0.75–1.05
41 nm 0.85–1.15
50 nm 0.85–1.15
80 nm 0.85–1.15
100 nm 0.85–1.15
200 nm 0.85–1.15
Publisher’s Note: MDPI stays neutral with regard to jurisdictional claims in published maps and institutional affiliations.

