Article

Transpiration of a Tropical Dry Deciduous Forest in Yucatan, Mexico

by
Evelyn Raquel Salas-Acosta
1,
José Luis Andrade
2,
Jorge Adrián Perera-Burgos
1,
Roberth Us-Santamaría
2,
Bernardo Figueroa-Espinoza
3,
Jorge M. Uuh-Sonda
4 and
Eduardo Cejudo
1,*
1
CONACYT—Centro de Investigación Científica de Yucatán, Unidad de Ciencias del Agua, Cancún 77500, Mexico
2
Centro de Investigación Científica de Yucatán, Unidad de Recursos Naturales, Mérida 97205, Mexico
3
Laboratorio de Ingeniería y Procesos Costeros, Instituto de Ingeniería, Universidad Nacional Autónoma de Mexico, Sisal 97355, Mexico
4
Departamento de Ciencias del Agua y Medio Ambiente, Instituto Tecnológico de Sonora, Obregón 85000, Mexico
*
Author to whom correspondence should be addressed.
Submission received: 21 December 2021 / Revised: 28 January 2022 / Accepted: 3 February 2022 / Published: 5 February 2022
(This article belongs to the Special Issue Vegetation and Climate Relationships)

Abstract

:
The study of forest hydrology and its relationships with climate requires accurate estimates of water inputs, outputs, and changes in reservoirs. Evapotranspiration is frequently the least studied component when addressing the water cycle; thus, it is important to obtain direct measurements of evaporation and transpiration. This study measured transpiration in a tropical dry deciduous forest in Yucatán (Mexico) using the thermal dissipation method (Granier-type sensors) in representative species of this vegetation type. We estimated stand transpiration and its relationship with allometry, diameter-at-breast-height categories, and previously published equations. We found that transpiration changes over time, being higher in the rainy season. Estimated daily transpiration ranged from 0.562 to 0.690 kg m–2 d–1 in the late dry season (April–May) and from 0.686 to 1.29 kg m–2 d–1 in the late rainy season (September–October), accounting for up to 51% of total evapotranspiration in the rainy season. These daily estimates are consistent with previous reports for tropical dry forests and other vegetation types. We found that transpiration was not species-specific; diameter at breast height (DBH) was a reliable way of estimating transpiration because water use was directly related to allometry. Direct measurement of transpiration would increase our ability to accurately estimate water availability and assess the responses of vegetation to climate change.

1. Introduction

A central aspect in the study of the hydrology of an area is the description of the water balance, which requires the identification of inputs, outputs, and changes in water reservoirs [1,2,3,4,5]. For water outputs, evapotranspiration is frequently the least accurate parameter because it is estimated indirectly through other variables such as rainfall, solar radiation, and sensible and latent heat, among others [6,7,8]. Each of these variables involves a certain degree of uncertainty associated with the measurement method and scale [9,10,11]. Evapotranspiration (ET), defined as the volume of water that goes from the liquid to the gaseous state, is one of the outputs in the water budget, comprising water evaporation (E) from surfaces and transpiration (T) from plants, controlled by solar radiation. ET represents a major contribution to water balance, with T representing between 45% and 77% of ET [12]. Occasionally, the water availability of an aquifer is estimated without evaluating ET or without explicitly specifying which variables were considered in the computation. These untraceable estimates, in addition to the lack of field data, may lead to inaccurate water availability figures, especially under modeled climate change scenarios [10]. Therefore, it is essential to have direct estimates of water outputs to obtain more precise water balances and budgets. These contributions may shed light on the role of vegetation in the water and energy exchange within ecosystems, particularly during periods of extreme conditions such as severe drought, in addition to its significance in forests facing global climate change.
Nowadays, eddy covariance has become a standard method to measure ET and is comparable to catchment-scale studies [13,14,15,16]. However, evapotranspiration partitioning also requires the use of other types of measurements (and models) [4,17]. To obtain reliable estimates of tree transpiration, plant physiology has contributed a methodology to measure the amount of water that moves across plant stems. Previous studies on plant transpiration showed that quantifying transpiration is complex because of the influence of multiple factors related to meteorology and vegetation structure [18,19,20,21]. Plant transpiration depends on water availability (in turn governed by precipitation and soil water content) and is triggered by solar radiation and air saturation deficit [4,22,23]. One convenient way of measuring plant transpiration is by using the thermal dissipation method, which quantifies the water that moves across the xylem using probes that measure thermal oscillations of the sap, providing estimates of sap flux per unit area [24,25,26,27].
Since ET varies widely among forest ecosystems [20,28], it is important to obtain direct measurements to estimate available water resources at local and regional scales. In Mexico, few studies have focused on the effect of plant transpiration on water budgets, which is essential to get accurate estimates of present-day and future water balances. Field studies that have measured sap flux using the thermal dissipation method in tropical forests in the Yucatan Peninsula estimated transpiration values ranging from 0.52 to 2.1 kg m–2 d–1 [29,30]. Unfortunately, those estimates have not been incorporated into official groundwater availability data [31] due to the difficulty of measuring transpiration directly and the limited instruments available for estimating ET. This information is key to deriving correct assessments of water resources for all economic activities, water fluxes in natural ecosystems, and the intensification of the hydrological cycle in response to climate change [10].
This study quantified transpiration in a tropical dry deciduous forest located at El Palmar reserve, Yucatan, Mexico, using the thermal dissipation method. To this end, we used sap flux measurements from individual trees to test three upscaling methods to the stand level, and then produce estimates of the water transpired by the tropical dry deciduous forest studied in two contrasting seasons. Sap flux measurements were performed during the late dry and late rainy seasons, for the results to be representative of the dry and wet seasons. These results will serve as a first approximation for transpiration, hydrological processes, and water balance in this type of forest.

2. Materials and Methods
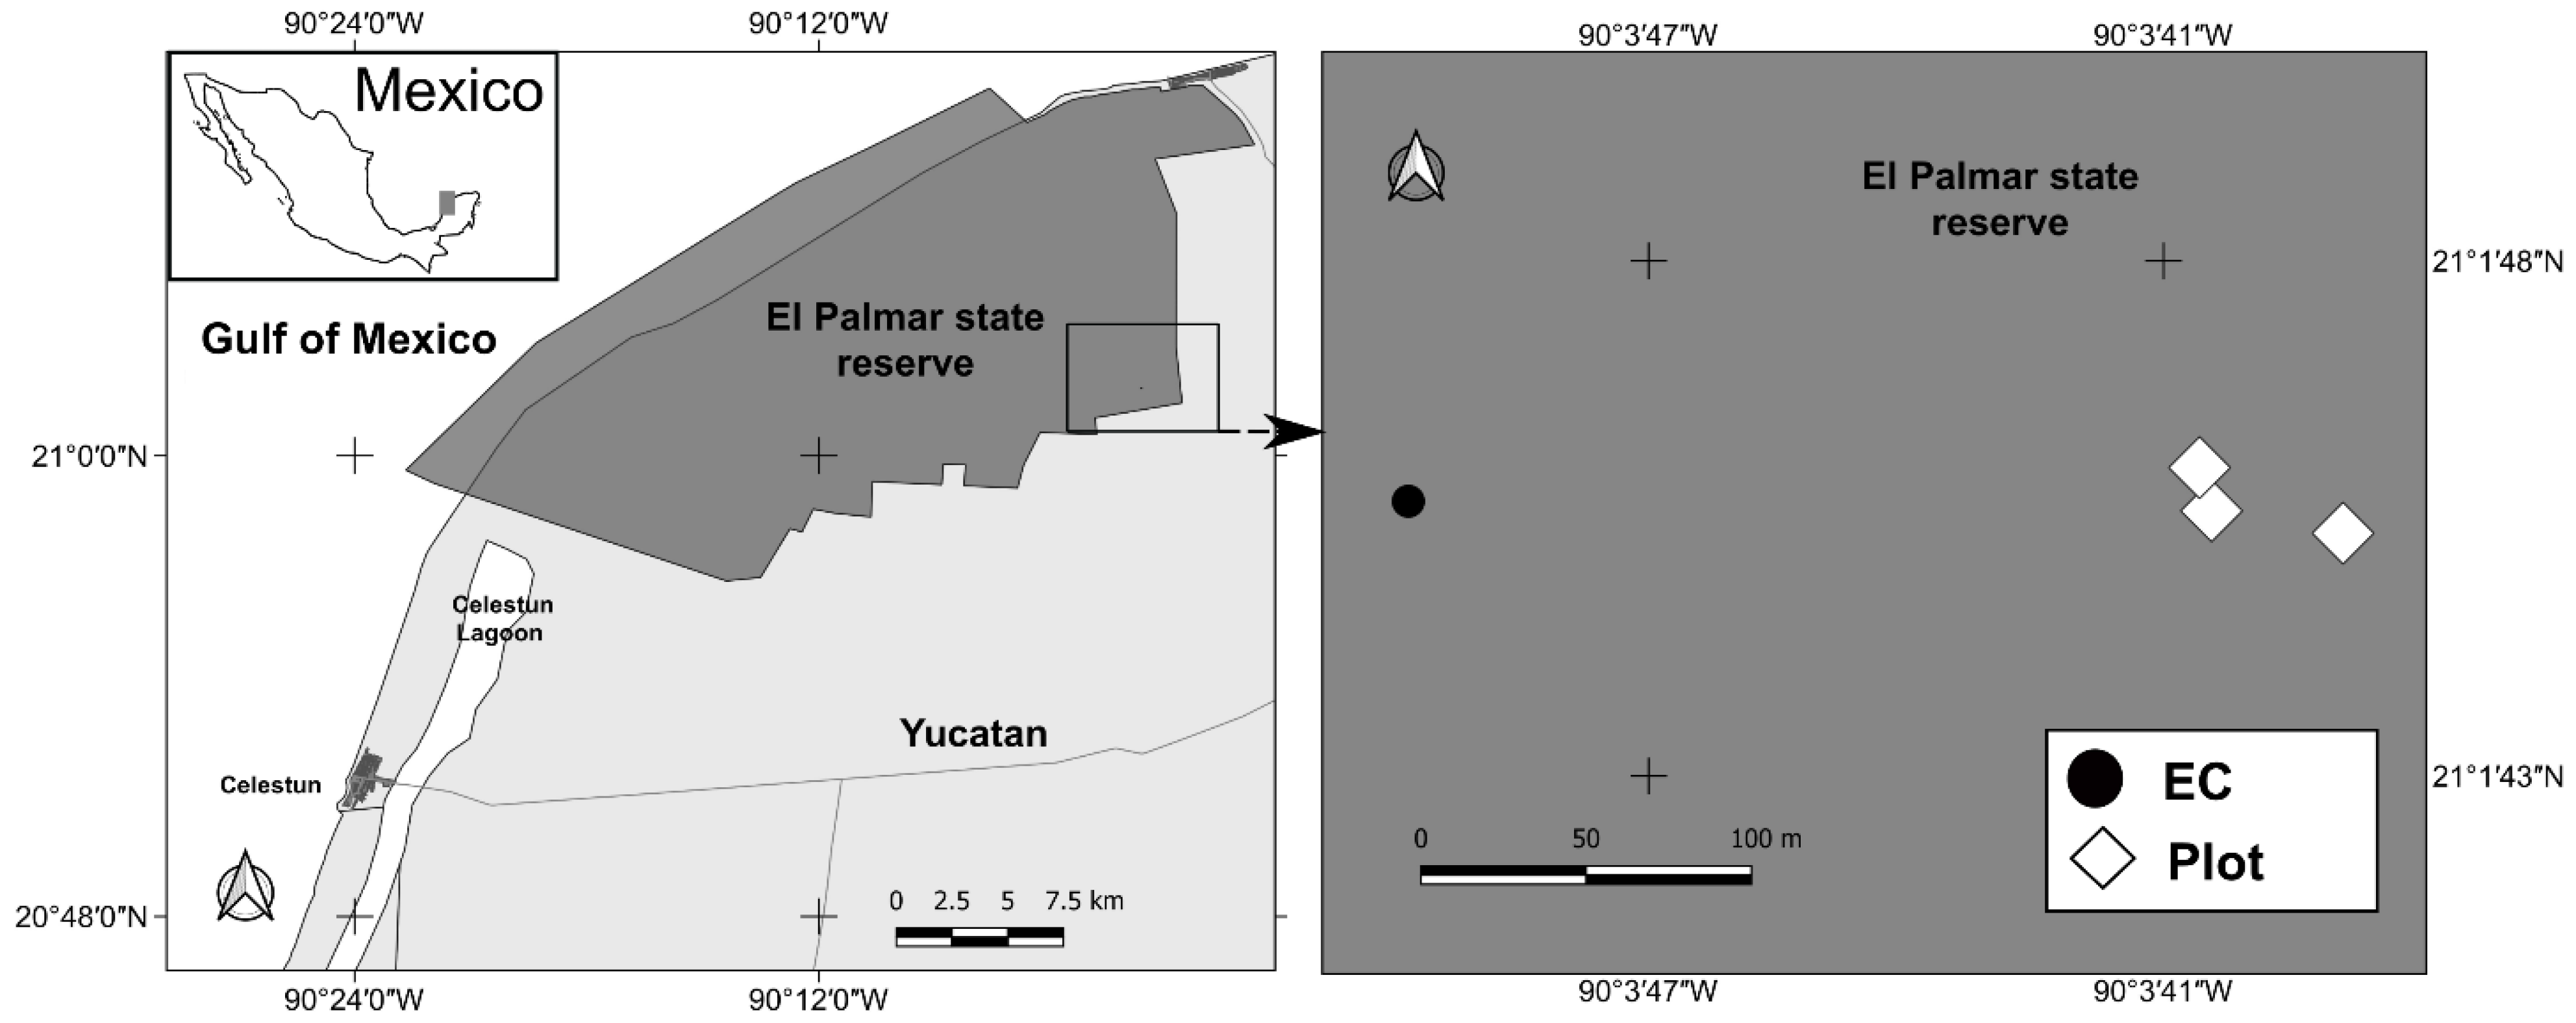
2.1. Study Area

The study was conducted in the tropical dry deciduous forest at the El Palmar state reserve located in the northwest of the Yucatan Peninsula (Figure 1). The local climate is warm semi-arid (BS1h´) according to Köppen’s climate classification, with a mean monthly temperature between 23.0 and 28.8 °C, and a mean annual precipitation of 561.1 mm, peaking in September, (100–240 mm) [31]. This ecosystem is characterized by a strong seasonality, where its phenology, productivity, and evapotranspiration are regulated by intra-annual variability of precipitation [32,33]. The dry and rainy seasons were defined according to historical (1950–2016) mean monthly precipitation data from six meteorological stations; based on this information, the dry season (precipitation <150 mm) spans from November to May, and the rainy season (precipitation >150 mm) from June to October. Our data were recorded at the end of the dry season (March–April 2019) and the end of the rainy season (September–October 2019; refer to Supplementary Figure S1).
The geomorphology of the region consists of karstic limestone; the soil belongs to the Leptosol type, a shallow soil (20–30 cm) with rocky outcrops and good drainage [34]. The type of vegetation that covers the study area is tropical dry deciduous forest [35]. Most trees are leafless during the warmest months of the dry season, i.e., from March to May. All tree species in the study area are of short stature, between 8 and 12 m high [36].

2.2. Environmental Conditions

Data on mean daily temperature (°C), humidity (%), maximum solar radiation (W m–2), and vapor pressure deficit (kPa) for the months when sap flux measurements were obtained (March–April and September–October 2019), which were recorded at a meteorological station located 15 km north of the study area, were downloaded from the UNAM Network of Atmospheric Observatories (RUOA) webpage for the UNAM Meteorological Station at Sisal Yucatan (21.1645 N, 90.0484 W, altitude 8 m a.s.l.; https://www.ruoa.unam.mx/index.php?page=estaciones&id=13, accessed on 1 November 2019).
The vapor pressure deficit (VPD) was calculated following Jones [22], using daily temperature and humidity data, with the following equations:
VPD = e s ( T ) e
where e and es(T) were calculated as:
e = R H × e S ( T )
e S ( T ) = f [ a b T c + T ]
The coefficients a, b and c are the following:
a = 611.21 ; b = 18.678 ( T 234.5 ) ; and c = 257.14 and f ≈ 1.000700035 Pa
Volumetric soil water content (SWC) was measured with a CS655 water content reflectometer (Campbell Scientific) in parallel with sap flux measurements. Mean values per season were obtained from measurements recorded on several days in each recording period (26 March to 12 April; 26 September to 17 October). SWC is expressed in percentage ([cm3 of water/cm3 of soil] × 100). We performed an analysis of variance to assess the significance of differences in temperature, radiation, relative humidity, and vapor pressure deficit (post-hoc Tukey-Kramer HSD, α = 0.01), and a t-test for comparing SWC between seasons, using the software JMP 5.1 (SAS Institute 2004).

2.3. Sap Flux

For sap flux measurements, tree individuals with a diameter >5 cm at 1.5 m from the ground (diameter at breast height, DBH) were selected from three plots of approximately 100 m2 within a cluster of 2200 m2 near the eastern side (~250 m), and within the zone of influence (hereafter footprint) of eddy covariance (EC) flux tower in the study area [32] (21°1′45.50′′ N, 90°3′49.30′′ W, Figure 1). Tree species were selected according to their importance value index (IVI), a tool used in ecology and forestry to determine the dominant species in a given area that is the sum of relative abundance (0–100%), relative dominance (0–100%), and relative frequency (0–100%) (Table 1), using a vegetation inventory previously produced for the study area [37].
Sap flux density (m3 m–2 h–1) was monitored during the late dry season (March–April 2019; 19 trees from 10 species) and the late rainy season (September–October 2019; 20 trees from 10 species) using custom-made Granier-type sensors [24,25]. Pairs of 30 mm-long, 2 mm-diameter temperature probes were affixed to the sapwood of tree stems (northern face); two sets of probes were inserted into the largest trunks (>15 cm DBH, facing north and south) and measurements were recorded over several days with consistent sap flux and constant irradiation were averaged to account for circumferential variation in sap flux. The upper probe was heated continuously with a constant power supply (0.2 W) while the bottom unheated probe (10 cm below) recorded the sapwood temperature. The protruding portions of both probes were insulated with a layer of foam surrounded by an outer shield of reflective material and transparent plastic. Probe temperatures were recorded continuously at 10-second intervals with dataloggers (CR10X, CR1000, and CR3000, Campbell Scientific, Logan, UT, USA), and 10-minute averages were downloaded. Sap flux was measured in two cycles of 5–7 continuous days, to cover a total of fifteen days in each season.
Sap flux density (Fd) was calculated from the difference in temperature between the probes using an empirical relationship developed by Granier [24] and rearranged by Lu et al. [27] as:
F d = 118.99 × 10 6 [ ( Δ T max Δ T ) / Δ T ] 1.231
where ΔTmax is the maximum difference in temperature between the heated and non-heated probes at zero flux, and ΔT is the difference in temperature between the heated and non-heated probe at the time of measurement. To avoid underestimating ΔTmax due to nighttime water movement, ΔTmax was determined as the maximum difference in temperature recorded over the entire measurement period per tree [27].
Mass sap flux was calculated by multiplying sap flux density by sapwood cross-sectional area. This was performed after completing the rainy season measurements in all individual trees with transpiration records. Sapwood cross-sectional area was determined by dye injections (0.1% indigo carmine) in cores from the main stem at DBH approximately, close to the probes. The dye was injected in 1/32’’ drilled holes; then, two cores were removed with a Pressler drill three cm above the dye injection site after 60 minutes, to allow the movement of stained sap. The cross-sectional area of the active xylem was calculated as follows:
A s w = π [ ( r T d B ) 2 ( r T d B d s w ) 2 ]
where Asw is sapwood area (cm2), rT is tree radius, dB is bark depth, and dsw is sapwood depth.

2.4. Estimation of Stand Transpiration

Sap flux data for the two contrasting seasons were used to estimate transpiration at the stand level in this tropical dry deciduous forest. For each season, clear days were selected by examining solar radiation data (see Table S2 and Figure S2). Mean sap flux (kg d–1) for clear days was calculated for the most important tree species (see Table 1). Once these values were obtained, transpiration data were scaled-up to the stand level. This is commonly achieved by determining the relationships between sap flux rates and diameter, basal area, or sapwood area [38]. We used three methods to extrapolate transpiration rates to stand transpiration per unit area: (1) allometric relationships; (2) DBH categories previously derived from plant physiology studies focused on transpiration [39,40,41]; and (3) using the method proposed by Bucci et al. [42]. The latter method considers the forest as a population of trees that regenerates naturally, with each forest displaying its own tree composition and structure that differentiates it from other tree populations [43].
In the first method, allometric relationships were explored by a linear correlation between DBH and transpiration (kg d–1), with all the species measured in each season. To note, trees were not pooled according to botanical families as previously reported by Reyes et al. [29], to prevent any biases or data misinterpretation arising from pooling; instead, we aimed to represent the ecosystem properties of the forest. DBH is the simplest measurement needed, which is obtained by measuring the tree circumference and applying the geometric equation for radium. It is an accessible and reliable approach for estimating transpiration in tropical dry forests for ecohydrological studies because water use is directly related to allometric scaling [39].
In the second method, four DBH categories were produced for all tree individuals within the cluster: 5–8.5 cm, 8.6–18.8 cm, 18.9–29 cm, and >29 cm (the greatest DBH was 36 cm). Transpiration was estimated from the mean transpiration for each category multiplied by the number of individuals within that category in the cluster (N) and then divided by the surface area of the cluster (2200 m2). Only the 5–8.5 cm category was not directly measured as stems were too thin (probes could not be affixed to slender trees); for this category, transpiration was estimated from the allometric relationships applied to all individuals in the plot.
The third method assumes that each individual contributes with a specific sap flux associated with its basal area, calculated using Bucci’s equation [42]:
E = ( F / B A i ) × ( Σ A B C N / A C N )
where F is the mean sap flux for all species, BAi is the mean basal area for individuals with sap flux measured, ΣABCN is the total basal area for the cluster, and ACN is the cluster area.

3. Results

3.1. Environmental Conditions

In the late rainy season, both temperature and relative humidity were higher than in the late dry season. Radiation was not different between seasons and the vapor pressure deficit was higher in the late dry season (Table 2; for the full dataset, refer to Table S2 and Figure S2).

3.2. Soil Water Content

Soil water content (SWC) was measured hourly during sap flux measurements in both seasons. In the late dry season, SWC was 4.44% (±0.34%, n = 404), a value almost half the SWC measured in the late rainy season, 9.69% (±2.65%, n = 502). The t-test between seasons yielded significant differences (t = 2.581, p < 0.0001).

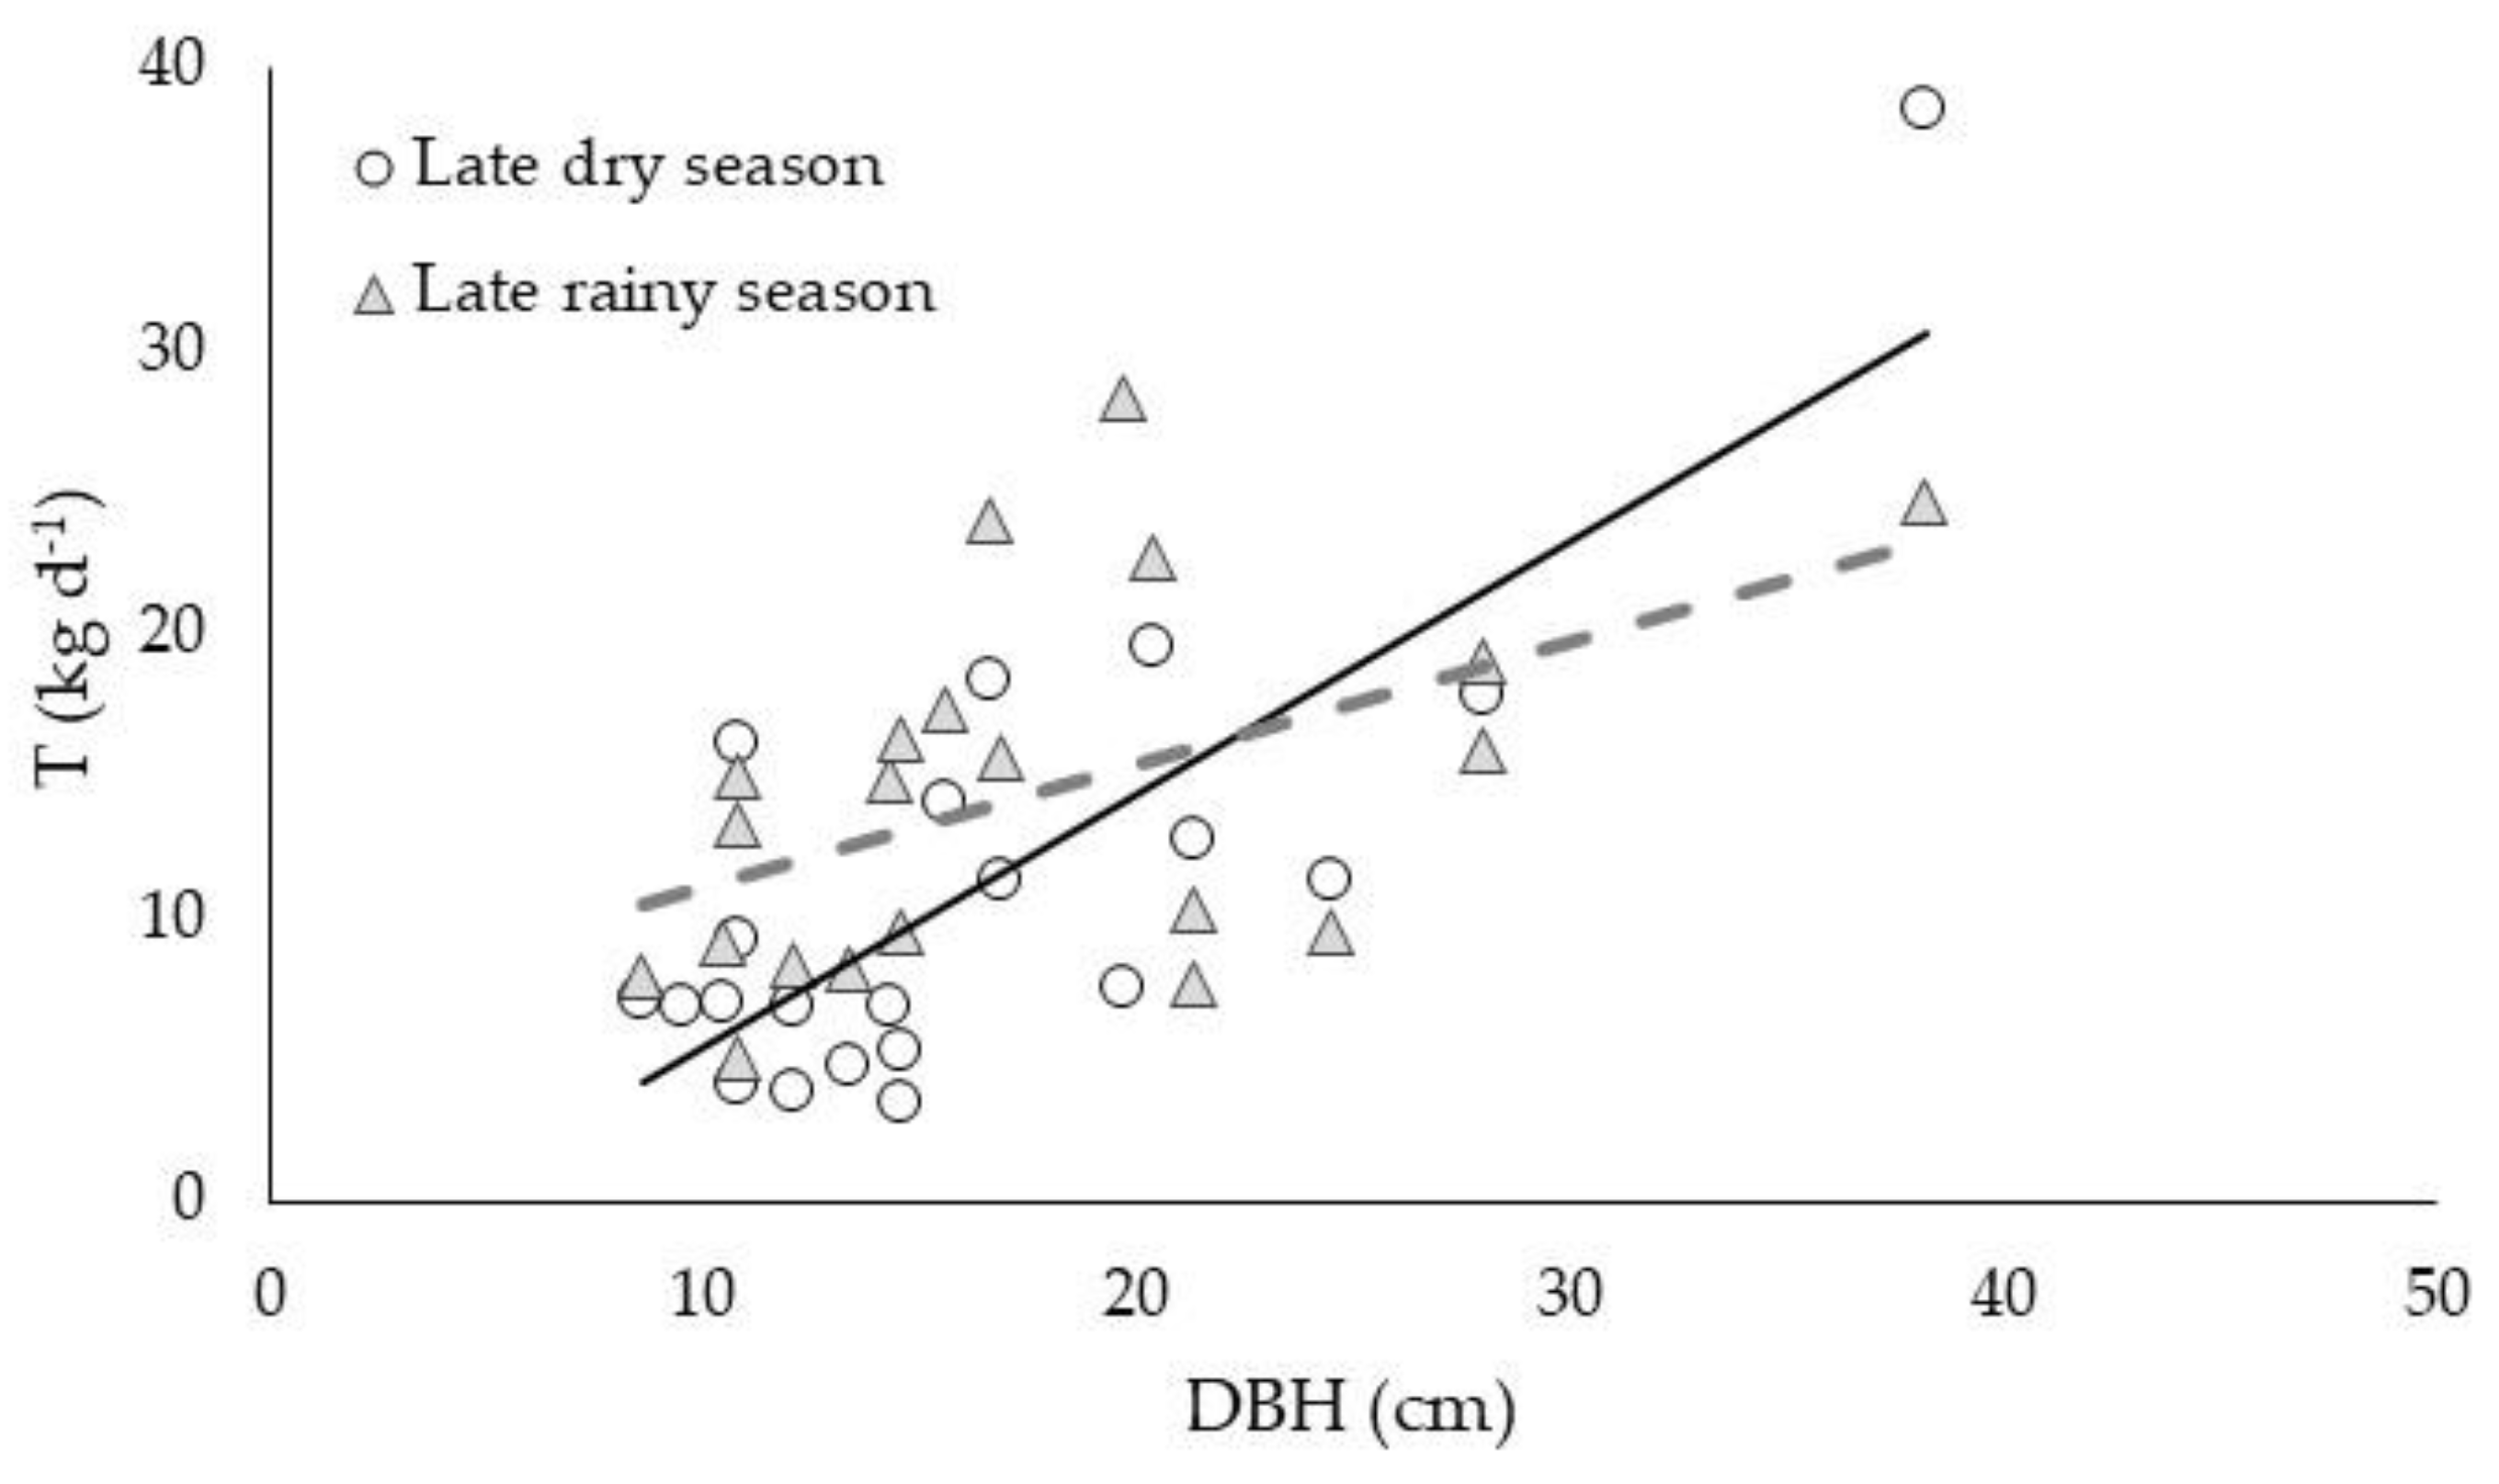
3.3. Allometric Relationships

We propose one empirical equation (linear regression) for each season to estimate the transpiration of the cluster as a characteristic of the tropical dry deciduous forest for the dry (Equation (7)) and rainy (Equation (8)) seasons (Figure 2),
T   ( kg   d 1 ) = 0.9004 × DBH   ( cm ) 3.478   ( r = 0.797 )
T   ( kg   d 1 ) = 0.4407 × DBH   ( cm ) 5.891   ( r = 0.573 )
These allometric relationships yielded an estimated daily mean transpiration of 0.654 kg m–2 d–1 for the late dry season and 1.14 kg m–2 d–1 for the late rainy season.

3.4. DBH Categories

The results of transpiration using the DBH categories produced estimated daily transpiration of 0.691 kg m–2 d–1 for the late dry season and 1.294 kg m–2 d–1 for the late rainy season (Table 3).

3.5. Stand Level

After substituting the transpiration and basal area values of each individual in the cluster in equation 6, stand transpiration was estimated as 0.562 (± 0.246) kg m–2 d–1 for the late dry season and 0.686 (± 0.262) kg m–2 d–1 for the late rainy season.

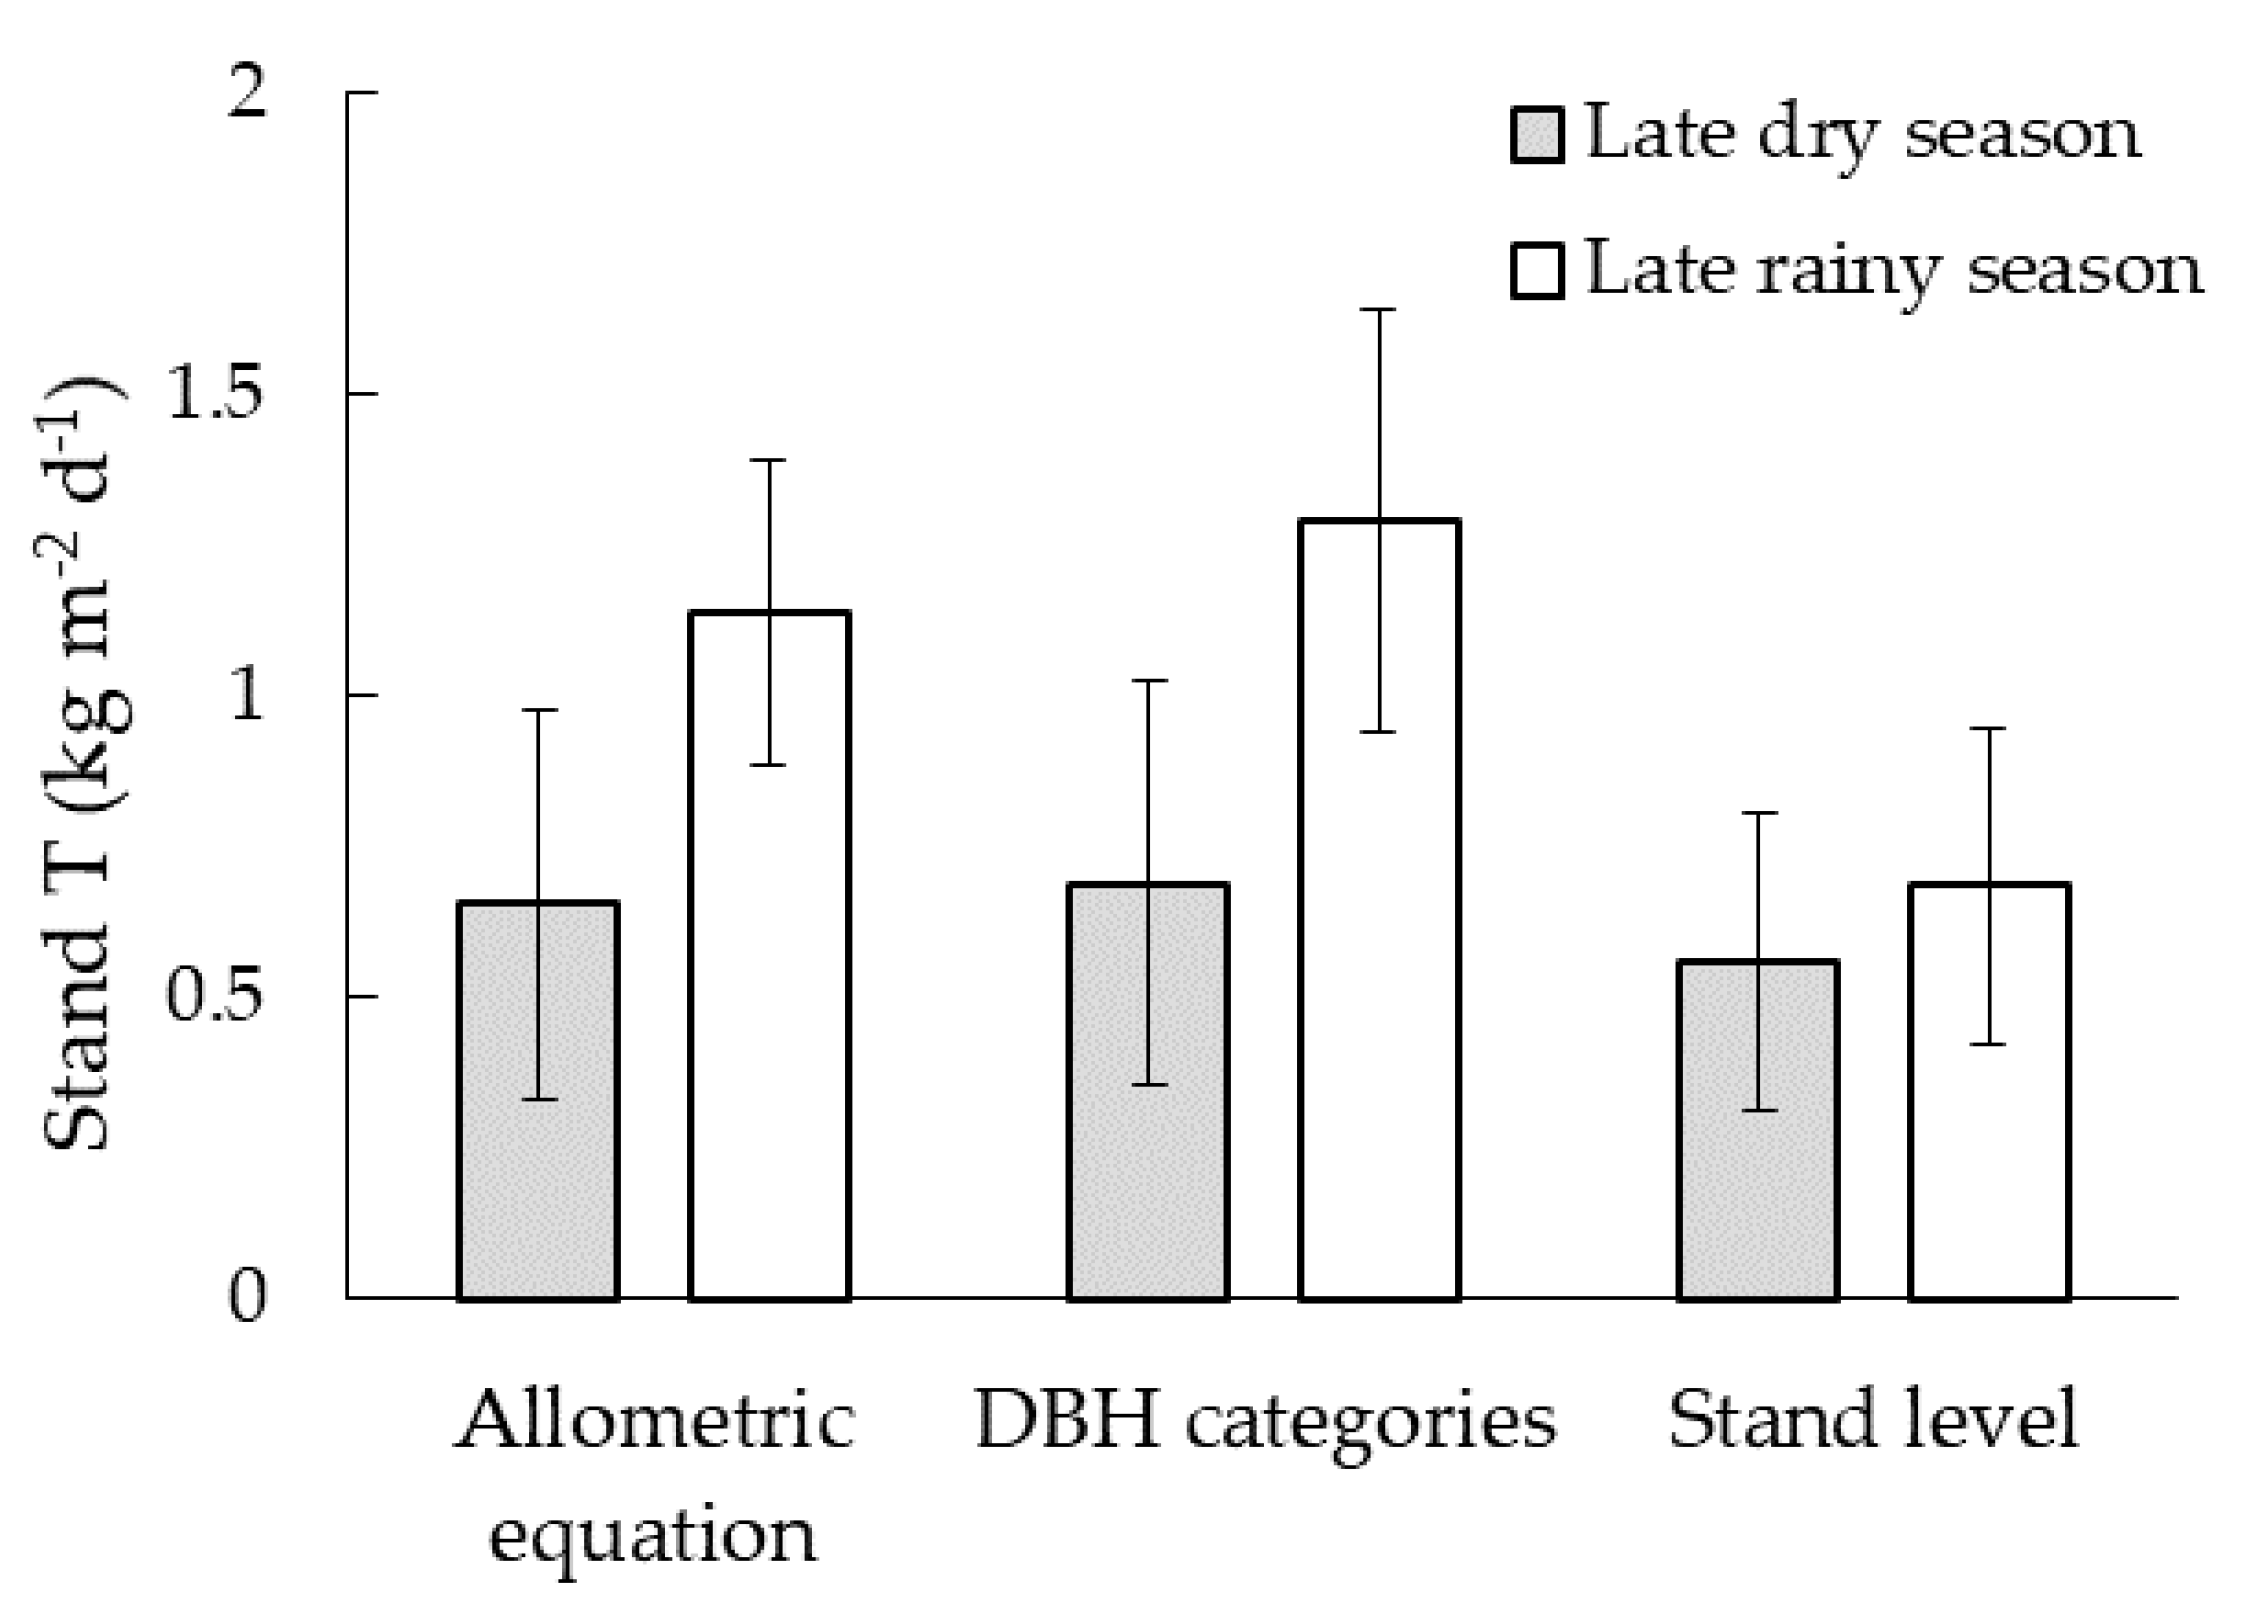
3.6. Comparison of Upscaling Methods

In summary, transpiration measured by the thermal dissipation method using Granier-type sensors and scaled up to the cluster studied yielded a transpiration value in the tropical dry deciduous forest at a stand level ranging from 0.562 to 0.691 kg m–2 d–1 in the late dry season (March–April), and from 0.686 to 1.294 kg m–2 d–1 in the late rainy season (September–October, Figure 3).

4. Discussion

The estimates reported in this work were obtained from a reasonable number of individuals (n = 39), which is larger than the number used in other studies [40,44,45,46]. Such results correspond to the end of the dry season and the end of the rainy season, when moisture and water availability are assumed to be close to the minimum and maximum, respectively, expected in a tropical dry deciduous forest in this area of the Yucatan Peninsula. The use of the diameter at breast height (DBH) and allometric equations to estimate transpiration has been explored and validated by several authors [23,47,48,49,50], improving our ability to calculate more accurate hydrological balances at the landscape or ecosystem levels from relatively simple field measurements. The use of a methodology from plant physiology studies to estimate transpiration in a region where the tropical dry deciduous forest covers 73% of the land surface [34] proved effective to determine transpiration as part of the hydrological cycle in basins covered by forests [23].
Studies on four common species living in tropical dry forests (Gymnopodium floribundum, Piscidia piscipula, Lysiloma latisiliquum, and Bursera simaruba [29]) reported sap flux values from 0.52 to 2.1 kg m–2 d–1, whereas León Palomo [30] reported estimated transpiration of 0.9 kg m–2 d–1 in a semi-deciduous tropical dry forest. Those estimates are consistent with our results. The main difference between these and the present study is the amount of precipitation recorded. According to Trejo [36], there is reduced transpiration in tropical dry forests in periods of low temperature and scarce precipitation, which was not the case in our study (maximum temperature was above the annual mean of 35 °C). In fact, transpiration is limited by precipitation in this dry ecosystem [51]. Sap flux is dominant during the sunny hours with a high vapor pressure deficit; however, sap flux also occurs at night, particularly under dry-air advection conditions [52]. In addition to precipitation, the variability in transpiration is driven by soil water availability [53], with less water available in the late dry season, as expected from lower soil water content. The amount of water available for individual trees will determine transpiration, which correlates better with tree size (DBH or basal area) than with tree species [25,45,49,54].
Concerning the variations in meteorological data and transpiration, we observed that even when VPD is higher in the late dry season, transpiration increases to the same extent, although it remained unchanged in some cases (refer to Table S1); nonetheless, stand-level estimates were indeed higher in the late rainy season. Together with higher VPD values, soil water availability (SWC) was lower than in the dry season, resulting in reduced transpiration. It is known that trees in tropical dry forests have water use strategies [55]; so, when water availability decreases, stomata are closed, and transpiration is reduced. In the late rainy season, SWC and transpiration increased as VPD decreased.
In 2019, the national meteorological services [56] indicated an abnormal-to-moderate drought in the Yucatan Peninsula, which meant less water available to be transpired by plants. Nonetheless, water was always available in soil in this area during our measurements in this work, which should have accounted for the water transpired, unless trees are tapping water from aquifers. Alterations in water availability as a result of climate change will modify ET, which will in turn impact water balance at regional and local levels [10].
In forests dominated by maple trees [45], adult trees take up two to five times more water than young trees, suggesting that tree age [57] and species composition influence the hydrological balance. This is particularly relevant in this study because species from seasonally dry forests have higher daily transpiration rates compared to other types of forests [58]. We observed that transpiration was dominated by trees measuring 8.6 to 18.8 cm in DBH, representing the category with the largest number of individuals. However, the highest transpiration rate (38.5 and 24.7 kg d–1) was observed in trees with a diameter greater than 29 cm. The calculated water use of Eucalyptus regnans at the plot-level scale with an allometric equation estimated a peak transpiration value of 3.1 kg m-2 d–1 [48]. The high volume reported may be due to the Eucalyptus trees studied being taller and with a greater DBH (thus, greater conductive area) than the individuals in the present study. Our results suggest that transpiration in the tropical dry deciduous forest of Yucatan responds to tree size. We did not address the influence of canopy size (or leaf-area index), an aspect that deserves further investigation.
Our estimated transpiration value is slightly lower than that recorded for the savanna vegetation in Brazil (0.8 kg m–2 d–1), calculated in the dry season for species of the families Nyctaginaceae, Leguminosae, Malpighiaceae, Bombacaceae, and Araliaceae [42]. Our results confirm that, despite the differences in species composition, tree transpiration is more closely related to the cross-sectional area of the stem than to the species; that is, forest transpiration was not species-specific [40].

Transpiration and Evapotranspiration

As already mentioned, evapotranspiration (ET) is the least-studied component of the water balance. Thus, any information produced regarding the water mobilized by plants to the atmosphere is relevant for improving the estimates of water availability under current and future climate scenarios. The daily mean ET for the El Palmar tropical dry forest was estimated at 3.32 (± 0.62) kg m–2 day–1 using MOD16 products [33,59]. The Eddy Covariance (EC) method offers the opportunity to generate continuous data on the vertical exchange of gases (including water vapor, i.e., ET) and energy between the ecosystem and the atmosphere, with footprints ranging from several square meters to several square kilometers and is the most direct and continuous method to estimate vertical fluxes in situ [14,60].
In the present study, sap flux measurements were performed in a surrounding area within the footprint of the El Palmar Eddy Covariance flux tower [32]. Unfortunately, during these measurements this EC flux tower had several issues in data acquisition, resulting in an ET time series with gaps. Using an ET time series spanning more than two years (December 2016–March 2019 and May 2019–August 2019), we resorted to MODIS products to estimate ET in the periods corresponding to the gaps in this study. MOD16 ET [61,62] yielded a good fit with data observed at various Eddy Covariance sites around the world, including the El Palmar tropical dry deciduous forest (R2 = 0.52, RMSE = 1.13 mm d–1, PBIAS = 3%) [15]. Using MOD16–ET [59] and the observed Eddy Covariance ET (EC–ET) [14], we produced the empirical equation 9:
EC ET = 1.06 × MOD 16 ET 0.20
Thus, ET for the El Palmar tropical dry deciduous forest was estimated at 1.35 (± 0.24) and 3.36 (± 0.35) kg m–2 day–1 for the late dry and late rainy seasons, respectively. Assuming these ET values, the present investigation found that transpiration represents between 20 and 51% of evapotranspiration (Table 4). We acknowledge that different methods have different uncertainty; however, performing direct measurements is key for the correct partition of ET (which can be derived from eddy covariance or remote sensing). Research is ongoing on the use of partitioning models to separate T from E acquired with eddy covariance; previous results yielded a 57% contribution from transpiration [16]. We assume that our estimates are the most accurate transpiration estimates to date for the tropical dry forest in this area of the Yucatan Peninsula. Our results differ from studies in tropical forests where transpiration makes a greater contribution to ET [21]. One likely reason is that in the Yucatan Peninsula, more rainwater evaporates, and less water reaches the soil; thus, transpiration is lower (i.e., reduced contribution to ET). Additionally, studies in tropical and subtropical forests [63,64] found that the understory accounted for 25–39% of water vapor fluxes. The tropical dry deciduous forest in Yucatan shows poorly defined strata, with the understory largely composed of young trees regenerating the forest. Nonetheless, these individuals, together with the herbaceous strata, might account for an additional contribution to transpiration in these ecosystems, yet to be quantified.
This ecosystem shows a marked seasonality, with two well-known periods of contrasting water availability (refer to Table 4 and Figure S1); in this study, observations were conducted in the late dry season (March–April) and the late rainy season (September–October). Using the Sisal Meteorological Station of the UNAM Network of Atmospheric Observatories (RUOA) at Sisal (Yucatan, Mexico), we observed that during the dry season, a total of 111 mm of precipitation was recorded over seven months, representing 30% of the total precipitation in 2019. On the other hand, 248 mm (70% of the total precipitation) were recorded over five months in the rainy season. As expected, T and ET show lower values in the late dry season than in the late rainy season due to reduced water availability. However, the T/ET ratios were higher in the driest conditions. This could be the result of increased water use efficiency in this ecosystem under low humidity conditions [32].

5. Conclusions

The easiest way to calculate transpiration in low deciduous forests is by measuring the diameter (DBH) of individual trees in the field, determining the area occupied by trees, and using the allometric equation presented herein. The El Palmar tropical dry deciduous forest, Yucatán, transpired around 0.56 kg of water m–2 d–1 in the late dry season (March–April) and nearly 1.29 kg of water m–2 d–1 in the late rainy season (September–October), accounting for up to 51% of ET. This work contributes to the understanding of the ecohydrological dynamics of tropical dry forests and provides direct measurements of tree transpiration, which should be considered and included in the hydrological balances determined or updated in the future. The interpretation of our results should not be restrained to the Yucatan Peninsula; they may be useful in other karstic areas of the world with shallow soils and rocky outcrops that limit root growth and enhance water infiltration.

Supplementary Materials

The following materials are available online at https://0-www-mdpi-com.brum.beds.ac.uk/article/10.3390/atmos13020271/s1, Table S1: Species-Transpiration, Table S2: Environmental Conditions; Supplementary Figure S1: Daily precipitation time series, Supplementary Figure S2: VPD, and temperature during the sap flux measurements period.

Author Contributions

Conceptualization, E.R.S.-A. and J.L.A.; methodology, E.R.S.-A., J.L.A., J.M.U.-S., and R.U.-S.; formal analysis, E.R.S.-A., J.L.A., J.M.U.-S., R.U.-S., and E.C.; resources, J.L.A. and E.C.; data curation, E.R.S.-A. and R.U.-S., writing—original draft preparation, E.C., J.L.A.; writing—review and editing, E.R.S.-A., J.A.P.-B., J.M.U.-S., and B.F.-E.; funding acquisition, E.C. and J.L.A. All authors have read and agreed to the published version of the manuscript.

Funding

E.R.S.-A received the scholarship CONACYT 849357; J.U.-S. received the CONACYT 2021 postdoctoral fellowship. This research was funded by CONACYT Ciencia Básica “Línea de agua meteórica de la península de Yucatán”, grant number 286049, and Cátedras CONACYT “Modelación del ciclo del agua en la península de Yucatán”, grant number 2944.

Data Availability Statement

The data presented in this study are openly available in the Institutional Repository of CICY at http://cicy.repositorioinstitucional.mx/jspui/handle/1003/1765 Accessed on 1 January 2022.

Acknowledgments

To the Plant Physiology Laboratory (Natural Resources Unit–CICY). Gerardo Carrillo, Casandra Reyes, Sandra Bucci, and Ping Lu, as well as the anonymous reviewers for their comments and suggestions. To Jose Luis Tapia and Filogonio May for their assistance in identifying plant species. To the organized groups of communal land at Ejido Hunucmá, Yucatán, and to the "Chencopo X’cancay” community for granting access to their land. María Elena Sánchez-Salazar edited the English manuscript.

Conflicts of Interest

The authors declare no conflict of interest. The funders had no role in the design of the study; in the collection, analyses, or interpretation of data; in the writing of the manuscript; or in the decision to publish the results.

References

  1. Healy, R.W.; Winter, T.C.; LaBaugh, J.W.; Franke, O.L. Water Budgets: Foundations for Effective Water-Resources and Environmental Management; US Geological Survey: Reston, VA, USA, 2007; Volume 1308.
  2. Bosch, J.M.; Hewlett, J.D. A review of catchment experiments to determine the effect of vegetation changes on water yield and evapotranspiration. J. Hydrol. 1982, 55, 3–23. [Google Scholar] [CrossRef]
  3. Oren, R.; Phillips, N.; Katul, G.; Ewers, B.; Pataki, D.E. Scaling xylem sap flux and soil water flux in forests. Ann. Sci. For. 1998, 55, 191–216. [Google Scholar] [CrossRef]
  4. Williams, D.G.; Cable, W.; Hultine, K.; Heodjes, J.C.B.; Yepez, E.A.; Simonneaux, V.; Er-Raki, S.; Boulet, G.; de Bruin, H.A.R.; Chehbouni, A.; et al. Evapotranspiration components determined by stable isotope, sap flow and eddy covariance techniques. Agric. For. Meteorol. 2004, 125, 241–258. [Google Scholar] [CrossRef]
  5. Oki, T.; Kanae, S. Global hydrological cycles and world water resources. Science 2006, 313, 1068–1072. [Google Scholar] [CrossRef] [PubMed] [Green Version]
  6. Drexler, J.Z.; Snyder, R.L.; Spano, D.; Paw, U.K.T. A review of models and micrometeorological methods used to estimate wetland evapotranspiration. Hydrol. Process. 2004, 18, 2071–2101. [Google Scholar] [CrossRef]
  7. Bolbotín-Nesvará, C.; Calera-Belmonte, A.; González-Piqueras, J.; Campos-Rodríguez, I.; López-González, M.L.; Torres-Prieto, E. Comparación de los sistemas covarianza y relación de Bowen en la evapotranspiración de un viñedo bajo clima semi-árido. Agrociencias 2011, 45, 87–103. [Google Scholar]
  8. Evett, S.R.; Kustas, W.P.; Gowda, P.H.; Anderson, M.C.; Prueger, J.H.; Howell, T.A. Overview of the bushland evapotranspiration and agricultural remote sensing experiment 2008 (BEAREX08): A field experiment evaluating methods for quantifying ET at multiple scales. Adv. Water Resour. 2012, 50, 4–19. [Google Scholar] [CrossRef]
  9. Rezaei, M.; Valipour, M.; Valipour, M. Modelling evapotranspiration to increase the accuracy of the estimations based on the climatic parameters. Water Conserv. Sci. Eng. 2016, 1, 197–207. [Google Scholar] [CrossRef] [Green Version]
  10. Kingston, D.G.; Todd, M.C.; Taylor, R.G.; Thompson, J.R.; Arnell, N.W. Uncertainty in the estimation of potential evapotranspiration under climate change. Geophys. Res. Lett. 2009, 36, L20403. [Google Scholar] [CrossRef] [Green Version]
  11. Mahrt, L. Flux Sampling Errors for Aircraft and Towers. J. Atmos. Ocean. Technol. 1998, 15, 416–429. [Google Scholar] [CrossRef]
  12. Deb Burman, P.K.; Sarma, D.; Morrison, R.; Karipot, A.; Chakraborty, S. Seasonal variation of evapotranspiration and its effect on the surface energy budget closure at a tropical forest over north-east India. J. Earth Syst. Sci. 2019, 128, 127. [Google Scholar] [CrossRef] [Green Version]
  13. Wilson, K.B.; Hanson, P.J.; Mulholland, P.J.; Baldocchi, D.D.; Wullschleger, S.D. A comparison of methods for determining forest evapotranspiration and its components: Sap-flow, soil water budget, eddy covariance and catchment water balance. Agric. For. Meteorol. 2001, 106, 153–168. [Google Scholar] [CrossRef]
  14. Burba, G. Eddy Covariance Method for Scientific, Industrial, Agricultural, and Regulatory Applications; LI-COR Biosciences: Lincoln, NE, USA, 2013; ISBN 978-0-615-76827-4. [Google Scholar]
  15. Gutierrez-Jurado, H.A.; Uuh-Sonda, J.M.; Méndez-Barroso, L.M.; Figueroa-Espinoza, B.; Yepez, E.A.; Rojas-Robles, N.E. Evapotranspiration partitioning of tropical deciduous forests of North America: A model-based comparison of two eddy-covariance sites with contrasting hydroclimatic regimes. In Proceedings of the AGU Fall Meeting 2021, New Orleans, LA, USA, 13-17 December 2021. [Google Scholar]
  16. Salazar-Martínez, D.; Holwerda, F.; Holmes, T.R.H.; Yépez, E.A. Evaluation of remote sensing-based evapotranspiration products at low-latitude eddy covariance sites. J. Hydrol. under review. 2022.
  17. Jasechko, S.; Sharp, Z.D.; Gibson, J.J.; Birks, S.J.; Yi, Y.; Fawcett, P.F. Terrestrial water fluxes dominated by transpiration. Nature 2013, 496, 347–350. [Google Scholar] [CrossRef]
  18. Nelson, J.A.; Pérez-Priego, O.; Zhou, S.; Poyatos, R.; Zhang, Y.; Blanken, P.D.; Gimeno, T.E.; Wohlfahrt, G.; Desai, A.R.; Gioli, B.; et al. Ecosystem transpiration and evaporation: Insights from three water flux partitioning methods across FLUXNET sites. Glob. Chang. Biol. 2020, 26, 6916–6930. [Google Scholar] [CrossRef]
  19. Tijerina, C.L. Uso Eficiente del Agua en Unidades de Riego Para el Desarrollo Rural. Diplomado; Colegio de Postgraduados: Montecillo, México, 1992. [Google Scholar]
  20. Huxman, T.E.; Wilcox, B.P.; Breshears, D.D.; Scott, R.L.; Snyder, K.A.; Small, E.E.; Hultine, K.; Pockman, W.T.; Robert, B. Ecohydrological implications of woody plant encroachment. Ecology 2005, 86, 308–319. [Google Scholar] [CrossRef]
  21. Casagrande, E.; Recanati, F.; Melià, P. Assessing the influence of vegetation on the water budget of tropical areas. IFAC-PapersOnLine 2018, 51, 1–6. [Google Scholar] [CrossRef]
  22. Jones, H. Radiation. In Plants and Microclimate: A Quantitative Approach to Environmental Plant Physiology; Cambridge University Press: Cambridge, UK, 2013; pp. 9–46. [Google Scholar]
  23. Wullschleger, S.D.; King, A.W. Radial variation in sap velocity as a function of stem diameter and sapwood thickness in yellow-poplar trees. Tree Physiol. 2000, 20, 511–518. [Google Scholar] [CrossRef] [PubMed] [Green Version]
  24. Granier, A. Evaluation of transpiration in a Douglas-fir stand by means of sap flow measurements. Tree Physiol. 1987, 3, 309–320. [Google Scholar] [CrossRef]
  25. Granier, A.; Biron, P.; Bréda, N.; Pontailler, J.-Y.; Saugier, B. Transpiration of trees and forest stands: Short and longterm monitoring using sap flow methods. Glob. Chang. Biol. 1996, 2, 265–274. [Google Scholar] [CrossRef]
  26. Gonzalez García, M.A.; Paz Gonzalez, A.; Castelao Gegunde, A. La medida térmica del flujo de savia aplicada al estudio de la extracción de agua por los arboles: Revisión bibliográfica y puesta a punto del método. Investig. Agrícola Sist. Recur. For. 1995, 4, 1–16. [Google Scholar]
  27. Lu, P.; Urban, L.; Zhao, P. Granier’s Thermal Dissipation Probe (TDP) method for measuring sap flow in trees: Theory and practic’. Acta Bot. Sin. 2004, 46, 631–646. [Google Scholar]
  28. Zhang, Z.; Tian, F.; Hu, H.; Yang, P. A comparison of methods for determining field evapotranspiration: Photosynthesis system, sap flow, and eddy covariance. Hydrol. Earth Syst. Sci. 2014, 18, 1053–1072. [Google Scholar] [CrossRef] [Green Version]
  29. Reyes-Garcia, C.; Andrade, J.L.; Sima, J.L.; Us-Santamarıa, R.; Jackson, P.C. Sapwood to heartwood ratio affects whole-tree water use in dry forest legume and non-legume trees. Trees 2012, 26, 1317–1330. [Google Scholar] [CrossRef]
  30. León Palomo, M.A. Flujo de Agua en Árboles de Una Selva Mediana Subcaducifolia en Yucatán, México. Bachelor’s Thesis, Instituto Tecnológico de Conkal, Conkal, Mexico, 2013. [Google Scholar]
  31. CONAGUA. Actualización de la Disponibilidad Media Anual de Agua en el Acuífero Península de Yucatán (3105), Estado de Yucatán’, Diario Oficial de la Federación. Available online: https://sigagis.conagua.gob.mx/gas1/Edos_Acuiferos_18/yucatan/DR_3105.pdf (accessed on 4 March 2020).
  32. Uuh-Sonda, J.M.; Figueroa-Espinoza, B.; Gutiérrez-Jurado, H.A.; Méndez-Barroso, L.A. Ecosystem productivity and evapotranspiration dynamics of a seasonally dry tropical forest of the Yucatan Peninsula. J. Geophys. Res. Biogeosci. 2019, 126, e2019JG005629. [Google Scholar] [CrossRef]
  33. Uuh-Sonda, J.M.; Gutiérrez-Jurado, H.A.; Figueroa-Espinoza, B.; Méndez-Barroso, L.A. On the ecohydrology of the Yucatan Peninsula: Evapotranspiration and carbon intake dynamics across an eco-climatic gradient. Hydrol. Process. 2018, 32, 2806–2828. [Google Scholar] [CrossRef]
  34. INEGI. Anuario Estadístico y Geográfico de Yucatán 2017; Instituto Nacional de Estadística y Geografía: Aguascalientes, México.
  35. Miranda, F.; Hernandez-Xolocotzi, E. Los Tipos de Vegetación de México y su Clasificación; Sociedad Botánica de México: Chapingo, México, 1963; p. 179. [Google Scholar]
  36. Trejo, I. Análisis de la diversidad de la selva baja caducifolia en México. In Sobre la Diversidad Biológica: El significado de las Diversidades alfa, beta y Gamma; m3m-Monografías 3ercer Milenio, vol. 4. SEA, CONABIO; Halffter, G., Soberón, J., Koleff, P., Melic., A., Eds.; Grupo DIVERSITAS & CONACYT: Zaragoza, España, 2005; pp. 111–122. [Google Scholar]
  37. Canche Escamilla, G. Uso de Biomasa Leñosa Como Biocomustible Sólido Para la Generación de Energía Eléctrica en Zonas Rurales; Informe Final Fondo sectorial CONACYT-Secretaría de Energía-Sustentabilidad Energética: Proyecto, México, 2019. [Google Scholar]
  38. Smith, D.M.; Allen, S.J. Measurement of sap flow in plant stems. J. Exp. Bot. 1996, 47, 1833–1844. [Google Scholar] [CrossRef] [Green Version]
  39. Meinzer, F.C.; Goldstein, G.; Andrade, J.L. Regulation of water flux through tropical forest canopy trees: Do universal rules apply? Tree Physiol. 2001, 21, 19–26. [Google Scholar] [CrossRef]
  40. Bucci, S.J.; Goldstein, G.; Meinzer, F.C.; Scholz, F.G.; Franco, A.C.; Bustamante, M. Functional convergence in hydraulic architecture and water relations of tropical savanna trees: From leaf to whole plant. Tree Physiol. 2004, 24, 891–899. [Google Scholar] [CrossRef] [Green Version]
  41. Andrade, J.L.; Meinzer, F.C.; Goldstein, G.; Schnitzer, S.A. Water uptake and transport in lianas co-occurring trees of a seasonally dry tropical forest. Trees 2005, 19, 282–289. [Google Scholar] [CrossRef]
  42. Bucci, S.J.; Scholz, F.G.; Goldstein, G.; Hoffmann, W.A.; Meinzer, F.C.; Franco, A.C.; Giambelluca, T.; Miralles-Wilhelm, F. Controls on stand transpiration and soil water utilization along a tree density gradient in a Neotropical savanna. Agric. For. Meteorol. 2008, 148, 839–849. [Google Scholar] [CrossRef]
  43. CONAFOR. Innovación Forest@l-Glosario. Available online: http://www.conafor.gob.mx/innovacion_forestal/?page_id=436 (accessed on 26 April 2021).
  44. Cochard, H.; Coll, L.; Le Roux, X.; Améglio, T. Unraveling the Effects of Plant Hydraulics on Stomatal Closure during Water Stress in Walnut. Plant Physiol. 2002, 128, 282–290. [Google Scholar] [CrossRef] [PubMed]
  45. Dawson, T.E. Determining water use by trees and forests from isotopic, energy balance and transpiration analyses: The roles of tree size and hydraulic lift. Tree Physiol. 1996, 16, 263–272. [Google Scholar] [CrossRef] [PubMed] [Green Version]
  46. López-López, R.; Ojeda-Bustamante, W.; López Andrade, A.P.; Catalán-Valencia, E.A. Heat Pulse Method and Sap Flow for Measuring Transpiration in Cacao. Rev. Chapingo-Ser. Zonas Áridas 2013, 12, 85–96. [Google Scholar] [CrossRef]
  47. Vertessy, R.A.; Benyon, R.G.; O´Sullivan, S.K.; Gribben, P.R. Relationships between stem diameter, sapwood area, leaf area and transpiration in a young mountain ash forest. Tree Physiol. 1995, 15, 559–567. [Google Scholar] [CrossRef]
  48. Vertessy, R.A.; Hatton, T.J.; Reece, P.; Sullivan, S.K.O.; Benyon, R.G. Estimating stand water use of large mountain ash trees and validation of the sap flow measurement technique. Tree Physiol. 1997, 19, 747–756. [Google Scholar] [CrossRef] [Green Version]
  49. Loustau, D.; Berbigier, P.; Roumagnac, P.; Arruda-Pacheco, C.; David, J.C.; Ferreira, M.I.; Pereira, J.S.; Tavares, R. Transpiration of a 64-year-old maritime pine stand in Portugal. Oecologia 1996, 107, 33–42. [Google Scholar] [CrossRef] [PubMed]
  50. Saugier, B.; Granier, A.; Pontailler, J.Y.; Dufrene, E.; Baldocchi, D.D. Transpiration of a boreal pine forest measured by branch bag, sap flow and micrometeorological methods. Tree Physiol. 1997, 17, 511–519. [Google Scholar] [CrossRef] [PubMed]
  51. Heilman, J.L.; Litvak, M.E.; McInnes, K.J.; Kjelgaard, J.F.; Kamps, R.H.; Schwinning, S. Water-storage capacity controls energy partitioning and water use in karst ecosystems on the Edwards Plateau, Texas. Ecohydrology 2014, 7, 127–138. [Google Scholar] [CrossRef]
  52. Green, S.R.; McNaughton, K.G.; Clothier, B.E. Observations of night-time water use in kiwifruit vines and apple trees. Agric. For. Meteorol. 1989, 48, 251–261. [Google Scholar] [CrossRef]
  53. Valdez-Hernández, M.; Andrade, J.L.; Jackson, P.C.; Rebolledo-Vieyra, M. Phenology of five tree species of a tropical dry forest in Yucatan, Mexico: Effects of environmental and physiological factors. Plant Soil 2010, 329, 155–171. [Google Scholar] [CrossRef]
  54. Goldstein, G.; Andrade, J.L.; Meinzer, F.C.; Holbrook, N.M.; Cavelier, J.; Jackson, P.; Celis, A. Stem water storage and diurnal patterns of water use in tropical forest canopy trees. Plant Cell Environ. 1998, 21, 397–406. [Google Scholar] [CrossRef]
  55. Werden, L.K.; Waring, B.G.; Smith-Martin, C.M.; Powers, J.S. Tropical dry forest trees and lianas differ in leaf economic spectrum traits but have overlapping water-use strategies. Tree Physiol. 2018, 38, 517–530. [Google Scholar] [CrossRef] [PubMed]
  56. Servicio Meteorológico Nacional. Monitor de Sequía. Available online: https://smn.conagua.gob.mx/es/climatologia/monitor-de-sequia/monitor-de-sequia-en-mexico (accessed on 20 February 2020).
  57. Niu, F.; Röll, A.; Meijide, A.; Hölscher, D. Rubber tree transpiration in the lowlands of Sumatra. Ecohydrology 2017, 10, e1882. [Google Scholar] [CrossRef]
  58. Tan, P.Y.; Wong, N.H.; Tan, C.L.; Jusuf, S.K.; Schmiele, K.; Chiam, Z.Q. Transpiration and cooling potential of tropical urban trees from different native habitats. Sci. Total Environ. 2020, 705, 135764. [Google Scholar] [CrossRef]
  59. Running, S.; Mu, Q.; Zhao, M. MOD16A3 MODIS/Terra Net Evapotranspiration Yearly L4 Global 500m SIN Grid V006 [Data Set]. NASA EOSDIS Land Processes DAAC. Available online: https://0-doi-org.brum.beds.ac.uk/10.5067/MODIS/MOD16A3.006 (accessed on 10 July 2021).
  60. Baldocchi, D.D. Assessing the eddy covariance technique for evaluating carbon dioxide exchange rates of ecosystems: Past, present and future. Glob. Chang. Biology 2003, 9, 479–492. [Google Scholar] [CrossRef] [Green Version]
  61. Mu, Q.; Heinsch, F.A.; Zhao, M.; Running, S.W. Development of a global evapotranspiration algorithm based on MODIS and global meteorology data. Remote Sens. Environ. 2007, 111, 519–536. [Google Scholar] [CrossRef]
  62. Mu, Q.; Zhao, M.; Running, S.W. Improvements to a MODIS global terrestrial evapotranspiration algorithm. Remote Sens. Environ. 2011, 115, 1781–1800. [Google Scholar] [CrossRef]
  63. Terminel, M.L.V.; Yépez, E.A.; Tarín, T.; Zazueta, C.A.R.; Payan, J.G.; Rodríguez, J.C.; Watts, C.J.; Vivoni, E.R. Understory contribution to water vapor and CO2 fluxes from a subtropical shrubland in northwestern Mexico. Tecnol. Cienc. Agua 2020, 11, 130–170. [Google Scholar] [CrossRef]
  64. Iida, S.I.; Shimizu, T.; Tamai, K.; Kabeya, N.; Shimizu, A.; Ito, E.; Ohnuki, Y.; Chann, S.; Levia, D.F. Evapotranspiration from the understory of a tropical dry deciduous forest in Cambodia. Agric. For. Meteorol. 2020, 295, 108170. [Google Scholar] [CrossRef]
Figure 1. Map showing the location of the study area. EC – Eddy covariance flux tower.
Atmosphere 13 00271 g001
Figure 2. Allometric relationship of diameter at breast height (DBH) versus daily mean transpiration (T) estimates (kg water d–1). Late dry season (solid line, open circles) correspond to March–April; late rainy season (dashed line, closed triangles), to September–October.
Atmosphere 13 00271 g002
Figure 3. Summary of stand transpiration (kg water m–2 d–1) in the tropical dry deciduous forest at El Palmar, Yucatan, Mexico, using three methods. The late dry season corresponds to March–April; the late rainy season, to September–October 2019. Error bars ± 1 s.d.
Atmosphere 13 00271 g003
Table 1. Tree species selected to estimate transpiration and the importance value index (IVI) in the El Palmar tropical dry deciduous forest, Yucatan, Mexico. The species listed represent almost 193%; other species not listed here would account for the remaining 107%.
SpeciesFamilyndrynrainyIVI (%)
Caesalpinia sp.
Bursera simaruba (L.) Sarg.
Lysiloma latisiliquum (L.) Benth.
Fabaceae1
Burseraceae3349.62
Fabaceae2335.41
Gymnopodium floribundum Rolfe
Caesalpinia gaumeri Greenm.
Polygonaceae3325.4
Fabaceae2222.98
Havardia albicans (Kunth) Britton & Rose
Neea choriophylla Standl.
Piscidia piscipula (L.) Sarg.
Cordia gerascanthus L.
Fabaceae2215.33
Nyctiginaceae2111.96
Fabaceae1110.12
Cordiaceae119.38
Plumeria obtusa L.
Erythroxylum rotundifolium Lunan
Apocynaceae227.49
Erythroxylaceae115.17
TOTAL 2019192.86
Table 2. Analysis of variance of temperature, radiation, relative humidity, and vapor pressure deficit in a tropical dry deciduous forest in El Palmar State Reserve, Yucatan, Mexico. March and April represent the late dry season; September and October, the late rainy season. Different letters (a, b, c) mark significant differences in the months of sap-flux data acquisition (post-hoc Tukey-Kramer HSD, α = 0.01).
Month Temperature (°C)Relative
Humidity
(RH)
(%)
Maximum Solar Radiation
(W m–2)
Vapor Pressure
Deficit
(kPa)
March24.7 ± 2.6 (a)75.5 ± 12.3 (a)1045.30.68 ± 0.41 (a)
April26.2 ± 2.9 (b)74.2 ± 13.5 (a)1082.00.76 ± 0.47 (b)
September27.4 ± 1.8 (c)84.4 ± 7.2 (b)1041.10.47 ± 0.24 (c)
October27.5 ± 2.0 (c)84.1 ± 8.7 (b)993.50.49 ± 0.30 (c)
ANOVAF = 202.2
p < 0.0001
F = 167.6
p < 0.0001
F = 2.4799
p = 0.0594
F = 97.006
p < 0.0001
Table 3. Estimated transpiration in the tropical dry deciduous forest using DBH categories (TDBH), cluster transpiration (TCluster), and estimated aerial transpiration (kg m–2 d–1). N is the number of trees in the cluster. Cluster area: 2200 m2. The late dry season corresponds to March–April; the late rainy season, to September–October 2019.
Season DBH (cm)TDBH (kg d-1)N (Cluster)TCluster (kg d–1)T (kg m–2 d–1)
Late dry season5 – 8.52.55 ± 1.0986219.30 ± 93.740.100 ± 0.043
8.6 – 18.88.44 ± 4.94102860.88 ± 503.880.391 ± 0.229
18.9 – 2914.5 ± 5.5125362.50 ± 137.750.165 ± 0.063
>2938.5 ± 2.2277 ± 4.40.035 ± 0.020
2151519.68 ± 739.770.691 ± 0.336
Late rainy season5 – 8.59.72 ± 0.5386835.92 ± 45.580.380 ± 0.021
8.6 – 18.814.5 ± 5.511021479 ± 562.020.672 ± 0.255
18.9 – 2919.26 ± 6.8325481.50 ± 170.750.219 ± 0.078
>2924.7 ± 4.3249.40 ± 8.60.022 ± 0.004
2152845.82 ± 784.951.294 ± 0.350
Table 4. Estimated ET (kg m–2 d–1) using the MOD16–ET T/ET ratio in the El Palmar tropical dry deciduous forest using allometric relationships, DBH categories (TDBH), and stand-level transpiration. The late dry season corresponds to March–April; the late rainy season, to September–October 2019. The cumulative seasonal precipitation (mm) for the dry season (November–May) and the rainy season (June–October) are also shown.
Season MODIS–Estimated Daily Average ET (kg m–2 d–1) Daily Average T/ET
Allometric Relationships
Daily Average
T/ETDBH Categories
Daily Average T/ET
Stand Level
Seasonal Precipitation (mm)
Late dry season1.35 ± 0.240.480.510.42111
Late rainy season3.36 ± 0.350.340.380.20248
Publisher’s Note: MDPI stays neutral with regard to jurisdictional claims in published maps and institutional affiliations.

